are we still cooking with gas? - aie · are we still cooking with gas? ... that gas is sold in to...
TRANSCRIPT

Are we still Cooking with Gas? An Analysis of Cost Effective Residential Energy Options
Report by the Alternative Technology Association

Who is ATA?

10,000 copies sold per issue estimated 65,000 readers published since 1980
quarterly – 40,000 readers around 3,000 subscribers
17,000 distributed
ATA Publications
International Projects
ATA - Energy Management at Home

What’s the Problem?
AECOM, 2012

“Household gas prices have already risen 33 per cent in real terms since 2008-09, largely unnoticed because all the attention has been on the more rapid growth in electricity prices over the same period (53 per cent).”
Victorian Council of Social Service
What’s the Problem?

What’s the Solution?
“We need both a growing LNG export industry and a diverse industry base with a strong
manufacturing sector. We need action on two fronts — get more gas flowing, by replacing
blanket bans on gas production with strong but workable regulation; and reform the market that gas is sold in to boost competition and
transparency.” Chief Executive, Ai Group

At the same time....
...electric technologies are becoming more and
more efficient

...so what about the demand-side?
Little substantial analysis has been done
that considers the economics for small
energy consumers

ATA Report: Are we still Cooking with Gas?
Economic modelling & research
Funded by the Consumer Advocacy Panel
Project Objective: To understand the impact of retail gas price rises on
small consumers and to identify cost effective alternatives,
where they may exist.

Gas Zones Modelled
13x VIC
1x SA 8x NSW
1x ACT
2x QLD
1x TAS 26 Gas Zones in total
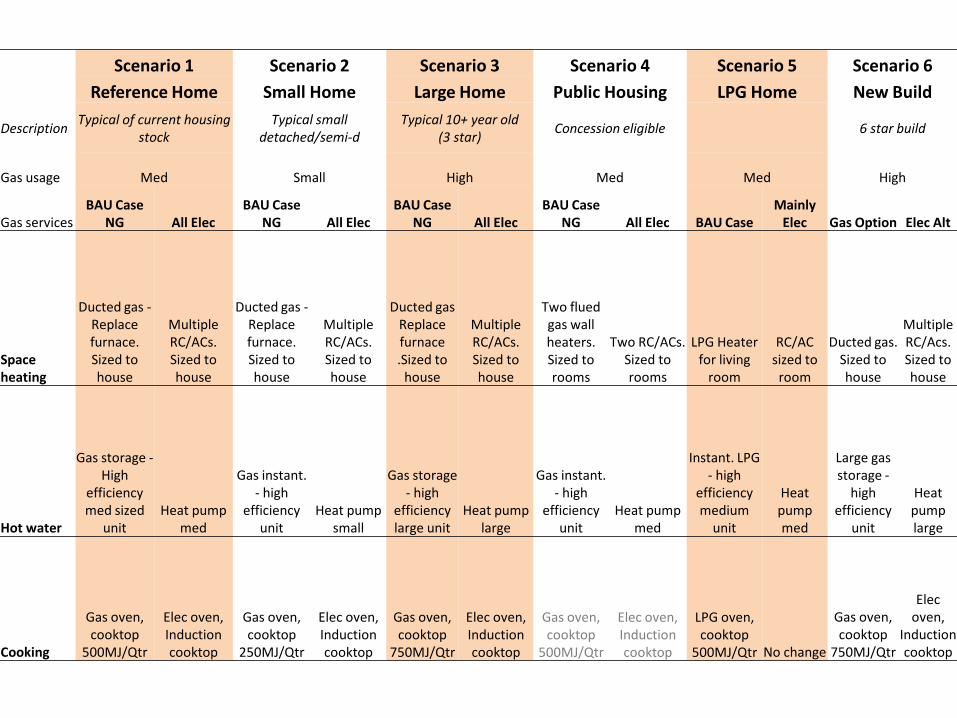
Scenario 1 Scenario 2 Scenario 3 Scenario 4 Scenario 5 Scenario 6 Reference Home Small Home Large Home Public Housing LPG Home New Build
Description Typical of current housing stock
Typical small detached/semi-d
Typical 10+ year old (3 star) Concession eligible 6 star build
Gas usage Med Small High Med Med High
Gas services BAU Case
NG All Elec BAU Case
NG All Elec BAU Case
NG All Elec BAU Case
NG All Elec BAU Case Mainly
Elec Gas Option Elec Alt
Space heating
Ducted gas - Replace furnace. Sized to house
Multiple RC/ACs. Sized to house
Ducted gas - Replace furnace. Sized to house
Multiple RC/ACs. Sized to house
Ducted gas Replace furnace .Sized to
house
Multiple RC/ACs. Sized to house
Two flued gas wall heaters. Sized to rooms
Two RC/ACs. Sized to rooms
LPG Heater for living
room
RC/AC sized to room
Ducted gas. Sized to house
Multiple RC/Acs. Sized to house
Hot water
Gas storage - High
efficiency med sized
unit Heat pump
med
Gas instant. - high
efficiency unit
Heat pump small
Gas storage - high
efficiency large unit
Heat pump large
Gas instant. - high
efficiency unit
Heat pump med
Instant. LPG - high
efficiency medium
unit
Heat pump med
Large gas storage -
high efficiency
unit
Heat pump large
Cooking
Gas oven, cooktop
500MJ/Qtr
Elec oven, Induction cooktop
Gas oven, cooktop
250MJ/Qtr
Elec oven, Induction cooktop
Gas oven, cooktop
750MJ/Qtr
Elec oven, Induction cooktop
Gas oven, cooktop
500MJ/Qtr
Elec oven, Induction cooktop
LPG oven, cooktop
500MJ/Qtr No change
Gas oven, cooktop
750MJ/Qtr
Elec oven,
Induction cooktop

No. Replacement Cases Capital Cost Assumptions
1 Switching a gas appliance, within 5 years of end of life, staying on gas network Gas & Electric
2 Switching a gas appliance, not within 5 years of end of life, staying on gas network Electric Only
3 Switching one gas appliance, of any age, disconnecting from gas network Electric Only
4 Switching two gas appliances, at least one is within 5 years of end of life, disconnecting from gas network 1 Gas & 2 Electric
5 New & existing homes, not currently gas connected, choosing efficient electric instead of gas 3 Gas & 3 Electric
6 All gas appliances switched: one is within 5 years of end of asset life, avoiding $2,000 replacement capex 1 Gas & 3 Electric

Model Outputs: Gas Zone: Envestra Mildura Electricity Zone: Powercor
Example Location: Mildura, 3500, VIC Climate Zone: Balanced Moderate Demand
Household Scenario Ref home Small home Large home Public housing LPG home New build
Switching a gas appliance, within 5 years of end of life, staying on gas network
Space Heating $3,831 $3,179 $4,769 $2,681 $2,188 $4,046
Hot Water -$23 -$803 $105 -$264 $1,820 $477
Cooking -$161 -$122 -$330 -$103 n/a -$330
Switching a gas appliance, not within 5 years of end of life, staying on gas network
Space Heating $1,031 $979 $1,369 -$319 $688 n/a
Hot Water -$1,523 -$2,003 -$1,695 -$1,464 $620 n/a
Cooking -$1,961 -$1,922 -$2,130 -$1,903 n/a n/a
Switching one gas appliance, of any age, disconnecting from gas network
Space Heating $4,697 $3,926 $5,610 $2,426 n/a n/a
Hot Water $2,032 $925 $2,603 $1,301 n/a n/a
Cooking $533 $517 $549 $198 n/a n/a
Switching two gas appliances, at least one is within 5 years of end of life, disconnecting from gas network
Space Heating + Cooking $5,647 $4,259 $7,176 $3,624 n/a n/a
Hot Water+ Cooking $1,681 $258 $2,569 $699 n/a n/a
New & existing homes, not currently gas connected, choosing efficient electric instead of gas*
All Heating & Cooking $7,179 $4,655 $9,231 $4,854 $6,376 $8,169
* Assumes full CAPEX on both electric and gas sides.

Ahh, how did you arrive at that?

Cooking

CUAC (2013) reported average is 500MJ/Qtr.
High, medium and low: +/- 50% Assumed 60% used on cooktop / 40% oven
Energy input * efficiency at point of use = energy output
Efficiency at point of use:
Gas Electric
Gas ring 40% Induction 80%
Oven 7% Oven 14%
Sources: Choice, BZE, US Dept of Energy….
Cooking – Energy Loads

CAPEX: gas cooktops and ovens – sample of 34; electric cooktops and ovens – sample of 32.
Added installation cost.
Maintenance costs from survey: no results for induction. Assume it would prove to be the same as gas
Cooking – Installed CAPEX and OPEX

Water Heating

Energy loads drawn from published data/modelling: Gas HW: EnergyConsult for SV (2009) Gas storage (5 Stars) / Instantaneous (5 Stars)
Zones 3 & 4
Heat Pump HW: Pitt & Sherry (2012) modelled small/medium/large HPWH systems across 10 locations (Zones 1 – 5)
Water Heating Loads
Aust Water Heating Climate Zones

HW Capex & Opex
Gas capex taken from a sample of 28 available models
HPHW capex taken from sample of 16 available models maintenance costs taken from manufacturer/other industry data
Solar hot water was considered: difficult to compete ($) with HPHW – additional capital cost
Small Electric Resistance HW also modelled: 15c/kWh off-peak tariff; apartment blocks etc

Space Heating

Drew upon BZE1 heat load modelling
Included a single ‘Reference Home’ 3-bed, single storey, detached dwelling
Variations based on orientation & building construction
Common floor plan:
How to Model Space Heating?
1ZCA Buildings Plan

House Type Wall Construction Floor Construction
1 Weatherboard Timber
2 Weatherboard Concrete Slab
3 Brick Veneer Timber
4 Brick Veneer Concrete Slab
5 Cavity Brick Timber
6 Cavity Brick Concrete Slab
Representative construction types chosen by location
Home Modification levels modelled by BZE:
‘Level 2’ used for ATA Existing Home Scenarios:
(R2.5 ceiling insulation, representative of 2 Star building stock)
‘Level 4’ or NatHERS 6 Star used for ATA New Home Scenarios
How to Model Space Heating?
*NatHERS energy loads combine heating & cooling requirements *BZE just defined heating

Heat Load by Climate/Location (MJ/m2/annum)
Climate Type City Scenario 1-5 Scenario 6: New Build
Balanced Moderate Demand Adelaide 112.8 56.8
Balanced Moderate Demand Sydney 78.3 35.9
Heating Dominated Tullamarine 268.8 197.0
Heating Dominated Melbourne 242.4 114.0
Heating Dominated High Demand Canberra 321.0 165.0
Heating Dominated High Demand Orange 438.4 219.0
Low Demand Brisbane 38.9 15.2

Reviewed 35 small-med & 28 large RCACs:
average price of 6 cheapest/CoP models
Large Unit: CoP 4.0; Capex $2,600
Small/Medium Unit: CoP 4.5; Capex $1,850
Maintenance costs drawn from ATA
member/public survey
CoP penalties (0.5) for ‘Heating Dominated’, ‘High
Demand’ climate zones
RCAC Capex & Efficiency

Heated Rooms/Area + RCACs (per Household Scenario)
Scenario 1: Reference
Home
Scenario 2: Small House
Scenario 3: Large House
Scenario 4: Public
Housing
Scenario 5: LPG House
Scenario 6: New Build
(6 Star)
Total Heated Area (m2) 120 70 160 70 40 160
No. Rooms to be Heated Up to 6 Up to 4 Up to 8 Up to 4 Up to 2 Up to 8
No. 7.0kW Systems 1 1 2 1 1 2
No. 3.0kW Systems 2 1 2 1 - 2
Zoning assumptions: primary RCAC on 100% of heating hours second RCAC on 90% of heating hours third & subsequent RCAC on 50% of heating hours

RCAC Annual Energy Use (by Climate Zone and by Household Scenario)
Climate Location
Scen
ario
1:
Re
fere
nce
Hom
e
Scen
ario
2:
Smal
l Hou
se
Scen
ario
3:
La
rge
Hou
se
Scen
ario
4:
Publ
ic H
ousi
ng
Scen
ario
5:
LP
G H
ouse
Scen
ario
6:
N
ew B
uild
(6 S
tar)
Balanced Moderate Demand Adelaide 703 418 873 418 313 440
Balanced Moderate Demand Sydney 488 290 607 290 218 278
Heating Dominated Melbourne 1,512 898 1,878 898 673 883
Heating Dominated Tullamarine 1,899 1,133 2,368 1,133 853 1,735
Heating dominated High Demand Canberra 2,267 1,353 2,828 1,353 1,019 1,454
Heating dominated High Demand Orange 3,096 1,848 3,862 1,848 1,392 1,929
Low Demand Brisbane 242 144 301 144 108 117

Utilised same MJ/m2 heating loads
Burner efficiencies applied for ducted/wall furnace systems (EnergyConsult, BZE data) Ducting system losses Industry sales data (representative burner size)
Electricity usage of fans included
Excluded thermostat & controller loads (immaterial)
Capital costs taken from a sample of 22 available models maintenance costs taken from ATA/public survey
Gas Energy Loads – Space Heating
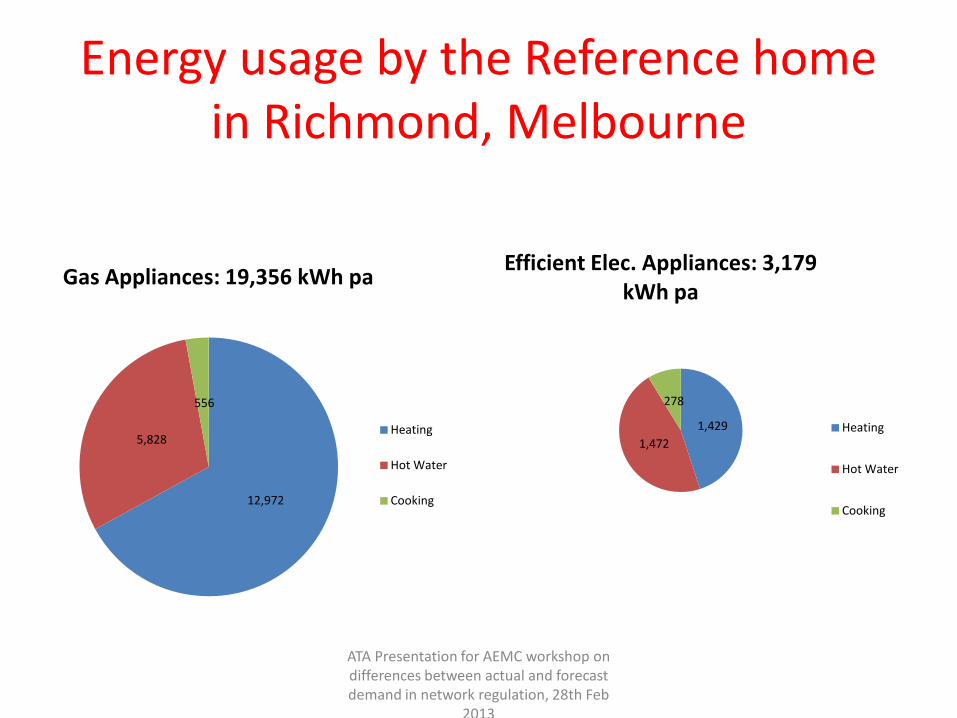
Energy usage by the Reference home in Richmond, Melbourne
ATA Presentation for AEMC workshop on differences between actual and forecast demand in network regulation, 28th Feb
2013
12,972
5,828
556
Gas Appliances: 19,356 kWh pa
Heating
Hot Water
Cooking
1,429 1,472
278
Efficient Elec. Appliances: 3,179 kWh pa
Heating
Hot Water
Cooking

Energy Prices

Gas Price Trajectory: Base (Medium) Case
0.90
0.95
1.00
1.05
1.10
1.15
1.20
1.25
1.30
14 15 16 17 18 19 20 21 22 23
Gas Bills Projected Trajectory (real)
NSW
VIC
Qld
SA
ACT
Tas

Gas prices selected as at 1 Jan 2014 VIC: gazetted ‘Standing Offers’ competitive tariffs found using ‘tertiles of gas usage’ (AGL) applied in the St Vinnies ‘Tariff Tracker’ tool
NSW: St Vinnies ‘Tariff Tracker’ tool SA: only Origin has Standing Offers (little variation across gas zones QLD: average of the only 2 gas retailers ACT: only 1 gas retailer with Standing Offer TAS: 2 retailers, 50/50 market share – Tariff 31 used
All Adjusted for Carbon Tax Repeal (July, 2014) Scheduled Price Rises included: e.g. NSW IPART 17% increase July 2014
Trajectory – CUAC ‘Making the Gas Connection’ doubling wholesale price; 20-25% retail increase by 2020
Gas Prices & Price Trajectory

Gas Price Trajectories: Sensitivity (VIC & NSW)
0.90
1.00
1.10
1.20
1.30
1.40
1.50
1.60
14 15 16 17 18 19 20 21 22 23
Medium
High
Low
0.90
1.00
1.10
1.20
1.30
1.40
1.50
14 15 16 17 18 19 20 21 22 23
Medium
High
Low
Year Medium High Low
2014 1.00 1.00 1.00
2015 1.02 1.02 1.02
2016 1.09 1.09 1.05
2017 1.14 1.22 1.05
2018 1.20 1.35 1.05
2019 1.20 1.41 1.05
2020 1.20 1.48 1.05
By 2020 20% 48% 5%
Year Medium High Low
2014 1.00 1.00 1.00 2015 1.10 1.10 1.10 2016 1.16 1.16 1.16 2017 1.21 1.21 1.16 2018 1.27 1.27 1.16 2019 1.27 1.33 1.16 2020 1.27 1.40 1.16 2021 1.27 1.47 1.16
By 2021 27% 47% 16%
VIC
NSW

Electricity Price Trajectory: Base (Medium) Case
0.90
0.92
0.94
0.96
0.98
1.00
1.02
14 15 16 17 18 19 20 21 22 23
Electricity Price Trajectory (real)
NSW
VIC
Qld
SA
ACT
Tas
AEMC Residential Electricity Price Trends, Dec 2013

Relative Cost of Gas v Electricity
0.00 0.20 0.40 0.60
VIC Warburton VIC Pakenham
NSW Wagga Wagga VIC Geelong VIC Box Hill
VIC Shepparton VIC Portland
VIC Footscray VIC Dandenong
VIC Richmond VIC Winchelsea
NSW Orange NSW Cooma
NSW Goulburn VIC Cobram NSW Tumut
SA Marion VIC Bairnsdale
NSW Nowra NSW Hurstville
QLD Helensvale VIC Mildura
NSW Tamworth ACT Canberra
QLD Chermside TAS North Hobart
Cost of gas v/s electricity, 2014
Variable cost of gas c/MJ * 3.6 (to kWh) / Variable cost of electricity c/kWh
The relative cost of gas v electricity in each gas zone
was important to the overall economics of the
case for switching

Findings

Findings – New & All-Electric Homes
1. It is not cost effective to connect a new home / existing all-electric home to mains gas when efficient electric appliances are an option (all gas zones)
2. Connecting an existing all-electric home to mains gas may be cost effective when the cost of new appliances is subsidised

Findings – Dual Fuel Homes
The case for dual-fuel homes to replace some / all their appliances with efficient electric is dependent on multiple factors: Age or condition of the existing gas appliance Whether the replacement allows the customer to disconnect from the gas Whether the household is able to install efficient electric appliances Whether the existing gas supply is mains or bottled gas The marginal cost of gas on a declining block tariff Climate Ratio of gas to electricity price

Findings – Dual Fuel Homes
1. Cost effective to replace gas heaters with multiple RCACs 2. In warmer climates (SA, QLD & parts NSW), switching all gas appliances
to electric and disconnecting offers better economic returns than cooler climates
3. Heat pump HW only cost effective where the relative price of gas (versus electricity) is higher; or where the climate is warmer
4. Switching from gas to induction cook tops/electric ovens is only cost effective (on its own) when avoiding high fixed charges
5. Customers in new gas zones pay more for gas

Questions?