are the benefits from export support durable? evidence ... · are the benefits from export support...
TRANSCRIPT
Are the Benefits from Export Support Durable? Evidence from Tunisia
Olivier CadotUniversity of Lausanne and CEPR
Ana M. FernandesThe World Bank
Julien GourdonCEPII
Aaditya MattooThe World Bank
Second Annual IMF/World Bank/WTO Trade WorkshopJune 5-6, 2013
Geneva

Why evaluate? What do we know?
Shift from trade policy reforms to more targeted interventions aimedat reducing trade costs and addressing market failures that inhibitexports
• Significant resources are now devoted to trade facilitation and exportpromotion by country governments and international institutions
• Cross-country and micro-level evidence on export promotion:• On the effects on aggregate export performance: e.g., Rose (2007), Lederman et
al. (2010)
• Analysis at firm-level using quasi-experimental methods: e.g., Görg et al. (2008),Volpe and Carballo (2008, 2010), Girma et al. (2009)
• Findings so far:o Export promotion agencies are more efficient than in past in raising exports
o Export promotion works better with established exporters
o Export promotion has more impact at the extensive margin within firms

This paperWhat we do
• We evaluate the impact of an export support program – the FAMEXmatching grant scheme – in Tunisia over the period 2004-2010 usingfirm-level data and quasi-experimental econometric techniques
Our contribution
• In addition to short-term effects we can estimate longer-term effects
• Longer-term effects allow to examine durability, volatility, and spillovers
What we find
• FAMEX has a stronger and more durable effect on firms’ exports at theextensive margin (destination and product growth) than at the intensivemargin (total export growth)
• FAMEX-driven diversification does not translate into lower exportvolatility
• No evidence of positive spillovers from FAMEX firms to control firms

Export promotion in Tunisia• Tunisia’s Export Development Project - of which FAMEX is part - was co-
financed by the World Bank and the Ministry of Trade with the objective offostering the export competitiveness of Tunisian firms
• The FAMEX program provided matching grants to co-finance 50% of firms’export business plans (up to TND 100,000) on a demand-driven basis
• In the application package, Tunisian firms need to state one objective forapplying for FAMEX assistance:
(i) become a significant exporter (31%)
(ii) export to new destinations (49%)
(iii) export new products (20%)
• FAMEX received 1,710 applications, accepted plans from 1,060 firms
• After dropping firms with ongoing plans at the end of 2009 and servicesfirms our sample includes
455 FAMEX beneficiaries with completed programs at end of 2009
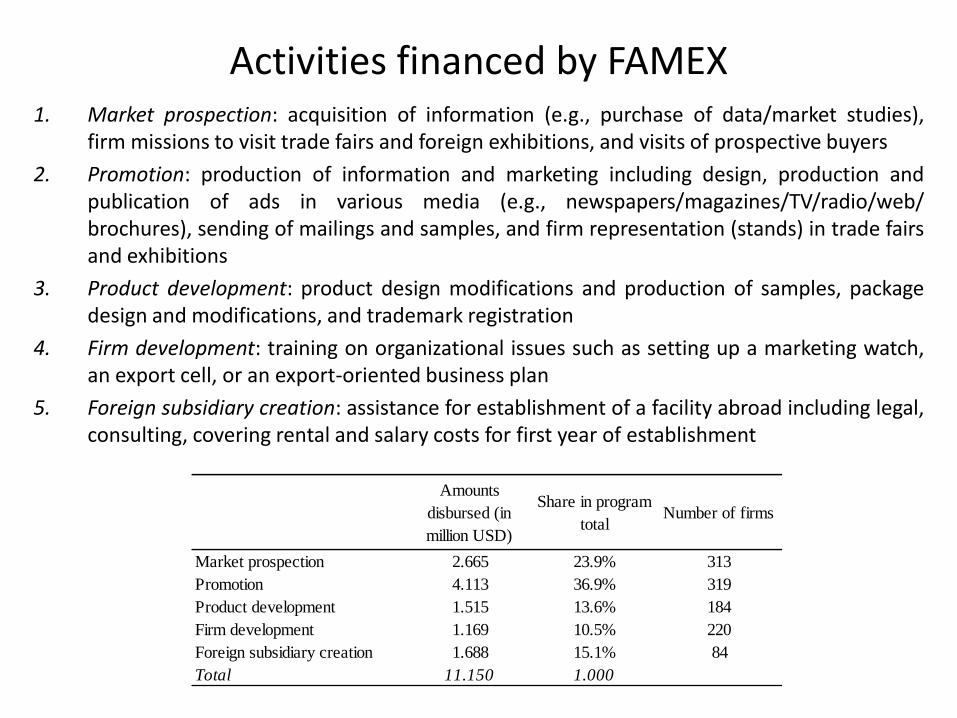
Activities financed by FAMEX1. Market prospection: acquisition of information (e.g., purchase of data/market studies),
firm missions to visit trade fairs and foreign exhibitions, and visits of prospective buyers
2. Promotion: production of information and marketing including design, production andpublication of ads in various media (e.g., newspapers/magazines/TV/radio/web/brochures), sending of mailings and samples, and firm representation (stands) in trade fairsand exhibitions
3. Product development: product design modifications and production of samples, packagedesign and modifications, and trademark registration
4. Firm development: training on organizational issues such as setting up a marketing watch,an export cell, or an export-oriented business plan
5. Foreign subsidiary creation: assistance for establishment of a facility abroad including legal,consulting, covering rental and salary costs for first year of establishment
Amounts
disbursed (in
million USD)
Share in program
totalNumber of firms
Market prospection 2.665 23.9% 313
Promotion 4.113 36.9% 319
Product development 1.515 13.6% 184
Firm development 1.169 10.5% 220
Foreign subsidiary creation 1.688 15.1% 84
Total 11.150 1.000

Challenges in evaluating FAMEX - 1
• Fundamental question: was the FAMEX intervention effective inpromoting export competitiveness in Tunisia?
• Objective of impact evaluation: isolate causal effects of FAMEX on keyexport-related outcomes for Tunisian firms
– Firm-level total exports, number of export products and exportdestinations, survival, diversification, export volatility
• A simple before-after comparison (comparing FAMEX firms withthemselves over time) is not appropriate to evaluate the impact ofFAMEX
• We need to consider the counterfactual: what would have happened toFAMEX firms in the absence of the program?

Challenges in evaluating FAMEX - 2
• FAMEX program did not involve a randomized choice of beneficiaries:Tunisian firms that self-selected into the program are likely to bedifferent from other firms before treatment (e.g., more informed,with more dynamic managers)
• Need to use a method of evaluation that accounts for self-selection of firms into the FAMEX program
• Use quasi-experimental methods to evaluate impact of FAMEX bycomparing outcomes of treated firms to outcomes of control firms(the counterfactual) addressing selection based on observable firmcharacteristics
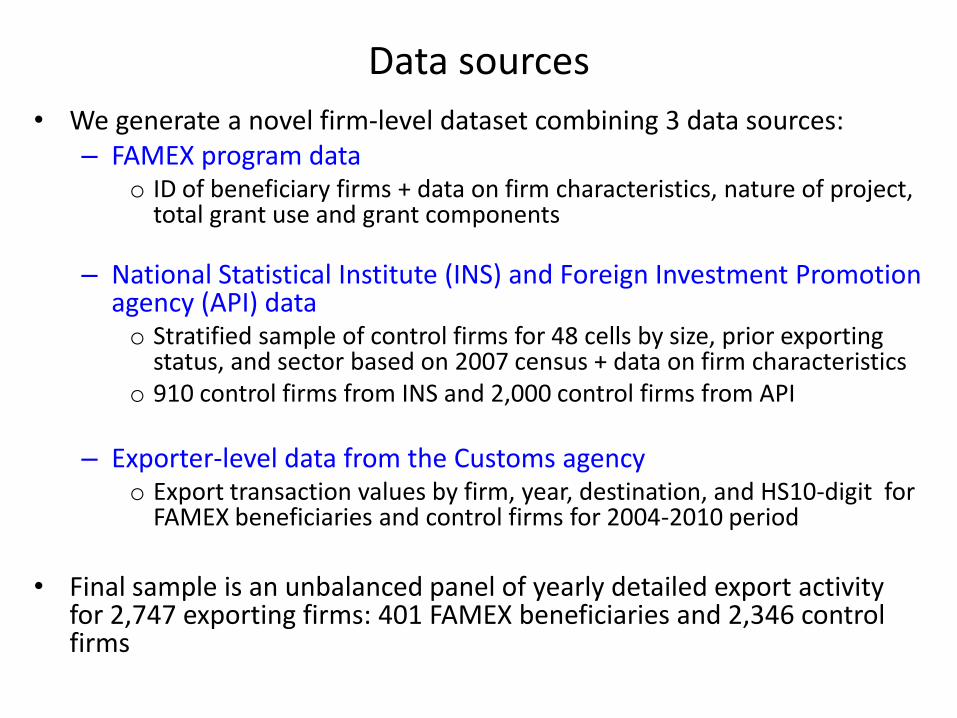
Data sources
• We generate a novel firm-level dataset combining 3 data sources:– FAMEX program data
o ID of beneficiary firms + data on firm characteristics, nature of project, total grant use and grant components
– National Statistical Institute (INS) and Foreign Investment Promotion agency (API) datao Stratified sample of control firms for 48 cells by size, prior exporting
status, and sector based on 2007 census + data on firm characteristics o 910 control firms from INS and 2,000 control firms from API
– Exporter-level data from the Customs agencyo Export transaction values by firm, year, destination, and HS10-digit for
FAMEX beneficiaries and control firms for 2004-2010 period
• Final sample is an unbalanced panel of yearly detailed export activity for 2,747 exporting firms: 401 FAMEX beneficiaries and 2,346 control firms
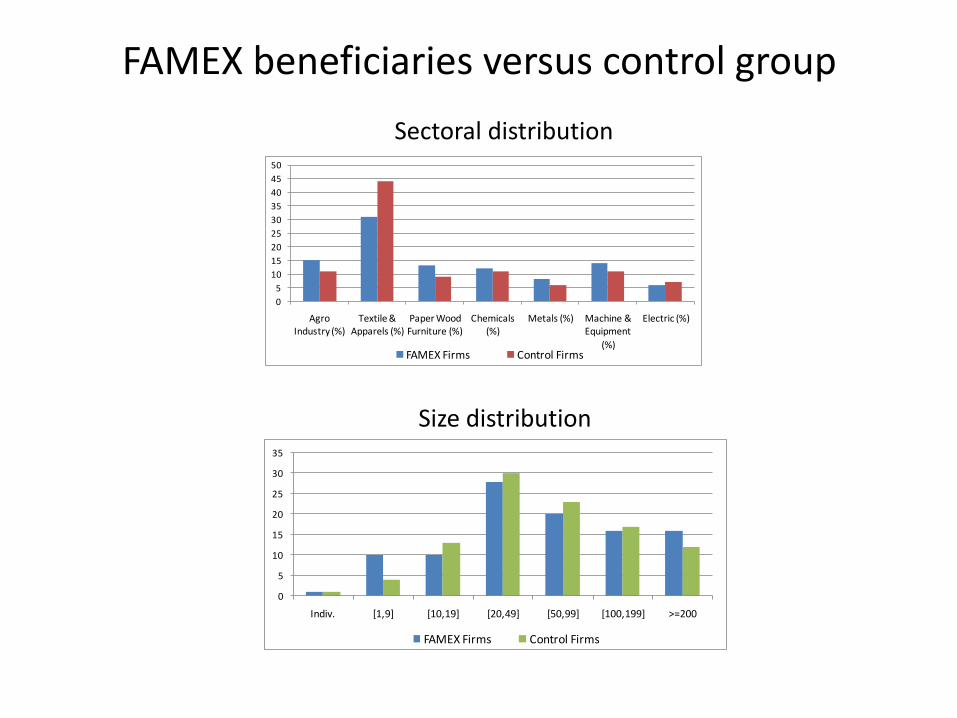
FAMEX beneficiaries versus control group
0
5
10
15
20
25
30
35
40
45
50
Agro Industry (%)
Textile & Apparels (%)
Paper Wood Furniture (%)
Chemicals (%)
Metals (%) Machine & Equipment
(%)
Electric (%)
FAMEX Firms Control Firms
0
5
10
15
20
25
30
35
Indiv. [1,9] [10,19] [20,49] [50,99] [100,199] >=200
FAMEX Firms Control Firms
Sectoral distribution
Size distribution

Evaluation method – step 1 Propensity score estimation
• Estimate the probability of FAMEX participation based on all available firm characteristics using a sample including all treated firms and all control firms
• The estimated probability for each firm – propensity score –is a measure of “similarity” across treatment firms and control firms

Propensity score estimation results
• Estimate a probit regression for FAMEX participation using all firmcovariates: o Age and age squared
o Location
o Sector
o Employment
o Lagged number of export destinations and number of exported products
o Lagged total exports
o Dummy for initial 100% exporter
• Which firms are MORE likely to receive a FAMEX grant? – Smaller exporters, exporters located in Tunis, exporters of more products and serving more
destinations in the past
• Which firms are LESS likely to receive a FAMEX grant? – Firms with larger export volumes and those exporting all their output in the past
• Sector fixed effects are insignificant: no sectoral targeting

Evaluation method – step 2 Propensity score matching–difference-in-
differences estimator (PSM-DID)
• Follow Heckman, Ichimura, and Todd (1997), Blundell and Costa Dias (2009)
• Compare change in outcomes for FAMEX firms to change in outcomes for “similar” control firms before and after FAMEX
• Account for time-invariant unobserved firm characteristics leading to self-selection into FAMEX that could also influence outcome
where wij are weights used to match FAMEX firms and control firms based on their propensity scores
• Problem in using the PSM-DID estimator is that Tunisian firms receivedFAMEX assistance in different years from 2005 to 2009 and should not bematched with control firms in any year (not necessarily in the treatmentyear) since calendar time can matter for performance
𝛾𝑃𝑆𝑀−𝐷𝐼𝐷 = ∆𝑙𝑛 𝑦𝑖𝑡 − 𝑤𝑖𝑗 ∆𝑙𝑛 𝑦𝑗𝑡 𝑗∈𝐶∩𝑆
𝑖∈𝑇∩𝑆
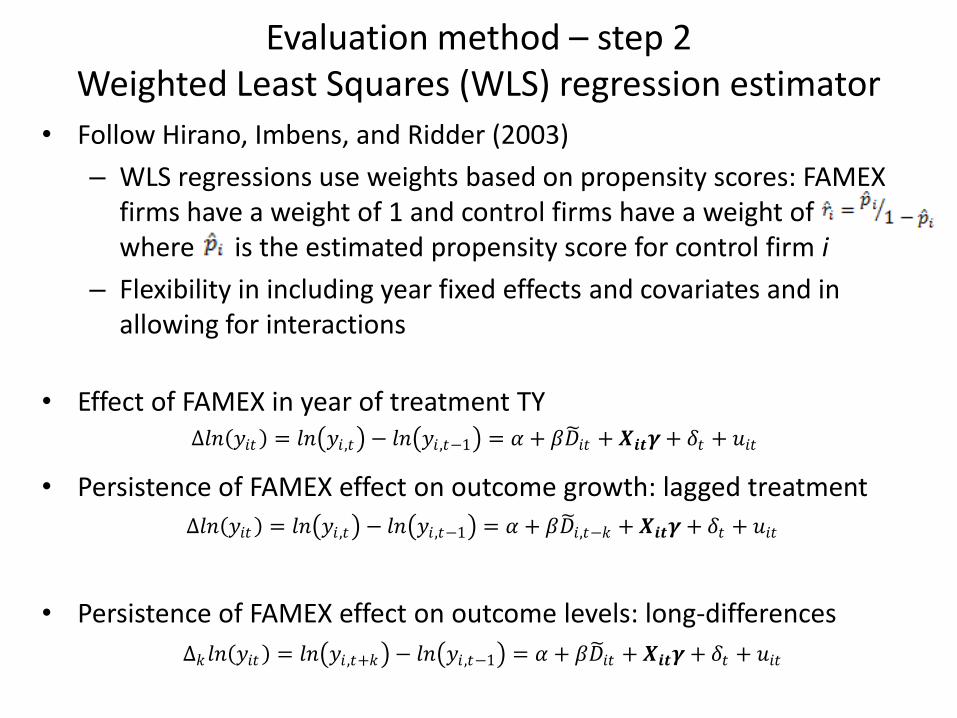
Evaluation method – step 2 Weighted Least Squares (WLS) regression estimator
• Follow Hirano, Imbens, and Ridder (2003)
– WLS regressions use weights based on propensity scores: FAMEX firms have a weight of 1 and control firms have a weight of where is the estimated propensity score for control firm i
– Flexibility in including year fixed effects and covariates and in allowing for interactions
• Effect of FAMEX in year of treatment TY
• Persistence of FAMEX effect on outcome growth: lagged treatment
• Persistence of FAMEX effect on outcome levels: long-differences
∆𝑘 𝑙𝑛 𝑦𝑖𝑡 = 𝑙𝑛 𝑦𝑖 ,𝑡+𝑘 − 𝑙𝑛 𝑦𝑖 ,𝑡−1 = 𝛼 + 𝛽𝐷 𝑖𝑡 + 𝑿𝒊𝒕𝜸 + 𝛿𝑡 + 𝑢𝑖𝑡
∆𝑙𝑛 𝑦𝑖𝑡 = 𝑙𝑛 𝑦𝑖 ,𝑡 − 𝑙𝑛 𝑦𝑖 ,𝑡−1 = 𝛼 + 𝛽𝐷 𝑖𝑡 + 𝑿𝒊𝒕𝜸 + 𝛿𝑡 + 𝑢𝑖𝑡
∆𝑙𝑛 𝑦𝑖𝑡 = 𝑙𝑛 𝑦𝑖 ,𝑡 − 𝑙𝑛 𝑦𝑖 ,𝑡−1 = 𝛼 + 𝛽𝐷 𝑖,𝑡−𝑘 + 𝑿𝒊𝒕𝜸 + 𝛿𝑡 + 𝑢𝑖𝑡

Baseline FAMEX effects - 1
• For how long do outcome growth trajectories of treatment andcontrol firms diverge?
TY is treatment year
• FAMEX has a short-term impact on total exports but no persistence
• FAMEX has positive long-lasting effects on destinations andproducts
Difference TY-(TY-1) TY-(TY-1) (TY+1)-TY (TY+2)-(TY+1) (TY+3)-(TY+2) (TY+4)-(TY+3) (TY+5)-(TY+4)
Estimator PSM-DID WLS reg. WLS reg. WLS reg. WLS reg. WLS reg. WLS reg.
(1a) (1b) (2) (3) (4) (5) (6)
Outcome
Total exports 0.496 0.511*** 0.251 -0.042 -0.157 -0.240 0.025
[2.66]** [3.08] [1.55] [-0.26] [-0.83] [-1.06] [0.11]
R-squared 0.17 0.14 0.11 0.09 0.11 0.11
Nb. destinations 0.144*** 0.150*** 0.086*** 0.052** 0.021 0.036 0.059**
[5.52] [6.10] [3.70] [2.10] [0.84] [1.11] [2.07]
R-squared 0.15 0.12 0.08 0.12 0.12 0.08
Nb. products 0.145*** 0.147*** 0.071** 0.049 0.008 0.060 0.097***
[4.33] [4.68] [2.22] [1.59] [0.23] [1.59] [2.58]
R-squared 0.15 0.13 0.13 0.12 0.13 0.13
Observations 12,263 12,214 9,803 7,401 4,975 2,607

Baseline FAMEX effects -2
• For how long do outcome levels differ across treatment and controlfirms after a temporary growth surge?
TY is treatment year
• Cumulative effects of FAMEX on total exports disappear after 3years
• Cumulative effects of FAMEX on destinations and products persist
Difference TY-(TY-1) (TY+1)-(TY-1) (TY+2)-(TY-1) (TY+3)-(TY-1) (TY+4)-(TY-1) (TY+5)-(TY-1)
Estimator WLS reg. WLS reg. WLS reg. WLS reg. WLS reg. WLS reg.
(1) (2) (3) (4) (5) (6)
Outcome
Total exports 0.511*** 0.723*** 0.571** 0.272 0.043 0.200
[3.08] [3.59] [2.57] [1.02] [0.13] [0.52]
R-squared 0.17 0.22 0.23 0.22 0.23 0.25
Nb. destinations 0.150*** 0.191*** 0.190*** 0.151*** 0.143*** 0.177***
[6.10] [6.93] [5.91] [4.18] [3.03] [3.22]
R-squared 0.15 0.20 0.20 0.24 0.29 0.30
Nb. products 0.147*** 0.175*** 0.178*** 0.117** 0.156*** 0.219***
[4.68] [4.70] [4.42] [2.51] [2.66] [3.37]
R-squared 0.15 0.20 0.23 0.26 0.27 0.30
Observations 12,263 12,124 9,664 7,238 4,839 2,524

Typical effects of FAMEX on total exports
• Taking an average Tunisian firm in 2004 and considering thedifferential effect on total export growth for FAMEX beneficiariesrelative to control firms
0
500
1000
1500
2000
2500
3000
3500
4000
TY-1 TY TY+1 TY+2 TY+3 TY+4 TY+5
Av
era
ge T
ota
l E
xp
orts
per F
irm
(th
ou
san
ds
of
Tn
usi
an
Din
ars)
No FAMEX FAMEX

FAMEX effects on export survival
• Despite vanishing effects on total exports, did FAMEX affect export survival?
• Construct survival measures for each firm in new destination markets between years a and b (same for new products)
• FAMEX brings higher survival in new destination markets up to 5 years after treatment
nb of surviving dest. between a and b
nb of surviving dest. between a and b + nb of dropped dest. between a and b
Duration TY to TY+1 TY to TY+2 TY to TY+3 TY to TY+4 TY to TY+5
Estimator Weighted Tobit Weighted Tobit Weighted Tobit Weighted Tobit Weighted Tobit
(1) (2) (3) (4) (5)
Outcome
New destination survival rate 0.261*** 0.260*** 0.283** 0.220 0.419**
[2.83] [2.69] [2.42] [1.54] [2.55]
R-squared 0.02 0.04 0.04 0.07 0.08
Observations 4,046 3,277 2,459 1,629 897
New HS 6d product survival rate 0.034 0.035 -0.004 0.056 0.122
[0.52] [0.47] [-0.05] [0.42] [0.82]
R-squared 0.03 0.04 0.05 0.05 0.06
Observations 5,553 4,493 3,403 2,255 1,206

FAMEX and risk-taking
• Individuals are more willing to take risks out of windfall gains thanregular earnings (Thaler and Johnson, 1990)
• FAMEX was a matching-grant - not a pure subsidy - but did it encouragebeneficiaries to take on more risk?
– Suggestive evidence is the worse performance of FAMEX beneficiariesrelative to control firms during global financial crisis years
• Estimate WLS regressions for firm-level Herfindahl and Theil indexes ofexport shares across product-destination cells to examine what FAMEX-induced growth at the extensive margin did to concentration
• Estimate WLS regression for coefficient of variation in total exportsbefore-after FAMEX to examine FAMEX-linked volatility in total exportsales

FAMEX, diversification and volatilityTY is treatment year
• FAMEX firms diversified significantly and persistently• But this did not result in a significant reduction in total exports
volatility• FAMEX firms may have experimented with new markets/products
that failed, or diversified into riskier markets/products, or diversifiedinto markets/products with export sales (returns) correlated withexisting markets/products
Difference TY-(TY-1) (TY+1)-(TY-1) (TY+2)-(TY-1) (TY+3)-(TY-1) (TY+4)-(TY-1) (TY+5)-(TY-1) Before-After 2005
Estimator WLS reg. WLS reg. WLS reg. WLS reg. WLS reg. WLS reg. WLS reg.
(1) (2) (3) (4) (5) (6) (7)
Outcome
Herfindahl index -0.131*** -0.116*** -0.151*** -0.183*** -0.172*** -0.303***
[-4.35] [-2.91] [-3.61] [-3.93] [-3.03] [-4.26]
R-squared 0.08 0.11 0.09 0.11 0.11 0.14
Theil index -0.021*** -0.021*** -0.027*** -0.030*** -0.031*** -0.052***
[-4.82] [-3.57] [-4.35] [-4.33] [-3.68] [-4.82]
R-squared 0.10 0.14 0.12 0.14 0.16 0.17
Observations 7,743 7,308 5,627 4,059 2,629 1,326
Coeff. variation of exports -0.023
[0.51]
R-squared 0.13
Observations 1,198
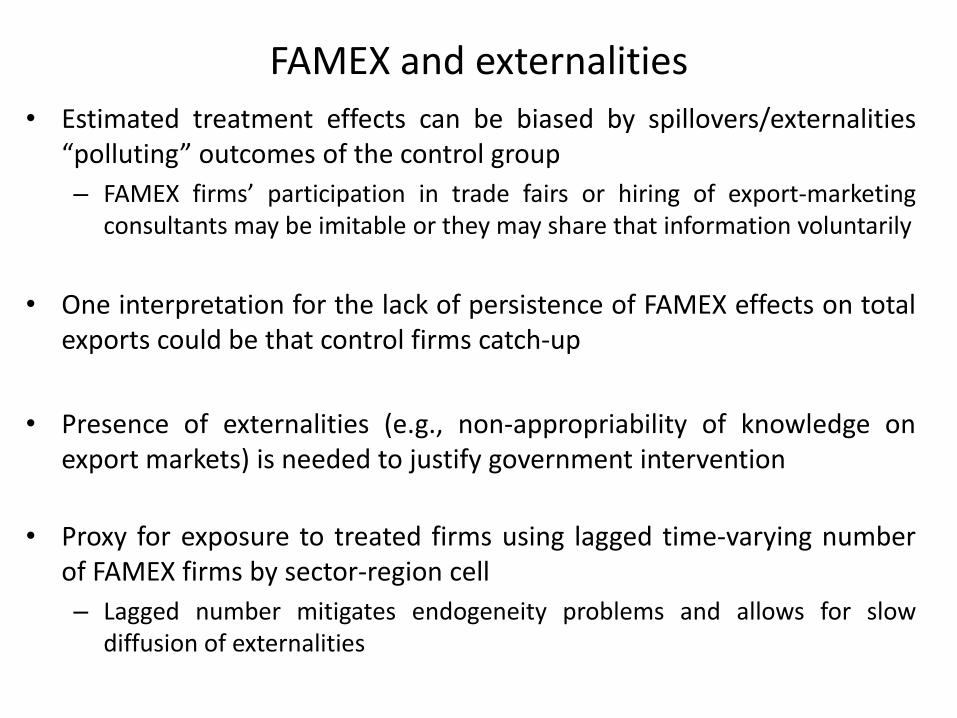
FAMEX and externalities
• Estimated treatment effects can be biased by spillovers/externalities“polluting” outcomes of the control group
– FAMEX firms’ participation in trade fairs or hiring of export-marketingconsultants may be imitable or they may share that information voluntarily
• One interpretation for the lack of persistence of FAMEX effects on totalexports could be that control firms catch-up
• Presence of externalities (e.g., non-appropriability of knowledge onexport markets) is needed to justify government intervention
• Proxy for exposure to treated firms using lagged time-varying numberof FAMEX firms by sector-region cell
– Lagged number mitigates endogeneity problems and allows for slowdiffusion of externalities
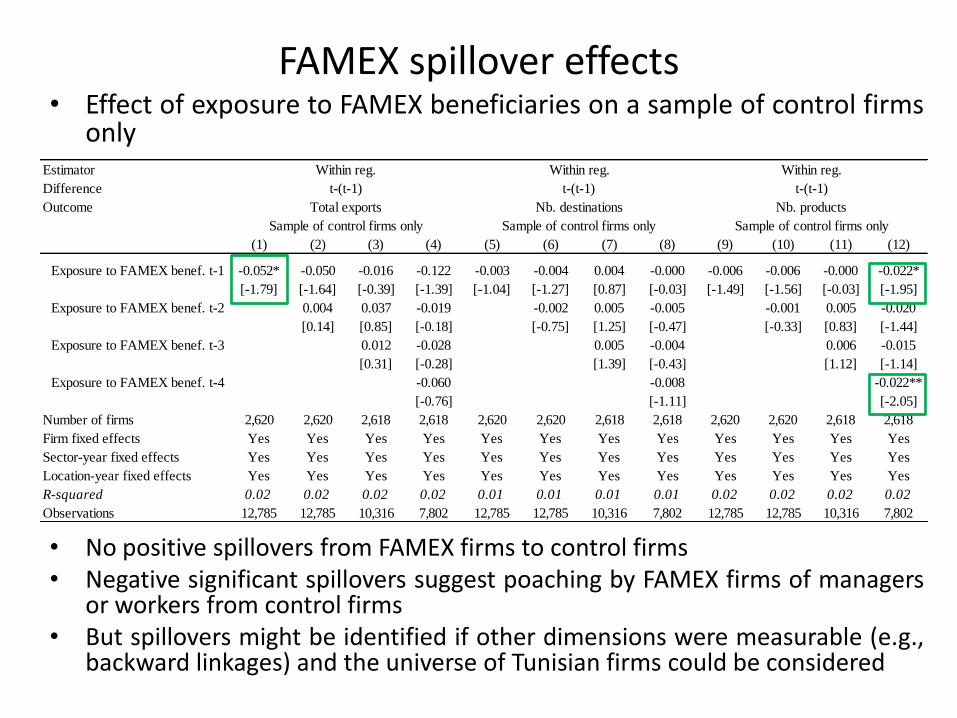
FAMEX spillover effects• Effect of exposure to FAMEX beneficiaries on a sample of control firms
only
• No positive spillovers from FAMEX firms to control firms• Negative significant spillovers suggest poaching by FAMEX firms of managers
or workers from control firms• But spillovers might be identified if other dimensions were measurable (e.g.,
backward linkages) and the universe of Tunisian firms could be considered
Estimator
Difference
Outcome
(1) (2) (3) (4) (5) (6) (7) (8) (9) (10) (11) (12)
Exposure to FAMEX benef. t-1 -0.052* -0.050 -0.016 -0.122 -0.003 -0.004 0.004 -0.000 -0.006 -0.006 -0.000 -0.022*
[-1.79] [-1.64] [-0.39] [-1.39] [-1.04] [-1.27] [0.87] [-0.03] [-1.49] [-1.56] [-0.03] [-1.95]
Exposure to FAMEX benef. t-2 0.004 0.037 -0.019 -0.002 0.005 -0.005 -0.001 0.005 -0.020
[0.14] [0.85] [-0.18] [-0.75] [1.25] [-0.47] [-0.33] [0.83] [-1.44]
Exposure to FAMEX benef. t-3 0.012 -0.028 0.005 -0.004 0.006 -0.015
[0.31] [-0.28] [1.39] [-0.43] [1.12] [-1.14]
Exposure to FAMEX benef. t-4 -0.060 -0.008 -0.022**
[-0.76] [-1.11] [-2.05]
Number of firms 2,620 2,620 2,618 2,618 2,620 2,620 2,618 2,618 2,620 2,620 2,618 2,618
Firm fixed effects Yes Yes Yes Yes Yes Yes Yes Yes Yes Yes Yes Yes
Sector-year fixed effects Yes Yes Yes Yes Yes Yes Yes Yes Yes Yes Yes Yes
Location-year fixed effects Yes Yes Yes Yes Yes Yes Yes Yes Yes Yes Yes Yes
R-squared 0.02 0.02 0.02 0.02 0.01 0.01 0.01 0.01 0.02 0.02 0.02 0.02
Observations 12,785 12,785 10,316 7,802 12,785 12,785 10,316 7,802 12,785 12,785 10,316 7,802
Within reg.
Nb. destinations Nb. products
t-(t-1)
Sample of control firms only
Within reg. Within reg.
Total exports
t-(t-1) t-(t-1)
Sample of control firms only Sample of control firms only

FAMEX objectives and use of FAMEX support
• Objectives for requesting FAMEX assistance: 31% of firms came tobecome more significant exporter, 49% came to export to newdestinations and 20% came to export new products– Estimate WLS regressions allowing FAMEX effects to differ across
objectives
– Firms coming to export to new destinations or new products exhibitsignificant and sustained increase in numbers of destinations and productsbut only temporary expansion in total exports
– Firms coming to become more significant exporter see weaker benefitsfrom FAMEX
• FAMEX activities: market prospection, promotion, productdevelopment, firm development, and foreign subsidiary creation– Estimate WLS regressions including vector with firm amounts per activity
– Market prospection and promotion activities have a beneficial and durableeffect across export outcomes

Concluding remarks
• FAMEX program has a stronger and more durable effect onTunisian firms’ exports at the extensive margin (destination andproduct growth) than at the intensive margin (total exportgrowth)– No longer-term effects on total exports means FAMEX firms spread
themselves too thin?
• FAMEX-driven diversification does not translate into lowervolatility of exports
• Our significant treatment effects are not clearly favorable topublic funding of export promotion– They indicate appropriable benefits and give no indication of positive
spillovers (at least on a selected set of export-related outcomes)