are state-owned enterprises successful vehicles for ... · andriati fitriningrum master of arts . i...
TRANSCRIPT

21
A thesis submitted for the degree of PhD in Commerce
Research School of Accounting College of Business and Economics
Australian National University
ARE STATE-OWNED ENTERPRISES SUCCESSFUL VEHICLES FOR ATTAINING
THEIR GOVERNMENT STATED OBJECTIVES?
A study of the implications of government policies and objectives for State-Owned Enterprises in Indonesia
Andriati Fitriningrum
Master of Arts
i
Abstract
The purpose of this study is to examine whether Indonesian Badan Usaha Milik Negara (BUMN) or
State-Owned Enterprises (SOE) are successful vehicles for attaining government socio-economic and
financial objectives. The motives for undertaking this study arise from the importance of SOEs in
national economic and socio-political roles in developing countries like Indonesia, even after their
privatisation. This thesis identifies the implications of policy changes for the Indonesian
government’s objectives for SOEs.
First, an historical examination of changes in the institutional and economic environment in
Indonesia (Chapters 6-8) identifies substantial impacts on the evolution of the structure of SOEs and
the government’s objectives for SOEs. The first stage of this analysis reveals that the “see-sawing” of
economic policy between centralisation and market orientation led to changes in the structure and
objectives of the SOEs. Initially, the state enterprises established during the Indonesianisation period
(1945-1958) had multiple socio-political objectives with little concern for economic of financial
objectives. The reforms during the nationalisation period (1958-1966) included the restructuring of
previously nationalised companies as Perusahaan Negara, and the introduction of profit objectives
for some Perusahaan Negara. In the corporatisation period (1966 – present), the Perusahaan
Negara were reformed and divided into three types of entities: Persero, Perum and Perjan. The
Persero are incorporated entities that have both commercial and social welfare objectives. The
Perum are incorporated entities that are not commercial but have profit objectives and social
welfare objectives. The Perjan are not incorporated (remaining as state agencies) and have only
social welfare objectives. Perusahaan Negara poor performance and fiscal problem in the early
1980s encouraged the reform of Perusahaan Negara structure as Badan Usaha Milik Negara
(BUMN/SOE). The introduction of partial-privatisation policy in 1991 encouraged profit and
efficiency objectives for SOEs that could potentially be privatised. The implementation of fast track
privatisation in 2002 caused significant changes in the SOEs structure and objectives. The
government encouraged all SOEs to implement corporatisation principles in which emphasise
financial objectives such as profit and efficiency. The government eliminated the Perjan structure,
which it considered to have become a barrier to the implementation of full corporatisation and fast
track privatisation. In practice, social welfare and non-economic remained a major Badan Usaha
Milik Negara (BUMN/SOE) objectives.
From the late 1990s, external pressure from international financial institutions was a significant
factor in the government’s efforts to privatise the SOEs. In the second part of the historical analysis
in this thesis, privatisation is shown to be a major influence on policies and SOEs’ objectives.
ii
Privatisation represents a fundamental change in the government-stated objectives and policies for
SOEs, and included the introduction of an ‘open market’ policy, development of domestic capital
market activities, and full implementation of corporatisation principles. However, privatisation in
Indonesia is constrained by the 1945 Constitution of Indonesia regarding the control policy, which
leads to different categories of SOEs with respect to privatisation and the importance of economic or
financial objectives. There are now three categories of SOEs: those that have been identified as not
available for privatisation, those that can be privatised but are still fully owned by the government,
and those that have been privatised. As a consequence of the constitutional barrier and political
interests, most privatisations of SOEs were partial. The continuation of government control over
these partially privatised SOEs increased the potential for conflict between the greater emphasis on
financial objectives arising from private investors and the government’s continuing socio-political
objectives for these SOEs. This is emphasised in analysis of the most intensive period of privatisation
(2002-2004).
An examination of SOEs objectives in practices shows that privatisation policy makes some
differences in regards to the government objectives and treatment for the SOEs. In addition to three
different categories of SOEs, privatisation policy encourages the importance of profit and efficiency
objectives which apply to all SOEs. In contrast, the content analysis (Chapters 8-9) reveals that the
government inconsistency in implementing the new profit and efficiency policies and caused the
absence of profit and efficiency objectives as part of the government objectives for numbers of SOE.
The potential conflicting objectives arises between the government and SOEs when the SOEs have to
deal with the pressure and changes from their markets.
Building on the conceptually conflicting objectives identified in the historical analysis, the thesis then
empirically assesses the extent of apparent conflicts within government objectives, and between the
government’s and SOEs objectives, and the implication on the performance of SOEs with respect to
government objectives. First, the extent of apparent conflicts emerges as the government
introduces profit and efficiency objectives, while in practice; the government has never made any
changes in the government-stated objectives for each individual SOE. Second, the company
constitution and management objectives are more likely to make changes of the objectives in order
to accommodate the changes in their market. Next, identifies the objectives for which objective
(proxy) performance measures are available: these are financial performance and financial
performance that represent the social welfare. Using these measures, the different types of
performance of SOE’s are regressed against indicators of government-stated objectives for SOEs,
whether the objectives make a different or affect the SOEs performance.

iii
Examination of the relations between the government-stated objectives and SOEs financial
performance shows some weak negative relations between the government-stated objectives and
SOEs financial performance. The reliance of many Indonesian SOEs on non-core business income
(such as subsidies and asset disposals) and external financial support (such as soft loans from
government-controlled lenders) indicates the inconsistency between the SOEs financial objectives
and achieving the government’s social welfare and non-economic objectives.
iv
Declaration of Originality
I certify that this thesis does not incorporate without acknowledgement any material previously
submitted for a degree or diploma in any university; and that to the best of my knowledge and belief
it does not contain any material previously published or written by another person except where
due reference is made in the text.
Signed: ____________________ On: _____/____/_____

v
Acknowledgements
This thesis would not have been possible without the guidance, help and support of several
individuals who contributed and extended their valuable assistance in the preparation and
completion of this study.
My thesis and study arose as part of my interest in and love for corporate governance and public
policy when I was involved with corporate governance and privatisation projects for Indonesian
State Owned Enterprises back in 2002. During my involvement in both corporate governance and
privatisation, I discovered that Australia is the best place to deepen my knowledge and skill in this
subject. My enthusiasm for corporate governance drove me to contact A/Prof Greg Shailer to ask
whether I could do a PhD at ANU under his supervision. I was very happy when A/Prof Greg Shailer
and Dr Colleen Hayes accepted my request and became my panels, together with Dr Janet Lee.
I would like to express my utmost gratitude to A/Prof Greg Shailer for the sincerity, commitment and
expertise he has shown when supervising, guiding and training me from the very early stages of my
PhD. A/Prof Shailer has encouraged and inspired me to learn new things and to enrich my
knowledge and skills. I also want to acknowledge and thank my supervisors; Dr Colleen Hayes and Dr
Janet Lee for the valuable advice, guidance and encouragement they gave which has also greatly
contributed to my growth as a student and researcher.
Most importantly, I would like to express my love and grateful thanks to my parents. To my late dear
father who always encouraged me to be the best I could be, and took so much pride and joy in his
children’s achievements. I wish so much he could see and be with me and our family still. And to my
beloved Mother whose love and prayers have made me brave and strong during my PhD journey
away from home. I’m indebted to my Mom for her blessings and agreement to my overseas study,
even though we both knew the geographical separation would be difficult.
I would like also to acknowledge the support and prayers from my family, Ekajani Saptika, Anton
Happy Nugroho and the kids. Anton and Eka have always supported me chasing my dream, and the
kids have always reminded me to return home one day.
I thank also my best friend, David Petersen who was always there for me during the ups and downs
of this PhD journey. He was the one who listened to my angry ranting and tears whenever study and
work overwhelmed me. He was the one who would push me back on track, telling me not to give up
whenever I had thoughts of abandoning my unfinished PhD. Thanks, Dave, for being such great

vi
company on my PhD journey, as well as the journeys we shared together and with friends exploring
Australia. As you often say, a big ‘Goodonya, mate!’ to you from me.
During my time as a PhD student at the College of Business and Economics, I was very grateful to
meet some wonderful people whom I would like to acknowledge and thank for their support and
help. Ms Gail McNamara, the school administrator for her help and for allowing me to work in my
own room. My statistics mentor and discussion buddy, Folototo Seve. Thank you very much for
spending time to teach and train me in statistics, and to discuss study. I look forward to working with
you soon.
I would like to express my gratitude to former colleagues from the Indonesian Ministry of State
Owned Enterprises. I gratefully thank Dr Agus Pakpahan and Pak Megananda, my Deputy Minister
and Director for Plantation directorate, for giving me permission to continue my study in Australia. I
would like to thank Dr Suad Husnan and Dr Indra Djati Sidi for their support and enabling me to
continue my study in Australia. My Indonesian colleagues, Alvin Nur Widjajanti and Amirur Royanata
for their valuable help and assistance in keeping me updated about key developments with
Indonesian SOEs during my study and time away from work. I must also thank Dr Lee Babcock, my
inspirational privatisation working partner who encouraged me to go back to school.
In my four years living at University House, I have met and made friends with some amazing people
whose company lifted my spirits and helped me to cope with study/work pressures and the
loneliness I felt being away from family. My special thanks to Mr Tony Karrys, Ms Lynn North and the
University House staff for their hospitality and support. Mr Karrys and his staff at University House
have made my time living in University House happy and pleasant.
I thank also my dear University House friends: Johnny Valbuena, who always reminded me that a
PhD is not easy to attain but always worth striving for; Umbu Raya Kemadaki who made sure that I
did not go hungry whenever I came home late from the office; and Tim Burgess for the time, quiet
patience and friendship he so readily gave.
Finally, I would like to thank everyone who contributed to the success and completion of my study
and thesis. My apologies to those whom I did not mention individually, but please know that you will
always have my gratitude and fond recall.
vii
Contents
Abstract ………………………………………………………………………………………………………………………………………… i Declaration of Originality ……………………………………………………………………………………………………………… iv Acknowledgement ………………………………………………………………………………………………………………………… v Contents ……………………………………………………………………………………………………………………………………… vii List of Table …………………………………………………………………………………………………………………………………… x List of Abbreviations ……………………………………………………………………………………………………………………… Xiii Chapter 1: Introduction ………………………………………………………………………………………………………………… 1
1.1 Background and Motivation ……………………………………………………………………………………… 1 1.2 Literature Background ……………………………………………………………………………………………….. 2 1.3 Indonesian State Owned Enterprises in Brief ……………………………………………………………… 4 1.4 A Framework of Study ……………………………………………………..………………………………………… 8
1.4.1 Institutional Change Theory: Path Dependence ………………………………………… 9 1.4.2 State Owned Enterprises: Definition …..…………………………………………………….. 10 1.4.3 Government Stated Objectives: Definition ………………………………………………… 11
1.5 Research Methods ……………………………………………………………………………………………………. 12 1.5.1 Historical Path Analysis …………………………………………………………………………….. 13 1.5.2 Implications of the Objectives …………………………………………………………………… 14 1.5.3 Unit Analysis ……………………………………………………………………………………………… 15
1.6 Chapter Development ………………………………………………………………………………………………… 16 Chapter 2: Literature Review: Studies of SOEs ……………………………………………………………………………… 18
2.1 SOEs Reforms: Privatisation ……………………………………………………………………………………….. 19 2.2 SOEs Reforms in Advanced Market Economies ………………………………………………………….. 24 2.3 SOEs Reforms in Non-Asia Emerging Market Economies ……………………………………………. 26 2.4 SOEs Reforms in Asia Emerging Market Economies ……………………………………………………. 30 2.5 Chapter Conclusion …………………………………………………………………………………………………… 37
Chapter 3: Framework of Study ……………………………………………………………………………………………………. 40 3.1 Definition …………………………………………………………………………………………………………………… 40 3.2 The Nature of State Owned Enterprises …………………………………………………………………….. 41 3.3 The Nature of Government Objectives ………………………………………………………………………. 42 3.4 Conceptual Framework ……………………………………………………………………………………………… 44
3.4.1 Institutional Change ………………………………………………………………………………….. 44 3.4.2 Historical Path …………………………………………………………………………………………… 46 3.4.3 Performance ……………………………………………………………………………………………… 49
3.5 Chapter Conclusion ……………………………………………………………………………………………………. 50 Chapter 4: Proposition and Hypotheses ……………………………………………………………………………………….. 51
4.1 Government Objectives ……………………………………………………………………………………………… 52 4.2 Impacts of Privatisation Policy ……………………………………………………………………………………. 53 4.3 Performance Implications ………………………………………………………………………………………….. 54
Chapter 5: Research Methods ……………………………………………………………………………………………………… 57 5.1 Methods …………………………………………………………………………………………………………………… 58
5.1.1 Historical Path Analysis …………………………………………………………………………….. 58 5.1.2 Content Analysis for Evaluating the Government Stated Objectives ………… 60 5.1.3 Quantitative Method for Relations and Performance Measurement ………… 61
5.2 Unit Analysis ………………………………………………………………………………………………………………. 63 5.3 Data Collection …………………………………………………………..……………………………………………… 63 5.4 Data Analysis ……………………………………………………………………………………………………………… 65
Chapter 6: The Evolution of Government Stated Objectives for State Owned Enterprises ………….. 68 6.1 The Indonesianisation Period (1945-1958) …………………………………………………………………. 69
6.1.1. Structure and Objectives for the First SOEs ……………………………………………… 72 6.1.2. Key Points Analysis from Indonesianisation Period …………………………………… 73
viii
Contents
6.2 The Nationalisation Period (1958-1966) …………………………………………………………………….. 73 6.2.1 Change to the SOEs Structure and Objectives …………………………………………… 74 6.2.2 The Key Points From Nationalisation Period ……………………………………………… 76
6.3 The Corporatisation Period (1966-2010) ……………………………………………………………………. 76 6.3.1 Under Perusahaan Negara Structure (1966-1983) …………………………………….. 76
6.3.1.1. Change to the Structure and Objectives of Perusahaan Negara 77 6.3.2 Under Badan Usaha Milik Negara (BUMN/SOEs) Structure (1983-2003) …… 80
6.3.2.1 Structure and Objectives of BUMN/SOEs …………………………………. 81 6.3.3 The Key Points From Corporatisation Period …………………………………………….. 82
6.4 Identifying Government Stated Objectives for State Owned Enterprises: Discussion… 83 Chapter 7: Privatisation and Government Stated Objectives for State Owned Enterprises …………. 87
7.1 Re-Privatisation: 1965 ………………………………………………………………………………………………… 88 7.2 Partial Privatisation: 1971 – 2005 ………………………………………………………………………………. 89
7.2.1 Privatisation of PT Intirub: 1971 ……………………………………………………………….. 89 7.2.2 Deregulation Economy: 1980-1988 …………………………………………………………... 89 7.2.3 The First Initial Public Offering: 1991 ………………………………………………………… 91 7.2.4 Fast Track Privatisation: 1993 – 2004 ………………………………………………………… 92 7.2.5 Key Points From Partial Privatisation ……………………………………………………….. 92
7.3 Policy Implications ………………………………………………………………………………………… 93 7.4 Identifying Privatisation Policy and Government Stated Objectives: Discussion ………… 97
Chapter 8: The Objectives of State Owned Enterprises in Practice: Publicly Listed State Owned Enterprises ………………………………………………………………………………………………… 101
8.1 The Publicly Listed State Owned Enterprises: A Brief Picture …………………………………….. 102 8.2 The Objectives …………………………………………………………………………………………………………… 105
8.2.1 The Objectives Imposed by Government …………………………………………………… 105 8.2.2 The Company’s Constitution Objectives ……………………………………………………. 107
8.3 Policy Implications ……………………………………………………………………………………………………… 112 8.3.1 Industrial Policies ……………………………………………………………………………………... 112 8.3.2 Control Policy ……………………………………………………………………………………………. 114 8.3.3 Mining: A Special Case ………………………………………………………………………………. 117
8.4 The Government State Objectives in Practice: discussion ………………………………………….. 118 8.4.1 The Objectives in Harmony ……………………………………………………………………….. 118 8.4.2 The Objectives in Conflict ………………………………………………………………………… 120
Chapter 9: The Objectives of Stated Owned Enterprises in Practice: Non-Privatised State Owned Enterprises ……. …………………………………………………………………………………….......... 123
9.1 The Non-Privatised State Owned Enterprises: A Brief Picture …………………………………….. 124 9.2 The Effect of Privatisation Policy ………………………………………………………………………………… 126 9.3 The Objectives …………………………………………………………………………………………………………… 127 9.4 The Objectives in Practice: discussion ……………………………………………………………………….. 133
9.4.1 Objectives in Harmony ……………………………………………………………………………… 133 9.4.2 Objectives in Conflict ………………………………………………………………………………… 133
Chapter 10: The Relations between The Government Stated Objectives and State Owned Enterprises Financial Performance ………………..…………………………………………………………. 136
10.1 State Owned Enterprises Objectives: An Overview …………………………………………………. 137 10.2 The Relations between State Owned Enterprises’ Measurable Performance and the Objectives ……………………………………………………………………………………………………………….. 146
10.2.1 Available Performance Measurement ……………………………………………………… 146 10.2.2 Compare Mean Performance of Three Types of State Owned Enterprises 148
10.3 The Relations between the Objectives and Performance …………………………………………. 162 10.4 Finding and Discussion …………………………………………………………………………………………….. 169
ix
Contents
Chapter 11: The Success of State Owned Enterprises in Achieving Government Stated Objectives ………………………………………………………………………………………………………………… 172
11.1 Measureable Data and Hypotheses………………………………………………………………………….. 172 11.2 The Test Result ………………………………………………………………………………………………………… 173 11.3 Potential Conflicting Objectives ……………………………………………………………………………….. 203 11.4 Finding and Discussion …………………………………………………………………………………………… 203
Chapter 12: Discussion and Conclusion ………………………………………………………………………………………… 206 12.1 Summary ………………………………………………………………………………………………………………… 206
12.1.1 The Evolution of State Owned Enterprises in Relation to the Historical Changes in Government Stated Objectives for State Owned Enterprises … 206 12.1.2 The Implications of Privatisation Policy and Partial Privatisation on the Government Stated Objectives for State Owned Enterprises …………………… 207 12.1.3 The Potential for Indonesian SOE Objectives to be in Harmony or Conflict 208 12.1.4 The Extent to which the Indonesian State Owned Enterprises are Successful Vehicles for Attaining the Government Objectives: Overall …… 208
12.2 Contribution …………………………………………………………………………………………………………….. 210 12.3 Implications of This Thesis to The Government and SOEs Policies and Development 212 12.4 Limitations ……………………………………………………………………………………………………………….. 214 12.5 Future Research ………………………………………………………………………………………………………. 214 12.6 Conclusion………………………………………………………………………………………………………………… 215
Appendix 1: Variable Definition and Sources…………………………………………………………………………………. 216 References and Bibliographies ……………………………………………………………………………………………………… 218
x
List of Tables
Table 6.1: Indonesian SOE Types ………………………………………………………………………………………………… 79 Table 7.1: Privatisation History ……………………………………………………………………………………………………… 94 Table 7.2: Indonesian Privatisation Results ……………………………………………………………………………………. 95 Table 8.1: The Ownership Structure of Publicly Listed SOEs …………………………………………………………… 103 Table 8.2: Government- Stated Objectives for Publicly Listed SOEs ………………………………………………… 107 Table 8.3: Changes in Objectives for Publicly Listed SOEs ……………………………………………………………….. 109 Table 8.4: The Current Objectives of Publicly Listed SOEs ………………………………………………………………. 111 Table 8.5: Composition of the Board of Directors and Board of Commissioners Among 15 SOEs
Publicly Listed in 2009 …………………………………………………………………………………………………… 116 Table 9.1: Summary the Changes of the Objectives ………………………………………………………………………… 130 Table 9.2: The Government and SOE Objectives in Non-privatised SOEs ………………………………………… 132 Table 10.1: Number of SOEs Based on the Groups and Industries ………………………………………………….... 137 Table 10.2: The Government Economic or Financial Objectives for SOEs per Industry Based on
Numbers of Firms Hold the Objective by 2010 ………………….………………………………………...... 139 Table 10.3: The Government Social Welfare or Non-Economic Objectives for SOEs per Industry
Based on Numbers of Firms Hold the Objective by 2010 ………………………………………………… 141 Table 10.4: The Government Social Welfare or Non-Economic Objectives for SOEs per Industry Based
on Numbers of Firms Hold the Objective by 2010 ……………………………………………...... 143 Table 10.5: Changes in Objectives …………………………………………………………………………………………………… 145 Table 10.6 : Data Description …………………………………………………………………………………………………………… 150 Table 10.7: The Mean Performance of SOEs per group …………………………………………………………………… 153 Table 10.8: The Mean SOEs Financial Performance Based on the Groups and Industries During
2004-2010 …………………………………………………………………………………………………………………… 155 Table 10.8 : The Mean SOEs Financial Performance Based on the Groups and Industries During
2004-2010 (cont.) ……………………………………………………………………………………………………...... 156 Table 10.8 : The Mean SOEs Financial Performance Based on the Groups and Industries During
2004-2010 (cont.) ………………………………………………………………………………………………………… 157 Table 10.8 : The Mean SOEs Financial Performance Based on the Groups and Industries During
2004-2010 (cont.) ………………………………………………………………………………………………………… 158 Table 10.9: The Mean Performance of SOEs Social Welfare Representative Financial Performance
During 2004-2010 Based on Group and Industry ……………………………………………………………. 160 Table 10.9: The Mean Performance of SOEs Social Welfare Representative Financial Performance
During 2004-2010 Based on Group and Industry (cont.) ……………………………………………….. 161 Table 10.10: The Two Samples t-test Result of Mean SOEs Performance and the Government-
Stated Economic or Financial Objectives During 2004-2010. 163 Table 10.11: Two Samples t-test Result of the SOEs Social Welfare Representative Performance and
The Government-Stated Economic or Financial Objectives During 2004-2010 ……………… 164 Table 10.11: Two Samples t-test Result of the SOEs Social Welfare Representative Performance and
The Government-Stated Economic or Financial Objectives During 2004-2010 (cont.)………… 165 Table 10.12: Two Samples t-tests result of the Relations between SOEs Financial Performance and
The Government-Stated Social Welfare or Non-economic Objectives During 2004- 2010 ……………………………………………………………………………………………………………………………… 166
Table 10.12: Two Samples t-test Result of the Relations between SOEs Financial Performance and The Government Stated Social Welfare or Non-Economic Objectives during 2004-2010 (cont.)……………………………………………………………………………………………………………………………… 167
Table 10.13: Two Samples t-test Result of the Relations Between SOEs Social Welfare Representative Performance and The Government Stated Social Welfare or Non-economic Objectives During 2004-2010 …………………………………………………………………………………………………………… 168
Table 10.13: Two Samples t-test Result of the Relations Between SOEs Social Welfare Representative Performance and The Government Stated Social Welfare or Non-economic Objectives During 2004-2010 (cont.)…………………………………………………………………………………………………… 169

xi
List of Tables
Table 11.1: The Regression Result of the Relations between the Government Stated Economic or Financial Objectives and SOEs Financial Performance during 2004-2010 Based on the SOEs Type Groups ………………………………………………………………………………………………………….. 175
Table 11.1: The Regression Result of the Relations between the Government Stated Economic or Financial Objectives and SOEs Financial Performance during 2004-2010 Based on the SOEs Type Groups (cont.) ………………………………………………………………………………………………… 176
Table 11.1: The Regression Result of the Relations between the Government Stated Economic or Financial Objectives and SOEs Financial Performance during 2004-2010 Based on the SOEs Type Groups (cont.) ………………………………………………………………………………………………. 177
Table 11.1: The Regression Result of the Relations between the Government Stated Economic or Financial Objectives and SOEs Financial Performance during 2004-2010 Based on the SOEs Type Groups (cont.) ……………………………………………………………………………………………… 178
Table 11.1: The Regression Result of the Relations between the Government Stated Economic or Financial Objectives and SOEs Financial Performance during 2004-2010 Based on the SOEs Type Groups (cont.) ……………………………………………………………………………………………… 179
Table 11.2: The Regression Result of the Relations between The Government Stated Economic or Financial Objectives and SOEs Social Welfare Representative Financial Performance during 2004-2010 Based on the SOEs Type Groups ………………………………………………………… 180
Table 11.2: The Regression Result of the Relations between The Government Stated Economic or Financial Objectives and SOEs Social Welfare Representative Financial Performance during 2004-2010 Based on the SOEs Type Groups (cont.) ……………………………………………… 181
Table 11.2: The Regression Result of the Relations between The Government Stated Economic or Financial Objectives and SOEs Social Welfare Representative Financial Performance during 2004-2010 Based on the SOEs Type Groups (cont.)……………………………………………… 182
Table 11.2: The Regression Result of the Relations between The Government Stated Economic or Financial Objectives and SOEs Social Welfare Representative Financial Performance during 2004-2010 Based on the SOEs Type Groups (cont.) ……………………………………………. 183
Table 11.3: The Regression Result of the Relations between the Government Stated Social Welfare or Non-Economic Objectives and SOEs’ Financial Performance during 2004-2010 Based on the SOEs Type Groups ……………………………………………………………………………………………… 186
Table 11.3: The Regression Result of the Relations between the Government Stated Social Welfare or Non-Economic Objectives and SOEs’ Financial Performance during 2004-2010 Based on the SOEs Type Groups (cont.) …………………………………………………………………………………… 187
Table 11.3: The Regression Result of the Relations between the Government Stated Social Welfare or Non-Economic Objectives and SOEs’ Financial Performance during 2004-2010 Based on the SOEs Type Groups (cont.) …………………………………………………………………………………… 188
Table 11.3: The Regression Result of the Relations between the Government Stated Social Welfare or Non-Economic Objectives and SOEs’ Financial Performance during 2004-2010 Based on the SOEs Type Groups (cont.) …………………………………………………………………………………… 189
Table 11.3: The Regression Result of the Relations between the Government Stated Social Welfare or Non-Economic Objectives and SOEs’ Financial Performance during 2004-2010 Based on the SOEs Type Groups (cont.) …………………………………………………………………………………… 190
Table 11.3: The Regression Result of the Relations between the Government Stated Social Welfare or Non-Economic Objectives and SOEs’ Financial Performance during 2004-2010 Based on the SOEs Type Groups (cont.) …………………………………………………………………………………… 191
Table 11.3: The Regression Result of the Relations between the Government Stated Social Welfare or Non-Economic Objectives and SOEs’ Financial Performance during 2004-2010 Based on the SOEs Type Groups (cont.) …………………………………………………………………………………… 192
Table 11.3: The Regression Result of the Relations between the Government Stated Social Welfare or Non-Economic Objectives and SOEs’ Financial Performance during 2004-2010 Based on the SOEs Type Groups (cont.) …………………………………………………………………………………… 193
Table 11.3: The Regression Result of the Relations between the Government Stated Social Welfare or Non-Economic Objectives and SOEs’ Financial Performance during 2004-2010 Based on the SOEs Type Groups (cont.) …………………………………………………………………………………… 194

xii
List of Tables
Table 11.4: The Regression Result of the Relations between the Governments Stated Social Welfare or Non-Economic Objectives and SOEs’ Social Welfare Representative Financial Performance during 2004-2010 Based on the SOEs Type Groups …………………………………. 196
Table 11.4 : The Regression Result of the Relations between the Governments Stated Social Welfare or Non-Economic Objectives and SOEs’ social Welfare Representative Financial Performance during 2004-2010 Based on the SOEs Type Groups (cont.) ……………………… 197
Table 11.4 : The Regression Result of the Relations between the Governments Stated Social Welfare or Non-Economic Objectives and SOEs’ social Welfare Representative Financial Performance during 2004-2010 Based on the SOEs Type Groups (cont.) ……………………… 198
Table 11.4 : The Regression Result of the Relations between the Governments Stated Social Welfare or Non-Economic Objectives and SOEs’ social Welfare Representative Financial Performance during 2004-2010 Based on the SOEs Type Groups (cont.) ………………………… 199
Table 11.4 : The Regression Result of the Relations between the Governments Stated Social Welfare or Non-Economic Objectives and SOEs’ social Welfare Representative Financial Performance during 2004-2010 Based on the SOEs Type Groups (cont.) ………………………… 200
Table 11.4 : The Regression Result of the Relations between the Governments Stated Social Welfare or Non-Economic Objectives and SOEs’ social Welfare Representative Financial Performance during 2004-2010 Based on the SOEs Type Groups (cont.) ………………………… 201
Table 11.4 : The Regression Result of the Relations between the Governments Stated Social Welfare or Non-Economic Objectives and SOEs’ social Welfare Representative Financial Performance during 2004-2010 Based on the SOEs Type Groups (cont.) ………………………… 202
Diagram 6.1 The Evolution of Indonesian SOEs’ structure and objectives 86 Appendix 1 …………………………………………………………………………………………………………………… 216
xiii
List of Abbreviations
AoA Articles of Association AnTam (PT) Aneka Tambang ASX Australian Stock Exchange BANAS Badan Nasionalisasi Perusahan-Perusahaan Belanda (Nationalisation Body for Dutch
Companies) BIN Bank Industry Negara (State Industry Bank) BNI Bank Negara Indonesia (State Bank Indonesia) BoC Board of Commissioners (Supervisory Board) BoD Board of Directors (Management Board) BPH MIGAS Badan Pengatur Hilir Minyak dan Gas Bumi (Indonesian Natural Gas and Oil Agency) BPU Badan Pimpinan Umum (General Management Board) BRTI Badan Regulasi Telekomunikasi Indonesia (Indonesian Telecommunication Regulation
Agency) BTC Bank and Trading Corporation BULOG (Perum) Badan Urusan Logistik BUMN Badan Usaha Milik Negara (State-Owned Enterprises) Coeff. Coefficient CSR Corporate Social Responsibilities CTC Sumatera Banking and Trading Corporation Comm. Community DJB De Javasche Bank EAT Earning After Tax EBT Earnings Before Tax EBIT Earnings Before Interest and Tax EMBO Employee Management Buy Out GDP Gross Domestic Products Gov. Government HT Hari Tua (Pension/type of insurance) IBW Indonesische Bedrijvenwet ICW Indische Comtabiliteitswet INPRES Instruksi Presiden(President’s Instruction) INTP (PT) Indocement Tunggal Prakasya IPO Initial Public Offering IMF International Monetary Fund Jamkrindo (PT) Jaminan Kredit Indonesia JSX Jakarta Stock Exchange KEPPRES Keputusan Presiden (President Decision) KMK Keputusan Menteri Keuangan (Ministry Of Finance decision) Ln. Natural Log LoI Letter of Intent Mgt. Management MSOE Ministry of State-Owned Enterprises NV Naamloze Vennootschap ( Dutch Public Company) OECD Organization of Economic Cooperation and Development ORI Oeang Republik Indonesia PELNI (PT) Pelayaran Nasional Indonesia Perjan Perusahaan Jawatan (Bureau Enterprises) PerMen Peraturan Menteri (Minister Rule) PerPRES Peraturan Presiden ( Presiden Rule) Persero Perseroan Terbatas (Limited Liabilities/commonly used to differ the status of SOEs as
limited liability owned by state) Perum Perusahaan Umum (Public Company)
xiv
List of Abbreviations
Peruri (Perum) Percetakan Uang Republik Indonesia PGN (PT) Perusahaan Gas Negara PNRI (Perum) Percetakan Negara Republik Indonesia PP Peraturan Pemerintah (Government Rule) PPA (PT) Perusahaan Pengelola Asset PKBL Program Kemitraan and Bina Lingkungan (Community Development through
Cooperative and Environmental Programmes) PPKI Panitia Persiapan Kemerdekaan Indonesia (Committee for Indonesian Independence) Pertamina (PT) Perusahaan Minyak Nasional Pred. Prediction PSO(s) Public Service Obligation(s) PT Perseroan Terbatas (Limited Liability) PTBA (PT) Tambang Batubara Bukit Asam PT PP (PT) Pembangunan Perumahan ROA Return on Assets ROE Return on Equity RUP Rencana Urgensi Perekonomian SGS Société Générale de Surveillance SOE State-Owned Enterprise SO Strategic Operation SPO Strategic Partnership Operation SS Strategic Sales TAP MPR Ketetapan Majelis Permusyawaratan Rakyat (The Assembly House Rule) Tbk Terbuka (open/to indicate that the company is publicly listed) Telkom (PT) Telekomunikasi Indonesia USA United of State America USO Universal Service Obligations UU Undang-Undang (Act) UUD Undang-Undang Dasar (Constitution)

1
Chapter 1:
Introduction
This thesis examines to what extent the Indonesian Badan Usaha Milik Negara (BUMN), or State-
Owned Enterprises (SOEs), are successful vehicles for attaining their government’s socio-economic
and financial objectives, as reflected by their financial performance. The motivation for this study is
the importance of SOEs in national economic and socio-political spheres, particularly for countries
like Indonesia, even after the companies have been privatised. Further, as shown in Chapter 6, SOEs
are very sensitive to the dynamics of social and political change and market situations. To evaluate
whether Indonesian SOEs are successful at attaining their government’s objectives, three areas to be
examined are:
1. The evolution of SOEs in relation to the historical changes in government-stated objectives for
SOEs
2. The implications of privatisation policy, and partial privatisation, on the government-stated
objectives for SOEs
3. The potential for Indonesian SOE objectives to be in harmony or conflict.
The main focus of this historical path analysis is the evolution of government-stated objectives for
SOEs and their implications. Meanwhile, the main foci of the interpretive and content analyses are
the Indonesian SOE objectives in practice following the implementation of privatisation policy. In the
final part of this thesis, the implications of government-stated objectives on SOE performance will be
the focus of empirical and quantitative analysis.
1.1 Background and Motivations
A major motivation for this study arises from the significant contribution of SOEs to Indonesia’s
economic development and social welfare. Some studies of Indonesian SOEs indicate changes in SOE
structure and financial performance after the introduction of Indonesia’s privatisation policy
(Indrawati, 2002; McLeod, 2002a; 2002b; Nugroho R and Wrihatnolo, 2008; Siahaan, 1996;
Sugiharto, 2005; Sutojo, 1996; Wang, 2005; Yonnedi, 2010). However, there has not been any
systematic analysis of the implication of policy changes regarding SOE objectives particularly the
government-stated objectives for SOEs. This is important, because objectives influence outcomes by
determining actions selected by actors or organisations (Boyd and Levi, 1996; Granger, 1964).
Meanwhile, several prior studies of SOEs show that as government bodies, SOEs have the potential
to carry multiple or mixed objectives that may have policy implications (Chang & Wong 2009;
2
Javidan & Dastmalchian 1988; Lawson 1994). This section provides a brief literature background and
examines why government-stated objectives are important particularly for the Indonesian SOEs.
1.2 Literature Background
SOEs often accomplish the requirement to meet both social welfare and commercial objectives.
Socio-political objectives usually pertain to an SOE’s specific product (Bai et al., 2000; Boardman et
al., 1986; Boardman and Vining, 1989; Chang and Wong, 2009; Janet, 2006; Shirley and Xu, 1998;
Shleifer, 1998; Shleifer and Vishny, 1994; Willner, 1999), while maximising public welfare is a major
role of the government. Due to the political costs of establishing specialised agencies to provide
public goods and services, governments often use SOEs to pursue their social welfare function,
including public goods and services (Bai et al., 2000; Levy, 1987; Martin, 1996; Shirley and Xu, 1998;
Willner, 1999). The provision of public utilities is a common example, which also supports the roles
of SOEs in developing markets and industrialisation (Bhatt, 1984; Caporaso, 1982; Yu, 2001). The
failure of markets in developing countries to provide public utilities, reflecting economic
development and political uncertainty, becomes a major reason for governments to establish and
control SOEs (Martin, 1996; Shleifer and Vishny, 1994; Yu, 2001). In many countries, SOEs are
commonly used to improve national economies and social welfare services where private
enterprises lack the resources or volition to participate in such projects (Bai et al., 2000; Kaur, 2004;
Yu, 2001). Meanwhile, in some countries, the role of public enterprises is limited to acting as
subsidiaries of private or foreign investors (Sobhan, 1979b) for the provision of public utilities or to
facilitate national economic development, which historically have been held or operated by the
state.
Change in market economy conditions has changed government roles and functions regarding the
provision of public utilities. Privatisation, for example, is most likely to break up SOE monopolies or
to reduce government involvement. This may drive market competition, where profit and efficiency
objectives become the public and government’s main concern in relation to government financial
support and privileges. Compared to private entities, SOEs are distinguished by holding monopolies
and privileges from the government. This support is commonly a major cause of public and
government pressure for SOEs to present their profit and efficiency performance. In contrast, this
requirement is not easy to achieve while the enterprises are also controlled by the government as
the owner, with the main purpose for enterprise is the provision of social and public services (Levy,
1987; Ramamurti, 1987). Many SOEs are created to fulfil the provision of public or community
services that historically originated from government regulatory or legislative initiatives (Martin,
1996). In many instances, providing social and public services may decrease SOE profitability
(Boardman and Vining, 1989; Boardman et al., 1986). Willner (1999) demonstrates that maximising
3
welfare is associated with high unit cost in public firms (Willner 1999: p. 144). Another study shows
that the cost of decision and selection for public enterprises is different from private enterprises,
since they do not depend fully on decision-makers (Aivazian et al., 2005). Socio-political spheres are
considered to have an impact on the government and SOEs’ action or decision. Although the
government may treat the provision of public or community services indifferently, providing public
or community services through public service obligation (Thompson, 1995) may still cause a financial
burden that is greater than the SOEs’ income. This situation leads to a requirement for government
subsidies. Martin (1990) states that community service costs have not always been directly or fully
reimbursed by the government (Martin, 1996). In the case where the fund is budgeted, social service
delivery is taken into consideration for overall budget allocation (Martin and Parker, 1995).
Government subsidies may potentially burden SOEs’ financial performance when pressure for
providing community service becomes a priority, but costs are not fully or directly reimbursed
(Martin, 1996).
Besides their roles and function, SOEs are also different in terms of their relationship with their
owners. Unlike private enterprises, SOEs commonly deal with bureaucrats who act as shareholders
on behalf of government (Chang and Wong, 2009). Aharoni (cited in Levy 1978) argues that SOEs are
potentially commanded by multiple principles and a variety of perspectives (Levy, 1978: p. 77). SOEs
are likely to operate as instruments of bureaucracy, based on connectedness with business groups
and operating industries, which are strictly regulated. Consequently, they tend to perform poorly
and are also poorly managed (Abeng, 2002; De Castro et al., 1996; Gylfason et al., 2001; Mardjana,
1995). Conflict between their political, public interest and commercial objectives may arise from a
variety of commands from several different ministers, or the fact that they operate under specific
constraints (Abeng 2001; Bai et al. 2000; Lawson 1994; McLellan 2005; Mardjana 1992; Shirley
1999). The functions of regulator and owner potentially conflict when the SOE’s economic purpose
encounters regulation constraints, or when different agendas originate from different ministerial
portfolios (Abeng, 2001; McLellan, 2005). McLellan (2005) concludes that when a company has
unclear residual claimants it will operate less efficiently (McLellan 2005: p. 116). The right to control
and claim the benefits that are usually associated with ownership is irrelevant for SOEs. Since SOEs
commonly deal with several ministries, there is no single entity that can clearly claim an SOE’s
benefits from its operational activities (Jim Brumby, 1997; Shirley, 1999). As government enterprises,
their decisions are commonly predetermined by the influence of socio-political objectives, rather
than the economic objectives of the current regime (Arens & Brouthers 2001; Chang & Wong 2009;
Chen et al. 2009; Shleifer & Vishny 1994; Yonnedi 2010). This situation not only causes SOEs to hold
multiple objectives, but also has implications for their performance.
4
As a consequence of these relationships and roles, SOEs potentially have mixed or multiple
objectives. Mixed objectives can be a major problem because prioritising profit conflicts with
delivering services to the public at acceptable prices (Bai et al. 2000; Boardman et al. 1986b; Chang
& Wong 2009; Shirley 1999; Shleifer & Vishny 1994; Willner 1999). The dominance of national and
public interests over commercial objectives potentially contributes some ambiguity to the SOEs’
objectives and strategic plans (Ramamurti, 1987; White, 2002; Yonnedi, 2010). Meanwhile, the SOEs’
objectives are commonly devised in a general form and vague statements (Ramamurti, 1987; Zif,
1981; Yonnedi, 2010). Levy (1987) comments that objectives pursued by SOEs are commonly are not
well defined (Levy 1987: p. 76). Even though SOEs’ objectives may engage with the government
goals to provide national welfare, relating the SOEs’ objectives to government direction is made
difficult by the convoluted political process of accommodating national goals, political interests and
public interests.
In summary, SOEs objectives are determined by the government functions and SOEs roles in the
provision of public utilities and national socio-economic development. These functions and roles
create mixed or multiple objectives which potentially conflict. Meanwhile, bureaucrats, politicians,
political processes and the public exert influences on the selection and determination of objectives
for SOEs. These influences cause the objectives to often be stated in general or vague statements
which raise several interpretations. Later, changes in the market economy environment encourage
changes in the government policies and functions. These changes are identified as affecting the SOEs
roles and objectives in the provision of public utilities. Potential conflicting objectives and interest
amongst the government’s new policies, pressures from markets, and requirements to meet the
government’s and public’s social welfare expectations are the most common consequences of these
changes. Earlier studies in this area show that stated policies may appear to differ from the
government’s espoused objectives, suggesting more research is needed to better inform policy
development. The lack of studies concerned with government objectives for SOEs leave knowledge
gaps regarding the extent to which policy and market changes induce changes in government-stated
objectives for SOEs. The knowledge gaps this thesis seek to address include: the evolution of
government-stated objectives for SOEs in Indonesia, the extent to which the changes in policy and
market reforms generate conflict between various government-stated objectives for SOEs, and the
extent to which changes in stated objectives and the potentially conflicting objectives impact on
SOEs business activities and performance.
1.3 Indonesian State-Owned Enterprises in Brief
In the context of the theoretical background above, SOEs have important roles in national socio-
economic spheres dealing with various issues. The role of SOEs as government bodies providing
5
public utilities is in line with public and governmental pressure to be profitable and efficient. This
section illustrates how SOEs deal with mixed objectives and roles under the influence of government
in achieving their socio-political objectives as well as their commercial or financial objectives, as in
Indonesia.
The importance of SOEs in current Indonesian economic development is largely affected by their
historical roles in the socio-economic sphere. SOEs involvement in Indonesian economic
development occurred when the government had to take control of economic and political authority
to achieve national socio-economic stabilisation. The economic roles of SOEs were revealed in their
roles in Indonesian economic growth (Hill, 2007). When the market orientation policy was
implemented and the government role was limited, Indonesian SOEs still played significant roles in
both economic and social welfare development (Abeng, 2001; 2002; Diah, 2003). Their involvement
in major industries, such as defence, banking, transportation and telecommunication has strategic
implications for the nation (Diah 2003; MSOEs 2011; Siahaan 1996; Sugiharto 2005; Sukardi 2002).
Some contributions have been made by Indonesian SOEs to improve their market capitalisation and
national economic activities during the period of this study. Focusing exclusively on the period
2007—2010, the total SOE contribution to capital expenditure in 2007 was Rp. 91 trillion (Djalil,
2008), which increased to Rp. 354.89 trillion in 2008 (equivalent to 32.9 per cent of the total market
capitalisation) (Wibowo and Nurlaila, 2009). In 2008, Indonesian SOEs made Rp. 79.27 trillion profit
from their total assets of Rp. 2.040.26 trillion. SOEs contributed about 24 per cent of Indonesian
Gross Domestic Product (GDP), around 25 per cent of income tax for Rp. 200 trillion, and a Rp. 29.09
trillion dividend for the state budget (Gunarto and Aditya, 2009). In 2009, with total SOE assets of
Rp. 2,252 trillion, Indonesian SOEs contributed 40 per cent of total national GDP from Rp. 993.20
trillion of their profit, Rp. 26.1 trillion from dividend payments, and Rp. 92.3 trillion from taxes, equal
to 15 per cent of total national taxes paid (MSOEs, 2011; MoCommunication, 2010). Meanwhile, the
Jakarta Stock Exchange (JSX) reported that the capitalisation from 14 listed SOEs by December 2008,
as mentioned previously, reached Rp. 354.89 trillion, equivalent to 32.9 per cent of the total market
capitalisation (Wibowo and Nurlaila, 2009). Total capital expenditure in 2009 was Rp. 637 trillion, or
31.57 per cent of total market capitalisation (Aliya, 2011; MSOEs, 2011). Total SOE capitalisation at
the JSX in 2010 was Rp. 818 trillion, equal to 23.30 per cent of total market capitalisation (MSOEs,
2012). Data in 2011 indicates that the 18 listed SOEs on the JSX reached a total capital of Rp. 837
trillion, equalling 26.8 per cent of total market capital (Burhani, 2011). Based on these data, SOEs
continue to make significant contributions to the Indonesian economy.
In addition to their economic roles, Indonesian SOEs also play an important role in the social welfare
sphere. The social role of Indonesian SOEs arose as a consequence of Article 33 of the 1945
6
Constitution of Indonesia, which highlights the importance of controlling natural resources and
production by government authority (Abeng 2001; Diah 2003; Indonesia 2002; Ruru 2006; Mardjana
1992). In addition, Article 34 of the 1945 Constitution of Indonesia underlines the requirement and
importance for the state to provide and be responsible for the social security system and public
utilities (Constitution, 1945; Higgins, 1958). These indicate that government should remain in the
SOE business. In practice, the social roles include being the main investor in public infrastructure,
such as roads, seaports and telecommunications; and the operator of public utilities such as
electricity, postal services, water and fuel (Abeng, 2001; Yonnedi, 2010) still part of the SOEs’ roles,
even though many Indonesian SOEs do not carry a PSO. These requirements to provide public
utilities and social welfare are also part of the centralisation of economic policy under the
government. Up to now, the majority of Indonesian industries were still under government control
(PerPRes Negatif List Investasi no 36/2010), through SOE roles. This control policy became a major
issue for the government when it was later required to privatise the SOEs.
The requirement to improve SOE performance and resolve the Indonesian economic situation
following the fiscal crises ensured that privatisation was the government’s most important economic
policy. Privatisation has become an economic policy since the 1966 financial crisis, analysed in detail
in Chapter 7. Privatisation became the most conventional economic policy when the International
Monetary Fund (IMF) pressured the Indonesian government to implement it to qualify for economic
recovery assistance. Intensive privatisation began in 1998 when the government separated
regulatory and shareholder functions to speed up the privatisation process (Abeng, 2001; 2002; IMF,
1997a; 1997b). The centralisation of the SOEs under the Ministry of State Owned Enterprises was
mainly aimed at improving SOE performance, eliminating bureaucracy and speeding up the
privatisation process required to resolve the national economic situation (Abeng, 2001; 2002). In
practice, conflict between economic and regulatory constraints still arose when the government
undertook privatisation. In many cases, privatisation followed the removal of SOE privileges and
monopolies for the provision of public utilities, which engages with the government and SOEs’ social
welfare duties. One example is the privatisation of PT Angkasa Pura II (Airport Company). Planning
for the privatisation of PT Angkasa Pura II began in 1998 (DiBiasio, 1998; Sukardi, 2005). This
privatisation aimed to improve company performance and efficiency, as well as to support the state
budget. In practice, social welfare objectives, as stated in the 1945 Constitution of Indonesia and
Undang-Undang Penerbangan no. 15/1992 (Aeronautical Act no. 15/1992/UU Penerbangan)
hindered this privatisation plan. The Act states that aeronautical activities are public service
facilities, with consequences for national security and assimilation objectives (UU Penerbangan,
1992). Consequently, the government, or SOEs on behalf of the government, are the only authorities
7
allowed to provide airport service and management (UU Penerbangan, 1992). Privatisation is not
appropriate for providing airport services; consequently, privatisation of PT Angkasa Pura II has been
postponed until these laws are amended.
Privatisation is still an important issue for the Indonesian government in the context of its control
policy. The requirement for government to reduce its involvement in SOE business activities and
decision-making processes does not sit easily with Indonesian SOEs. Although most transfer
ownership is undertaken for less than 49 per cent, some SOEs commence their public listing by
issuing new shares. This is done to maintain majority control by the government. This also indicates
the requirement for fresh funding is mostly aimed at internal company purposes, such as investment
or business expansion, and that this transfer of ownership does not disadvantage the government’s
control or ownership structure. The requirement to retain control also encourages the government
to issue golden shares, or Saham Dwi-Warna (Dual Colour Share–Red and White), as an alternative
for the government to retain control and regulate SOEs.1 Ramamurti (1999) argues that
governments retain control through golden shares, providing concession or holding board seats, as
most SOE activities operate within imperfect market competition, and the government still needs to
anticipate changes that may affect the national economy (Ramamurti, 1999). In practice,
government golden share ownership becomes a barrier for publicly listed SOEs in meeting
international capital markets’ corporate governance requirements (AnTam, 2004; 2005; 2006; 2007;
2008; 2009; 2010).
As part of the control issue, privatisation in Indonesia has created the opportunity for the
government to emphasise the importance of financial objectives. An increasing possibility of
maximum shared ownership by the public through privatisation in Indonesia relates to the
development of economic objectives, which are part of the requirement for SOEs to fully implement
for corporatisation. External pressure from the IMF through the ‘Letter of Intent’ (Wise, 2002)
emphasised intensive implementation of corporatisation as part of the fast-track privatisation
programme. The government emphasises this implementation by noting the importance of SOEs
profitability and efficiency, through the introduction of Undang-Undang Badan Usaha Milik Negara
no. 19/2003 (SOEs Act no. 19/2003/UU BUMN No 19/2003) and Peraturan Pemerintah (PP) no.
33/2005 tentang Privatisasi (Privatisation Rule no. 33/2005/PP Privatisation no. 33/2005). Profit and
efficiency objectives are applied to all SOEs, including Perum and Persero, with PSO duties. In
practice, the implementation of new objectives is not easy. Problems appear when government still
1 Saham Dwi-Warna (Red–White Share/Golden Share Ownership) is a single share owned by government,
which specifies voting and veto rights (TELKOM, 2008. PT Telekomunikasi Indonesia Annual Report 2008, Bandung: PT Telkom Tbk.). The share is named after the colors of the Indonesian flag: red and white, usually called the two-color or Dwi-Warna.

8
uses SOEs as a vehicle for social welfare functions. A number of SOEs still deal with conflicting
objectives due to government requirements and bureaucratic involvement in their business, also
requiring SOEs to achieve other objectives (Abeng, 2001; 2002, AnTam, 2004; 2005, Chandola, 1976;
Siahaan, 1996; Wicaksono, 2008). An example is the requirement for SOEs to participate in national
energy and food sustainability programmes (MSOEs, 2012; Sugiharto, 2005). The potential for
conflicting objectives occurs when new objectives differ from existing objectives (Manzetti, 2003).
State ownership and multiple objectives are identified as the major reasons for SOE inefficiency. The
privatisation policies are a pathway for reducing government control, and the introduction of the
financial objectives for SOEs. In practice, this also becomes a factor for emerging conflicts of interest
and policies. This brief background description holds that, in practice, multiple objectives create
some potential conflicts that significantly affect SOEs’ business activities. Privatisation as part of the
government reform program for SOEs does not work as expected as it is constrained by the 1945
Constitution of Indonesia provisions regarding the control of resources. From this situation, the
knowledge gap is found as privatisation conceptually aims for reducing government involvement
within SOEs, the case of Indonesian SOEs shows that privatisation creates some potentially
conflicting objectives which encourage the Indonesian government to conduct partial privatisation
to accommodate external and constitutional pressures. The Indonesian situation also leaves
knowledge gaps about whether partial privatisation and the introduction of new policy regarding
SOEs objectives following privatisation alter the government objectives for SOEs. This situation is the
motivation for, and background of, this thesis: to what extent are SOEs successful vehicles for
attaining their government stated objectives, particularly after the introduction of privatisation
policy.
1.4 A Framework of Study
This section provides the framework for the main area of analysis in this thesis. The three main areas
of the focus of this section are historical path, SOEs, and government-stated objectives. This section
is provided to guide a broader scope to the analysis. At the beginning of this framework, it is
important to set a theoretical boundary as the guidance for the analysis process. The theory is used
as a guide to analyse how the influence of changes and policy implementation on particular
sequence period has effects on the organisation economic performance. The basic theory relies on
the influence of institutions and the organisation in adjusting the dynamic of change and the roles of
information (North, 1990). Following the theory, the concepts of SOE and government-stated
objectives are developed as the foci of analysis. There are two main foci on institutional change
theory; the organisation and institution. Organisation is the player on the process of change. The
organisation exists when the opportunity set and the aim of its existence is to meet the objectives
9
(North, 1978). Meanwhile, an institution is defined as a constraint that structures the interaction
which may be followed by the enforcement (Mantzavinos et al. 2004; North 1991; 1993;
Landesmann and Pagano 1994). An institution is developed from a mix between formal and informal
constrain; and the enforcement characteristic that are created or elaborated over the time (North
1990; 1994; Mantzavinos et al. 2004). The interaction between organisation and institutions starts
when the changes happened. This institutional change is a result from the interaction between
institutions and organisation (North, 1995). Later, historical path which developed from path
dependence is used to guide the analysis of these changes. Path dependence is selected as it focuses
on sequence events that formulate the current or later events (Liebowitz and Margolis 1995;
Ebbinghaus 2005). Therefore, this section aims to specify the area of analysis to eliminate an overly
board scope of the subject that may appear during the analytic process.
1.4.1 Institutional Change Theory : Path Dependence
The selection of path dependence from institutional change theory is reasoned by the importance of
changes sequence events in the past that affect to the current economic performance. For this
thesis, path dependence is employed as a reference to develop the historical path which is explained
in detail in Chapters 3 and 5. This is mainly when the institutional change theory is used to
understand how the path of institutional change occurred. For this analysis, the path of institutional
change is a guide to analyse the changes of organisation, or SOEs, to the current situation or
structure and objectives. The process of change may occurs in two different ways, discontinuation or
incrementally. There are several factors that may lead to different results or patterns that develop
during the evolution process (North, 1990). In his study, Mahoney (2000) highlights three important
feature of path dependence: the earlier part of sequence, the earlier event, and causal pattern or
inertia that set the motion and tracks for the outcome (Mahoney, 2000). Ebbinghaus (2005) notes
two different interpretations of the analysis; trodden trail as when the spontaneous selection of a
path is used as repetition of a subsequence; and road junction when the branching point is an
available alternative or selection option selected in order to continue the journey (Ebbinghaus,
2005). Meanwhile, Mahoney (2000) adds two types of sequences; self-reinforcing sequence is
characterised by particular institutional patterns results from long term and fix formation, while
reactive sequence is when the event on the sequence is a reaction from independent or causally
occurs events (Mahoney 2000: pp 508-509). These indicators path of institutional changes are used
to guide the analysis of this thesis in the contexts of the evolution of the government-stated
objectives for SOEs as well as the structure of SOEs.
10
1.4.2 State-Owned Enterprises: Definition
As mentioned in the pervious section, Section 1.4, SOE as an organisation is the focus of analysis on
this thesis. It is important for this thesis to set boundaries for the SOE in term of definition. The
reason is SOE is not easy to model due to the influence of various factors; perspective and term are
used to determine or define the SOE. Haririan (1998) notes that SOEs can be defined based on the
author’s own view (Haririan, 1989). For some people, SOEs can be government entities run for
providing public goods and service, while others claim they are government entities for profit-
making objectives (Gillis, 1980). SOEs can also be defined based on their relationship with the
government as the principle shareholder or stockholder. According to their relationship with the
government, definitions develop in various ways from the legal system, relating to board
appointments and government utilities (McLellan, 2005), the government’s role (OECD, 2005b), the
ownership structure (Gillis 1980; 2003; OECD 2005) as well as their own role and function (Lawson,
1994; Martin, 1996). Gillis (1980) notes that in some categories the definition of an SOE is based on
particular factors, such as the government being the principle stockholder, the provision of goods
and services, and policy matters (Gillis, 1980). As a mixed entity between the private and
government sectors, SOE structures and objectives are commonly influenced by both sectors. This
also makes SOEs institutionally different from other economic entities, such as private companies or
government departments.
For this thesis, the government is the main factor setting the scheme or model for Indonesian SOEs.
This is intertwined with the government’s roles and functions, which are underpinned by the 1945
Constitution of Indonesia. Although policy and the provision of public utilities can still be considered
as the government’s motives to establish SOEs, some Indonesian SOEs are no longer providing public
utilities. A number of studies support the role of SOEs as no longer being limited to the public goods
area (Gillis, 1980); for example, banking, trading and hotels (Tynan 2003; Willner 1999). For the
purpose of this study, an SOE is defined by following the Indonesian definition:
An enterprise whose capital is wholly or for the major part owned by the state through direct placement originating from reserved state assets (UU BUMN, 2003).2
This definition clearly emphasises government ownership. However, a substantial part of this
analysis is concerned with the impact of partial privatisation, which has ensured that some SOEs’
ownership structures are different. For the purposes of this study, new structure has been
developed accommodate this situation. In order to eliminate potential ambiguous definition appears
2 This definition based on the UU BUMN no 19/2003 (SOEs Act no. 19/2003), from the unofficial translation by
the USAID-MSOEs privatisation project.

11
in relation to the Persero structure when it engages with privatisation issues, as the ownership
structure changes; an extended definition of SOE in regard to the structure is required:
SOE in the form of a limited liability company which capital is divided in shares that are wholly or minimally 51 per cent owned by the State of the Republic of Indonesia with the principal objective of seeking profit (UU BUMN, 2003).
This definition is important to provide a broader government structure, which may be found during
the analysis process. Only a company that has 51 per cent or more of central government ownership
is categorised as an SOE.3
1.4.3 Government-Stated Objectives : Definition
Part of the analysis in this thesis is the evolution of government objectives. The changes of SOE’s
structure may have a relationship with the changes of government objectives. Therefore, it is
important to set boundaries for the government-stated objectives. In common practice, corporate
objective is commonly defined as the required expectation from all the purposed activities of
particular organisation such as company (Sundaram and Inkpen, 2004). In many cases, the objectives
of an organisation are largely determined by the founder and for particular purposes. The case of
SOEs where the objectives are determined by the government as the founder, it is possible for the
government set certain goals to be part of the corporate objectives. A difference in SOE structure
and the establishment rationale constitutes a requirement to have specific objectives from the
government. Determining the government objectives for SOEs is mostly influenced by the SOEs’ role
and function in national socio-economic development, as well as the change in institutional
environment. However, in particular cases, SOEs are also established to counter certain institutions,
as shown previously in the background section of this thesis. This also ensures that SOE structures
are different from other organisations, such as government departments or private entities. The
most common implication of this ownership structure is the potential for SOEs to carry multiple or
mixed objectives, which might differ from their original or existing objectives (White, 2002).
The influence of state ownership presents different perspective on the SOE’s objectives. The
provision of public utilities and national economic development are the dominant factors underlying
the government’s decision to establish SOEs, which later becomes the driving factor for the
government to set up socio-political objectives for SOEs. In traditional views, SOE objectives engage
with the requirement to meet government social welfare maximising objectives (Bai et al. 2000;
3 The emphasis on an ownership structure with 51 per cent or more of central government ownership is
important. Two industrial estate companies (PT Jakarta Industrial Estate and PT Surabaya Industrial Estate Rungkut) are excluded from the analysis because the central government has only 50 per cent of the ownership, while the other 50 per cent is owned by regional or city governments, and they are not considered as SOEs based on the UU BUMN.
12
Boardman et al. 1986a; Gillis 1980; Hanschen & Erspamer 2004; Shleifer & Vishny 1994; Willner
1999; Ramamurti 1987). SOEs are also encouraged to reconcile with the government’s socio-political
objectives. For example, an SOE must provide infrastructure in a certain rural area/community. This
objective may focus on a particular needy community; however, because the public has needs, it
tends to be understood collectively (Hamzah, 2007). SOEs also have to carry certain non-economic
objectives, which still relate to industrialisation or national economic development, such as
employment, state budget or public utility facilities (Boardman et al. 1986a; Gillis 1980; Ramamurti
1987). These objectives are considered to be the government social welfare or non-economic
objectives for SOEs. For the Indonesian SOEs, the social welfare or non-economic objectives are all
the government expectation statement from the SOEs purposive activities in socio-economic
spheres.
In addition to their social welfare objectives, SOEs have financial objectives. These have mostly
developed since the SOE is considered as a business entity. The development of financial objectives
are mostly influenced by the private entities whose run in the same business area. In a general
context, financial objectives can be defined as both direct and indirect, with implications for cost
(Keeney, 1988); while for general business entities, financial objectives commonly engage with
profit. For business entities, profit seeking, or maximising profit, is a natural economic or financial
objective (Ansoff, 1965). In fact, there is a difference between ‘profits’, as excess of revenue over
cost, and ‘profitable’, as a measure of return on resources (Ansoff, 1965), which is not clearly stated
as part of the SOEs’ obejctives. For the Indonesian SOEs, the economic objectives are all the
government expectation statement from the SOEs purposive activities which has financial or cost
implications. Because of the financial or cost implication, the economic objectives, for this study, are
included the financial objectives. As the main focus of this study is to examine the government
objectives as stated on the establishment rules for the SOEs, it is defined as the government-stated
objectives.
1.5 Research Methods
The research design has been developed based on research questions as well as the availability of
and access to data. The main concern of this research is to examine whether SOEs successfully meet
their government-stated objectives. Due to political sensitivities that may potentially arise as a
consequence of using methods such as surveys, case studies or observation; historical path analysis
with interpretive and content analysis are selected as the most appropriate methods. This is
particularly since the majority of data are from publicly available sources. Historical path analysis is a
method that analyses the changes (Mahoney, 2004) continuously over time by focusing on the time,
process, and causes (Thompson, 2009). Meanwhile, interpretive and content analyses investigate
13
and analyse the deep meaning or message of documents and archives which are used for further
analysis or study (Bearman, 1995). For this study, government documents, SOEs annual reports and
regulations in relations to the government objectives for SOEs are used.
There are three processes of analysing data to answer research questions. The historical study
provides the first stage of analysing the evolution of the objectives, followed by the content and
interpretive analyses to examine the implications of the policies and objectives. The last stage is an
empirical study, based on the findings of the previous analysis in this study. This is then followed by
quantitative analysis, to test the relationships and implications of the objectives on performance.
Since the main goal for this study is to examine the success of SOEs at attaining their government-
stated objectives, the test will focus on the reflection of government-stated objectives on SOEs’
performance. This last stage of quantitative analysis will develop in detail separately in Chapter 5 as
part of the performance analysis.
1.5.1 Historical Path Analysis
The aim of this study is to develop a map of government-stated objectives for SOEs and the
evolution of privatisation policy in Indonesia. This analysis will establish the background and patterns
of the relationships between SOEs and government, as well reconstruct the development of
privatisation policy in Indonesia. The study focuses on revealing the nature of government-stated
objectives for SOEs from government and SOE documents and archival history records.
Reconstructing policy from historical study has been selected to present a description of the nature
of the government’s objectives. Parker (2004) notes that historical study offers possibilities to
discover causes and consequences, to identify patterns and to deduct, infer and explain historical
events (Parker 2004: p. 144). The study begins by developing categories of objectives, as mentioned
on Appendix 1. Categories are used to distinguish items based on the nature of research and
particularities of data (Breg, 1989). The historical study relies on empirical material in chronological
order or sequence, where a complex case is described through reconstructing the past (Smith & Lux,
1993). Chronological or sequence events will provide a map of the evolution of Indonesian SOEs and
privatisation policy, which will also help to conduct further analysis into how the structure and
objectives evolved. Besides reconstructing the past, this method also allows researchers to discover
the causes and consequences of particular events which may sufficiently affect the end process.
These events may include intervening cases in relation to the analysis process (Mahoney, 2004).
Focusing on particular events may disclose more information that may enrich and support
reconstructing the evolution of SOEs and privatisation policy in Indonesia. Using literature
references also controls for problems that may arise due to misinterpretation or data complexity.
The data is analysed by developing the patterns, cause-and-effect relationships, consequences and
14
chronological list. Historical study, supported by interpretive and content analysis, offers benefits
not only in the technique, but also the potential to reveal the social and organisational context over
time (Duriau et al. 2007b; Parker, 1997). During archival analysis, problems may arise because of the
large time gap. The ‘snowball’ technique is used to trace related documents, based on current
references or records. The ‘snowball’ technique is also used to enrich data and narrow the analysis.
1.5.2 Implications of the Objectives
There are two main foci when examining the implications of the objectives. The first focus area is the
implication of privatisation policy on SOEs and the government’s objectives. Focusing exclusively on
privatisation policy, this study examines whether privatisation policy causes differences in
government and SOEs objectives and in the way the government oversees SOEs. The second focus
area is the Indonesian government policy in determining the objectives for SOEs after the
introduction of privatisation policy; whether in practice these are in harmony or conflict. Content
analysis and interpretive study are employed to reveal the implicit and explicit meanings of
privatisation policy, using documents and archival records for both SOEs and government. Berelson
(cited in Marshal & Rossman 2006) describes content analysis as an objective and neutral way of
obtaining a quantitative description of the content of various forms of communications; thus,
counting the mention of specific items is important (Marshall & Rossman, 2006). The choice of
content analysis is mainly rationalised by the importance of text (Duriau et al. 2007a). Neumann
(2006) suggests that content analysis can be used to reveal the unseen or difficult aspects of a text’s
content (Neumann, 2006).
Interpretive analysis is employed to help and understand the meaning and context of data.
Interpretive analysis is focused on the text as the object of study, which it is important for the study
to ensure the text is clear, coherent and makes sense (Myers, 1994; Maitland-Gholson and Ettinger,
1994). For this study, interpretive analysis is employed to support both historical and content
analysis based on archival records. As the main data for this study is based on government and SOE
public records, some records, such as regulation and law statements, are commonly vague and
ambiguous. Some statements may be written in general terms for a particular purpose. Therefore,
interpretation is important to ensure clarity and coherence. Meanwhile, the other reason to use this
method is that some records, considered as laws and regulations, can be interpreted broadly where
the sources and value of the policy may not be stated or interpreted explicitly (Furgeson et al.,
2008).
The study refers to the historical results for both the objectives of the SOEs and privatisation policy.
The objectives are categorised into the source of objectives and the type of objectives. Although the
main focus of analysis is the government objectives, the other sources of objectives may be included
15
as part of the analysis. Based on the source of the objectives, they are classified into three
categories:
1. The government-stated objectives as stated in the SOE’s rules at the time of their
establishment, including any further changes up to 2010.
2. The SOE or company constitution objectives as stated in the Articles of Association (AoA),
the organisation’s annual report or financial report.
3. The management’s objectives as stated in the company’s vision and mission.
The reason to develop this classification is that there are some indications of differences or gaps
among these institutional objectives, which become part of the analysis. The SOEs’ or company’s
objectives and management objectives are separated, as the preliminary findings reveal some
potential difference between these two objective resources. The literature is also used as a
reference to compare with the potential drivers identified to eliminate multiple interpretations.
Multiple interpretations may lead to difficulties in recognising the objectivities. Using the literature
references will also help to anticipate problems with data that may arise due to misinterpretation or
complexity.
1.5.3 Unit Analysis
The unit analysis for this research is government-stated objectives for SOEs. The Indonesian SOE and
government public information, such as annual reports, websites, press releases, regulations and
public archival records are the major data resources for this study. The study relies on archival
records; two different records are employed, public and private archival records. Since private
archives are potentially written for certain audiences and purposes, access may be either too
restricted or too broad; public archives, such as mass media or actuarial records, will help eliminate
potential problems with public data (Breg, 1989). The major target for data collection is divided into
two types. First, government regulations and SOE documents from 1945 to the present will assist in
examining the development of the SOEs. Second, SOE annual reports from the period 2004–2010,
will be used to examine the implementation of privatisation and corporatisation plans for SOEs, from
the 140 out of 141 SOEs in Indonesia that are required publish annual reports. In addition, this study
also concentrates on government documentation, particularly regulations that relate to industrial
concerns. Content analysis and interpretive analysis are important tools to support investigation of
the archival records, where data is permanently recorded. In practice, this tool also needs a clear
system and procedure to meet the reliability and validity criteria (Collis & Hussey, 2003).
16
1.6 Chapter Development
This thesis is presented in twelve chapters, as follows:
‐ Chapter 1: Introduction
The chapter consist of the motivation, framework and research method to analyse this thesis.
- Chapter 2 : Literature Review
The chapter reviews the SOEs reforms and comprehensive analysis regarding privatisation in various
regions.
- Chapter 3 : Framework of study
The chapter consist of nature of SOEs and government objectives as the main focus of research, and
framework of study for this thesis.
- Chapter 4 : Proposition and Hypotheses
The chapter consist of proposition and hypothesis development based on knowledge gaps identified
from literature review and framework of study.
- Chapter 5 : Research Methods
The chapter consist of method, unit analysis, data collection and data analysis which are used to
analyse and answer the research questions of this thesis.
‐ Chapter 6: The Evolution of Government-Stated Objectives for SOEs
The chapter examines the evolution of government-stated objectives and SOE structures. The study
in this chapter is largely historical description, based on the interpretive analysis. The chapter
describes the development of the SOEs’ structures and objectives, from Indonesianisation to
nationalisation, followed by the development of economic performance period under the
corporatisation eras. This chapter also analyses the implications of institutional environmental
changes in the structure and objectives of the SOEs.
- Chapter 7: The implications of Privatisation Policy and Partial Privatisation on the Government’s
Objectives for SOEs
The chapter examines the implication of privatisation policy and partial privatisation on the
government’s objectives for the SOEs. The chapter is largely based on historical description and
interpretive analysis of the government and SOE archives and records on privatisation policy in
Indonesia. The chapter emphasises the analysis of the evolution of privatisation and the implications
of policy in the current situation.
‐ Chapter 8: The Government-Stated Objectives in Practice: Publicly Listed State Owned
Enterprises Cases
This chapter examines the implications for the government-stated objectives and policies on the
practices of publicly listed SOEs. The reason to analyse publicly listed SOEs is based on a preliminary
17
analysis that indicated that the privatisation policy has directly affected the publicly listed SOEs. The
chapter identifies that these changes are not limited to structure and ownership; it also includes
some industrial policy implications that indicate the effects on the SOEs’ business activities and
decision-making processes.
- Chapter 9: The Government-Stated objectives in Practice: Non-Privatised State Owned
Enterprises Cases
This chapter examines the implications of the government-stated objectives and policies on the
practices of the non-privatised SOEs following the implementation of the privatisation policy. The
chapter builds on the results from Chapter 7, where privatisation policy was found to result in
certain indirect implications for non-privatised SOEs and the environment where these SOEs
operate.
- Chapter 10: The Relations between the Government-Stated Objectives and SOEs Financial
Performance
This chapter examines whether the SOEs are successful in meeting their government-
statedobjectives, as reflected by their performance. The chapter has two main foci, the evaluation of
the government-statedobjectives’ influence on SOE performance and the relationship between the
governments stated objectives and SOE performance. This chapter is developed based on the results
of the analyses presented in Chapters 6 to 9, as an empirical and quantitative analysis to support
these results, showing the reflection of the government’s objectives in SOE performance.
- Chapter 11: The success of SOEs in Achieving the Government’s Objectives
The chapter focuses on the multivariate test as the regression test to examine and estimate the
relations between the objectives and performance.
- Chapter 12 : Discussion and Conclusion
This chapter provides the discussion, main conclusion and results of this study, including
recommendations for future study and the limitations of this study.

18
Chapter 2:
Literature Review: Studies of SOEs
This chapter reviews the literature regarding the dynamics of SOEs in market economies where
market sensitivity and policy changes affect SOEs’ objectives and business activities. Public policy
reforms, privatisation, corporatisation and liberalisation often require the government to change the
ownership and management structure of SOEs. Earlier studies have identified that these changes
also affect their performance (Aivazian et al., 2005; Eric Williams, 2002; Guthrie et al., 2003; Shirley,
1999). Although there has been widespread research into SOEs’ performance, there have been
limited studies of public policy reforms regarding government objectives for SOEs.
This chapter aims to provide an understanding of the outcome of SOEs’ reforms in market
economies and key issues with respect to government objectives for SOEs. Government reform of
SOEs has been encouraged for various reasons, including inefficiency, political constraints and fiscal
problems (Guthrie and English, 1997; Yarrow, 1999). The reform of SOEs affects national economic
activities and the SOEs themselves. However, SOE reforms have been criticised for failing to resolve
social welfare issues (Ahmed, 1999; Bai et al., 2000; Currie, 2005; Eric Williams, 2002; Haque, 2001;
Kemal, 2000; Salih, 2000). Social welfare is a crucial issue in the transition of market economies
where SOEs have dominated socio-economic activities. High reliance on government support and
the provision of public utilities has impeded the implementation of SOE reforms (Bai et al., 2000; Eric
Williams, 2002). In practice, the failure of SOE reforms does not only occur in emerging market
economies. Studies have shown that some advanced market economies also fail to reform their
SOEs (Caves, 1990; Channon, 1980; Jenkinson and Mayer, 1988; Mazzolini, 1979; Perotti, 1995). The
effect of SOE reforms, in particular privatisation policy, is one of the main focuses of the review in
this chapter.
A part of SOE reforms is the development of SOEs’ objectives. Earlier studies have shown that SOEs
often need to have multiple objectives (Lawson, 1994; Mazzolini, 1979; Rousseau and Xiao, 2008;
Shleifer and Vishny, 1994). SOEs’ objectives are often very sensitive to changes in government
policy, as government policy is a double-edged sword for SOEs. SOEs are often used as a government
vehicle for implementing policy and regulation (Lawson, 1994; Ruys, 1988; Yu, 2001), and the
involvement of the government and politicians often creates overlapping and conflicting policies and
interests for SOEs to deal with. In practice, government policy is not the only factor that creates the
multiple and conflicting objectives. Markets influence SOEs’ activities and objectives (Sexty, 1980),
and different market economies can create different settings for SOEs’ roles and objectives (Ayub
19
and Hegstad, 1987). Social welfare objectives may not be the government or SOEs’ main concern in
advanced market economies (Lawson, 1994); however, the government and SOEs in emerging
market economies play a crucial role in providing social welfare and industrialisation (Ayub and
Hegstad, 1987; Caporaso, 1982; Hill, 1982; Yu, 2001). These differences are the main focus of this
literature review.
This review focuses on three different market economies by emphasising the implications of the
privatisation policy. The three market economies are: advanced market economies, Asian emerging
market economies and non-Asian emerging market economies. Meanwhile, the focus of the review
is the government’s role and policies for SOEs before, during and after reforms or privatisation.
Three different stages of reform are important in distinguishing the government’s role and policies
for SOEs, as well as the implications of reforms for new privatised firms. The different roles and
periods, as shown below, distinguish SOEs’ objectives. Through this review, these roles and reforms
are analysed to evaluate the extent to which the roles, policies and reforms alter the objectives. The
remainder of this chapter is separated into: SOE reforms as a general overview of privatisation, SOEs
in advanced market economies or developed countries, SOEs in non-Asian emerging market
economies, and SOEs in Asian emerging market economies. These sections are followed by a
conclusion to identify the key issues and knowledge gaps addressed by this thesis.
2.1. SOE Reforms: Privatisation
Earlier studies of SOEs emphasised the conceptualisation of SOEs as a government commercial entity
with social welfare objectives (Lawson, 1994; Mazzolini, 1979; Shleifer and Vishny, 1994). This
concept is a key point for the relationship between the government and SOEs, as it underlines the
differences between SOEs and private entities. Government involvement, for example, is justified as
part of the government’s authority (Lawson, 1994), which later generates ‘unfair’ treatment
between SOEs and private entities (Yu, 2001). The government’s involvement usually refers to
national economic development and social welfare (Boardman et al., 1986; Shleifer and Vishny,
1994; Yu, 2001), and it has been examined in the context of natural monopolies, economic planning,
stabilisation policy and the redistribution of power, income or wealth (Lawson, 1994). There is
evidence that SOEs are able to keep prices lower or affordable for the community, and for this, SOEs
often have captive markets and customers where the government provides privileges and protection
for SOEs to run their business (Mascarenhas, 1989). Consequenty, SOEs’ financial performance
remains a major public and government’s issue.
SOEs’ financial performance and their relationship with the government have received the most
attention in prior studies of SOEs where Inefficiency and poor performance were central concerns

20
(Bai et al., 2000; Boardman et al., 1986; Bozec and Dia, 2007; Chen et al., 2008; Shleifer and Vishny,
1994). SOEs’ multiple objectives have been identified as barriers for their performance (Chen et al.,
2008; Lawson, 1994; Ramamurti, 1987). Some studies showed that profit maximisation is not the
government’s main concern for SOEs (Boardman et al., 1986; Hanschen and Erspamer, 2004; Hill,
1982; Ramamurti, 1987). Besides multiple objectives, the literature indicates that ambiguity of
residual claim principals can lead management to operate inefficiently (Brumby, 1997; Shirley,
1999). An unclear identified principal is found through government functions where the government
is both the regulator and state representative owner or principal for SOEs. In practice, the
government also includes politician, bureaucrats and other government agents. This unclear
identified principal has two consequences. First, the involvement of politicians, bureaucrats or other
government agents brings different agendas for SOEs other than profit or economic objectives or
even the existing objectives (Chang and Wong, 2009; Ramamurti, 1987; Shleifer and Vishny, 1994).
These involvements also generate a lack of control and monitoring from the government. Earlier
studies regarding SOEs’ management showed that the government, politicians or bureaucrats might
not have sufficient knowledge to control or monitor SOEs (Shleifer and Vishny, 1994; Zif, 1981).
Despite a lack of knowledge to monitor SOEs, politicians still use SOEs for political and legitimacy
purposes (Shleifer and Vishny, 1994). Second, unclear identified principals make it difficult for these
principals to claim the economic effects of SOEs’ benefits or surplus (McLellan, 2005). Consequently,
the government may resist disciplining SOEs. This resistance is also a reason why the government
may keep SOEs running their business, even when the company consistently does not make any
profit (Hill, 1982).
Agency theory also emphasises the role of risk. The relationship of the agent and principal may
create interest differences that involve each institution’s risk (Eisenhardt, 1989). Risk sharing
emerges when the end result of business activities may affect each party differently. These effects of
risks determine each party’s selection regarding their actions and objectives (Eisenhardt, 1989).
Although separated functions between agent and principal are argued to eliminate the entire
control and claim of wealth domination (Jensen and Meckling, 1976), agency theory also shows that
this separation of control and function creates potentially conflicting interests when information is
crucial (Rees, 1988). Management as an agent may hold information to protect their interests.
Asymmetric information potentially produces conflicts between the agent and principal. It also
makes it difficult for the principal to hold agents accountable in relation to their obligations to meet
the target (Shirley, 1999). Stakeholder theory shows that management may take the interests and
concerns of the group or individual, who are the company’s stakeholders, into account when making
their decision (Buchholz and Rosenthal, 2004). Risk and interest govern the selection of agents and
21
principals’ actions and decisions. This situation is also found within SOEs. Risk and interest of SOE
managers may influence the selection of actions and decisions, in particular when the government
as the owner and stakeholder in involved in the decision-making process.
Separated functions of agent and principal have consequences for monitoring structure. Monitoring
structure in private entities commonly runs based on objectives set by the principals. Profit
maximising, which engages with managers’ benefits, is regularly informed or published by the
managers through firms’ performance report (Estrin and Pérotin, 1991). However, these things often
do not apply within SOEs. SOEs’ objectives are frequently stated in general or ambiguous statements
that raise several interpretations and implications. The objectives are commonly very sensitive to
change and also potentially in conflict. In some cases, SOEs’ objectives are also subject to political
processes (Estrin and Pérotin, 1991), which the government may not openly elaborate for public
sector firms (Wong, 2004). These objectives may lead to unsettled plans and monitoring
mechanisms that are often found within SOEs. Agency theory underlines the role of equity to
monitor management when the mechanism of control and monitoring fails to meet expectations (De
Castro et al., 1996). In practice, this mechanism does not work properly for SOEs. SOEs can ease to
get an access for their capital as a result of their relationship and protection from the government.
SOEs’ management has fewer risks because two major issues protect them: bankruptcy and take-
overs (OECD, 2005a; 2005b). These protections have some consequences. Bankruptcy and take-over
protection from the government cause less motivation for SOEs’ management to protect and
present their best interests (OECD, 2005b; Shleifer and Vishny, 1994). These protections also result
in a less attractive sanction and reward system, which provide an opportunity for SOEs’ managers to
carry out their own interests (Peng et al, 2003). These situations contribute to SOEs’ poor
performance and free rider issues, which may not be easy to resolve through privatisation only.
The phenomena of privatisation and corporatisation emerge as the result of public pressure for SOEs
to show better performance and efficiency. Privatisation and corporatisation have developed in both
advanced and emerging economies driven by two main reasons: the development of market
economies and the breakdown of the Soviet Communist regime. The development of market
economies is claimed to be a driving factor for corporatisation and privatisation (Christensen and
Pallesen, 2001). Privatisation is determined as a transfer of ownership or assets from state to private
ownership (Bortolotti and Faccio, 2009; Boubakri et al., 2009; Pangestu, 1990; Shirley, 1999).
Through privatisation, SOEs are expected to have better performance where new culture, economic
or financial objectives such as profit and efficiency become both the agent and principal’s concerns
(Willner, 1999). Through privatisation, the government is also encouraged to open its market, where
new privatised firms run their businesses for private and foreign participants (Chandola, 1976). This
22
means that both new privatised firms and private firms will compete fairly in market economy
spheres. Meanwhile, corporatisation has developed as a result of the development of a relationship
between agents and principals (Aivazian et al., 2005; Mueller, 1992). Agency theory emphasises that
changes of the ownership structure through privatisation generates the development of a new
structure and monitoring function mechanism (Bozec and Dia, 2007). Early studies argued that
corporatisation is also part of privatisation and/or modernisation of SOEs, which also aims to
improve SOEs’ performance (Aivazian et al., 2005; Christensen and Pallesen, 2001). Control and
monitoring mechanisms work through the roles of board, committee and auditor are considered to
improve firms’ performance and efficiency (Yarrow, 1999). This improvement occurs because
corporatisation requires SOEs to be more accountable and transparent.
The requirements for SOEs to be accountable and perform well have also become a major topic in
various discussions regarding SOE reforms. Besides privatisation, corporatisation is claimed as
another way to improve SOEs’ performance and efficiency (Aivazian et al., 2005). Corporatisation is
defined as efforts to make SOEs operate as private entities in a competitive market without
monopoly or strict regulation barriers (Shirley, 1999). This underlines that the government should
not support or protect SOEs when they run their business activities. In practice, the most common
result of corporatisation is through restructuring modern corporate governance structures where
the control and monitoring mechanism is crucial as part of the new corporate governance structure.
Separated functions between agent and principal are commonly followed by the introduction of a
control structure. A common practice of the control structure is through a contract mechanism
between SOEs’ management as the agent and the government as the owner or principal (Eisenhardt,
1989). Contract has become a standard of the corporatisation mechanism. An earlier study revealed
that management and regulatory contract mechanisms demonstrate better achievements for SOEs
to improve their performance when the market is competitive (Shirley, 1999). This shows that the
change in control structure, both internal and external, through privatisation or corporatisation,
affects successful SOEs in improving their performance and efficiency.
Besides performance improvement, privatisation is also driven by socio-political reasons. An
empirical study of privatisation showed four possible determinant areas for privatisation: political
preferences, hard budget constraints, influence of their legal structure regarding control policy, and
stock market development (Bortolotti and Faccio, 2009; Bortolotti et al., 2004; Errunza and
Mazumdar, 2001). These four determinant areas established the willingness of the government to
conduct privatisation. Less democratic states where the centralisation of control is under the
government or certain agents tends to show less interest in privatisation, while good functioning of
stock markets actively encourages the government to conduct privatisation (Bortolotti et al., 2004).
23
The most common reasons for privatisation are to strengthen the state budget or reduce
government involvement in SOEs (Errunza and Mazumdar, 2001). Hard state budget occurs following
high public debt when the government has to provide funds for the provision of public utilities. For
example, the case with the Australian government prior to 1992 showed that high government debt
motivated the Australian government to privatise the Commonwealth Bank and Qantas (Ryan,
2012). Privatisation is not only driven by internal or domestic nation interest. For some countries,
such as Brazil and Indonesia, privatisation arose from external pressure when their governments
engaged with international institutions such as the International Monetary Fund (IMF) and the
World Bank (Ruys, 1988). These backgrounds influence the end result of privatisation.
Legal structure and market economy environment present some influences on the success of SOEs’
privatisation. Different legal structures and socio-economic environments provide different
structures of ownership, which affect SOEs’ objectives and policy (Boubakri et al., 2005c; 2009).
Legal structure is argued to have significant effects on the willingness of the government to remove
its control and involvement in economic activities. An empirical study in both Civil and Common Law
structures shows that a Civil Law country is likely to have less privatisation compared to a Common
Law country (Boubakri et al., 2009). Governments in Civil Law countries have a tendency to hold
control of economic policy. A similar case is also shown in less democratic countries or countries
with external privatisation pressures. These tendencies and pressures affect the government’s
willingness to conduct privatisation. Later, this government willingness determines the new
structure of ownership and performance of new privatised firms (Ayub and Hegstad, 1987; Bortolotti
and Faccio, 2009). Besides legal structure, good functioning of stock market liquidity encourages the
government and firms to conduct privatisation (Bortolotti et al., 2004; 2005c). A less developed
stock market may encourage the government to privatise SOEs in order to improve market activities.
In practice, a less developed stock market causes asset transfer and the voucher distribution popular
privatisation method. Further analysis regarding this method is reviewed in detail in the following
sections in this chapter. The intensity of privatisation is also demonstrated through the
government’s relationship and control towards SOEs or new privatised firms, along with social
welfare issues.
This review shows that some SOE issues motivate governments to reform their SOEs. Earlier studies
indicated that SOE reforms are not easy to achieve (Levy, 1987; Ramamurti, 1987). Legal structure,
market and government interest determine the selection of the privatisation process and method.
When the government’s interests are in conflict with the market pressure, will government reforms
the SOEs, and what the implications in SOEs roles are. Whether the privatisation generates changes

24
in the government and SOEs’ roles, these are the main issues of this review through the privatisation
cases in three different market economies.
2.2. SOE Reforms in Advanced Market Economies
SOE socio-political roles may show different SOE reform outcomes in different market economies.
These distinctions are affected by two factors: country and company characteristics (Ayub and
Hegstad, 1987). As mentioned previously, legal structure and the government’s national socio-
economic objectives contribute to distinguishing policies and objectives for SOEs. SOEs in advanced
market economies largely aim to promote industrialisation development (Lawson, 1994) and to
implement industrial policy (Ruys, 1988). The role of the state as the centre of economic functions
places SOEs as the government’s vehicles to carry out traditional public utilities duties (Clifton et. al,
2003). Besides the roles of government, the history, cultural and political structures show their
influences on the government and SOEs’ roles and structure and also differ them from SOEs in
advanced market economies and emerging market economies (Ayub and Hegstad, 1987). Historical
studies about SOEs in Western countries showed that SOEs in advanced market economies are part
of the state’s role in resolving market failures resulting from economic collapse or industrial bailouts,
nationalisation and the effect of the capitalism evolution (Toninellie, 2000). Later, socio-political
purposes strongly affect the role of SOEs, in particular during post-war periods and economic
collapse. Securing national defences, social welfare instruments and political unification are the
motivations for advanced market economy governments to establish SOEs (Millward, 2011). Some of
the SOEs in this market economy are part of nationalisation during periods of war and economic
collapse. Later, full employment and better working condition are the main roles of SOEs in
advanced market economies (Toninellie, 2000; Clifton et al., 2003). These motivations make natural
monopoly no longer the main factor for the government to become involve in market economy
activities, as it has been done through continuing tradition or licence (Lawson, 1994). This situation
makes the government a passive player in market economy activities. These differences affect the
government’s decision to privatise SOEs.
The development of market economy activities encourages the emergence of competition. In
advanced market economies, markets are mainly driven by competition (Ryan, 2012). The replacing
of government involvement in market economy activities with the invisible hand of the market
(Ryan, 2012) has considerable effects on SOEs’ policy. Privatisation in advanced market economies is
likely driven by policy implementation or market incentives. Privatisation in advanced market
economies is often aimed at disciplining SOEs. A study of Canadian SOEs revealed that new public
policy could facilitate more autonomy and independence of SOE managers in making decisions
(Sexty, 1980). Open market competition is argued to have an important effect, particularly in
25
disciplining firms and their managers (Caves, 1990). New policy about ownership structure or
competition is also a reason for the government to privatise SOEs in advanced market economies. In
the United Kingdom (UK) and France, privatisation aims to limit the government’s involvement,
improve competition or finance tax cuts (Caves, 1990; Jenkinson and Mayer, 1988; Newbery, 1997;
Stern, 1997). Privatisation in advanced market economies is also driven by the balancing power
between public and private (Bös, 1993). Through privatisation, the role of SOEs is limited and
replaced by private entities. These privatisation cases show that privatisation in advanced market
economies tends to be driven by economic objectives such as market incentives, competition or tax
cuts.
Less government involvement in market economy activities does not always resolve the inefficiency
issues for public enterprises or SOEs. Inefficiency and government involvement are still major
industrial issues, particularly for public utilities industries. There are several remaining issues in
relation to SOEs and new privatised firms following the reforms. For instance, social cost and
monopoly regulation are claimed to be major factors in an inefficient market economy (Ruys, 1988).
Social cost and monopoly regulation often applies within the provision of public utilities. The
requirement for entities to provide public goods and services in lower or affordable prices is often
difficult to achieve unless the government provides support (Hanschen and Erspamer, 2004; Martin,
1996). This causes the market to be inefficient. Meanwhile, anti-competition policy in some
European countries, particularly public utilities, has generated some difficulties for new privatised
firms and the government to make changes (Jenkinson and Mayer, 1988; Newbery, 1997; Stern,
1997). These situations show that public utilities prevent the government from implementing reform
and privatisation.
Besides public utilities issues, the implementations of privatisation and corporatisation leave some
unresolved issues. Natural monopoly versus the liberalisation of the market economy becomes a
double-edged sword for the government and SOEs. Liberalisation of resources through open market
competition may work perfectly for highly competitive industries (Caves, 1990), but it might not be
easy to apply in public utilities. SOEs’ nature products often have widespread effects on the
community. Earlier studies showed how governments fail to open the public utilities market because
of socio-political reasons (Boardman et al., 1986; Newbery, 1997; Ogden and Watson, 1999). The
previous review above showed that SOEs are established to resolve industry bailouts or economic
collapse. This situation may cause difficulty for the government to privatise SOEs. The government’s
involvement in determining their industrial policy by providing protection such as in Austria for small
enterprises (Ryan, 2012), or anti-competition policy in German and British governments for gas and
network industry (Caves, 1990; Jenkinson and Mayer, 1988; Mazzolini, 1979), have also postponed
26
the process of the liberalisation of the regulated market. Socio-political constraints also contribute
to slowing down the privatisation process, as shown in government and public involvement in other
countries’ cases. The influence of management and the union in the Belgian Railways Company
during the decision-making process is an example of the government and public’s involvement that
occurs in advanced market economies (De Borger, 1995). Another study showed a number of
Organisation for Economic Co-operation and Development (OECD) countries’ governments retain
direct and indirect control of their new privatised firms through golden shares or majority control
ownership (Bortolotti and Faccio, 2009). The government is indirectly involved in socio-economic
activities through introducing new policies. The introduction of a new concept of national interest by
the British government to be implemented by both private and public enterprises (Channon,
1980;Perotti, 1995) is an example of how governments still try to intervene and control market
economy activities. Another example of government involvement is shown in the commercialisation
of Community Service Obligations (CSOs) by the Australian government, which generates funding
and costing issues (Martin, 1996). These examples demonstrate that government involvement and
control are still found and needed, even in advanced market economies and after privatisation,
liberalisation and corporatisation are implemented.
In summary, given that markets control most of the national business activities, the government is a
passive player in advanced market economies. As the main role of SOEs in advanced market
economies is to promote industrialisation development, policy implementation, employment and
socio-political duties; privatisation is driven by market incentives, policy implementation and
competition. In practice, public utilities and political structure remains a barrier for SOEs to become
independent economic entities. Government and public involvement is still found, even though it
occurs in a wider scope, such as industrial policy or the implementation of national socio-political
interest.
2.3. SOE Reforms in Non-Asian Emerging Market Economies
The state is a main or key stakeholder for SOEs in emerging market economies. State involvement in
national economic development often derives from a lack of private participants, and to improve
national economic development and industrialisation growth (Ayub and Hegstad, 1987; Caporaso,
1982; Hill, 1982; Yu, 2001). These make government involvement and SOEs’ roles crucial. SOEs are
established to actively play their role in national market economy activities and industrialisation.
Monopoly and government protection are often attached to support SOEs’ activities and speed up
economic activities and industrialisation. However, a number of governments in emerging market
economies have resisted reducing their control upon SOEs, even when their markets have been
opened for private participation.

27
Governments’ resistance to removing their control within SOEs has several causes. The development
of a social democratic system that emphasises equal social welfare and outcomes has set up the
government as a crucial agent to achieve these expectations (Ryan, 2012). The economic transition
and socio-political tradition also shapes legal and political structures, which are mostly based on high
social welfare consensus. Centralisation of control on economic policy motivates the government to
establish SOEs to meet these expectations and implement its public policy (Anastassopoulos, 1985;
Lawson, 1994; Levy, 1987; Ramamurti, 1987). Centralisation of control and socio-economic policies is
considered an aspect of government resistance to reduce its control within SOEs. Government
resistance strengthens SOEs’ roles in national socio-economic activities and industrialisation.
The important role of SOEs in national economic activities and industrialisation do not apply
comparably in emerging market economy societies. For example, SOEs in Central and Eastern Europe
and Latin America have different roles in national economic activities and industrialisation. In Central
and Eastern European countries, SOEs play a crucial role in all socio-economic activities. This
situation is supported by large numbers of SOEs and their roles in most economic and social welfare
activities. The role of SOEs in this region is not restricted to national economic activities. It also
includes non-productive activities or considered social welfare duties such as hospital, schools and
housing (Aghion et al., 1994). These later activities should be operated independently as seen within
other societies. In Central and Eastern European countries, these duties remain under the control of
the government and SOEs. Although the government runs and controls these activities for social
welfare and political consensus purposes, the government’s involvement as the state representative
agent for SOEs is confined to the absentee owner only (Aghion et al., 1994; Bardhan and Roemer,
1992; Carlin et al., 1992). Government control is taken by management, workers and politicians who
have full authority and control upon SOEs (Aghion et al., 1994). This government absentee can be
seen as SOEs’ managers are very powerful in controlling SOEs operationally. In practice, SOEs’
managers have to deal with pressures, interests and bargaining issues from workers, local
governments and politicians (Aghion et al., 1994; Carlin et al., 1992). Potential conflicts emerge as a
result of these parties’ pressures and interests. Meanwhile, bargaining positions appear among
parties that bear risks for SOEs’ managers. This is mainly because, for some Central and Eastern
European countries, unions or politicians can replace SOEs’ management (Aghion et al., 1994).
Political and social welfare expectations are more dominant as part of SOEs and related parties’
concerns, while economic objectives have been weakened by internal and external firms’ socio-
political interests.
SOEs in Latin American countries mostly play a role in industrialisation and market economy
development. Governments’ involvement in market economy and industry activities is encouraged
28
by three factors: the implementation of theory Import–Substituted–Industrialisation, foreign
influence on domestic industrialisation and externalities related to equity (Baer and Birch, 1992).
These involvements put SOEs in Latin America to operate as government industry policy vehicles.
Government involvement through SOEs is limited to natural resources such as mining and specific
industries only. Compared to other emerging market economies, limited control from the
government makes the Latin American market economy environment more open to private
participants. However, insufficient private participation, in particular for heavy industry and the
manufacturing and financial sectors, forces the government to extend its involvement in national
economic activities (Baer and Birch, 1992; Sepúlveda et al., 1993).
A global wave of public policy reforms has encouraged most governments in emerging market
economies to make changes to their way of governing their SOEs. The liberalisation of the regulated
market has led a number of countries in Central and Eastern Europe and Latin America to conduct
massive privatisation. Privatisation in Central and Eastern European countries is encouraged by
changes in political orientation, while changes in the market environment are a motivation for Latin
American governments to privatise their SOEs (Perotti, 1995). Massive privatisation in Central and
Eastern European countries is driven by high public expenditure and the breakdown of the Soviet
Union regime (Nellis, 2003). The national economic activities in Central and Eastern European
countries are dominated by a state with limited private entities’ involvement (Aghion et al., 1994;
Aivazian et al., 2005; Chen et al., 2009; Frydman et al., 1999). These privatisations are aimed at
extending the ownership structure of new privatised firms. However, less developed market
economy activities and private participants mean that Central and Eastern European countries
conduct privatisation through a partnership structure (Aulakh and Kotabe, 2008).
Privatisation in Latin American countries has been encouraged by the wave of British privatisation in
1980s. Privatisation in this region occurs gradually in quite long periods. High debt expenditure and
national economic crises in various Latin American countries also encourage privatisation (Estache
and Trujillo, 2008; Morley et al., 1999; Nellis, 2003). For Latin American countries such as Brazil,
privatisation is also part of the government’s engagement with the IMF (Aulakh and Kotabe, 2008).
There is high pressure for governments to obtain massive amounts of funding and resolve their fiscal
problems to deregulate their industrial policies (Aulakh and Kotabe, 2008). The liberalisation of the
market economy is crucial for the Latin American market economy, particularly to encourage foreign
and private participants in their market activities. Massive privatisation in this region occurs through
asset or ownership transfers from public to private entities. A competitive market with limited
government involvement is common in various Latin American countries, except for particular

29
industries such as natural resources or infrastructure industries (Estache and Trujillo, 2008; Morley
et al., 1999). These industries remain under government control.
These privatisation cases show almost similar results. Although their reasons for privatisation are
different, the end results and new structure of privatised firms in both regions are similar. Massive
privatisation in Central and Eastern European countries produces little change in the context of
ownership structure. Governments still hold majority control within SOEs and new privatised firms
(Aghion et al., 1994; Aulakh and Kotabe, 2008). Partnership structure is mostly addressed to meet
technology, innovation and market expansions rather than changes in ownership or control
structures. A similar case is found in Latin American SOEs. Post-privatisation and reforms, the
government still has to take-over some services and control because privatisation fails to resolve
these social problems. The privatisation programmes in Latin America do not work successfully for
public utilities and infrastructure SOEs (Nellis, 2003). The importance of natural resources and
infrastructure industries in Latin American countries cause the government to conduct different
privatisation processes. Despite opening their market competition, the government retains its
control through contracts, concessions or leasing infrastructure industries for socio-political reasons
(Estache and Trujillo, 2008). Transparency, concession prices and unemployment are major public
critiques during the privatisation process. Corruption and lack of government commitments have
hindered private and foreign investors from taking part in the privatisation process (Baer and Birch,
1992). Numbers of foreign investors have withdrawn from their privatisation process, which cause
governments to cancel privatisations (Nellis, 2003; Sanchez and Corona, 1993).
Post-privatisation in both regions shows that governments retain their control through direct or
indirect majority ownership within new privatised firms. A study showed that reforms likely occur
through the deregulation of internal environment and open trade policy rather than reducing the
government’s role in the public sector (Aulakh and Kotabe, 2008). In both Latin America and Central
and East European regions, governments retain their control of new privatised firms. Government
control is still found through co-shares with private firms or workers. Both cases above show that
privatisation and deregulation have socio-political cost consequences that prevent governments
from fully privatising their SOEs (Bortolotti et al., 2004; Christensen and Pallesen, 2001; Shirley,
1999). These government control policies are also influenced by government interest in protecting
legitimacy and interests (Estache and Trujillo, 2008; Nellis, 2003). These reviews show that
privatisation in Central and Eastern Europe and Latin America have fewer economic intentions
despite political interest purposes.
Finally, a lack of private participants and the importance of industrialisation growth in emerging
market economy societies generate the centralisation of economic activities under government
30
hands through the role of SOEs in Central and Eastern Europe. The liberalisation market and changes
in the political system drive massive privatisation and liberalisation market economy activities in
both Central and Eastern Europe and Latin America. The reviews of these regions show that social
welfare and political legitimacy are still the main concerns of governments, which also affect their
privatisation decisions. Government interest, public pressure or socio-political matters are barriers
for governments to privatise their SOEs for economic purposes. Consequently, governments still play
an important role in national market economies.
2.4. SOE Reforms in Asian Emerging Market Economies
Asian market economies are more varied compared to the two previous market economy systems.
Wide economic distinctions spread from Japan as the most advanced economy to Lao PDR or Bhutan
as the less developed market economies. This distinction makes them difficult to classify based on
their national economies. Meanwhile, the historical background contributes to other differences,
from one with long (neo) colonial experience (e.g., Indonesia) to one that has never been
colonialised (e.g., Thailand). They all produce a multifaceted process of economic development and
roles of the state in the economic development process (Broadberry and Eng, 2010). The national
economic development in each country in this region mostly grows after the state achieves
independence and sovereignty. As a result, the role of the government is primarily to achieve
national stabilities in both socio-political and economic spheres.
The role of the government is crucial for national socio-economic development in this region.
Referring to its nature, the state is the only authority agent that can pass rules, and its activities will
collectively affect the community (Ryan, 2012). Through these roles, protection and welfare are
distributed equally among the community. In less developed, or at the beginning of nations, these
critical roles of state are shown in the distribution of welfare together with improving economic
activities. In his study, Caporaso (1982) noted four roles of state participation in economic
development: lump-sum capital requirements, demand side of economy, low-level equilibrium trap,
and the relationship between delayed development and the state (Caporaso, 1982). Asian emerging
market economies have different roles of state in economic development. The Asian government
plays a crucial role in mobilising resources, providing public utilities and reorganising productivity
and national economic development (Caporaso, 1982). For countries with colonialism experiences
(e.g., Indonesia, Vietnam and Philippines), the government roles are eminent, particularly for socio-
economic stabilisation purposes. Government involvement in economic activities appears during the
post-colonialism period when indigenous bourgeois and class forces have not shown their influence
in economic activities (Sobhan, 1979a; 1979b). Culture and social structure are claimed to be a
barrier for indigenous and private participants to be involved in market economy activities (Kroef,
31
1952; 1954). Government control is needed to prevent political and power abuse following the end
of colonialism. For this reason, governments have to nationalise numbers of firms post-colonialism.
The failure of the market economy has also encouraged governments to become involved in
coordinating and developing market activities (Ryan, 2012; Yu, 2001). The government involvement
is shown by providing capital and products or determining the productivities, organisational
structure and speed or rate of industrial growth (Caporaso, 1982; Gerschenkron, 1992). In some
Southeast Asian countries, governments provide facilities and policies to encourage indigenous and
private participants in economic activities (Balassa, 1988; Carney and Gedajlovic, 2002; Dick, 1985).
The government involvement in banking and insurance services or competitive industries such as
trading or manufacturing is as to encourage indigenous and private participants. Most of these roles
are carried out by SOEs. This is why SOEs in some ex-Soviet and Asian countries are involved in wider
market economy activities such as trading, banking and insurance, which are supposed to be open to
private entities (Boehmer et al., 2005; Bortolotti et al., 2001; Boubakri et al., 2005a; McLeod, 2002b;
Sharma, 2001).
Similar to government roles in Central and Eastern Europe or Latin America countries, the roles of
SOEs in the Asian emerging market economy are not limited to economic and industrialisation
development only. The state as a main agent that influences industrial transformation can
determine the degree of consolidation, political resistance to productive development, and cultural
and political support to particular industries’ development (Ryan, 2012). Some Asian emerging
market economies still deal with unstable power and wealth following the transfer of sovereignty,
which makes the roles of the state crucial in determining industrial policies and policy instruments.
Long-term planning and protection policies are often used as an indicator of the centralisation of
industrial policies (Ryan, 2012). These policies emphasise the crucial roles of SOEs in industrialisation
growth.
Centralisation of socio-economic policy is crucial for some Asian emerging market economies to
achieve equality. SOEs are often used to redistribute power, income and wealth (Lawson, 1994) to
meet this equality. Governments are often required to handle public issues such as education, social
welfare and infrastructure besides the provision of public utilities. This is a reason that some SOEs in
Asian emerging market economies have been established to operate in social welfare spheres such
as hospital and staple distribution (Aghion et al., 1994; Hamzah, 2007). These roles and policies have
two significant effects on SOEs. They contribute to SOEs’ domination in both social welfare and
economic activities. These roles also determine SOEs’ socio-political objectives.
Changes in global market economy environments have affected Asian market activities. A financial
crisis hit most Asian countries in 1997 and resulted in pressure on governments to resolve their

32
internal economic situations. Protection policy was argued to deteriorate the economic situation
following the crisis. National economic stabilisation is a priority for most Asian governments to
reform their fiscal policies and resolve the effects of the financial crisis. For countries like Indonesia
and Philippines, the liberalisation of the market economy is often part of the fiscal reform package
agreement with international organisations such as the IMF and World Bank in relation to financial
assistance (Aulakh and Kotabe, 2008; Bajpai, 1995; Pangestu, 1990). Public policy reforms also
require governments to reduce their involvement in market economies and SOEs’ activities. This
common reason is driven by high debt expenditure as a consequence of government involvement.
This makes privatisation a priority for governments in the Asian emerging market.
As part of fiscal reforms, some Asian emerging market economy countries have conducted massive
privatisation. A further review shows how SOE reforms through privatisation occur in different Asian
emerging market economy regions and the implications for the government and SOEs’ roles. Some
countries like Bangladesh and China have conducted massive privatisation, while some Southeast
countries such as Indonesia, Thailand and Philippines have limited privatisation. The change in
political constraints has driven some governments to conduct privatisation as found in Central and
East Asian countries. Meanwhile, the change in the market economy environment is a driving factor
for Southeast and South Asian countries’ governments to conduct privatisation.
In East Asia, massive privatisation occurred within China and Mongolia after the breakdown of the
Soviet Communist regime in the early 1990s. Prior to the reforms, the influence of socialist economic
control was identified through the important roles of SOEs in both social welfare and economic
activities (Anderson et al., 1999; Zengxian, 1997). Fiscal problems are driven by the highly regulated
market economy, and changes in political constraints encouraged governments to reform their SOEs.
In China, SOE reforms occurred in two separate periods. In 1978, the government conducted
decentralisation of autonomy and incentive improvement, while share issue privatisation occurred
in the 2000s (Rousseau and Xiao, 2008). The common method for privatisation is partnerships, which
create possibilities for new privatised firms to conduct transfers of technology and innovation, as
well as to expand their market from their new partner (Aulakh and Kotabe, 2008). Meanwhile, the
absence of market institutions in Mongolia meant that their reforms occurred in several stages, from
privatisation followed by the establishment of the stock market, and then another privatisation
wave (Denizer and Gelb, 1992; Jermakowicz and Kozarzewski, 1996). The first period of privatisation
in Mongolia was voucher privatisation to transfer assets, while the second period was cash
privatisation to expand ownership (Jermakowicz and Kozarzewski, 1996). The results of both
countries’ privatisation show that there are limited changes in terms of ownership structure. In both
countries, the government remained the main shareholder and controller, even after the

33
privatisation (Jermakowicz and Kozarzewski, 1996; Rousseau and Xiao, 2008; Siqueira et al., 2009;
Sun and Tong, 2003). The Chinese government later conducted share issue privatisation, which
shows slightly different results in the context of the ownership structure, despite the main control
still being with the government (Rousseau and Xiao, 2008; Siqueira et al., 2009; Sun and Tong, 2003).
From this review of privatisation in China and Mongolia, privatisation does not make any difference
to new privatised firms’ ownership and control structure.
Following their privatisation, both the Chinese and Mongolian governments still had to deal with
some issues and critiques. The first critique was about share issue privatisation. This method is often
used to improve capital market activities where the government sell its share of ownership through
the market. At the same time, this method gives an opportunity for the public to participate in the
ownership structure of a new privatised firm. In contrast, some studies showed that share issue
privatisation still gives an opportunity for the government to continue its control of the new
privatised firm through a substantial number of shares or a golden share ownership (Megginson,
2007; Sun and Tong, 2003). Based on these studies, share issue privatisation can also be interpreted
as government resistance to reduce its control and involvement, even after the firm is privatised.
The second critique related to the objectives of privatisation. These critiques referred to the
government’s plan and firms’ selection. A study of privatisation in Mongolia argued that the
Mongolian government has no philosophy or goals regarding its privatisation plans (Jermakowicz
and Kozarzewski, 1996). An economic collapse drives the government to conduct massive
privatisation and liberalise the market. As the government is under pressure to resolve its fiscal
problems, the privatisation selection is based on the size of SOEs rather than a specific industry or
SOE (Jermakowicz and Kozarzewski, 1996). Meanwhile, voucher privatisation and two-type
privatisation methods are selected by governments to speed up the transfer of the asset and
ownership process (Denizer and Gelb, 1992). At the end of the privatisation, the diffusion of
ownership is still dominated by the government, which is also argued to prevent control abuse from
outsiders (Jermakowicz and Kozarzewski, 1996). Further, the less developed market in Mongolia
leaves some privatisation problems. The corporate governance mechanism, for example, is still a
major issue for new privatised firms resulting from the lack of a control mechanism. At the same
time, government involvement is still required to resolve the remaining socio-economic problems.
SOE reform in the Central Asia emerging market is also driven by changes in political constraints. Five
ex-Soviet Union countries—Kyrgyz Republic, Kazakhstan, Tajikistan, Turkmenistan and Uzbekistan—
actively transformed and reformed their economies from central planned to market orientation
policy (Nichols, 1996). Similar to China and Mongolia, these five countries were experienced with
Communist control before the breakdown of the Soviet regime. Compared to China and Mongolia,
34
the breakdown of the Soviet Union strongly affected both the socio-political and economy of these
countries. Centralisation of control under the Soviet Union generates a lack of indigenous
management capabilities to transform their economic system. This situation occurs because their
prior economic activities were centralised under the government; in some cases, the socio-economic
activities were also centralised under the central planning of the Soviet Union (Pomfret, 2006). The
breakdown of the Soviet Union caused massive socio-economic problems within these countries.
Centralisation of planning under the Soviet Union caused an imbalance of demand and supply of
resources in each country. The needs to establish nation institutions and resolve hyperinflation were
two major effects of radical political change, along with the imbalanced supply and demand of
resources (Pomfret, 2006). The liberalisation of the regulated market and privatisation are needed to
resolve these financial problems. In practice, privatisation does not occur equally within these
countries. Kazakhstan and the Kyrgyz Republic show high commitment to privatising SOEs, while
Tajikistan, Uzbekistan and Turkmenistan show relatively less commitment to conducting
privatisation (Nichols, 1996). Meanwhile, privatisation has occurred in several different ways:
voucher, cash auction or public offering. Voucher privatisation is the most popular method at the
beginning of the privatisation process, while public offering or cash auction are selected during the
second or last stage of reforms. The end result of privatisation shows that most countries still have
strong control of the government within new privatised firms. The government retains its control,
particularly for firms with high social and political considerations (Nichols, 1996). These privatisation
cases indicate government resistance to removing its control on new privatised firms and resources.
Compared to Central and East Asia countries above, privatisation in the Southeast Asia emerging
market economy is less affected by political constraints. The development of public enterprises or
SOEs in Southeast Asian emerging market economies is driven by three major factors: improve
private participations, reduce Chinese domination and develop industrialisation (Celoza, 1991;
Milne, 1991; Yuen and Wagner, 1989). Similar to other Asian countries, SOEs have played a wide
range of government roles both in social welfare distribution and national economic development.
Centralisation of the socio-economic policy under the government is found in most Southeast Asian
countries. This means that their SOEs mainly run and operate under the government framework. In
1997, financial problems and hyperinflation hit most Southeast Asian countries. The crisis hit each
market economy, which required the governments to resolve the crisis. The liberalisation of the
regulated market and public policy reforms are the government’s priorities to resolve these fiscal
problems. Privatisation in this region is mainly driven by: inefficient SOEs’ performance, hard budget
constraints and the development of market competition (Yuen and Wagner, 1989). In practice, from
10 Southeast Asian countries, a few engage with privatisation. Some privatisations are the
35
government’s obligation as part of its engagement with international aid organisations such as the
IMF, Asian Development Bank (ADB) or World Bank (Celoza, 1991; De Castro et al., 1996; Milne,
1991; Pangestu, 1990; Wise, 2002). Philippines and Indonesia are in this category. Therefore, asset
transfers and public offerings are the most common methods for privatisation in this region. In
practice, most countries fail to meet privatisation expectations. High resistance from the
government, public, group control and internal firms delay or even stop the privatisation process
(Celoza, 1991; Milne, 1991; Yuen and Wagner, 1989). Only a few countries can conduct full
privatisation. The rest do partial privatisations or even delay the process. This shows that
privatisation post-financial crisis in Southeast Asian countries tends to strengthen the market
economy at the expense of the state (Milne, 1991), rather than reducing government control and
involvement. The end results of these privatisations show that government interests remain strong
to control socio-economic activities in Southeast Asian countries.
Privatisation in South Asia emerging market countries is also driven by changes in the market
economy environment. Five countries have considered conducting massive and intensive
privatisation: Bangladesh, Sri Lanka, Nepal, India and Pakistan. Privatisation in these South Asia
emerging market economies is encouraged by hard budget constraints due to inefficient public
expenditure resulting from high reliance on government support (Haque, 2003; Joshi, 2000). Similar
to other Asian countries, historical background has strengthened SOEs’ roles in various sectors.
Centralisation of control under the government has been developed since the pre-colonial phase
under Muslim rulers, and it remains stronger even post-British colonial period (Haque, 2001). This
means that private and indigenous involvement in socio-economic activities is limited. Consequently,
most socio-economic activities have been run under SOEs. These roles make SOEs heavily reliant on
the government support and budget. In South Asian countries, SOEs also play an important role in
social welfare sphere, particularly in resolving employment issues in fast-growing populations
(Haque, 2003; Joshi, 2000). Overstaffing is a common picture in most SOEs in this region. This
generates inefficiency and hard budget constraints, which motivate governments to privatise SOEs.
In regards to the privatisation method, they vary from divesture assets to public offerings, including
Employee and Management Buy Outs (EMBO). Similar to other Asian emerging countries,
privatisation in this region fails to meet expectations. Issues of transparency, accountability and a
lack of government commitment have halted further progress of privatisation (Ahmed, 1999; Haque,
2001; Kemal, 2000; Salih, 2000). A lack of transparency and accountability causes a transfer of new
privatised firms’ control under particular groups. Government ownership has been transferred to
former top management, high-ranking officers or politicians who take the benefit of privatisation
(Haque, 2001). Meanwhile, social effects from massive redundancies and the increased price of
36
goods and services are found in most countries, thereby becoming a double-edged sword for the
government.
The Asia emerging market cases above show that the liberalisation of the market economy through
privatisation does not work easily. Government protection for SOEs and market-regulated policies
generates public critiques. Protection generates hard budget constraints, inefficiency and less
competition. Pressure to conduct privatisation mostly underlines the requirement for governments
to reduce their involvement, resolve national economic situations and improve SOEs’ performance.
In practice, high reliance on government protection and support has hindered the progress of
privatisation. These social welfare and national economic development roles become a dilemma for
governments and SOEs, particularly when governments are forced to cease their involvement in
socio-economic activities. Privatisation is argued to bring about some social effects, which are clearly
found in South Asian emerging market economies (Haque, 2001, 2003; Kemal, 2000; Salih, 2000).
Although massive privatisation as a central aspect of the transformation process has been conducted
by a number of Asian emerging market economies’ governments, a limited transfer of ownership or
control occurs from the government to private firms (Bennett and Maw, 2003; Gupta, 2005; Milne,
1992). Privatisation occurs mostly through partial privatisation, where limited or small portions of
government ownership are sold to public or private investors (Salih, 2000). Partial privatisation is
considered a win–win solution for the government to accommodate parties’ interests regarding
privatisation. Through partial privatisation, the government can still assure the quality and quantity
of public goods and services for the community (Ramamurti, 1999). A study of privatisation in
developing or emerging market economies supports the arguments of government preferences to
keep controlling firms through partial privatisation (Boubakri et al., 2005b, 2005c; Milne, 1991;
Ramamurti, 1999; Shirley, 1999).
Government resistance to reducing its control and involvement is also shown through the selection
of the privatisation method. For East and Central Asian countries where market institutions are less
developed, gradual and voucher privatisations are an option to implement privatisation programs
and develop market activities (Megginson, 2007). Gradual privatisation creates competition for the
non-state sector for successful privatisation. Voucher privatisation gives possibilities for new firms
and governments to widen owners’ distribution, while governments still hold a major control or
ownership (Nichols, 1996). These cases are often found in Central and East Asian countries where
government control is still an issue. Limited success of privatisation contributes to limited changes in
new privatised firms’ control and ownership structure. Some examples, such as centralisation
ownership and management control in China and Mongolia or price control in Indonesia,
demonstrate that there are no significant changes in the context of government control and

37
involvement, even after the government privatises the firms (Broadberry and Eng, 2010). Some
countries in the Southeast region delayed or stopped their privatisation process because of political
pressures (Celoza, 1991; Milne, 1991; Yuen and Wagner, 1989). This shows that privatisation is even
more difficult to implement when socio-political interests become part of privatisation decisions.
In summary, public policy and SOE reforms have been conducted in different ways in Asian emerging
market regions. Political constraint is a driving factor for privatisation in most Central and East Asian
regions, while the financial crisis and changes in the market motivated the emergence of
privatisation in South and Southeast Asian regions. The aims of privatisation are commonly to open
and liberalise the market and resolve fiscal problems. In fact, most countries fail to achieve their
privatisation goals. High reliance on government roles in socio-economic activities, a lack of
commitment from the government and undeveloped market institutions are barriers to successful
privatisation in these regions.
2.5. Chapter Conclusion
The literature review in this chapter showed that the historical background of SOEs’ roles in market
economy activities distinguishes reforms and methods for their privatisation. SOEs’ roles in general
are to provide public utilities, industrialisation and economic growth. For SOEs in emerging market
economies, their roles are extended to carry out social welfare activities such as the redistribution of
income, power and wealth. For SOEs in advanced market economies, their roles are part of the
countries’ socio-political history. The roles of SOEs in advanced market economies often aim to
balance private and public participation and full employment expectations. These differences in
SOEs’ roles have some implications for governments’ decisions to reform their SOEs.
Changes in the global market economy environment have altered the mechanism of governing SOEs.
For advanced market economies, changes in the market economy cause pressure for governments
to equally treat both private and public enterprises. SOEs should have full autonomy in order to
compete fairly in the market. Privatisation in the market economy is often followed by the
liberalisation of the market. In contrast, fiscal problems result in pressure on governments to
privatise SOEs in emerging market economies. Changes in the market economy environment in
emerging market economies ensure that the government removes its involvement and control. In
practice, market and public pressure are not the only reasons for governments to reform their SOEs.
Political constraints drive governments in the ex-Soviet Union and East Asia to privatise their SOEs
(Rousseau and Xiao, 2008; Jermakowicz and Kozarzewski, 1996). International organisations such as
the IMF, ADB and World Bank take part in forcing governments to conduct market liberalisation and
privatisation for SOEs (Wise, 2002; Abbott et al., 2010).
38
Country and company characteristics have determined the objectives and selection of the
privatisation method. Advanced market economies have more dynamic market competition and
limited government involvement. Therefore, their privatisation aims to achieve market incentives
and discipline SOEs. Market incentive is argued to give more autonomy to SOEs’ managers to run
their companies (Sexty, 1980). In contrast, privatisation in emerging market economies is driven by
social welfare and economic matters. Privatisation is considered the government’s affair to safely
resolve national economic problems. Voucher, EMBO and strategic alliance are the most common
methods selected by governments in ex-Soviet Union emerging market economies (Aghion et al.,
1994; Balassa, 1988; Jermakowicz and Kozarzewski, 1996). These methods are also selected because
their market institutions have not fully developed to facilitate the privatisation process. Meanwhile,
public offering, strategic partner and EMBO are the common methods for privatisation in South and
Southeast Asian emerging market economies. These methods mainly aim to expand new firms’
ownership structure while the government retains control over them.
Privatisation and liberalisation market economies do not seem to resolve the state and SOEs’
problems. Inefficiency and free riders remain major problems for government and SOEs as a result of
the provision of public utilities and social welfare duties. SOEs in emerging market economies still
have to deal with government involvement, including politician and group interest in their decision
making and business activities (Abeng, 2002; Shirley, 1999; Shleifer and Vishny, 1994). Although a
natural monopoly is no longer a barrier for SOEs in advanced market economies, commercialisation
of public goods and services is not easy to implement because of funding and cost payment issues
(Martin, 1996). The requirement to produce affordable public goods and services for the community
may hinder SOEs’ opportunities to gain profits. Therefore, government privileges and subsidies are
crucial for SOEs. Meanwhile, privatisation in emerging market economies shows that there are some
unsolved problems following privatisation. Privatisation leaves out some social welfare problems,
such as employment and social costs, which require government assistance to resolve. Both
advanced and emerging market economies still deal with a lack of government commitment and
conflicts of interest that delay or even stop the progress of privatisation. These privatisation and
reform cases demonstrate that socio-political issues are still a barrier for government and SOEs to
implement privatisation policies.
Government involvement is not easy to remove or reduce through privatisation because of social
welfare and political stability issues. The government and interest groups may resist their influence
and control upon SOEs for political purposes. In practice, conflicts of interest are found in both
internal and external SOE spheres. This literature review shows some potential conflicts of interests
and expectations among the government, SOEs and the public that prevent the privatisation
39
process. Privatisation and liberalisation fail to reduce government involvement for socio-political
reasons. Certain industries may still need to be regulated to prevent power abuse or the domination
of a particular group, as shown in the case of SOEs in Latin America, the UK and Germany. This
situation makes it easy for the government to occupy new private firms with social welfare interests
as the government keeps involving itself in economic activities through SOEs’ roles or industrial
policies (Ryan, 2012).
In summary, privatisation and reforms fail to help SOEs and new privatised firms to improve their
efficiency or performance. Some cases of SOE reforms also show that privatisation fails to reduce
government involvement. SOE reform and privatisation are expected to bring more economic
objectives where profit maximising and competition becomes new privatised firms’ objectives. In
practice, privatisation and public policy reforms present different end results. Reducing government
involvement has been prevented by social welfare and political constraint issues. Consequently,
government involvement is required. As shown in this literature review, the government retains
control of new privatised firms. This literature review has identified knowledge gaps regarding
whether the government makes changes regarding the objectives and policies for SOEs when the
government privatises SOEs, and whether changes in objectives and policy are complementary to, or
in conflict with, SOEs objectives. As government involvement is still required to resolve the social
welfare and political issues, partial privatisation is likely to be an option. However, this option also
leaves a knowledge gap regarding whether partial privatisation can resolve these social welfare and
political issues. These knowledge gaps are the main focus of this thesis.
40
Chapter 3:
Framework of Study
This chapter aims to provide a framework to examine the extent to which Indonesian BUMN/SOEs
are successful vehicles for attaining the government’s objectives in the context of changes in the
government’s objectives and policies for SOEs.
The main area of analysis is the changes government policy and objectives, and SOEs. Based on
these three main areas of analysis, institutional change theory is employed to provide a guidance
and framework. Institutional change theory is used as a theory idea for analysing this thesis. From
the literature review in Chapter 2, it is shown that change is a central factor that alters relations
between the government and SOEs. This chapter is developed based on the literature review, where
the changes encourage the government and SOEs to adjust and deal with the implications.
Institution as government policy is also developed as part of the framework. This is because
institution is argued to be the factor that encourages the emergence of change and the subject of
change (North, 1990). The relations between the institution and actor during the process of change
are the central factor of the analysis, while performance is often used as a reflection and implication
of the changes. The importance of changes is claimed to affect the current performance of
organisations (North, 1989, 1990, 1993). The idea of institutional change theory in particular is that
path dependence is employed as the path analysis that emphasises and analyses this process of
change and its implications. For these reasons, institutional change theory is employed as a theory
idea to develop a conceptual framework for this thesis. This chapter is developed into the following
sections: definition; the nature of SOEs; the nature of government objectives; conceptual
framework; and the conclusion.
3.1. Definition
From Chapter 1, an Indonesian SOE is defined as
SOE in the form of a limited liability company which capital is divided in shares that are wholly or minimally 51 per cent owned by the State of the Republic of Indonesia with the principal objective of seeking profit (UU BUMN, 2003).
A government objective is defined as:
The government statement which underlines the purpose of government in relations to its roles and function to the provision of national economic and social welfare, and financial or commercial expectations that are carried by government business entity or SOE.

41
3.2. Nature of State-Owned Enterprises
As discussed in Chapter 1, SOE is a hybrid entity in which private and government structure influence
SOEs’ organisational structure, objectives and activities. Understanding a model of SOEs in a
particular country requires an understanding of state ideology and economy. SOEs are commonly
established because of the importance of production provided by the state in relation to the
provision of public goods and services. The government involvement is justified as for socio-political
purposes (Lawson, 1994). Marxist economic and political theory argues that the government
involvement is for controlling natural monopolies in the interest of national security (De Castro et
al., 1996) and eliminate capital class who can ban others access to the production (Lawson, 1994). In
contrast, socialist principles assert that state role as the sole owner of production unit means all
supply needs for population is produced and distributed through specific economic organ
(Supranowitz, 1961). These two perspectives of ideology and economic theory demonstrate a reason
to categories SOE as a public economic agent based on their control and roles (De Castro et al., 1996;
Lawson, 1994; Supranowitz, 1961).
The nature of the government’s role in the provision of public utilities is a key factor in relations
between the government and SOEs, which mainly aim to provide services or products that, are non-
marketable (Stiglitz, 2000). These relations, in particular, are in context of the government and SOEs’
roles and function (Lawson, 1994; Martin, 1996; OECD, 2005a; 2005b). Later, the reason for SOE
establishment was developed through; take-overs, nationalisation, social safety network, absence of
private enterprises, war, and constitution (Haririan, 1989; Lawson, 1994; Martin, 1996; Tynan, 2003;
Yu, 2001). From literature review in Chapter 2, the change of market economy may alter the
government roles and functions in economic activities. Industrialisation and social safety net become
reasons for government to establish SOE following the development of market activities. Limited of
local participants motivates government involvement through the roles of SOEs. Because of these
reasons, in some cases, SOE‘s roles are no longer limited to the public goods and services only (Gillis,
1980). The literature review in Chapter 2 showed SOEs’ involvement in various economic activities or
some areas that are open for private participants particularly in emerging market economies. These
reasons extend SOEs’ roles as the government vehicle for economic development. This key factor
sets the objectives for SOEs.
The nature of SOEs is also often determined based on the structure. Legal system of SOE underline
the definition based on the ownership structure (Gillis, 1980; OECD, 2005a; 2005b), board
appointment authority and government utilities (McLellan, 2005). Property right from agency theory
determines ownership is commonly constituted with the right to control the firm and claim the
benefits. In many large corporations, the extent of rights and responsibilities also determine the
42
level of ownership and control (Blair, 1995). For SOEs, the government facilities can be an indication
that a company is categorised as public enterprises or SOEs. The relations between SOEs and
government allow SOEs to get access to use or utilise the government facilities (McLellan, 2005).
SOEs are also defined through the ownership structure. Ownership can also be identified through a
number of elements including exclusiveness, dependency, documentation, transferability and
inheritance (Halper et al., 2007). Ownership structure is considered a factor when clarifying the
definition and nature of SOEs. SOEs are not owned by individuals instead of the government.
Government as shareholder is unlikely indicated who the government is (Nugroho R and Wrihatnolo,
2008). This unclear identified principal as mentioned in the previous chapter, Chapter 2, is included
government, politician and public.
The development of financial markets facilitates transfer of ownership through commercial
transactions or the exchange of stock/shares from one owner to other. This makes ownership is no
longer concentrated. In case of SOEs, the control often is not in line with the ownership structure.
Transfer ownership for SOEs occurs through privatisation or nationalisation, which may not be
followed by the transfer of the control structure. Some governments are more reluctant to
relinquish control. Control is often found as part of SOEs and government relationships. This control
relationship emerges through majority control or special instrument such as golden share ownership
or asset. Therefore, this study underlines the important of government as a majority principal
stockholder and shareholder as the references to determine the definition and nature of SOE.
3.3. Nature of Government Objective
Objective is often considered as the end result of expectation from all activities. The roles of
objectives are shown through determining the aim of actions, or eliminate differences during the
process of achieving expectations (Boyd and Levy, 1966), the aim or end of the action (Granger,
1964), or a set of organisation commitment. For government bodies like SOEs, objectives are a
reflection of the firms’ function or roles, which are set during the period of establishment.
Consequently, SOEs have multiple roles and functions depending on the government’s interests,
functions, roles and history. The government as the owner determines SOEs’ objectives. Based on his
study in various countries, Gillis (1980) noted three different rationales to develop SOEs’ objectives:
economic reason, socio-political reason and mixed motives (Gillis, 1980). For some governments,
their objectives for SOEs are directed from both socio-political and economic reasons, which are
called mixed motives. SOEs’ objectives and structure emphasise an obligation for SOEs to act as
public entities based on the state plans and directions (Bai et al., 2000). As the government
controlled entities, maximising social welfare becomes more important objectives than other
economic objectives such as profit maximising and efficiency (Boardman and Vining, 1989; Hafsi,
43
1985; Ramamurti, 1987; Shleifer and Vishny, 1994). Additionally, some SOEs may aim to improve
market, industrialisation and/or distribution of income (Caporaso, 1982; Freeman et al., 2004;
Martin, 1996; Yu, 2001). These objectives are mostly influenced by lack of private participation in
particular industries where the demand is very high. Consequently, SOE is established to meet this
requirement. Market activities and industrialisation encourage government to consider financial or
commercial objectives, which become the objectives for SOEs.
Ownership structure for SOEs may differ from private entities, as they are more related to matters of
control. The owner of SOEs may not be the controlling party who has direct influence on SOEs’
decision making and business activities. Therefore, SOEs are potentially to have more than single
‘principal’. Multiple or unclear principal have some consequences for SOEs’ objectives. Referring to
SOE ownership structure, the objectives for SOEs are potentially determined by government,
bureaucrats and politician who claim as the ‘owner’ or state representative owner. This involvement
leads to political interest, which may become part of SOE objectives. In traditional view, SOEs’
objectives often engage with the requirement to meet the government social welfare maximising,
legitimacy and political expectations (Bai et al., 2000; Boardman et al., 1986; Gillis, 1980; Hanschen
and Erspamer, 2004; Shleifer and Vishny, 1994;, Willner, 1999). In practice, the impact of state
ownership presents different perspectives of socio-political objective. For example, the requirement
for government to develop particular industries becomes a rationale for government to constitute
and set regulation where SOEs have an obligation to comply with (Mazzolini, 1979). The role of SOEs
in this industry is no limited to develop the market. The roles are included stabilising the price and
distribution, and not to disadvantages the other participants.
As the business entity, SOE is required to focus on the economic or financial objectives. Economic or
financial objectives become part of SOEs’ objectives when the new public reform such as
privatisation and liberalisation are introduced. These changes alter the roles of SOEs. Economic
motive develops and encourages the development of economic or financial objectives. As a business
entity, the economic objectives such as profit seeking or maximising profit are a natural objective
(Ansoff, 1965). Economic objectives can be defined as, both direct and indirect, implications of cost
(Keeney, 1988). In some cases, this economic or commercial objective remains ambiguous. Ansoff
(1965), for example, emphasises the different between profits, as excess of revenue over cost and
profitable as a measure of return on resources (Ansoff, 1965). In practice, there is no clear definition
between profit and profitable maximising. The most common economic objective for SOEs is either
profit or profitable maximising, and it has to be in line with efficiency. The economic or financial
objectives for SOEs often require SOEs to improve their performance improvement in relation to
cost efficiency (Willner, 2001). Since interpreting the economic objectives may not be easy
44
particularly for SOEs. For this thesis, economic or financial objectives are determined as those that
have cost implications.
From this analysis, government objectives are the government expectation statement that affects
SOE’s function, roles and business activities. The objectives may be stated on the establishment rule
or other related regulation issued by government. The objectives can be both social welfare and
financial or combination of both social welfare and financial.
3.4. Conceptual Framework
The main focus of this study is the changes. The changes have enforced institutions and organisation
to make adjustment and adaptation. Change is also considered as an event that engages with other
events, and then presents its implications. For this study, two main changes are analysed, the
changes of market economy environment and the changes of organisational structure and
objectives. These two main changes are references to develop a framework for further analysis of
this thesis. The interaction between market and organisation as a consequence of changes is a basic
reference for institutional change theory (North, 1995). From the previous literature review in
Chapter 2, institution is a key factor for change, while the process or evolution is an implication of
institution changes. Using the institutional change theory as the theory idea, this framework is
developed based on the key element of change, institution and historical path in order to
comprehend the process of change. As part of institutional change theory, the framework of
performance is also developed as a reflection and as implications of changes. This section is
developed into three subsections: institutional change, historical path and performance.
3.4.1. Institutional Change
The development of conceptual framework for this study focuses on analysing the institutional
change that contemplates to the objectives and performance. The selection of institutional change
theory as the theory idea is reasoned by the important of changes and institutions development;
particularly on certain period of time, which results from the interaction between organisation and
institutions (North, 1990). The role of this theory is to understand the evolution of society through
the path of organisation change and the implication of past and present situation on the
performance.
From Chapter 1, the change of market economy in Indonesia drove the changes of government
economic policy. The introduction of privatisation policy encouraged the government to review the
policy for SOEs. This new policy is identified to encourage changes of SOEs’ objectives and business
activities. Government policy as the institution is a rule of game for SOEs in Indonesia, which govern
their interaction in market economy, and effort to achieve the objectives. North (1991) mentions
45
institutions are created as a device to produce order and reduce uncertainty in exchange (North,
1991). Institutional change theory points out that change does not only underline the relationship
between environment and organisation, but it is also emphasises its effects on the future prediction
of the performance, and selection of actions made by the actor or organisation (North, 1993).
SOE as an organisation is developed as to makes a change when the opportunity is appeared.
Organisation is defined as a purposive agent consists of group of people who bound with similar
interest to meet the determined objective (North, 1990). An organisation exists when the
opportunity is set, and the aim of its existence is to meet this objective (North, 1992). The
establishment of organisation is also affected by the institution constrain which is driven by the
emergence of opportunity (North, 1990; Hollingsworth, 2000). A part of organisation structure, the
objective is set as guidance for the actor to maximise the expectation (Dacin et al., 2002). From the
nature of SOEs in Section 3.1, SOE is considered as purposive organisation, which established for the
purpose of government. The structure and objectives are determined by the opportunity arise
within the market, which are also affected by the development of institutions. Organisation engages
and interacts with other organisations, and as which a framework or the rule of game for
organisation exists (North, 1990; 1993; 1995). Consequently, their organisation’s objectives and
activities are affected by institution constraints.
Institution is often defined as a humanly devised constraint that structure political, economic and
social interaction (Mantzavinos et al., 2004; North, 1991, 1993; Landesmann and Pagano, 1994).
Government policy and constitutions are the main devise constraint for SOEs. The influence of
institution constraint is as shown on the nature of SOEs and government objectives as to set and
determine the expectation and interaction of SOEs in market. Institutions’ roles are often supported
by enforcement (North, 1990), which becomes a peer control and monitoring tool in context of their
interactions (Aoki, 2009). In practice, institution can be classified into two aspects: external, where
the institutions share regularity among the population; and internal, where institution are a mental
model to social interactions (Mantzavinos et al., 2004). These two aspects later shape the
differences between formal and informal constraints that develop within the community.
The interaction between organisation and institution begins when the change is happened. The
interaction mostly takes place when the change generates an effect on the organisation’s effort to
achieve their objectives. Institutions demonstrate their roles to reduce the effect of changes, which
usually appear as uncertainties. The opportunity drives actors to exercise their position to respond
to the changes. Cooperation and coordination are made amongst actors, which aim to fulfil the
opportunity.
46
The reason for an organisation to make change is also encouraged by its performance. Poor or
unsatisfactory performance is the most common reasons for organisation to make change. An early
study shows that besides crisis and environment fast growth, unsatisfactory performance
encourages institutional reforms to improve existing performance (Skott, 1999). Welfare maximising
is often a main objective of organisation. However, limited resources enforce organisations to
compete. This makes resources no longer costless. Meanwhile, the change may take place as the
consequence of the change on price. The role of price is crucial when the price play a role as the
incentive for the opportunity that may cause the organisation to change. North (1990) explains the
institutional change begins when the change is engaged with the price, which has a consequence on
the choice and actor’s welfare (North, 1990). The changes of price and cost may alter the
organisation or actor behaviour toward the objective.
In summary, the framework in this study is developed from institutional change theory as a theory
idea, which emphasises relationships between SOEs and institution environments. The interaction
encourages the changes, which are mainly driven by the market and/or government policy or
institutions. Changes in institution environments drive actors to alter their structure and objectives.
3.4.2. Historical Path
Historical path is employed to provide guidance for this thesis analysis. Historical path is developed
based on the theory idea of path dependence from institutional change theory, which emphasises
evolution of change as the key analysis. The process of change is analysed to identify the difference
of organisation performance and how the organisation survive or develop during period of time.
North (1990) emphasises the importance of path as to explain the differences of patterns and factor
that makes the actor or organisation survival even when the organisation is persistently poor
performance (North, 1990). As mentioned previously, the changes occur when actor sees an
opportunity for his/her to improve efficiency and maximising their welfare. North (1990) notes the
process to reach efficiency leads to the development of mechanism, which characterised by multiple
equilibria, possible inefficiency, lock in, and path dependence (North, 1990). The process of change
occurs as an ergodicity and evolution where both actor and institution show each other influence
and improvement to reach efficiency. The selection of historical path for this thesis is because the
history matter is crucial. Path is used to examine and reconstruct the Indonesian SOEs evolution in
relation to the historical changes in government-stated objectives for SOEs as one of the main areas
to be examined in order to be able to address the extent to which Indonesian SOEs are successful
vehicles for attaining the government’s objectives. This selection is also based in the previous study
of institutional changes which underlines the importance of sequence events occurred in the past to
determine the prosperity or future (Ebbinghaus, 2005; Mahoney, 2000).
47
Institutional change theory underlines the difference of economic performance across economy
society as a consequence of the evolution of changes. The evolution of economic structure makes
the economic performances across economy society are different. Institutional change theory also
emphasises the role of time or evolution that causes the difference (North, 1993; Hollingsworth,
2000). Evolution or timeline is claimed to differ the end result when the actor’s skill and knowledge
is developed during the selection process (North, 1993; 1995; Aulakh and Kotabe, 2008). For
example, the study of corporate governance structure by Bebchuk and Roe (1999) reveals that the
differences of corporate and country’s economic structure are influenced by the country’s pattern at
any point of time (Bebchuk and Roe, 1999).
Path dependence as an idea of historical path analysis is employed to understand the concept of
choice. Path dependence emphasises a way to narrow conceptually the choice of set and link of
decision making through time (David, 1985; North, 1990; 1993; Sjostrand, 1993) which is crucial
during the analysis process of historical path. There are two dominant sequence types, self-
reinforcing sequence and reactive sequence. The major differences between these types of
sequences are on how the contingent historical events corresponds with the determining pattern
corresponds (Mahoney, 2000; Pierson, 2000). The different of events makes the roles of sequence
and evolution is crucial to guide how prosperity and objectives are achieved.
The relationship amongst events is crucial in analysing the sequence events as part of historical path.
There are three key major determinants: initial period, initial event and deviant event. An early
study emphasised the interconnection of events, as each event in path dependence is not an
independent event (Ebbinghaus, 2005; Mahoney, 2000). This statement means that each event is
engaged and affected to each other. Mahoney (2000) emphasised the important of early period and
initial event as an initial condition where criteria and rules are set (Mahoney, 2000). The important
of initial event is acknowledged as a beginning of pattern where future outcome and expectation are
determined or set. The event emerges as a beginning and no other event preceding the event. This
initial event at early period controls others or next event even when their economic environment is
very much alike (Bebchuk and Roe, 1999). The crucial role of initial event at early period as
determinant and future expectation factor is explained through a Polya Urn experiment. A Polya Urn
experiment by Arthur et al (cited by Goldstone, 1998) reveals that the end result is hypothetically
determined by the initial and choice of outcome (Goldstone, 1998). This experiment shows the early
event at the beginning of path limits the potential next events’ options or alternative4. An early
4 Polya urn experiment develops based on the outcome of ball’s colour selection. The first colour is selected
will cause an addition ball with similar colour put into the urn. This makes the colour composition is narrowed to certain colour.
48
event narrows the option for an actor to take the next action. Meanwhile, the QWERTY case also
shows how the initial event of the typing machine developed has enforced people to accept the way
the machine was set (Ebbinghaus, 2005; Mahoney, 2000; North, 1990). These two cases
demonstrate the crucial roles of initial outcome from the early event that enforces and narrows the
actor’s selection options. The pattern develops as a consequence of the outcome from prior event,
and then narrows the next events’ option. The inter-influence amongst events, later, develops as a
sequence of events or path dependence. Ebbinghaus (2005) mentions the term ‘trodden trail’,
where the sequence of events is selected and then repeated as a path or pattern by the actor or
organisation (Ebbinghaus, 2005). In particular moment, these events lead to lock-in situation where
efficiency is achieved and solution may not be easy to exist from (North, 1990).
Besides the initial event and period, the casual, contingent, or deviant event is considered as a key
factor that influences the end result of path dependence. The selection of lock-in is acknowledged
when an efficient way is achieved. In this situation, path has been transferred to become lock-in
where change is not easy (North, 1990). In practice, evolution of changes demonstrates that the
existing outcome may no longer efficient (Pierson, 2000). As efficiency is related to actor’s objectives
and welfare, at particular time, actor may make a change or look another alternative. The process of
evolution is no longer a cohesive process. Branching point arises when there is an opportunity for
actor or institution to alter their selection or decision. Ebbinghaus (2005) notes the path dependence
may develop from non-linear self-enforcement, which differ or distinguish the original expectation
when spontaneous or casual event appears (Ebbinghaus, 2005). The unique or radical event as
deviant event may appear during the path, and alter the prediction of outcome (Mahoney, 2000).
Road juncture is occurred result from unique or radical event when the actor alters its choice during
the evolution process (Ebbinghaus, 2005). Road juncture can occur as actors collectively decide to
introduce new rules. The process may happen through radical enforcement surrounding the actors.
The change is also happened as the consequence of cost and political pressure. In Section 3.2.1.3,
North (1990) mentions the roles of cost and political pressure may generate the emergence of
radical enforcement, which may differ the existing objectives from the original prediction (North,
1990).
A study of organisation ownership structure revealed that there are two driving factors for the
development of the path: structure-driven and rule-driven (Bebchuk and Roe, 1999). Internal or
structure-driven factors are found within organisations through ownership, rules or control
structures. The structure-driven factor has a tendency to develop as a trodden trial process. The
organisation is likely to resist the change after they have achieved equilibrium. This occurs in
particular when the potential changes and cost affect the actor or organisation welfare or benefits
49
(Bebchuk and Roe, 1999). In contrast, the change may be encouraged by external or rule-driven
factor when the changes of institutions create an opportunity for the actor or organisation to meet
equilibrium. The requirement to make change is often followed by the enforcement from particular
interest group (Bebchuk and Roe, 1999). Consequently, change is no longer an option in spite of an
obligation for organisation.
Finally, historical path is developed to refer to path dependence from institutional change theory,
which determines the long-term process of institutionalisation where the sequence events govern
the process and end result. Historical path analysis is developed to focus on the timeline or historical
matter, which is crucial for this thesis. The sequence of time plays an important role to reconstruct
the evolution of Indonesian SOEs. Two main events are the focus of analysis as; the initial event and
period as where rules and objectives are set, and then a deviant event that discontinues or alter the
sequence of path.
3.4.3. Performance
Performance is a measureable tool to evaluate the end result of activities. The role of performance is
mainly used to evaluate the process, outcome or target. Performance as the end result is affected by
number of factors. Interaction between organisation and institution through various process and
time has placed welfare maximising as the actors’ objectives priority. The main purpose of
interaction is equilibrium, which is considered the best outcome. Equilibrium is achieved through the
most efficient process and resources allocation (Pierson, 2000). Performance is affected by the
development of actor’s skills and knowledge. The development of actor’s skill and knowledge may
change actor’s need and intention (Carpenter and Feroz, 2001; DiMaggio and Powell, 1983; North,
1990). Meanwhile, performance is also affected by the information when the resource is limited. An
early study shows how information determines the impact of cost and benefit particularly when
large numbers of parties involved (North, 1990).
Part of performance measurement, efficiency is an important determinant factor. Efficiency is
considered as the most equilibrium situation achieved when the distribution of benefits and
resource allocation structures the economy where competition arises as part of achieving the
market efficiency (North, 1992). Efficiency is achieved through various processes. Existing
institutions are established through process of addressing needs and problems, which may make the
institutions having efficiency advantages (Bebchuk and Roe, 1999). Efficiency is achieved as
consequence of enforcement, which shapes the alternatives. Open market, for example, allow firm
to extend its network to and from the resource. This opportunity may affect the cost of production,
which directly affects the ability of actor to reach welfare maximising. Potential conflict often
50
proceeds as consequence of resources allocation problems in particular when the allocation engages
with different set of institutions (Mahoney and Thelen, 2009). Conflict of interest appears when each
party compete for price, quality and profit in market activities (Ames, 1984; Persson, 2002). Lower
costs in relation to information, negotiation, monitoring, coordination and enforcement significantly
affect the level of efficiency and parties’ pay off (Bardhan, 1989). Rent seeking appears when the
willingness of actor to control may not match with the payoff from controlling (Bebchuk and Roe,
1999).
Performance measurement is often used for institutional, managerial or technical purposes
(Townley, 2005). These measurements are purposed to pursuit the effectiveness of activities or
resources allocation in relation to the target. Goal, system resources and constituency approached
are the major framework that often used to analyse organisational performance (Dess and
Robinson, 1984). For this study, goal approach is utilised to measure SOEs’ expectation. In practice,
limited tools to measure SOEs’ performance make SOEs’ performance should follow the common
performance indicators, which are used by private firms. Most performance measurement for SOEs
relies on benchmarks with similar industries (Morck and Stangeland, 1996). The problem with this
performance tools is they fail to accommodate SOEs’ social welfare duty. However, lack of
knowledge about SOEs’ industry causes government relies on the benchmarking tool. This reliance is
also considered as institution’s influences when market requires SOEs and government to obey and
accept the standard measurement. This performance measurement is the equilibrium, even though
the measurement is not the most efficient ones. For this thesis, performance measurement is
referred to the financial performance, which commonly uses for the business best practice purposes.
Detail performance measurement develops through method section in Chapter 5.
In summary, performance is the measurement of organisation end result. Efficiency is the main tool
of performance, which is set based on the equilibrium distribution of benefits and resources. The
requirement for organisation to be evaluated often rationale by the institution. In context of SOEs,
performance measurement is referred to best business practices, although the measurement is not
the perfect one.
3.5. Chapter Conclusion
The framework of study for this thesis is developed based on the idea of institutional change theory,
which emphasises the historical path of SOEs regarding changes in government objectives for SOEs,
the evolution of institutions that sets SOEs’ structure and objectives, performance as the reflection
and implications of the changes, and relations between the objectives and SOEs’ business activities.
51
Chapter 4:
Propositions and Hypotheses
This chapter aims to develop propositions and hypotheses that will be used to examine the extent to
which Indonesian SOEs are successful vehicles for achieving the government’s objectives. The
propositions and hypotheses are developed based on the nature of the problems found in the
Chapter 2, the literature review.
The potential conflicting interests and obligations in meeting the government’s expectations have
made it difficult for SOEs to prioritise the expectations. An early study showed that firms are
obligated to pursue activities based on the original charter or statement of incorporation (Sundaram
and Inkpen, 2004). SOEs are obligated to carry out government roles in social welfare and economic
growth. The knowledge gaps identified in the literature review in Chapter 2 are used to develop the
propositions and hypotheses in this thesis: whether the government makes changes regarding the
objectives and policies for SOEs when the government privatises SOEs; whether changes in the
objectives and policies are complementary or in conflict with SOEs; and whether partial privatisation
affects the government’s objectives and SOEs’ ability to meet the objectives. These questions have
emerged based on findings from the literature review in Chapter 2 regarding the government’s
objectives for SOEs.
There are four main areas that need to be focused on prior to answering the questions. The first
area is the government’s objectives. The government as the stockholder for SOEs shows its influence
in determining the objectives. The literature review also showed how the government affects the
process of determining SOEs’ objectives and national economic policies through its role as SOEs’
principal and stakeholder. The second area is the effect of the privatisation policy. Privatisation is
considered a deviant event that alters original expectations. From the literature review in Chapter 2,
privatisation shows its influence in encouraging changes. The third area is the effect of partial
privatisation. Partial privatisation indicates a contradiction, as the market is opened for competition
while the government’s control remains strong. The fourth area is changes in policy and the market,
which may have consequence for the objectives. The literature review in Chapter 2 shows that social
welfare is still an issue for the government and SOEs following the introduction of privatisation.
These issues have emerged regarding whether changes in objectives are complementary or
conflicting, and the extent to which SOEs achieve these expectations.

52
4.1 Government Objectives
The government’s objectives for SOEs often engage with the government’s roles and the state’s
needs. The government is the only authority body within society; thus, its activities will have
collective effects (Ryan, 2012). Besides social welfare duties, the government’s roles include
facilitating national economic growth, providing public facilities and improving market activities
when private participants are limited. The development of the national economy and other parties’
participants in national economic activities contributes to the intensity of the government’s
involvement in these activities. A lack of private participants and resources drives the development
of the public sector where government plays its important roles, while an open market limits the
government’s role as the facilitator or passive player in national economic activities. SOEs are part of
the government body in carrying out these social welfare duties. The important role of social net
stability motivates the government to be involved in socio-economic activities. Community
development, employment and poverty are the government’s main concerns. Reducing
unemployment, crime and poverty motivates the government to develop national economic
activities through the roles of SOEs. Employment and community development are often part of the
government’s main concern in determining the objectives for SOEs (Bai et al., 2000; Boycko et al.,
1996). Therefore, the government’s roles and duties constitute the government and SOEs’
objectives. As an objective is also a picture of a problem that an organisation needs to resolve
(Keeney, 1988), employment and community development become part of SOEs’ objectives when
the government is required to resolve these issues. Employment and community development also
justify the government’s involvement in social welfare duties and makes these non-productive duties
part of the government’s objectives for SOEs.
As a business entity, SOEs are expected to maximise profits or shareholders’ expectations. Profit
becomes SOEs and government concern, following the implementation of privatisation and SOEs’
policy reforms. In common practice, the profit objective is not only determined by shareholders. The
literature review in Chapter 2 showed that the market also encourages the development of the
profit objective. Competition may place pressure on SOEs and private entities to be profitable and
efficient. In practice, SOEs’ managers may deal with other parties who are part of the stakeholder
group, such as employees, the government and communities. These stakeholder groups may also
determine the basic needs and end result of SOEs’ business. Profits, efficiency and good-quality
goods and services are the public and government’s major critiques for SOEs. The public and the
government often require SOEs to be more profitable and efficient, like private entities. As
stockholder and stakeholder for SOEs, the government’s influence is not limited to determining the
objectives. The government regulates the market where SOEs and private participants run their
53
businesses. The regulation often requires SOEs to fairly compete with private entities, and they are
also obligated not to disadvantage private participants in the market. SOEs have to balance their
market activities as businesses and public entities. This requirement potentially creates conflicting
objectives and roles. Referring to these situations, the propositions or issues are whether:
P1: When the government introduces a new policy regarding SOEs’ roles and expectation, the government-stated objectives for SOEs are changed.
4.2 Impacts of Privatisation Policy
The development of national economic activities has encouraged private participants to be involved
in the activities. Consequently, the role of the government in economic activities is declined as
private participants start to take part in economic activities in some ways. Declining government
involvement in economic activities is also driven by the shrinking of the public sector. The shrinking
of the public sector is often motivated by high expenditure and a lack of government ability to
support these roles. Private participants in national economic activities require government to pay
attention to the success of the national economy by facilitating the improvement of business
performance (Ryan, 2012). Pressure from the public to reduce the government’s monopoly and
protection encourages the government to reduce its involvement by introducing public policy
reforms such as privatisation and the liberalisation of the regulated market. These changes in the
market economy environment also require the government to alter its SOE policies and the way it
governs SOEs by encouraging SOEs to fairly compete with private entities.
Changes in the national market economy affect SOEs’ business structure and objectives. Through
privatisation, the government’s ownership is transferred to private. In common practice, this
transfer is followed by changes to objectives. Economic expectations, such as profit maximising and
efficiency, often become new goals for new privatised firms. In practice, the changes may be limited.
An earlier study showed that the new structure of new privatised firms’ ownership is determined by
the level of investor protection and firm performance (Boubakri et al., 2005b; 2005c). The study
explained that the degree of control from new owners is determined by the minority protection
provided by the government. Minority protection from the government plays an important role in
the selection and degree of new ownership structure. The intensity of legal protection for investors
and minority owners has implications for the privatisation method preference, whether through
transferring asset or sharing issue privatisation (Megginson, 2007). The selection of privatisation
method preferences also affects the intensity or degree of control under new owners, whether a
new structure is a full or partial ownership. When the transfer of ownership generates centralisation
control under a new owner, the new owner may alter the culture and objectives of the company.
54
These new structures are claimed to enable possibilities for new privatised firms to improve their
performance. When the centralisation of control is transferred to private investors whose main
concerns are profit and economic objectives, firm performance is more likely to improve (Willner,
2001). In contrast, partial privatisation may still provide possibilities for the government to hold
majority control for new privatised firms.
Changes in the market economy are not only affected by privatisation; they may result from the
liberalisation of the regulated market. This change mostly affects non-privatised SOEs where the
government is still the sole owner or principal. The liberalisation of the regulated market drives SOEs
to compete fairly in open market while the control of ownership is still centralised under the
government. SOEs and the government may alter SOEs’ structure, for example, by establishing and
implementing corporatisation. The market economy environment is argued to have significant
effects on the development of internal corporate policy for SOEs (Sexty, 1980). SOEs’ internal policy
and objectives are adjusted to accommodate market expectations. Restructuring the internal
governance structure is usually applied through a separation function of owner and manager, and
the introduction of an internal control through the role of an internal auditor. A control mechanism
underlines the importance for both the government and SOEs to comply with accountability and
responsibility standards. The government may not be able to directly involve SOEs in the decision-
making process. Restructuring the internal governance structure through corporatisation may
improve SOEs’ performance and efficiency (Aivazian et al., 2005). The government is required to put
aside its own socio-political interests as a result of the market and public’s pressure regarding
accountability and responsibilities. The introduction of a new privatisation policy encourages
changes in the government’s way of governing SOEs, and in the way that SOEs deal with the new
market environment. Therefore, the proposition is:
P2: Changes in SOEs’ market economy environment through the introduction of the privatisation policy and the liberalisation of the market economy generates changes in the government and SOEs’ objectives.
4.3 Performance implications
Performance has become a central aspect of controlling and monitoring measurement. The role of
performance is often used as a tool to assess the success of a firm or organisation in meeting its
expectations or targets. These assessments emphasise the relationship between objectives and
performance. An early study showed that the application of performance has been used by various
traditional business measurement fields (Sirgy, 2002). Performance as an effective measurement
tool has not been limited to businesses or the private sector. Rather, it has been used as a

55
measureable tool in other sectors. For example, the development of new public administration
underlines the importance of performance as a device for measuring the government and public
sector’s achievements (Townley, 2005). Objectives are set as part of the performance measurement
tool. Objectives are a basis for shared expectations, planning and performance evaluations (Pearce,
1982). They are set based on the commitment that members of firms or organisations want to
achieve. This commitment is included in the planning and performance evaluations. The most
important factor of determining the objectives is the end result and the basic needs that need to be
satisfied (Boyd and Levy, 1966). Therefore, the performance evaluation mainly aims to assess
whether the organisation can resolve or meet the expectations.
The role of performance becomes more essential when the agency function is separated. Potential
conflicting objectives appear when the agent and principal show different interests and risks. Within
a disputed ownership structure, risks may be distributed among the owners, while management has
to deal with all potential risks as a consequence of their role. The separated function of agent and
principal is argued to give more opportunities to managers as the agent to achieve their own
interests at the expense of shareholders (Short, 1994; Sharon and Jahera, 1991). This separated
function leads to conflict, which largely result from asymmetrical information and incentives. A study
of management theory showed that management behaviour is affected by risks and incentives,
which are commonly asymmetrical to the achievement (Short, 1994). Managers’ efforts to achieve
the objectives are directed by the degree of their own risks, such as replacement and future
expectations in relation to their incentives. External factors also become an influential factor for
managers’ decisions in the context of performance achievements. Mergers, acquisitions and market
labour are considered to contribute to management’s behaviour related to performance
achievements. Other factors, such as control, value-maximising size and regulation, are also crucial
in completing expectations (Demsetz and Lehn, 1985). In common practice, these factors have a
more significant influence on the success of management in meeting value-maximising expectations
rather than the structure of ownership. The separated function of agent and principal requires a
mechanism of control and monitoring to ensure that owners’ interests are in the best interests of
management.
Performance is often attached to ownership structure. The centralisation of ownership often occurs
within public or family enterprises. An earlier study showed that the centralisation of owners has
negatively affected the ability of firms to make a profit (Band, 1992; Demsetz and Lehn, 1985; Short,
1994). A distinction of owner concentration from distinguish owners is attached with financial
arrangement settles the power or control in the decision-making process (Sharon and Jahera, 1991).
Therefore, the centralisation of ownership provides more opportunities for blocked owners to
56
monitor and be involved in management decision. The emergency of potential conflicts between
managers and owners is stronger compared to disputes regarding ownership structure. The transfer
of ownership is considered an effective way of preventing power abuse from blocked owners in the
decision-making process. Performance and ownership become a prominent study following the
transfer of ownership (Sharon and Jahera, 1991). A study showed that performance improvement
occurs following the transfer of ownership when the management share is part of the ownership
structure (Band, 1992). This is because owner interest is a crucial factor that motivates firm
behaviour (Branch, 1973). Owners’ expectations are mainly pursued to maximise their wealth.
Privatisation has consequences for the transfer of ownership and performance. The literature review
in Chapter 2 showed that privatisation generates two significant changes: new firm structure and
objectives. Further, privatisation is frequently driven by poor performance or inefficient public
expenditure resulting from government involvement and privileges. Changes in market and
government policies significantly affect SOEs’ business activities. An earlier study showed that firms
could easily change their structure and process when the market around them changed (Arens and
Brouthers, 2001). Changes in the market environment through privatisation and liberalisation
encourage SOEs or new privatised firms to anticipate the changes. In contrast, the literature review
mentioned the potential socio-political problems resulting from privatisation. Socio-political
problems develop as SOEs and new privatised firms are required to focus on economic objectives
because of changes in their market and/or owner structure. These problems are also a major
consideration when the government is still part of the controlling principal through partial
privatisation. New objectives are commonly set to anticipate the changes. Referring to these
situations, the theory of privatisation predicts that:
H1: The introduction of new objectives resulting from the privatisation policy and the liberalisation of the market economy cause conflicting objectives for SOEs and new privatised firms’ objectives and business activities. H2: Changes in SOEs and new privatised firms’ objectives and business activities resulting from the privatisation policy improve SOEs and new privatised firms’ performance.
57
Chapter 5:
Research Methods
This chapter presents the research design that has been used to examine the extent to which
Indonesian SOEs are a successful vehicle for achieving the government’s objectives. The research
method has been created to provide detailed plans and tasks during the study and analysis process.
The research method has been developed based on the knowledge gaps identified in the literature
review in Chapter 2, and it will be used to develop the propositions and hypotheses. Both qualitative
and quantitative methods have been employed in this thesis to examine the implications of changes
and the relations between the government-stated objectives for SOEs and SOEs’ structure and
performance. Qualitative methods, including interpretative, historical and content analysis, have
been employed to resolve the following issues or propositions developed in the literature review:
P1: When the government introduces a new policy regarding SOEs’ roles and expectations, the government-stated objectives for SOEs are changed. P2: Changes in SOEs’ market economy environment through the introduction of the privatisation policy and the liberalisation of the market economy generate changes in the government and SOEs’ objectives.
Meanwhile, quantitative methods—two-sample t-test and regression—have been employed to
examine whether the introduction of new objectives resulting from the privatisation policy can
cause conflicting objectives, and whether the changes affect SOEs’ business activities and
performance. For this thesis, the relations between the government’s objectives and performance
are examined as:
H1: The introduction of new objectives resulting from the privatisation policy and the liberalisation of the market economy cause conflicting objectives for SOEs and new privatised firms’ objectives and business activities. H2: Changes in SOEs and new privatised firms’ objectives and business activities resulting from the privatisation policy improve SOEs and new privatised firms’ performance.
This chapter is developed into five subsections: historical path analysis; content analysis for
evaluating the government-stated objectives; quantitative method for relations and performance
measurement; unit analysis; and data analysis. Interpretive analysis is described in detail as part of
the historical path and content analysis.

58
5.1. Methods
The research method for this thesis has been developed in reference to the main research area
issues. A mixed method has been employed to examine the extent to which SOEs are successful in
attaining the government’s objectives. Qualitative methods are used to investigate the issues which
are developed as the propositions. The methods used to evaluate the propositions are historical
path, interpretative and content analysis. Quantitative methods—two-sample t-test and regression
test—are employed to examine the hypotheses. This section is developed into three sub-sections:
historical path analysis, content analysis and quantitative method.
5.1.1 Historical Path Analysis
Historical path analysis is selected as the analysis tool because the method focuses on history and
path or sequence events, which are key factors for this thesis. The key topic of this thesis is changes
where sequences of time as evolution are crucial. From the conceptual framework in Chapter 3, a
historical path is developed by combining path dependence and the historical method as the
framework for analysing the phenomena of change in the government’s objectives for SOEs and
SOEs’ structure and objectives. Path analysis points out the important role of continuing events
during a period, while an event that is unrelated may influence the variable or continuity (Newman,
2000). Historical analysis has also been selected to examine the cause–effect and movement of the
events during the process of change. Time is the main factor in the historical method, as it
reconstructs or tells what has happened and seeks to untangle complex causes and movements of
human events in the past (Smith and Lux, 1993).
The selection of historical path analysis is based on the knowledge gaps identified in the literature
review in Chapter 2, as well as problems identified in Chapter 1. The literature review in Chapter 2
underlined that the government’s policy and objectives statement for SOEs is often related to the
situation when the SOE is established. The review also mentioned the possibility of the government
and firms making changes driven by changes in the market or political environment. Historical
analysis provides procedures that allow the researcher to investigate the issues deeply and to
eliminate these potential bias issues, while path analysis emphasises the evolution and changes.
There are two approaches in the historical study: constructionist/hermeneutic, which focuses on
changes or continuity over time; and positivist, which emphasises data analysis to interpret and
present causal evidence (Thompson, 2010). For this study, both the constructionist and positivist
approaches are combined and employed. The positivist approach is utilised to examine changes by
identifying the causal evidence, while the constructionist approach uses continuity events as the key
analysis.
59
The selection of the historical path analysis method for this study has been motivated by some
considerations. The most important reason is the relation between the research method,
hypothesis, framework and research questions. The main research question, propositions and
hypotheses focus on the evolution of government policy and objectives for SOEs. There are some
advantages of historical analysis. First, it provides procedures and rules that help the researcher to
collect the evidence and facts based on connections among facts, including the interpretation and
selection of facts (Lucey, 1984). Further, it gives researchers procedures to reconstruct the past, and
it explains the complex causes of change, demonstrates the persistence of phenomena and analyses
the trends (Smith and Lux, 1993). Second, the historical analysis method offers possibilities for the
researcher to search and make deep considerations regarding contemporary issues, including factors
that influence the issue (Lucey, 1984; Parker, 2004; Rowlinson, 2004), along with the possibility of
obtaining insights into the precedents and conditioning factors (Parker, 1997). This method gives
researchers the opportunity to search values, relationships, significance, causation and explanations
of certain events or facts (Parker, 2004). Third, using the historical analysis method, the
government’s policies and objectives are reconstructed, and the researcher can identify whether the
changes have consequences for the current structure and performance. Meanwhile, path analysis is
combined, as it focuses on chronological constraints and unusual deviations. The continuity of
events, times, places and manners is used to evaluate the events by developing a map of the
periodisation or sequence of events. The historical analysis method systematically collects all
possible facts and information and then examines them through chronological constraints before
presenting them as knowledge or proof (Lucey, 1984). At the same time, path analysis is utilised to
identify and analyse the crucial events that significantly affect the evolution. Based on these results,
the past is reconstructed by developing a map of periodisation or events. This process is the
historical path analyst’s main concern.
As part of this historical method, interpretive analysis is employed to support the historical path
analysis. It is utilised to help understand the meaning and content of the data. As mentioned
previously, the government’s policy and objectives statement is often biased or vague; thus,
interpretive analysis is expected to reduce these barriers by focusing on the meaning of each
objective and policy statement as a text. Interpretive analysis brings sense to text or text analogues
that are found in hermeneutic studies about interpretation (Myers, 1994). The importance of
meaning in analysing the government’s policy and objectives is examined using interpretative
analysis.
Historical analysis is employed to analyse the propositions. It is utilised to reconstruct the
government’s objectives for SOEs based on evolution and historical changes. There are two parts to
60
the analysis of SOEs’ evolution. The first part is the structure and objectives of SOEs during the
period of evolution, from 1945 to 2010. The second part is the structure and objectives of SOEs and
new privatised firms after the introduction of fast-track privatisation during 2004 to 2010. Detailed
data analysis is presented in Section 5.4.
5.1.2 Content Analysis for Evaluating the Government-Stated Objectives
Content analysis has been selected as the second qualitative method to analyse the implications of
the government’s policy on SOEs’ objectives. The selection of content analysis is mainly rationalised
by the importance of the text (Duriau et al., 2007). The literature review in Chapter 2 emphasised
that the government’s policy and objectives statement is potentially biased or vague (Ramamurti,
1987; Zif, 1981) and it is not clearly elaborated for public sector firms (Wong, 2004). This ambiguity is
a reason for this thesis to employ content analysis. Content analysis is used to reveal the implicit and
explicit meanings of government policy for SOEs using documents and archival records when the
policy was developed and promulgated. Neumann (2006) suggested that content analysis could be
used to reveal the unseen or difficult aspects of a text’s content (Neumann, 2006).
The advantage of content analysis is the detail of the information. The relations and implications of
the government’s policy and objectives on SOEs are important aspects of analysis. The government
and SOEs’ manuscripts are the focus of resources to gain detailed information, both explicit and
implicit, that significantly affects SOEs’ objectives. A deeper meaning of the text and the latent
content will enrich the interpretation. Content analysis is employed to understand the content and
text related to the government and the privatisation policy, which affects SOEs’ objectives and
business activities. This is an important part of this study, as content analysis also engages with
value, intention and cognition. Content analysis is specifically utilised for this thesis to explore the
message, value and intention of the government-stated objectives for SOEs. This message, value and
intention are reflected through policies and regulations where the deep meaning of the content and
text is investigated for the purpose of this thesis.
The next step of the content analysis method is coding, which is utilised to quantitatively analyse the
content and text from every manuscript, particularly those that have similar values, intentions and
meanings. Coding is developed to describe the message based on the quantitative approach.
Berelson (cited in Marshal and Rossman, 2006) described content analysis as an objective and
neutral way of obtaining a quantitative description of the content of various forms of
communication; thus, it was important to count the number of times that specific items were
mentioned (Marshall and Rossman, 2006). The content or information is selected based on what was
written—both word and theme—in the policies and reports. As part of this process, the content or
61
information is counted to find the frequency with which the information appears (Neumann, 2006).
The next step is to record all of the content or information from the government’s policies and SOEs’
reports that indicate the objectives. Coding is classified into various categories based on patterns,
themes and chronological events of policy changes. In this method, the objectives are identified and
then categorised into social and economic objectives. This method is also employed to identify the
dominant objectives based on the frequency with which they appear. These objectives are then used
as ‘variables’, which examine whether each institution makes any changes during the period of
study. Two key processes of content analysis in this thesis are the meaning and coding as the basis
for further quantitative analysis.
Interpretive analysis is also employed in this thesis to help understand the meaning and context of
the data. Interpretive analysis focuses on the text as the object of study, which is important for the
study in order to ensure that the text is clear, coherent and makes sense (Myers, 1994; Maitland-
Gholson and Ettinger, 1994). For this study, interpretive analysis is employed to understand the
meaning, sense and coherence of each text or text analogue found in the archival records.
Interpretive analysis is employed because the main data for this study are government and SOEs’
public records. Interpretive analysis is utilised to evaluate the statements and eliminate the bias that
is often found within government records. Some record statements may be written in general terms
for a particular purpose, or the source and value of the policy may not be explicitly stated or
interpreted as stated (Furgeson et al., 2008). These situations may cause these laws and regulations
to be interpreted broadly or in different ways. Therefore, interpretive analysis is employed to make
both the text and text analogues clear and coherent.
5.1.3 Quantitative Method for Relations and Performance Measurement
There are two main purposes for employing the quantitative method. The first is to examine
whether Indonesian SOEs successfully attain the government’s objectives. The second is to evaluate
whether changes in objectives affect SOEs’ performance. Therefore, this section focuses on
providing the methods for measuring the relations and implications of the government’s objectives
on SOEs’ business activities as reflected in their performance. Financial performance indicators and
quantitative tools are utilised to test the relations and implications of the objectives and
performance. Two statistic parameters—two-sample t-test and regression model—are used to test
these relations and implications of the government’s objectives and performance.
A mixed method of qualitative and quantitative analysis is employed because both methods
complement each other. A combination of both qualitative and quantitative methods is an effective
way to conduct research where validity is crucial. A study of mixed methods notes that the
62
quantitative method can identify the representative sample, while the qualitative method assists in
the development of conceptual and instruments of analysis (Johnson et al., 2007). From the
historical path and content analyses, conceptual changes are developed based on patterns, while
instruments of analysis are established based on the identifying samples. Later, quantitative analysis
is employed to confirm and support the analysis by providing richer data and results (Johnson et al.,
2007). The relations and performance implications are measured as the quantitative method for this
study, and the method aims to support and confirm the results.
Measuring performance is an effective tool for evaluating the effectiveness of the control system
and achieving the objectives. There are many tools for measuring the effectiveness of companies’
operations. The most common tool is a financial statement such as earning per share (EPS),
economic value added (Devarajan et al., 1996) or accounting system. Most of these indicators
declare to be effective tools in presenting performance. However, there is no single performance
indicator that is accepted worldwide as the most effective control for business processes (Monks
and Minow, 2008), as most performance indicators have limitations. For example, they can only
present a picture of the company in a limited framework, period or field of performance. Most tools
demonstrate a lack of presenting the whole picture of the corporation. The lack of a single
performance indicator is clear when it is applied to SOEs. For example, the implementation of
common performance measurements, such as private companies, may not be suitable for SOEs. In
several cases, measuring SOEs’ performance is commonly based on the benchmark across similar
industries (Morck and Stangeland, 1996). In practice, this measuring tool cannot accommodate the
social welfare and non-economic objectives. The measuring tool potentially causes problems when it
is not suitable for the objectives. For example, employment productivity may not be a good tool for
SOEs when employment creation is part of the objective. In this thesis, some financial performances
are employed as representative of SOEs’ social welfare. This is described in detail in Chapter 10.
Two statistic parameters are employed in this thesis: two-sample t-test and regression model. The
two-sample t-test has been selected to determine whether the objectives cause SOEs’ financial
performance to present differently from those without the objectives. The result from this test will
signify whether the objectives have a relationship to SOEs’ financial performance. Further, the
regression model is used to examine and estimate the relationship between independent variables
(objectives) and dependent variables (SOEs’ financial performance) where the dependent variables
(performance) are specifically selected from all possible values of independent variables (Groebner
et al., 2005). To support the analysis, the regression model is used to examine the value or
implication of objectives on SOEs’ performance. A similar model is used to test whether the
63
objectives are complementary or conflicting. From this test, a further evaluation is conducted to test
whether the conflicting objectives affect SOEs’ performance.
5.2 Unit Analysis
Unit analysis is key case or variable in research analysis. It is defined as a kind of case, phenomenon
or variable that is collected, researched and analysed (Collis and Hussey, 2003). In social science, unit
analysis is determined as a case or social phenomenon where concept and measuring tools are
developed in data analysis (Neumann, 2006). From these definitions, unit analysis contains two key
factors: a case and an analysis tool or process. Unit analysis varies depending on the main purpose of
the study. The rule for the best selection of unit analysis is the lower or simple level of the
phenomenon, individual case or variable, event, object, relationship or aggregate (Collis and Hussey,
2003). In this study, unit analysis is a relationship between the government and SOEs in the context
of objectives.
The objectives are the variables of analysis. Variables are determined based on whether the
objectives are changed following changes in the government’s objectives and policy. Objectives are
also used to measure the extent to which they affect SOEs’ performance. Early studies that
presented the influence of the government’s socio-political objectives on SOEs’ performance are
identified through the effect of the company’s inefficiency and loss (Aivazian et al., 2005; Bhatt,
1984; Guthrie and English, 1997; Hill, 1982; Morley et al., 1999; Willner, 1999). This study mainly
focuses on the emergence and effect of multiple objectives, and the relations of objectives with
measureable performance. The reason to focus on these variables is the existence of multiple
objectives and characteristic differences that may provide an opportunity for this thesis to develop a
new theory of SOEs. However, measuring SOEs’ objectives is not easy. Performance measurements
for these social welfare objectives often raise a number of critiques. The issue of determining the
framework of social objectives as the government’s objectives is still controversial among a number
of researchers, as the accountability will be biased unless there is a clear definition of social
objectives (Baird, 2001). Several financial performances can be used as a representative of social
welfare financial measurements such as tax or employees. In this thesis, unit analysis uses the
government’s objectives as stated or found through the government and SOEs’ public data, and
SOEs’ performance as shown in their financial reports.
5.3 Data Collection
In this study, archival records are the main source of data. The main reason for focusing on archival
records is because of politically sensitive issues resulting from relations between the government
and SOEs. As part of the government body, SOEs and their business activities may have nuanced
64
politics that become sensitive issues for investigation. Therefore, in this study, Indonesian SOEs and
the government’s public information, such as annual reports, websites, press releases, regulations
and public archival records, are the major data source. Data are collected from 141 publicly listed
and unlisted SOEs’ financial performance during 2004–2010, as well as the government’s regulations
for establishing or amending SOEs until the cut-off date of 2010.
The importance of archival records requires some collecting procedures. Archival records can be
divided into two different types: public archival records and private archival records (Breg, 1989).
This study relies on the secondary data and/or archival records from SOEs and the government as
the primary source. In general, archival and relics are two classifications of sources for historical and
empirical studies. Archival data offer a variety of potential uses for constructing and revealing
indicators of precedents or previous experience that affect the present action and policies (Parker,
1997, 2004). There are some limitations regarding public data. For example, public data are
potentially written for certain audiences, and the access may be restricted or very broad. Further,
the results may be distorted, and using supporting records, such as mass media or actuarial records,
will help to eliminate potential problems (Breg, 1989). As government policy is often written in
general statements that lead to many interpretations, this study will conduct checks and re-checks
regarding the government’s policy. This study also focuses on the government’s documentation,
particularly regulations related to industrial policies and concerns.
As mentioned previously, two research methods are employed in this study. The first is the
qualitative analysis method, which aims to reconstruct the evolution of SOEs’ objectives. For this
historical path analysis, systematic procedures and rules support historical methods for collecting
facts and evidence (Lucey, 1984). For this process, researchers can develop the combination and
interpretation of facts and evidence to obtain answers for their study (Postan, 1939; Parker, 2004).
Although there are many different classifications, this thesis focuses on the classification that is
based on the content, aim, time, place, manner and production based on the written evidence. As
this system and procedure are very clear, the reliability and validity is highly acceptable (Collis and
Hussey, 2003). The second method is quantitative, which focuses on statistic measurements.
Financial performance measurement is the main focus of analysis using this method. The
performance measurement in this study refers to common performance measurement practices,
which focus on financial performance. The performance measurement is based on SOEs’ measurable
social and economic indicators as found and collected from SOEs’ financial reports during 2003 to
2010. As this study engages with a significant amount of data, classification may ease the process of
documentation tracing and analysis. For example, SOEs are categorised based on the Indonesian
Ministry of SOEs’ categories, with modifications for the banking, cement and fisheries industries due

65
to the limited number of SOEs. Banking and financing are classified in the same category, cement
and mining are placed in the same group, and fisheries and farming are classified together. SOE
industries are modified into 17 groups of industries from the existing 33 industries in order to obtain
sufficient data. The objectives are collected during the reconstruction of SOEs’ objectives and
structure, while coding and categories are developed based on the findings from the analyses in
Chapters 6–9. These results are then utilised to examine the relations and implications of the
government’s objectives and SOEs’ performance as the main analysis in Chapters 10 and 11.
5.4 Data Analysis
This study aims to examine whether SOEs are successful vehicles for implementing the government’s
objectives by focusing on two measurement models. The relation of the government and SOEs is the
first model of analysis, referring to the study within SOEs in Canada by Hafsi (1985). The relationship
of the government and SOEs becomes an indicator for classifying and examining the independence
of SOEs in carrying out the real objectives. Next, the study focuses on measuring the implementation
of the government’s objectives through SOEs’ business activities. The focus of this study is the
government’s objectives and Indonesian SOEs’ business activities as a reflection of SOEs’ efforts to
attain the government’s objectives. Financial performance indicators and quantitative tools are
utilised to test the relations and implications of the objectives on SOEs’ performance.
This study focuses the analysis within three different stages, which are selected based on the
propositions and hypotheses developed in Chapter 4. The first stage focuses on historical path
analysis to analyse the evolution of the government’s objectives. The aim of this stage is to
reconstruct the evolution of SOEs in relation to historical changes in the government-stated
objectives for SOEs, and the effect on the current institutional structure. The second stage focuses
on the cycle pattern model to analyse the relations among the objectives. The purpose of this stage
is to examine how SOEs achieve the real objectives. Finally, the third stage examines and estimates
the relations and implications of the objectives on SOEs’ performance. This final stage of analysis is
conducted by applying two statistical tools.
The first stage of analysis in this study focuses on historical studies by emphasising the long history
of economic changes under the historical path framework. The evolution of political and economic
conditions is examined to identify their effect on the evolution of the government-stated objectives
for SOEs. Institutional change theory offers a tool to understand national economic changes and the
transformation of Indonesian SOEs. The sequence of events and patterns refers to the characteristics
of path dependence studies, which focus on the sequence of time, institutional patterns, event
chains, a wide range of social outcomes, large consequences from small events, and impossible to
66
reverse the timeline (Mahoney, 2000; Pierson, 2000). This characteristic gives this study the
opportunity to emphasise the critical events to shape the analysis.
The second stage of the analysis is the quantitative method. Several studies have measured SOEs’
objectives and performance. For example, the cycle pattern study of SOEs in Canada focused on the
relationship between the government and SOEs as an alternative to measuring the government’s
objectives for SOEs. The cycle pattern model was developed based on Hafsi’s (1985) study, which
emphasised three types of relationships: cooperation, confrontation and autonomy patterns as
references for measuring the government’s objectives (Hafsi, 1985). In the cooperation stage, the
value of the company is the value of the government. The growth of business has significant effects
on operation activities when the SOE or firm is no longer influenced by the government and
becomes an autonomous entity. The changes of the company’s pattern into autonomy make the
company more independent in achieving its objectives. In this study, publicly listed and non-
privatised SOEs without privatisation restrictions are in this category. In practice, some key variables
also need to be included and considered, such as industry type, the government’s expectation and
involvement in the business, political and economic environments (Zif, 1981) to classify the SOEs
with special treatment from the government. The study of SOEs in Canada revealed that certain
industries, such as utilities, transportation and communication, were still controlled by the
government through prices and services (Sexty, 1980). In this study, SOEs with privatisation
restrictions are categorised in this group.
This study will also focus on the political and economic environment as an indicator of analysis. The
reason for using the political and economic environment is based on the findings of the previous
literature study of SOEs, which demonstrated the influence of political and economic stability on
SOEs’ performance (Bhatt, 1984). The domination of ideology provides a chance for the state to
control the resources and determine the other objectives. Early studies about public enterprises’
performance showed that politics plays a decisive role for public enterprises to meet the
government’s requirements (Bhatt, 1984; Vernon, 1984). The study also showed how often
management enforces short-term planning and meets long-term planning. Political involvement
potentially intervenes in SOEs with some short-term planning, as found in the study about SOEs’
planning, where most corporate planning tended to become budget-oriented instead of planning-
oriented (Javidan and Dastmalchian, 1988). This condition has a significant influence on the
relationship between the government and the company and performance. As a substantial
relationship is often based on budget subsidies, corporate planning is also an opportunistic objective
measurement because of the possibilities for SOEs to carry out other objectives. The universality of
67
time and condition commonly influences the other objectives, which are potentially confronted with
the real objectives (Estrin and Pérotin, 1991). These indicators are also evaluated in this thesis.
The third stage of analysis is quantitative analysis, which focuses on the relations and implications of
objectives and performance. The quantitative analysis section focuses on measuring the
implementation of the government’s objectives through SOEs’ business activities, as reflected in
their performance. Financial performance indicators and quantitative tools are utilised to test the
implications of the objectives. The evaluation begins by identifying the government’s objectives,
particularly those that present the effects on SOEs’ performance and business activities. Meanwhile,
the process of change is employed to identify the evolution of SOEs’ current structure and
objectives, which may be helpful in supporting the analysis. In this process, the results from the
historical path analysis and content analysis are used as a foundation and framework for
quantitative analysis. The next step is to test the implications of the objectives on performance using
statistical parameters. Two-sample t-test is employed to evaluate whether the objectives show
differences in SOEs’ financial performance. Meanwhile, regression model is used to test and
estimate the relationship between independent variables (objectives) and dependent variables
(SOEs’ financial performance). The same model is utilised to examine and estimate whether the
objectives are complementary or in conflict, and whether they affect SOEs’ performance. Chapters
10 and 11 detail the performance measurement tools.
68
Chapter 6:
The Evolution of Government-Stated Objectives
For State-Owned Enterprises
This chapter identifies the nature of the government-stated objectives for SOEs in the context of the
SOEs’ structural evolution. This study mainly focuses on two main features of change, the
institutional environment and organisational structure which have both affected the government’s
objectives for the SOEs. These two main features are necessary because the socio-economic with
whom environment are regarded to highly influential for organisations as they adjust to the
dynamics of change (North, 1990). Earlier studies show that changes in institutional environments
are consequences of socio-economic dynamics (Meggison and Netter, 2001; Newberry, 1996; 2002).
For example, privatisation has caused a number of governments to re-determine SOEs’ objectives
(Caporaso, 1982; De Castro et al., 1996; Guthrie, 1990). The changes are mostly driven by the
existence of new owners as part of the SOEs structure which may alter the company’s orientation.
In the context of Indonesian SOEs, the socio-economic environment has politically determined the
institutional environment where the SOEs operate. Historical analysis has revealed that economic
policy in Indonesia has swung from centralisation to market orientation as a result of changes in the
socio-economic situation. Focusing exclusively on the period from 1945, after Indonesia became an
independent nation, up to 2010, several earlier studies indicate that Indonesia’s socio-economic
situation has determined the SOEs’ institutional environments (Abeng, 2001; Anoraga, 1995; Higgins,
1958; Siahaan, 1996; Sutter, 1959). Since SOEs is sensitive to the changes of the policies, the changes
socio-political environment for this period of study may cause some changes in the government
policy for SOEs.
This chapter is largely historical description, based on an interpretive analysis of government and
SOE documents. In terms of policy and political regimes, this period of study is divided into three
periods. The first is the Indonesianisation. The second is nationalisation period. Both
Indonesianisation and Nationalisation occur during the Old Order regime of 1945–1965 under
Sukarno’s leadership. The third period is the corporatisation period starts from the New Order
regime of 1966–1998, under Suharto’s leadership; and followed by the current reformation regime
from 1998 to 2010. This chapter’s results are important to support the analysis in the next chapters,
which focus on current Indonesian SOEs. The chapter is divided into four sections, each of sections
6.1 to 6.3 examine a different era, based on the fundamental changes that significantly affected the
SOEs’ structure and objectives: Section 6.1 examines Indonesianisation from 1945 to 1958; Section
69
6.2 looks at nationalisation from 1958 to 1965; Section 6.3 the corporatisation period from 1969 to
2010; and Section 6.4 discuss the government-stated objectives for the SOEs based on the analysis
of the previous sections.
6.1 The Indonesianisation Period (1945-1958)
Indonesianisation is the most crucial period of the Indonesian SOEs evolution. This is the earliest
event of Indonesian SOEs evolution. From the path dependence study by Mahoney, he highlights the
influence of earliest events as the initial condition that rules out the final outcome of the sequence
(Mahoney, 2000). His study result is used as guidance for this thesis to examine the early period of
the Indonesian SOEs.
The changes in socio-political circumstances during the initial period of Indonesianisation had
particular consequences with the government choosing to centralise control. Following Indonesian
independence in 1945, taking over from Dutch control of economic and political authority, under
pribumi, became crucial and demanding.5 Conflict between the two political powers, the new
Republic of Indonesia and the Dutch Federation, occurred in the initial period of Indonesian
independence, particularly when the Dutch put much effort into protecting their economic interests
in Indonesia (Anderson, 1983; Dick, 1985; 2002). This continuance of Dutch domination in economic
and political activities caused wide resentment from pribumi, which generated the Indonesianisasi
(Indonesianisation) programme as the main agenda for state administration (Sutter, 1959).
Indonesianisation of political control began as the government pursued a centralist control policy
under a nationalisation agenda. The establishment of Panitia Persiapan Kemerdekaan Indonesia
(PPKI/Committee for Indonesian Independence) began the initiative for an Indonesian Independent
state in 1945. Later, PPKI also drafted the 1945 Constitution of Indonesia (Siahaan, 1996; Sutter,
1959), which emphasised the importance of the government in controlling the nation’s socio-
economic activities and resources, particularly the resources and production vital for the state
(Constitution 1945).
The crucial requirement for pribumi control of economic activities faced some obstacles. Political
instability and lack of skills and resources were obstacles for the Indonesianisation programme.
Limited pribumi participation in economic activities was prompted by previous Dutch policy to ban
pribumi from taking part in economic activities (Adams, 1996; Kroef 1954; 1955). This restriction on
participating in economic activities developed into a restrictive cultural influence on Indonesian
entrepreneurial growth and ambitions (Adams, 1996). This ensured that Indonesian economic
activities during this period were dominated by Dutch, Chinese and Arabian merchants, while
5 Pribumi is the official name for the indigenous people of Indonesia.

70
pribumi involvement was limited (Anderson, 1983; Kroef, 1954). This situation meant the
Indonesianisation of the economy was not easily implemented. Nationalisation of resources and
enterprises prevented the potential empowerment of former colonial powers and outside nations
participating in economic activities. This was important during the initial period of Indonesian
statehood. Therefore, pribumi and the state used enterprises to create jobs; this was seen as
important for national economic development (Constitution 1945; Sutter, 1959).
The socio-political environment affected the emergence of centralised economic policy in Indonesia.
Indonesia’s long colonial period had several implications, such as lack of skills and cultural influences
banning pribumi participation in national economic activities (Higgins, 1958). These effects hindered
the Indonesianisation of the economy. Consequently, centralising economic policy was crucial to
mobilising pribumi economic activities. These were the reasons for state welfare leaders to
emphasise both the importance of government in the provision of public utilities and services, and
the importance of collective effort or a cooperative society (Higgins, 1958). In practice, centralisation
of economic policy under the government occurred at various time during 1945 to 2010, and caused
significant policy changes in relation to SOEs. The army’s centralised control of nationalised Dutch
enterprises during nationalisation in 1958, for example, endangered national objectives while the
country was still confronted with instability issues (Anderson, 1983).
From 1945 to 1948, there were rapid political changes caused by competition between political
parties. This period was one of deep instability and political uncertainty, which hindered the
government’s application of market orientation policies (Higgins, 1958; Sutter, 1959). Indonesia’s
economic recovery became a crucial concern of the Indonesian government after the handover of
sovereignty. The result of the Round Table Conference in The Hague in 1949 forced the Dutch
government to transfer full sovereignty to the Indonesian government. The transfer also created the
opportunity for Indonesian leaders to determine national objectives without intervention from the
Dutch government. The extreme socio-economic condition became a national priority agenda; the
government created a number of economic plans to solve the country’s socio-economic problems.
In 1949, the Dutch government announced Indonesian sovereignty through the Round Table
Meeting. The meeting had major effects on the Indonesian socio-political and economic situation.
The government set the economic plan by focusing on socio-economic recovery. This began through
economic management development, implementing the Rencana Pekerjaan Industri (Industrial Plan)
in 1950 and Rencana Urgensi Perekonomian (RUP/Urgency Economic Plan) in 1951 (Bajpai, 1995).
The Indonesian economy was the main project of the Benteng Program (Fortress programme), which
was part of RUP (Dick, 2002). The Benteng Program emphasised industrial development as the
vehicle for economic activities. The government implemented the Benteng Program by opening
71
certain categories of industries for Indonesian importers who had trade credits from Bank Negara
Indonesia (State Bank Indonesia/BNI) (Dick, 2002).
The commencement of the Indonesianisation programme, the lack of private participation, and
political instability were reasons for the government to control the socio-economic situation that
might lead to potential conflicts of interest arising from independence. Therefore, the 1945
Constitution of Indonesia emphasised the importance of government in controlling the nation’s
socio-economic activities and resources (Constitution 1945; Higgins, 1958). Two articles of the
Constitution, Articles 33 and 34, underlined government control policies. Article 33 of the 1945
Constitution of Indonesia highlighted the importance of the state roles in the national economic
activities as:
(1) The economy shall be organised as a common endeavour based upon the principle of family
system (kekeluargaan).
(2) Production branches which are important for the state and which affect the livelihood of the
people at large shall be controlled by the state.
(3) The land and water and the natural resources contained therein shall be controlled by the state
and shall be used for the greatest prosperity of the people. The national economy shall be
organised based on economic democracy with the principles of togetherness, efficiency with
justice, sustainable and environmental perspective, independence, as well as by maintaining
balance between progress and unity of the national economy. Further provisions concerning
the implementation of this article shall be regulated in law.
(Source: Unofficial English translation, downloaded from the Indonesian State Secretariat’s website 29 September 2013)
Focusing exclusively on the article above, there were three important items in regard to Indonesian
economic policies. The Constitution emphasised the importance of collective efforts, the control of
natural resources and production vital to the state (Abeng, 2001; 2002; Constitution 1945; Ruru,
2006). These were references for the implementation of centralisation economic policy. In addition
to Article 33, Article 34 was the main reference for government roles in the provision of public goods
and services. The article highlighted this role as:
(1) Poor and neglected children shall be taken care of by the state.
(2) The state shall develop a social security system for the entire people and shall empower the weak
and underprivileged people in accordance with human dignity.
(3)The state shall be responsible for the provision of adequate health service facilities and public
service facilities. Further provisions concerning the implementation of this article shall be
regulated in law.
(Source: Unofficial English translation, downloaded from the Indonesian State Secretariat’s website, 29 September 2013)

72
This article underlines the importance of government duty in the provision of public utilities.
Indonesianisation and the socio-political situation were the reasons behind these statements. These
constitutional provisions were also a reference for the government to establish state enterprises and
jobs, which were important, particularly for national economic improvement.
6.1.1 Structure and Objectives of the first SOEs
Pressure to implement Indonesianisation was a reason for the government to establish new state
enterprises. Prior to the establishment of BNI as the first state enterprise, the government set up
Pusat Bank Indonesia (Indonesia Central Bank). The main duty of Pusat Bank Indonesia was to co-
ordinate the government’s economic programme; including circulating Indonesian money and
managing the foreign exchange (Sutter, 1959). In 1946, BNI replaced Pusat Bank Indonesia. The main
aims of BNI were to facilitate economic activities purely under Indonesian authority, and to circulate
the Oeang Republik Indonesia (ORI) as the official Indonesia currency (BNI 2008a; 2008b). As the only
state bank owned by the Indonesian government at this time, BNI played multiple roles; such as
monetary, debt and credit management (Hensley, 1964), including being the central bank. BNI
operated as the central bank for the Indonesian government until 1949. As the Dutch government
was still keen to control Indonesian economic activities, the Dutch government transferred De
Javasche Bank (DJB) to act as the central bank of Indonesia. In 1953, the Indonesian government
purchased DJB’s ownership, nationalised it, and commissioned it officially as the Indonesian central
bank.
The requirement for the Indonesian government to control economic activities was important,
particularly when the Dutch army blockaded inter-island trading to control the Indonesian trading
system. This blockade compelled the government to establish two state trading enterprises: Bank
and Trading Corporation (BTC) and Sumatra Banking and Trading Corporation, known as CTC. Both
new state enterprises were established to resolve the inter-island trading blockade. In practice, the
establishment process made their functions and objectives different. BTC was set up as part of BNI
due to a policy issue. Consequently, BTC held multiple objectives, which were less likely to be
commercial objectives. In contrast, CTC was set up by the government with support from Indonesian
entrepreneurs; therefore, CTC was likely to be more commercially oriented than BTC (Sutter, 1959).
Following the recognition of Indonesian sovereignty, the government implemented a market
orientation policy. The government introduced the Benteng Program, which focused on improving
national market activities through the role of pribumi. The government established NV Bank Industry
Negara (BIN/State Industry Bank), which aimed to provide financial assistance for economic recovery
and to manage state trusts for a number of government industries. BIN was operating on a
73
commercial basis when government regulated its financial separation (Sutter, 1959). The main
function of BIN was to provide long-term credit for all projects and economic activities under the
Rencana Urgency Perekonomian (Economy Urgency Plan) and Benteng Program (Glassburner, 1962;
Kanumoyoso, 2001). In practice, the role of BIN was not limited to supporting government economic
activities. In addition to its roles as the financial supporter, organiser and/or sponsor for a number of
private and government projects, BIN was also involved in company stock trading and taking over
some private companies (Hensley, 1964; Siahaan, 1996). By 1960, BIN became the biggest state
holding bank, controlling more than 40 companies in various industries (Hensley, 1964; Siahaan,
1996; Sutter, 1959).
6.1.2 Key Points Analysis from Indonesianisasi Period
Referring to Mahoney’s path institutional analysis, the earliest period of historical path is the most
influence events that affect the future outcome. The earliest period of Indonesian SOEs evolution
points out some factors that become foundation for the development of Indonesian SOEs. There are
two driving factors for the emergence of Indonesianisation program: the conflict between the
Indonesian and Dutch government to protect their interest and sovereignty in Indonesia, and the
requirement to empower the pribumi involvement in socio-economic activities in Indonesia. These
driving factors lead to the government control policy. Centralisation of economic policy is also aimed
to prevent the conflict of interest over the resources and lack of pribumi involvement in socio-
economic activities. These situations, later, turn into the background for the PPKI to set control
policy under the government hand as stated in the 1945 Constitution of Indonesia. As the
consequence of this framework, the structure and objectives of state enterprises during the
Indonesianisation period were set for the socio-political purposes.
6.2 The Nationalisation Period (1958-1966)
The nationalisation period began in 1958 when the conflict between the New Indonesia Republic
and the Dutch Federation led to economic and political catastrophes. Under Sukarno’s leadership
and through Ekonomi Terpimpin (Guided Economy), the centralisation of socio-political and
economic policy was stronger. Through Ekonomi Terpimpin, the government affirmed the
importance of Indonesia to return to, and implement, the 1945 Constitution of Indonesia (Siahaan,
1996).6 This also meant the end of market orientation policy which led to centralisation of economic
policy under the government hands.
6 During the parliamentary period, the government implemented the 1950 Provisional Constitution of
Indonesia.

74
Instability in the socio-political and economic situation caused the failure of government to improve
the economic situation. The rejection of the Irian Barat (West Irian/West Papua) resolution and
Dutch enforcement to protect their businesses in Indonesia sharpened Indonesian resentment
(Anderson, 1983; Kanumoyoso, 2001). This situation provoked a massive labour strike and economic
blockade in 1965. The strike generated crucial action from the Indonesian government to take over
numerous Dutch companies, as mentioned in Undang-Undang no. 18/1958 tentang Nasionalisasi
Perusahaan-Perusahaan Belanda (Nationalisation Act no. 18/1958/ UU Nasionalisasi 1958). The
centralisation of control policy under the Indonesian government strengthened when a labour strike
led to a massive takeover of Dutch companies (UU Nasionalisasi 1958; The American 1960). Military
involvement was needed to protect and take over supervision of many nationalised companies,
particularly in the outer islands (Crouch, 1975). Following nationalisation, the government managed
and supervised 822 companies under the state enterprise structure.
In the political context, the strike caused a change of political orientation in Indonesian leaders,
particularly when Indonesia encountered economic blockade by several western European countries
and the United States of America (USA). This economic blockade caused massive damage to
Indonesia’s international trading (Dick, 2002). At the same time, the Soviet Union and Eastern
European countries offered investment aid towards the recovery of Indonesia’s economic situation
(Siahaan, 1996). However, communist riots in 1965 devastated the Indonesian economic and
political situation, leading to a transfer of political power in 1966 from the Old Order regime to the
New Order regime.
6.2.1 Change to the SOEs Structure and Objectives
In 1958, nationalisation was a driving factor for the Indonesian government to re-apply
centralisation of economic policy. As indicated previously in Section 6.2, economic and political
instability following the massive labour strike encouraged the Indonesian government to protect the
Dutch companies’ assets by taking over control of companies (The American, 1960). The majority of
nationalised companies were classified under Dutch classifications: IBW (Indonesische Bedrijvenwet)
and ICW (Indische Comtabiliteitswet wet). At the same time, the Indonesian government took over
the control of several different structures of companies. This later caused some difficulty for the
government in managing them. As a result of nationalisation, the government managed and
supervised 822 state enterprises, which were classified as:
- IBW
State enterprises where capital came from the state budget as loans; the companies’
objectives were profit-oriented.

75
- ICW
State enterprises where capital came from state budget as equity; the company constitution
objectives were social welfare.
- Nationalised Dutch companies.
- Private companies under BIN and BNI, due to their financial problems.
- Former bureau or agencies under a government department (Anoraga 1995; Diah 2003).
To manage these companies, the government established Badan Nasionalisasi Perusahaan-
Perusahaan Belanda (BANAS/Nationalisation Body for Dutch Companies). BANAS was established to
ensure that all nationalised assets were controlled by the state (UU Nasionalisasi 1958). Following
the establishment of BANAS, the government took further action for these companies; such as,
mergers, acquisitions, transferring companies to a new status, and transferring control to regional
government (Kanumoyoso, 2001; Nugroho & Wrihatnolo, 2008). At the same time, the government
created some new state enterprises to take over the Dutch nationalised companies’ activities
(Abeng, 2001; Diah, 2003; Kanumoyoso, 2001; Ruru, 2006).7 These takeovers were mostly aimed at
providing public utilities by using their facilities to distribute staples to Indonesians (Kanumoyoso,
2001). Social welfare maximising was strongly represented as a role for these new state enterprises.
The takeovers and centralisation of control of these 822 companies led to financial problems. This
was because most companies, particularly with IBW and ICW status, were not-profit oriented; their
main roles were for the provision of social and public services for communities (Research, 1998). At
the same time, others were companies supervised by other state enterprises due to their financial
problems. The control authority later resolved this by separating the control authority between
central and regional governments. The central government still held most companies or state
enterprises with public utility provision functions, while the regional government supervised the rest
of the companies, which did not have these duties.
These massive takeovers caused supervisory issues, which also affected the SOEs’ structures and
objectives. Diversity in organisational structure and the size of the new state enterprises motivated
the government to introduce a new structure under the Perusahaan Negara (state company)
structure. Perusahaan Negara structure was implemented in 1960, through Peraturan Pemerintah
no. 19/1960 tentang Perusahaan Negara (Perusahaan Negara Rule no. 19/1960/ Perusahaan Negara
Rule 1960). The law regulated the Perusahaan Negara under their respective sector’s ministries
7 Most of the Dutch nationalised companies were trading companies. The takeover occurred as the
government established new companies under Badan Urusan Dagang (the government body to manage the trading nationalised companies). The takeovers were: PT Budi Bahkti to continue NV Boorsumij, PT Aneka Bakti to continue NV Internatio, PT Juda Bhakti to continue NV Jacobson van de berg, PT Tulus Bhakti to takeover NV Lindeteves, and PT Marga Bahkti to takeover NV Geowehry.
76
(MSOEs, 2008). Through this new structure, the government began to categorise the companies’
objectives into provision of services, handling of public interest, and obtaining revenue (Perusahaan
Negara Rule 1960; MSOEs 2008). The establishment of the Perusahaan Negara structure was
followed by the establishment of Badan Pimpinan Umum (BPU/General Management Board), who
acted as the state representative by conducting a management function for individual state
enterprises, or coordinating several Perusahaan Negara (Perusahaan Negara Rule 1960). In practice,
the establishment of Perusahaan Negara did not fully resolve the supervisory issue. Badan Pimpinan
Umum roles overlapped with the director’s duty, and also required the involvement of military and
bureaucrats with little talent for managing the companies (Abeng, 2001; 2002). Meanwhile, the
introduction of the Perusahaan Negara structure was not equally applied to all state enterprises.
Several state enterprises, such as Pertamina and the state banks retained the same status under
separate legal arrangements (MSOEs, 2008). This situation left a number of Perusahaan Negara still
aligned with bureaucratisation, which led to poor performance, inefficiency and becoming a state
financial burden. This situation contrasted with the state’s expectations when Perusahaan Negara
was instituted, which was to become the state’s production and economic power.
6.2.2 The Key Points from Nationalisation period
The key points from nationalisation period are the returning of control over the nationalised
resources under the government hands through nationalisation. The centralisation of control over
resources occurred through the role state companies in order to prevent the control abusing
following the nationalisation. Centralisation of control under the government led to the introduction
of new structure of Perusahaan Negara. The new structure resulted in the roles of state companies
from socio-political to become state production and economic power.
6.3 The Corporatisation Period (1966–2010)
Prior further analysis for this session, it is necessary to clarify the context of corporatisation. The
corporatisation of Indonesian SOEs’ has started since 1966 when the government introduced three
structure of Perusahaan Negara. However, this corporatisation was limited to management scope.
In 2003, the corporatisation principles were fully implemented to entire SOEs. The description of
corporatisation in this section will be divided into two sub-periods, under the Perusahaan Negara
structure from 1966 to 1983, and under the Badan Usaha Milik Negara (BUMN/SOEs) structure from
1983 to 2010.
6.3.1. Under Perusahaan Negara structure (1966-1983)
The change of political power in 1966 caused some fundamental changes in governing the
Perusahaan Negara. Economy stability was the government’s agenda priority, focusing on market
77
orientation policy. This new policy affected Perusahaan Negara roles in Indonesia’s economic
market activities. Perusahaan Negara was encouraged to be an economic pioneer in the Indonesian
market; this included running their business competitively with private and foreign companies. The
New Order regime emphasised the importance of national economic stability and rehabilitation, as
the application of neoliberal macro-economic policies, to allow private and foreign participation in
Indonesian national economic activities (Nugroho & Wrihatnolo, 2008). Through this new policy, the
government’s involvement in Perusahaan Negara began to reduce, following the introduction of
Keputusan MPR no 23/1966 (Consultative Assembly Rule no 23/1966/TAP MPR 1966). The TAP MPR
no 23/1966 underlined two main issues of Perusahaan Negara; inefficiency and management issues.
As a consequence of these issues, the Assembly underlined the roles of government in Perusahaan
Negara as limited to that of an advisor (MSOEs, 2008; Nugroho & Wrihatnolo, 2008).
Market orientation policy and national economic stability was the New Order regime’s economic
agenda following political catastrophe in 1965. Indonesia’s new regime priority agenda was focused,
with economic policy on stabilisation, rehabilitation and development (Arndt, 1981). Market
orientation policy replaced the former centralisation economic policy. Economic development was
centred on stabilisation and rehabilitation through the socio-political, economic and military spheres
as three characteristic of New Order regime at its initial period of transition (Anderson, 1983).
Market orientation policy, as part of the new economic policy under the new regime, provided
opportunity for the private sector to engage actively in the Indonesian economy, while the state’s
role was limited to social welfare development (Arndt, 1981; Dick, 2002; Nugroho & Wrihatnolo,
2008). The government started to open a number of industries to private and foreign investors,
although several industries were still under government control through the role of SOEs. The role of
SOEs during this period was mainly aimed at supporting the government’s economic development.
These policies showed that the government started to reduce its involvement in economic activities,
which had some implications for SOEs’ roles and functions. The government later introduced new
structures of Perusahaan Negara, based on their function and roles. The introduction of market
orientation policy started to ensure that the economic objectives of the SOE meshed with the
provision of public utilities.
6.3.1.1 Change to the Structure and Objectives of Perusahaan Negara
The implementation of The TAP MPR no 23/1966, in regard to the Perusahaan Negara issue, was
revealed through the issuances of Instruksi Presiden (INPRES) no. 17/1967 tentang Pengarahan dan
Penyederhanaan Perusahaan Negara Dalam Tiga Bentuk Badan Usaha Milik Negara (INPRES for
Simplification of Perusahaan Negara structure no. 17/1967/INPRES Perusahaan Negara 1967), and
the Undang-Undang Bentuk-bentuk Usaha Negara no. 19/1969 (State-Owned Structure Act no.
78
19/1969/UU Badan Usaha Negara 1969), regarding the new structure of Perusahaan Negara.
Through these laws, the government introduced a new management system and structure for
Perusahaan Negara. Although Perusahaan Negara remained controlled by related sectoral
ministries, the new structure of Perusahaan Negara required the Perusahaan Negara to be focused
on economic efficiency, reducing financial burden and improving the performance. Through these
rules, the Perusahaan Negara were classified into three categories, based on their socio-economic
functions and roles (Abeng, 2001; MSOEs, 2008; Nugroho & Wrihatnolo, 2008), as shown in Table
6.1. These classifications are:
– Perjan (Perusahaan Jawatan/Bureau Enterprises) are defined as enterprises operating in public
service areas that provide vital and strategic utilities, without any profit-making duty. These
enterprises were attached to ministries and managed, based on the mechanism of management
of state budgets, since they were financed from the government’s budget without separate state
assets being invested. The government was positioned as the owner of enterprises through the
ministry. The management was directly appointed and controlled hierarchically by government
and civil servants. Perjan were transferred from IBW status.
– Perum (Perusahaan Umum/Public Company) are defined as incorporated entities operating in
public utility spheres, and are fully owned by the government. These enterprises were also
charged with making a profit and were managed based on the corporation system. Even though
Perum obtained some subsidies, the state assets invested in them were constituted as separate
state assets. The management was appointed and controlled by the government and their
official status was specifically organised. Perum were transferred from state enterprises status.
– Persero (Perseroan Terbatas/Limited Incorporation) are defined as corporations where shares
were wholly or partly owned by the government, and these organisations were required to
operate selected business activities on a commercial basis. The management was appointed by
shareholder meetings. The employees’ status and their scope of activities were treated as
private sector contracts. Persero were transferred from ICW, which referred to commercial law
(Wetboek van Koophandel voor Indonesie) Staablad 1847.23 (INPRES Perusahan Negara 1967;
UU Badan Usaha Negara 1969; Abeng, 2001; Anoraga, 1995; MSOEs, 2008; Nugroho &
Wrihatnolo, 2008; Research, 1998).
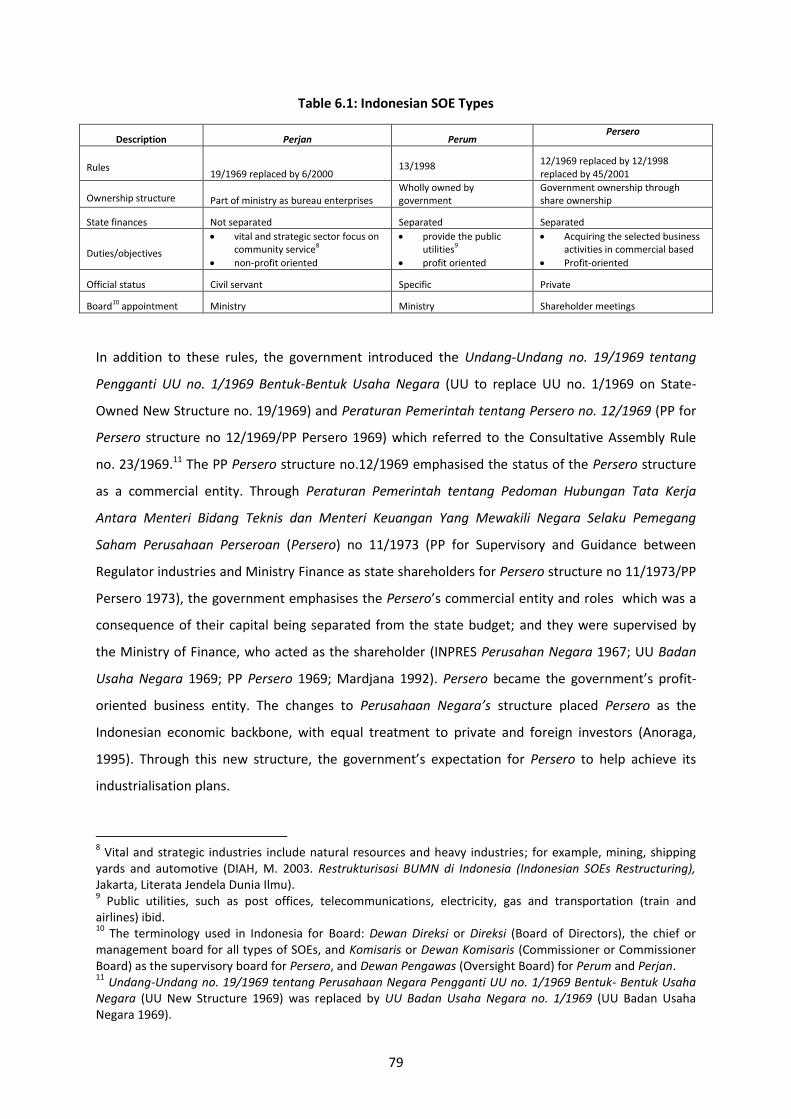
79
Table 6.1: Indonesian SOE Types
Description Perjan Perum Persero
Rules 19/1969 replaced by 6/2000
13/1998 12/1969 replaced by 12/1998 replaced by 45/2001
Ownership structure Part of ministry as bureau enterprises Wholly owned by government
Government ownership through share ownership
State finances Not separated Separated Separated
Duties/objectives
vital and strategic sector focus on community service8
non-profit oriented
provide the public utilities9
profit oriented
Acquiring the selected business activities in commercial based
Profit-oriented
Official status Civil servant Specific Private
Board10 appointment Ministry Ministry Shareholder meetings
In addition to these rules, the government introduced the Undang-Undang no. 19/1969 tentang
Pengganti UU no. 1/1969 Bentuk-Bentuk Usaha Negara (UU to replace UU no. 1/1969 on State-
Owned New Structure no. 19/1969) and Peraturan Pemerintah tentang Persero no. 12/1969 (PP for
Persero structure no 12/1969/PP Persero 1969) which referred to the Consultative Assembly Rule
no. 23/1969.11 The PP Persero structure no.12/1969 emphasised the status of the Persero structure
as a commercial entity. Through Peraturan Pemerintah tentang Pedoman Hubungan Tata Kerja
Antara Menteri Bidang Teknis dan Menteri Keuangan Yang Mewakili Negara Selaku Pemegang
Saham Perusahaan Perseroan (Persero) no 11/1973 (PP for Supervisory and Guidance between
Regulator industries and Ministry Finance as state shareholders for Persero structure no 11/1973/PP
Persero 1973), the government emphasises the Persero’s commercial entity and roles which was a
consequence of their capital being separated from the state budget; and they were supervised by
the Ministry of Finance, who acted as the shareholder (INPRES Perusahan Negara 1967; UU Badan
Usaha Negara 1969; PP Persero 1969; Mardjana 1992). Persero became the government’s profit-
oriented business entity. The changes to Perusahaan Negara’s structure placed Persero as the
Indonesian economic backbone, with equal treatment to private and foreign investors (Anoraga,
1995). Through this new structure, the government’s expectation for Persero to help achieve its
industrialisation plans.
8 Vital and strategic industries include natural resources and heavy industries; for example, mining, shipping
yards and automotive (DIAH, M. 2003. Restrukturisasi BUMN di Indonesia (Indonesian SOEs Restructuring), Jakarta, Literata Jendela Dunia Ilmu). 9 Public utilities, such as post offices, telecommunications, electricity, gas and transportation (train and
airlines) ibid. 10
The terminology used in Indonesia for Board: Dewan Direksi or Direksi (Board of Directors), the chief or management board for all types of SOEs, and Komisaris or Dewan Komisaris (Commissioner or Commissioner Board) as the supervisory board for Persero, and Dewan Pengawas (Oversight Board) for Perum and Perjan. 11
Undang-Undang no. 19/1969 tentang Perusahaan Negara Pengganti UU no. 1/1969 Bentuk- Bentuk Usaha Negara (UU New Structure 1969) was replaced by UU Badan Usaha Negara no. 1/1969 (UU Badan Usaha Negara 1969).
80
Through the PP Persero no 12/1969, Persero was encouraged to implement corporatisation. The PP
Persero no 12/1969 was the initial steps of corporatisation process particularly for Persero by
emphasised the profit oriented objective in order to reduce the state financial burden. The
government management and supervisory function within Persero has been replaced by board
management (directors) and board of supervisor (commissioners). In practice, Persero still met
several issues, such as performance, regulation and management. Monopolies and privileges were
still a barrier for companies operating effectively and fairly (Nugroho & Wrihatnolo, 2008; Siahaan,
1996). This was because Persero still had an obligation to become government economic backbone
to meet the industrialisation plans. In the meantime, military and bureaucratic involvement
remained strong, with a number of Perusahaan Negara’s management, including Persero structure,
being dominated by military officers (Crouch, 1975). These involvements and privileges led to less
concern for the government and Persero to focus on profit objectives.
6.3.2 Under Badan Usaha Milik Negara (BUMN/SOEs) structure (1983–2003)
Increasing oil prices in the early 1980s actuated the implementation of centralised economic policy
by the government. Increasing oil prices motivated the government to enforce protectionist policies,
particularly for foreign investors, restricting a number of industries to being SOEs, applying
monopolies and investment restrictions (Fane, 1999; Pangestu, 1990). The reason for this was the
government’s ability to support SOEs’ business activities from oil revenue. A number of industries
were monopolised as for Perusahaan Negara only. This situation created an opportunity for the
SOEs and the government to increase their activities. As SOE control was under their technical
ministries, this caused the development of social welfare maximising expectations, and resulted in
the involvement of bureaucrats and the military in the SOEs’ business activities. However, the
government’s ability to harness financial resources from oil revenue resulted in fiscal problems when
the oil price went down (Fane, 1999). These situations led to some financial problems for the
Perusahaan Negara, as well as fiscal problems for the state when the oil price went down. Fiscal
problems became a crucial pressure for the government in resolving the national economic
situation. A massive infrastructure investment by the government and the SOEs contributed to the
Indonesian financial problems. The government’s evaluation of Perusahaan Negara during this
period revealed that the majority of Perusahaan Negara showed poor performance (Pangestu &
Habir, 1989). Consequently, the government sought to improve the performance of the SOEs and to
resolve its fiscal problems through privatisation.
The requirement to improve the Perusahaan Negara’s performance encouraged the government to
introduce the new structure of BUMN/SOEs. This new structure was also driven by the intensive
market orientation policy, when the government opened a number of industries to private
81
participation; these had previously been monopolised by Perusahaan Negara, unless the industries
were affected by the need to provide community livelihoods (Panglaykim & Thomas, 1967). Through
Peraturan Pemerintah no. 3/1983 tentang Tatacara Pembinaan Perusahaan Jawatan (Perjan),
Perusahan Umum (Perum) dan Perusahaan Perseroan (Persero) (PP Pembinaan Perusahaan Negara
no. 3/1983: Supervisory and Governing Procedure and Guidance Perusahaan Negara for Perusahaan
Jawatan [Perjan] Perusahaan Umum [Perum] and Perusahaan Perseroan [Persero]), the government
underlined the new structure for these SOEs and the importance of economic objectives. The new
structure of the SOEs was intended to give clear objectives and roles for Persero, as both
government and business entities (PP Pembinaan Perusahan Negara no 3/1983; MSOEs 2008). At
the same time, the government separated its functions from the role of maximisation of social
welfare under Perum and Perjan status.
The centralisation of economic policy is also factor that leads Indonesian to financial crisis in late
1990s. Indonesia was the one of the countries most affected by the 1997 Asian financial crisis. The
requirement to resolve the national financial problems led to acceptance of financial assistance from
the IMF through the Letter of Intent (LoI) (Wise, 2002), which pointed out the importance of
government in conducting privatisation as part of the assistance requirements. While the SOEs were
incorporated entities, their structure did not allow them to conform to market conditions. The LoI
engagement encouraged the government to restructure SOEs in order to meet the requirement to
fast-track privatisation.
6.3.2.1 Structure and Objectives of BUMN/SOEs
The introduction of the Perusahaan Negara structure and the distribution of control did not fully
solve the companies’ problems. Poor performance, state involvement through bureaucrats and the
military, and monopolies were major problems that Perusahaan Negara confronted in the early
1980s. This situation motivated the government to introduce the BUMN/SOE structure. The
introduction of the BUMN (or SOE) structure was the beginning for SOEs to implement corporate
principles, particularly for the Persero structure. Through the new rules, the government underlined
the requirement for Persero, as business entities, to apply several business entity clauses, such as
management structure, internal audits and strategic plans (PP Pembinaan Perusahaan Negara no 3/
1983). This implementation of certain clauses initiated corporatisation for Indonesian SOEs, even
though in practice, these corporatisation principles were not fully implemented. To facilitate the
implementation of these corporatisation principles, the government required the Persero to comply
with the Indonesian Undang-Undang Perseroan no. 1/1995 (The Indonesian Corporate Act no.
1/1995). The government separated the shareholder and regulatory roles for Persero by transferring
82
the Persero’s supervisory authority to the Ministry of Finance. Meanwhile, for the other structures,
Perum and Perjan, the supervisory authority remained under related sectoral ministry supervision.
Privatisation became one of the LoI’s requirements for the government to receive assistance. At the
same time, SOE structures, which were not fully incorporated, became another problem for the
success of privatisation during this period. Following the introduction of the new Corporate Act no.
1/1995 in 1998, the government replaced the PP Persero no. 12/1969 with the Peraturan
Pemerintah no. 12/1998 tentang Perusahaan Perseroan (PP Limited Liability/Persero no. 12/1968)
for Persero, and issued the Peraturan Pemerintah no. 13/1998 tentang Perusahaan Umum (Perum)
(PP Perum no. 13/1998) for Perum. Both new decrees underlined the importance for Persero and
Perum to obtain revenue. Through these laws, the financial objectives became part of all Perum and
Persero objectives. However, these new rules did not help for the success of privatisation during this
period. Several SOEs failed to be privatised due to socio-political issue. Therefore, the government
introduced fast-track privatisation.
Fast-track privatisation was a motivation for the Indonesian government to rearrange the SOEs
structure. There were two main changes for the government to facilitate fast-track privatisation: the
implementation of full corporatisation principles and the restructuring of the SOEs. The restructuring
of SOEs occurred as the government eliminated Perjan structure. The Perjan structure was reduced
in 2005, when the government transferred 15 Perjan to their relevant sectoral ministries authorities,
and acquired four fertiliser holding SOEs under PT Pupuk Sriwijaya (PT PUSRI/Fertiliser Holding
SOE)12. The main reasons for these transfers were to eliminate budget constraints from Perjan
status, focus on the implementation of fast-track privatisation policy, and encourage the SOEs to be
more concerned with financial objectives. Perjan structure was considered to be a barrier for the
government to implement full corporatisation principles where profit became a main concerned for
government and SOEs. This restructuring was followed by full implementation of corporatisation
principles and financial objectives such as efficiency and profit. These were intensively applied in line
with the provision of public utilities (UU BUMN 2003).
6.3.3 The Key Points from Corporatisation Period
This corporatisation period presents three key points of SOEs evolution. The first point is the
introduction of economic or financial objectives such as profit and efficiency. Profit has been part of
the Perusahaan Negara objectives since the beginning of corporatisation period in 1966. Later, this
introduction of profit objective encourages to the establishment new structure of Perusahaan
12
Thirteen Perjan Hospital SOEs were transferred to the Ministry of Health, two Persero Mass Media, PT Televisi Republik Indonesia (Television Republic Indonesia/Public Television) and PT Radio Republik Indonesia (Radio Republic Indonesia/Public Radio) under the supervision of the Ministry of Information.
83
Negara for Perum and Persero structure, while Perjan remains focusing on social welfare objectives.
Second is the beginning of privatisation which later will be analysed in Chapter 7. Third, the
development of new structure of BUMN/SOEs is aimed to accommodate these economic or financial
objectives and privatisation. These economic or financial objectives encourage the establishment of
new structure of SOEs for Perum and Persero structure only.
6.4 Identifying Government-Stated Objectives for State-Owned Enterprises: Discussion
This section focuses and identifies the findings and analyses the key points from each section of the
evolution of Indonesian SOEs. This section is also analysing proposition one whether the
introduction of new policy regarding SOEs roles and expectations affect government stated
objectives for SOEs. The proposition expects that the introduction of new policy for SOEs regarding
roles and objectives will change the government expectation for SOEs.
Using the historical path analysis which refer to path dependence, this section examines the theory-
path of institutional changes as compared with findings from the case of Indonesian SOEs. The path
dependence emphasises three major areas of analysis; the early period of sequence, the early event
and the causal events (Mahoney, 2000). Meanwhile, the prior study of institutional changes
emphasises the importance of change as the consequences of the interaction between organisation
and institution. Meanwhile, the study of ownership structure by Estrin and Perotin (1991) reveals
that the influence of market and socio-political environment at a time when the objectives are set
also has significant effects on a company’s objectives (Estrin and Perotin, 1991). These indicators are
the main elements to analyse the government-stated objectives for SOEs.
The early period of sequence and the early event are of the important parts of the historical path
analysis. Sewell as cited by Mahoney notes the importance of early period and early events of the
sequence will impact the possible outcomes at the end of sequence (Mahoney, 2005: p. 510). The
importance of early period and early event is the unforeseen event which could not be analysed
based on the prior event. The case of Indonesian SOE evolution shows that some of this conceptual
framework of path dependence cannot be applied. This is a reason to develop historical path
analysis which a combining of path dependence and historical analysis. Although the early period
and event of the Indonesian SOE sequence is still considered as the most important part of the
evolution, the factors that create the first or early event are analysable. As mentioned in Section 6.1,
the early period of the Indonesian nation is still occupied by conflicts between the Indonesian and
Dutch governments. The Indonesianisation developed as a consequence of the resentment against
Dutch colonialism, this lead to flourishes of the nationalisation for pribumi. The introduction of
Ekonomi Terpimpin in 1958, for example, affirmed the failure of market orientation policy at the
84
beginning of the Indonesian nation which leads to the centralisation of socio-economic policy. The
Indonesianisation and centralisation of socio-economic control are considered as the crucial early
events of the Indonesian SOEs sequence. This is because the events set the objectives framework for
the future of the Indonesian nation emphasises that the better community socio-economic situation
can be achieved under the government’s hands (Constitution 1945). These events also determined
the framework for future Indonesian SOEs structure and objectives. These early events show the
influence of the state welfare orientations in determining the Indonesian government objectives as
well as the beginning of the centralisation of control for the government.
The historical path analysis shows that socio-economic environment and the early period of
Indonesian evolution have set the structure and objective for Indonesian enterprises. The
institutional changes analysis shows that once the solution for resolving a situation is determined,
this event is locked-in and integrated into the evolution (North, 1990). The centralisation of socio-
economic policy under the government’s hand has been locked-in and developed as a pattern
solutions or traditions for the Indonesian government to reach socio-economic stabilisation. The role
of SOEs becomes crucial to implement these government roles and policies. The ownership structure
of the Perusahaan Negara, which was represented by the state, shows the influence of political
expectations and policies in determining company constitution objectives (Estrin & Pérotin, 1991).
Later, the evolution of Indonesian SOEs revealed a political process in determining the objectives,
which was also influenced by the failure of market orientation policy in several political periods,
particularly during the initial period of statehood, ensuring the centralisation of economic policy was
crucial to obtain national socio-political stability (Anderson, 1983). These make the social welfare
objectives more dominant for the Indonesian SOEs.
The process of evolution is not always cohesive. The causal or contingent event may have occurred
during the evolution process. Ebbinghaus (2005) notes that path dependence is a result from non-
linear self-enforcement, as the process of evolution may differ or deviate from the original
expectation as a result of spontaneous events (Ebbinghaus, 2005). Two metaphors of path
dependence from Ebbinghaus (2005), the trodden trail and road juncture respectively distinguish the
persistent diffusion path and branching pathways. This situation is more likely to apply to the
evolution of Indonesian SOEs. Privatisation is considered to be the causal or contingent event which
later disrupts the SOEs objectives and structure from the original framework. As shown in Diagram
6.1, the original objectives for SOEs are in relation to socio-economic expectation as stated on
Articles 33 and 34, the 1945 Constitution of Indonesia only, later were the profit and efficiency
objectives added. Through the introduction of privatisation, the government underlines the profit
and efficiency objectives as part of corporatisation and privatisation process. For some SOEs, the
85
government profit objective is different from their original government-stated objectives, even
though later profit and efficiency apply to all SOEs. From this situation shows that privatisation has
disrupted the SOEs original objectives from social welfare to economic or financial objectives.
Several causal or spontaneous events also appear during the evolution of Indonesian SOEs that
shapes the current Indonesian SOEs structure and objectives. Market economy policy which was
applied in the 1980s made Perusahaan Negara the economic pioneers to improve market activities.
The changes to Perusahaan Negara’s role were made by the government to continue its policies in
attaining national economic stability. This role of the Perusahaan Negara had certain consequences.
Social welfare was no longer the Perusahaan Negara’s main objective and role. Perusahaan Negara
was required to compete equally with other economic entities, private and foreign. This requirement
has changed the role of the Perusahaan Negara from the government social welfare vehicles to
become the economic vehicles functions.
The roles of profit and efficiency objectives are driving factors for the changes of Perusahaan Negara
objectives and structure. In this Indonesian SOEs case, the introduction of profit objective in 1966
lead to the change of Perusahaan Negara structure into three different structures; Persero, Perum
and Perjan. At the beginning of these changes, the changes do not run as smoothly as expected since
the constitution still requires the government to control the resources. Therefore, the changes of
objectives are likely to underline the importance of profitability and efficiency for the Perusahaan
Negara, without disadvantaging the Perusahaan Negara main duty of the provision of public utilities.
In 1998, the implementation of privatisation policy causes fundamental changes in the objectives of
government for SOEs. These changes are seen as a coercive action as a respond to the external
pressure in relations to economic assistance and privatisation. This pressure also causes the
emergence of profit and efficiency as part of the objectives. Through UU BUMN no 19/2003 and PP
Privatisation no 33/2005, the government emphasises that profit and efficiency should apply to all
SOEs. The changes of objectives and structure may also be proposed as an alternative selection that
constructs further institutional changes of Indonesian SOEs. These financial objectives cause the
elimination of the Perjan structure, since this could not conform to the new expectation. In current
practice, the social welfare expectation remains part of the government-stated objectives for SOEs.
It is found through the possibilities for SOEs, both Perum and Persero, to carry the social welfare
duty, even though these objectives may not be part of their objectives.
From this discussion, it is shown that the path of institutional changes for Indonesian SOEs is
determined by two important events. The early period and events of the evolution of Indonesian
SOEs are the first crucial occurrences that set the framework for the SOEs objectives and roles.
These events also show the influence of the state welfare orientations and the beginning of the
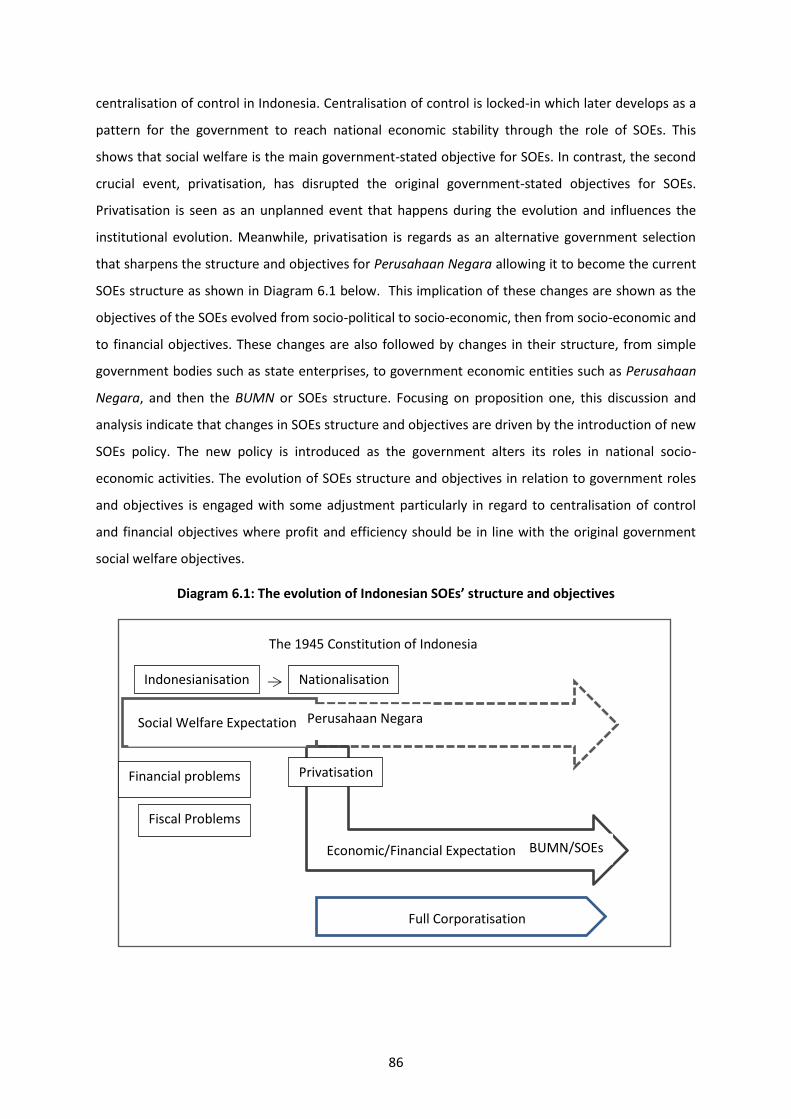
86
centralisation of control in Indonesia. Centralisation of control is locked-in which later develops as a
pattern for the government to reach national economic stability through the role of SOEs. This
shows that social welfare is the main government-stated objective for SOEs. In contrast, the second
crucial event, privatisation, has disrupted the original government-stated objectives for SOEs.
Privatisation is seen as an unplanned event that happens during the evolution and influences the
institutional evolution. Meanwhile, privatisation is regards as an alternative government selection
that sharpens the structure and objectives for Perusahaan Negara allowing it to become the current
SOEs structure as shown in Diagram 6.1 below. This implication of these changes are shown as the
objectives of the SOEs evolved from socio-political to socio-economic, then from socio-economic and
to financial objectives. These changes are also followed by changes in their structure, from simple
government bodies such as state enterprises, to government economic entities such as Perusahaan
Negara, and then the BUMN or SOEs structure. Focusing on proposition one, this discussion and
analysis indicate that changes in SOEs structure and objectives are driven by the introduction of new
SOEs policy. The new policy is introduced as the government alters its roles in national socio-
economic activities. The evolution of SOEs structure and objectives in relation to government roles
and objectives is engaged with some adjustment particularly in regard to centralisation of control
and financial objectives where profit and efficiency should be in line with the original government
social welfare objectives.
Diagram 6.1: The evolution of Indonesian SOEs’ structure and objectives
Social Welfare Expectation
Economic/Financial Expectation
Indonesianisation Nationalisation
Privatisation
Perusahaan Negara
BUMN/SOEs
Financial problems
Full Corporatisation
The 1945 Constitution of Indonesia
Fiscal Problems

87
Chapter 7:
Privatisation and Government-Stated Objectives
For State-Owned Enterprises
This chapter analyses the implementation of privatisation policy in Indonesia, and to what extent
this policy affects government-stated objectives for SOEs. This chapter is important for further
analysis because privatisation is still the government’s conventional economic policy to resolve
national fiscal problems. From the analysis presented in Chapter 6, the implementation of
privatisation in Indonesia resulted in several fundamental changes to SOEs structure, objectives and
policies. From the path analysis of Indonesian SOEs evolution in Section 6.4, privatisation considers
as the alternative event which later formats the further Indonesian SOEs structure and objectives.
The emergence of economic or financial objectives is indicated as a consequence of privatisation.
Privatisation, which is commonly used as a pathway to reduce government control, is also used to
establish key economic objectives, such as networking, transfer of technology, production efficiency,
raising revenue and reducing subsidies (Jupe 2003; Meggison & Netter, 2001; Ramamurti, 1999;
Zahariadis, 1999). Several studies regarding privatisation show that party power and leadership may
influence the extent to which a government retains control and regulates companies (Ramamurti,
1999; Zahariadis, 1999). This is claimed to be an influence factor for the SOEs’ inefficiency (Shleifer
and Vishny, 1984). Therefore, privatisation is commonly aimed to reduce the government
involvement in order for SOEs to become more efficient. In some cases, privatisation is also
purposed to bring a new equity capital that is needed by the government or the SOEs operation
(Abeng, 2001). This may give chance for new owners to gain incentive from careful and successful
management (McLeod, 2002). This shows that economic objectives become an important reason for
privatisation.
The seesawing of economic policies between centralisation and market orientation, as shown in
Chapter 6, raised the issue of control of resources. Control becomes a central issue following
privatisation (Estrin et al. 2009; Yarrow, 1999; Yarrow et al. 1986; Zif, 1981). In practice; privatisation
in Indonesia does not seem to hinder the emergence of conflict. The conflict is most frequently
apparent when the government control of resources is the chosen solution for market failure (Aoki,
1996) and meets with external pressure to reduce government involvement in business activities
(Aivazian et al., 2005). Based on other international studies on privatisation policy, the SOEs’
objectives changed after privatisation, due to the influence of new private owner (Bös, 1987; Estrin
88
et al. 2009; Estrin & Pérotin, 1991) is also considered as a reason for the emergence of conflict. The
focus in this chapter is to analyse the evolution of privatisation policy and how changes in the socio-
economic environment affect policies and the government-stated objectives for SOEs. The chapter is
developed based on the two different ways of privatisation in Indonesia: Section 7.1 outlines the re-
privatisation in 1965; Section 7.2 discusses the partial privatisation period during the economic
deregulation period from 1971 to 2005. Finally, Section 7.3 details the results and findings from the
previous sections.
7.1 Re- Privatisation: 1965
Re-privatisation was the first privatisation occurred during the evolution of Indonesian SOEs13. It
began as part of the Economic Stabilisation Policy in 1966. Re-privatisation occurred following the
nationalisation of the Dutch and other foreign companies and the transfer of political power from
the Old Regime to the New Regime. Market orientation policy became a driving factor for the
emergence of re-privatisation. Although market economy policy has been applied since the initial
period of Indonesia’s statehood in 1945, the implementation of market orientation policy in 1966
was a reason for the Indonesian government to undertake re-privatisation. As mentioned in the
previous chapter, a massive strike against Dutch colonialism and the failure of The Hague meeting in
regard to Irian Barat led to hostile action towards Western investors. Numerous Western foreign aid
groups and investors, which were crucial for Indonesia’s economic development, were withdrawn
following this hostility (James, 1996; Oei, 1968). The consequence of this hostility was that the
Indonesian economy was very weak. The external pressure for the Indonesian government to pay
nationalisation compensation was made worse by the economic situation (James, 1996).
A weak national economic situation was the motivation for the government to apply several new
policies. Opening markets to foreign and private investors was the government’s main policy to
improve national economic and market activities (Oei, 1968; 1969). Re-privatisation was pursued to
reduce the state’s financial burden as a consequence of the compensation payment due to
nationalisation. Re-privatisation was also used to attract foreign investors to Indonesia (Oei, 1968;
1969). Re-privatisation occurred through full transfer ownership of Western companies to their
former owners, such as Goodyear (USA), Unilever (USA), Bata (Canada), and Philips (Oei, 1969;
Pangestu, 1990). Following this transfer of ownership, the Indonesian government sought to re-
privatise several plantation companies owned by the British and Malaysians. However, the process
of transfer for plantation companies did not go well, as the owners preferred to take compensation
(Oei, 1968). Therefore, to this day they are still under government control.
13
Re-privatisation was the returning of nationalised Dutch and foreign companies to their prior owners.
89
This re-privatisation did not make any significant changes in the government-stated objectives for
SOEs. The transfer of ownership mainly occurred through returning their full ownership to the
previous owners. The aim of re-privatisation was mainly to resolve the national economic situation
following the transfer ownership and external pressure for the nationalisation compensation
payment. Therefore, there are no significant effects on the government-stated objectives for SOEs.
7.2 Partial Privatisation: 1971–2005
Partial privatisation has become the Indonesian government conservative economic policy since
1971. The selection to undertake the privatisation is often reasoned by the implementation of
market orientation policy. This section analyses the environment background for the emergence of
privatisation in Indonesia and its consequence on the current SOEs structure and the government-
stated objectives for SOEs. Although the main focus of analysis is the privatisation after 1991, some
parts of analysis also include the privatisation of PT Intirub in 1971. The reason is to provide a link or
coherency of analysis.
7.2.1 Privatisation of PT Intirub: 1971
The implementation of market orientation policy encouraged the emergence of privatisation in
Indonesia during the beginning of industrialisation period in 1970s. The involvement of private
participants in Indonesia economic activities was reasoned by the opening a number of industries
which were only SOEs. Although there was no implication on the privatisation policy and the
government-stated objectives for SOEs, transfer ownership of PT Intirub was acknowledge as the
first domestic partial privatisation in Indonesia. Transfer of ownership of PT Intirub occurred through
the direct sale to private owners, PT Bimantara Citra14. The transfer of ownership was continued
when PT Astra, a vehicle company, joint its ownership for PT Intirub through the purchase of 32.5
per cent of 70 per cent of PT Bimantara Citra’s ownership of PT Intirub (Pangestu, 1990). While the
ownership transfer of PT Intirub helped the company avoid financial difficulty (Pangestu, 1990), the
process of the transfer raised a number of critiques due to transparency issues (Schwarz, 1990)15.
7.2.2 Deregulation Economy: 1980-1988
Deregulation economic policy in Indonesia in 1980s was part of the Indonesian economic history for
resolving the financial and fiscal problems. As mentioned in Chapter 6, fiscal problems emerged as
14
PT Bimantara Citra is owned by President Suharto’s son, Bambang Trihatmodjo. 15
The transfer of ownership of PT Intirub was alleged to have been affected by corruption and transparency issues, as the state suffered a loss of Rp 6 billion (SCHWARZ, A. 1990. Retread for Tyre Maker. Far Easter Economic Review). Since 2006, the company has not operated due to financial difficulties. The government had planned to sell the whole of PT Intirub in 2003; however, the privatisation of PT Intirub was not finalised until 2011.

90
the government took control of national economic activities following the increasing oil prices in
1972-1983. This control of economic activities generated the government to take control of
economic activities through the roles of SOEs. This was followed by government intervention and
protection policies relating to economic activities (PP Persero 1973; McCawley, 2011; Pangestu and
Habir 1989). A massive infrastructure investment through SOEs mostly funded petrodollar. The
government also established new SOEs as PERTAMINA’s subsidiaries which had some financial
implications to the company (Robinson and Rosser, 1998). At the same time, the government
deregulated the banking system by imposing a ceiling on bank assets, leading to a large number of
private banks (Fane, 1999; McLeod, 2002b; Pangestu, 1990). These new private banks mostly were
established by relying on the state bank expenses which later worsened the Indonesian economic
situation (Fane, 1999; McLeod, 2002b). The government ability to provide funding from oil
strengthened the centralisation of control policy under the government hands. This also generated
the increasing of government involvement in national economic activities, particularly when the
government started to reduce the private participants by limited for SOEs only (Robinson and
Rosser, 1998). The centralisation of economic policy began to deal with a problem particularly when
the oil price went down; and these massive investments became a burden on the state budget.
The need to improve national economic activities again became a reason for the government to
undertake privatisations in 1991. Privatisation became part of the government’s deregulation policy
in 1988, and was aimed at resolving the economic situation and improving the SOEs’ performance
(Pangestu & Habir, 1989). The private outstanding credits with state banks, and the SOEs over-
investment in infrastructure, were two crucial fiscal problems during this period. The government
encountered pressure to resolve the country’s financial problems as it re-implemented market
orientations policy. Meanwhile, the poor performance of Perusahaan Negara became a state
burden, particularly when the government found it difficult to support the Perusahaan Negara’s
business activities. Prior to privatisation, the government evaluated the SOEs. This evaluation
showed that only 60 out of 180 Perusahaan Negara performed well, which later became a driving
factor for privatisation (Pangestu, 1990; Pangestu & Habir, 1989). Privatisation was also followed by
the requirement to improve SOE performance and budget efficiency; motivation for the Indonesian
government to conduct ownership divestiture as stated through PP Pembinaan Perusahaan Negara
no. 3/1983 (PP Empowerment of Perusahaan Negara no 3/1983) and Keputusan Menteri Keuangan
(KMK/Ministry of Finance’s decision) Republik Indonesia no. 740/KMK.00/1989: Peningkatan Efisiensi
dan Produktivitas Badan Usaha Milik Negara (KMK no. 740/KMK.00/1989: State-Owned Enterprises
Productivity and Efficiency Improvement).
91
7.2.3 The First Initial Public Offering: 1991
Prior the first Initial Public Offering (IPO) of the Indonesian SOEs, the Indonesian government
undertook the privatisation of custom operation. The government privatised custom operations to a
Swiss private surveillance company, Société Générale de Surveillance (SGS). This was aimed at
reducing the heavy cost of surveillance activities through private/foreign investor involvement
(Pangestu, 1990). The privatisation of custom operation had no policy or objectives implication on
the government-stated objectives for SOEs. In 1991, the government established PT Surveyor
Indonesia as a joint venture between the Indonesian government, PT Sucofindo (surveillance SOE)
and SGS (Surveyor, 2005; 2006) to operate surveillance activities in Indonesia.
PT Semen Gresik (cement SOE) was the first listed SOE in the stock exchange market, followed by PT
Indosat (a nationalised USA satellite and international telecommunications SOE). The IPO of PT
Semen Gresik occurred in 1991 when 35 per cent of stocks were offered to the market. From these
35 per cent of its share offered to the market, of which 27 per cent were new shares issued for
internal capitalisation purposes. The privatisation of PT Semen Gresik was motivated by a number of
socio-economic reasons. Privatisation of PT Semen Gresik was pursued to open opportunity for SOEs
and private entities to be involved in capital market activities. The privatisation of PT Semen Gresik
was focused on the development of domestic capital markets and the requirement for the company
to obtain fresh funds for its expansion. The privatisation of PT Semen Gresik was planned to be
followed by two other SOEs, PT Telekomunikasi Indonesian (PT Telkom/telecommunication SOE) and
PT Semen Tonasa (cement SOE). However, only PT Semen Gresik was successfully privatised, due to
procedural and political risks from state welfare orientations and the public. The privatisation of PT
Semen Gresik met the government’s objective to develop the domestic capital market, while the
privatisation itself failed to meet the market price expectation (Tony, 1992).
Privatisation of PT Semen Gresik was followed by the privatisation of PT Indosat. Similar to PT Semen
Gresik, the privatisation of PT Indosat aimed to open opportunity for SOE and private entity
involvement in capital market activities, particularly international capital market activities. In
practice, other reasons also motivated this privatisation. The privatisation of PT Indosat was a result
of the company’s financial difficulties when the government issued Undang-Undang no. 3/1989
tentang Telekomunikasi (Telecommunication Act no. 3/1989/UU Telekomunikasi 1989). The law
allowed private industry to provide telecommunication services (UU Telekomunikasi 1989). This law
encouraged the establishment of PT Satelindo in 1993; a consortium of PT Telkom, PT Bimantara
Citra and PT Indosat (Borsuk, 1993). The formation of this consortium resulted in PT Indosat facing
financial difficulties. The government’s fiscal problems were also a motivation for the privatisation of
PT Indosat. The government encountered external pressure to repay the private sector external debt
92
bond (Daily, 1995; James, 1996). Following the issuance of the UU Telekomunikasi no. 3/1989, the
telecommunication SOEs at the time, PT Indosat and PT Telkom, had to compete with private
entities in the telecommunication industry.16 Following PT Indosat’s privatisation, the government
privatised 35 per cent of PT Telkom and PT Timah in 1994 and 1995 respectively. These
privatisations aimed to earn fresh investment funds for further improvement of the companies’
services (Pangestu, 1990).
7.2.4 Fast Track Privatisation: 1998-2004
Fast track privatisation was the last period of privatisation evolution for Indonesian SOEs. The
privatisation during this period showed fundamental changes in SOEs’ structure and objectives. This
privatisation was driven by instability in the Indonesian national economic situation as a result of the
Asian financial crisis in 1997. Privatisation became the reformation regime’s main economic agenda
following the IMF engagement. The agreement emphasised the requirement for the Indonesian
government to conduct several economic actions in consideration of the assistance required for
economic recovery. The common objectives of the IMF and the World Bank, in regard to their
assistance, emphasised economic stabilisation and structural adjustment for economic reforms in
developing countries (Sinha, 1995). To facilitate this requirement, the government established the
Ministry of State-Owned Enterprises (MSOEs) and implemented fast-track privatisation. The
government also facilitated the process through the issuance of laws and restructuring SOEs. The
new laws, the UU BUMN no 19/2003 (SOEs Law no 19/2003/UU BUMN 2003) and the PP
Privatisation no 33/2005 (Privatisation Rule no 33/2005/PP Privatisation 2005), emphasised the
importance for SOEs to fully apply corporatisation principles, which were implemented in all SOEs.
This meant all SOEs were encouraged to attain profit and efficiency objectives in line with the
provision of public utilities as part of their objectives. At the same time, the government
restructured SOEs, by eliminating the Perjan structure, which was a barrier to fast-track
privatisation. In addition to the privatisation programme, the IMF’s LoI emphasised the requirement
for government to improve control and governance structure of the central and state banks. The
government was forced to conduct re-capitalisation for state banks, which were later followed by
their privatisation (IMF 1997a; 1997b).
7.2.5 Key Points from Partial Privatisation
It is important to underline some key points from this period of privatisation because some
significant changes occurred and had the consequences on the government-stated objectives for
16
PT Indosat was not categorised as an SOE when the government sold more 65 per cent of its ownership in 2002. Since 2002, the government’s ownership was only 15 per cent.
93
SOEs. This period of privatisation mainly focuses on the partial privatisation where the government
still hold 51 percent or more of the ownership. There are two key points from this period of
privatisation. First is the beginning of public or private to be part of the SOEs ownership structure.
Second is the change of government-stated objectives for SOEs, and then followed by the change of
SOEs structure.
7.3 Policy Implications
The challenges for the Indonesian government to undertake the privatisation has been found in two
periods of privatisation analysis. There were many reasons that hinder the successful of
privatisation. In the first period of privatisation or re-privatisation, a number of nationalised
plantation companies could not be returned to their previous British and Malaysian owners
(Kanumoyoso, 2001). This was because the owners preferred to take the compensation. The
Indonesian government remains their control over these plantation companies.
At the second period of privatisation or partial privatisation, policy constraint is identified as the
most frequent barrier factors for the successful of privatisation. For some SOEs, privatisation policy
was not easy to be implemented due to certain regulatory concerns. Constitutional obligations may
hinder the success of privatisation. The pressure to privatise numbers of SOEs was inconflict with the
economic policy control. As shown in Table 7.1, a number of privatisations have been delayed or
postponed due to regulation, protection and political risk from other parties. The failures of
government to privatise PT Telkom and PT Semen Tonasa in 1991 were an example. A similar
situation occurred when the government conducted fast-track privatisation under the IMF’s LoI
agreement from 1998 to 2004. Table 7.1 presents the gaps between the numbers of SOEs launched
for privatisation and the numbers that were successfully privatised from 1991 to 2010. From Table
7.1, it is evident that the government was only able to privatise less than 20 per cent of the
privatisation target. During this period, there were several years when no privatisation took place.
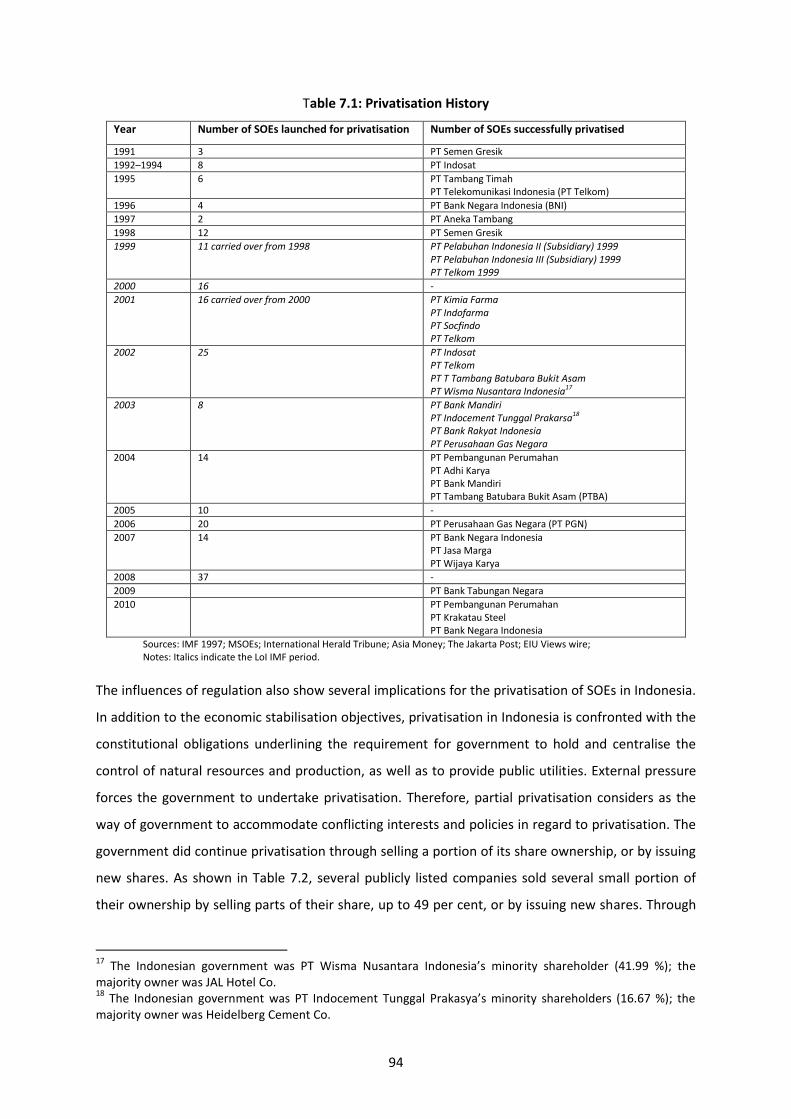
94
Table 7.1: Privatisation History
Year Number of SOEs launched for privatisation Number of SOEs successfully privatised
1991 3 PT Semen Gresik
1992–1994 8 PT Indosat
1995 6 PT Tambang Timah PT Telekomunikasi Indonesia (PT Telkom)
1996 4 PT Bank Negara Indonesia (BNI)
1997 2 PT Aneka Tambang
1998 12 PT Semen Gresik
1999 11 carried over from 1998 PT Pelabuhan Indonesia II (Subsidiary) 1999 PT Pelabuhan Indonesia III (Subsidiary) 1999 PT Telkom 1999
2000 16 -
2001 16 carried over from 2000 PT Kimia Farma PT Indofarma PT Socfindo PT Telkom
2002 25 PT Indosat PT Telkom PT T Tambang Batubara Bukit Asam PT Wisma Nusantara Indonesia17
2003 8 PT Bank Mandiri PT Indocement Tunggal Prakarsa18 PT Bank Rakyat Indonesia PT Perusahaan Gas Negara
2004 14 PT Pembangunan Perumahan PT Adhi Karya PT Bank Mandiri PT Tambang Batubara Bukit Asam (PTBA)
2005 10 -
2006 20 PT Perusahaan Gas Negara (PT PGN)
2007 14 PT Bank Negara Indonesia PT Jasa Marga PT Wijaya Karya
2008 37 -
2009 PT Bank Tabungan Negara
2010 PT Pembangunan Perumahan PT Krakatau Steel PT Bank Negara Indonesia
Sources: IMF 1997; MSOEs; International Herald Tribune; Asia Money; The Jakarta Post; EIU Views wire; Notes: Italics indicate the LoI IMF period.
The influences of regulation also show several implications for the privatisation of SOEs in Indonesia.
In addition to the economic stabilisation objectives, privatisation in Indonesia is confronted with the
constitutional obligations underlining the requirement for government to hold and centralise the
control of natural resources and production, as well as to provide public utilities. External pressure
forces the government to undertake privatisation. Therefore, partial privatisation considers as the
way of government to accommodate conflicting interests and policies in regard to privatisation. The
government did continue privatisation through selling a portion of its share ownership, or by issuing
new shares. As shown in Table 7.2, several publicly listed companies sold several small portion of
their ownership by selling parts of their share, up to 49 per cent, or by issuing new shares. Through
17
The Indonesian government was PT Wisma Nusantara Indonesia’s minority shareholder (41.99 %); the majority owner was JAL Hotel Co. 18
The Indonesian government was PT Indocement Tunggal Prakasya’s minority shareholders (16.67 %); the majority owner was Heidelberg Cement Co.

95
this continual selling of small portions of ownership, the government and SOEs are still able to
accommodate conflicts of interest and external pressure, as well as to obtain financial support for
the state budget. During this period of study, the government also sold its minority’s ownership of
PT Indocement Tunggal Prakasya, PT Wisma Nusantara Indonesia and PT Socfindo.
Table 7.2: Indonesian Privatisation Results
Year SOE Per cent
sold Method Proceeds
Per cent Indonesian govt.
ownership
1991 PT Semen Gresik Tbk (Cement) 27*
8 IPO
Rp. 280 billion Rp. 126 billion
65
1994 PT Indosat Tbk (Telecommunications for international providers)
10* 25
IPO Rp. 2,537 billion
65
1995 PT Tambang Timah Tbk (Nickel mining) 25
10* IPO Rp. 511 billion 65
PT Telekomunikasi Indonesia (Telkom) (telecommunications)
10* 13
IPO Rp. 5,058 billion 65
1996 PT Bank Negara Indonesia Tbk (Banking) 25 * IPO Rp. 920 billion 99**
1997 PT Aneka Tambang Tbk (Mining) 35* IPO Rp. 603 billion 65
1998 PT Semen Gresik Tbk 14 SS Rp. 1,317 billion 51
1999 PT Pelindo II (Sea port in Jakarta) 49*** SS US$ 190 Million
PT Pelindo III (Seaport in Surabaya) 51*** SS US$ 157 Million
PT Telkom Tbk 9.62 Placement Rp. 3,188 billion
2001 PT Kimia Farma Tbk (Pharmaceutical) 9.2 IPO Rp. 110 billion 90.8
PT Indofarma Tbk (Pharmaceutical) 19.8 IPO Rp. 150 billion 80.2
PT Socfindo (Palm oil plantation) 30 SS US$ 45.4 Million 10
PT Telkom Tbk 11.9 Placement Rp. 3.100 billion 54
2002 PT Indosat Tbk 8.06
41.94 Placement
SS Rp. 967 billion
US$ 608,4 billion 15
PT Telkom Tbk 3.1 Placement Rp. 1,100 billion 51
PT Tambang Batubara Bukit Asam Tbk (Coal mining) 15
1.26* IPO Rp. 156 billion 84
PT Wisma Nusantara Indonesia (Office & hotel building) 41.99 SS Rp. 255 billion 0
2003 PT Bank Mandiri Tbk (Banking) 20 IPO Rp. 2,547 billion 80
PT Indocement Tunggal Prakasya Tbk (Cement) 16.67 SS Rp. 1,157 billion 0
PT Bank Rakyat Indonesia Tbk (BRI) (Banking) 30
15* IPO Rp. 2,512 billion 59.5
PT Perusahaan Gas Negara Tbk (Natural gas) 20
19* IPO Rp. 1,235 billion 61
2004 PT Pembangunan Perumahan (Housing) 49 EMBO Rp. 60.49 billion 51
PT Adhi Karya Tbk (Construction) 24.5
24.5* EMBO
IPO Rp. 65 billion 51
PT Bank Mandiri Tbk 10 Placement Rp. 2.844 billion 69.5
PT Tambang Batubara Bukit Asam Tbk 12.5 SO Rp. 180 billion 65
2005 No Privatisation
2006 PT PGN Tbk 5.31 Placement Rp. 2,088 billion 55.33
2007 PT BNI Tbk 11.3 15*
SPO Rp. 3,086 billion Rp. 3,854 billion
76.36
PT Jasa Marga Tbk 30* IPO Rp. 3,362 billion 80
PT Wijaya Karya Tbk 31.7 IPO Rp. 759.58 billion 68.3
2008 No Privatisation
2009 PT Bank Tabungan Negara Tbk 27.08* IPO Rp.. 1,819 Billon 72.92
2010 PT Pembangunan Perumahan Tbk 21.46* IPO Rp. 566 Billion 51
PT Krakatau Steel Tbk 20* IPO Rp. 1,994 Billion 80
PT Bank Negara Indonesia Tbk 3.1 SPO Rp. 2,097 Billion 60
Notes: *new shares issued; **including bank re-capitalisation; ***sub-company privatisation Source: (Nugroho &Wrihatnolo 2008; MSOEs)
The conflict between economic expectation and policy constraint in regard to privatisation were a
motivation for the government to introduce the UU BUMN no 19/2003 and PP Privatisation no
96
33/2005. The laws aimed to facilitate the privatisation process and to accommodate some prior
potential conflicts between policies that hindered the success of privatisation. As mentioned in the
previous analysis of the Indonesian SOEs evolution in Chapter 6, Article 34 the 1945 Constitution of
Indonesia emphasised the government social welfare expectation through the role of SOEs. This
makes the control policy is not the only barrier for the successful of privatisation, but also the
requirement to meet the social welfare expectation. Both new laws still emphasised the importance
of the SOEs social welfare duty. Both laws underline the possibility for SOEs to conduct particular
duty as a requirement from the government (UU BUMN 2003; PP Privatisation 2005). The laws also
tried to accommodate SOEs’ social functions, which were not covered by corporate law. Both UU
BUMN no 19/2003 and PP Privatisation no 33/2005 highlighted the existence of social welfare
objectives, which must not constitute a burden or barrier for SOEs to achieve good performance. For
this requirement, the law facilitated a mechanism for SOEs to invest in social functions, or PSOs, by
separating the SOEs’ PSO function from their core business (UU BUMN 2003; PP Privatisation 2005).
This situation still causes several SOEs were experiences with the government requirement which
might be different from their original objectives.
The social welfare expectation may not be in line with the new expectation from the UU BUMN and
PP Privatisation. Through both laws, the government underlined that it was crucial for SOEs to
implement full corporatisation without causing conflict with other objectives. The laws also
emphasised, as a requirement for privatisation, the importance for SOEs to prove good performance
in achieving both social and economic objectives for at least five years prior to privatisation taking
place. While emphasis on economic objectives encouraged the SOEs to focus more on maximising
profit, at the same time it limited government financial support (only available to selected SOEs)19,
resulting in the commercialisation of public utility provision. Later, the implication of social welfare
obligation and economic constraint cause difference treatment whether the SOE allow to be
privatised or not. The Privatisation Rule re-emphasised the social function of SOEs. Through this law,
the issue of privatisation restrictions were accommodated by categorising the SOEs based on their
function and criteria (PP Privatisation 2005). Where SOEs had PSO duties, privatisation occurred
after the SOEs separated their PSO assets and activities. These made some SOEs are restricted to be
privatised because of this socio-political reason.
19
Only ten SOEs received subsidies from the government to provide PSOs services.
97
7.4 Identifying Privatisation Policy and Government-Stated Objectives: discussion
This section analyses the implication of privatisation policy for the government-stated objectives
based on two approaches, the path dependence and privatisation. This section also investigates
proposition two regarding whether changes in the SOEs market economy environment through the
introduction of privatisation policy and liberalisation of market economy generates changes in the
government and SOEs’ objectives. The change of SOEs market economy environment is expected to
encourage the government to review its policies and objectives for SOEs. Therefore, the government
and SOEs objectives are changed
The analysis on this chapter is referred to historical path analysis of the Indonesian privatisation
which is employed to guidance the analysis of privatisation based on historical and path perspective.
Privatisation is considered as a deviant or causal event that also sharpens the current SOEs structure
and objectives. Meanwhile, privatisation theory is selected to guide the analysis as to what extent
the privatisation impacts on the government-stated objectives and SOEs structure.
Privatisation during the Indonesian SOEs evolution can be analysed as an important alternative
event of the sequence. A part from the diffusion of Indonesian SOE evolution, privatisation occurs as
an unusual event or contingent event during the timeline. In practice, this event plays an important
role. Privatisation during the Indonesian evolution is viewed as road junction event from Ebbinghaus
(2005) where it becomes a spontaneous choice that repeatedly used in subsequence events
(Ebbinghaus, 2005). From his study in path dependence, Ebbinghaus emphasises four crucial factors
that determine the path dependence; the equal starting condition, self-reinforcing process,
irreversibility and inefficient path (Ebbinghaus, 2005). Although these are not only factor on
determining the path dependence applied for this privatisation case, some crucial factors appear as
part of the privatisation path in Indonesia. From the description in Sections 7.1 and 7.2, it is shown
that privatisation has been adopted as common event by the Indonesian government to resolve the
fiscal or financial problems. The economic or financial problems both in 1966 and 1991-1998 are
driving factors for the government to conduct privatisation. Those two periods of privatisation in
Indonesia were motivated by two similar situations. It has been used several times despite not being
the preferred option at the beginning; it has been seen flourish as preferred pattern of particular
phenomenon. Privatisation becomes an irreversible event or pattern for the Indonesian government
to resolve the fiscal or financial problems.
The study of privatisation has shown many different results in regard to control, and ownership. A
theory of privatisation, was developed based on the privatisation case in Russia, shows that
privatisation can be a facility to reduce the politician and government involvement and control

98
pressure on SOEs where these factors are considered a main reason for inefficiency (Aharoni, 1984;
Boycko et al., 1996; Shleifer and Vishny, 1994; Yarrow, 1999). Another study of changes in
ownership of public enterprises like SOEs indicates that, to an increasing extent, privatisation
switches of firms’ goal from social welfare maximising to profit maximising (Bös, 1987). This shows
that the ownership structure as an impact of privatisation is commonly the main factor for analysing
the successful of privatisation. Boycko et al (1996) note two important items in regards to a
company’s control: managers and politicians who influence the success of restructuring of the
company (Boycko et al., 1996). Referring to this study, the distance between shareholders in the
politician affects the extent of restructuring. In other words, the closer shareholders to the
politician, the more difficult the company’s restructuring.
Referring to privatisation analysis above; some items from earlier privatisation studies are applied to
help the analysis of the privatisation in Indonesian. The case of Indonesian privatisation shows that
privatisation originally aims to reduce the government involvement in SOEs business activities by
extending the public or community participation within the SOEs ownership (UU BUMN 2003; PP
Privatisation 2005). Meanwhile, privatisation in Indonesia is pursued to improve the confidence of
international investors in the market, and to assist the recovery of the national economy (Tjager,
2000). These statements can be understood that the new shareholders should distance themselves
from politicians in order to bring a new culture to SOEs. In practice, full transfer of ownership or
privatisation during the period between 1991 and 2010 occurred mostly when the government held
a minority ownership or the former owners were foreign investors.20 Privatisation in Indonesian is
aimed to enhance the opportunity for community participation (UU BUMN 2003; PP Privatisation
2005), this causes the influence of new private owners also limited. Although it is common that
privatisation may not distinguish between government control and access to production (Bienen &
Waterbury, 1989), Indonesian privatisation has shown that privatisation does not make any
difference to the government’s control and access to production. From the previous analysis in
20
Transfer of ownership in 1966 occurred by returning nationalised companies to their previous owners, the majority of which were foreign investors as mentioned in Section 7.1. The transfer of ownership of PT Indocement Tunggal Prakarya (PT INTP), PT Socfindo, and PT Wisma Nusantara Indonesia were occurred as part of the IMF’s LoI. The LOI required Indonesian government to sell its minority ownership including PT Socfindo, PT INTP and PT Wisma Nusantara Indonesia. During this period, the Indonesian government sold its minority ownership of PT Socfindo, PT INTP and PT Wisma Nusantara Indonesia. PT INTP was sold to majority owners; Heidelberg Cement Co. PT Wisma Nusantara Indonesia was sold to the majority owner JAL Hotel Co. The Indonesian government only sold its 20 per cent of PT Socfindo’s ownership to Plantation Nord-Sumetra Belgia SA (PNS) who was PT Socfindo’s majority owners. Meanwhile, transfer ownership of PT Atmindo, PT JIHD, PT Kertas Padalarang, PT Kertas Blabak and PT Intirub were postponed due to legal issues (MSOES, 2008; Laporan Kinerja BUMN Tahun 2003-2007 (SOEs Performance Report 2003-2007).
99
Chapter 6 Section 6.4, the centralisation of control and influence of state welfare orientations are
deemed as a barrier for the implementation of full privatisation.
The motivation of privatisation can be vary. The study of privatisation by Aharoni in 1984 shows
several different motivations for government to privatise its SOEs; from ideology to pragmatic
consideration (Aharoni, 1984). Using this study, the motivation of Indonesian SOEs is likely to be
economic and political shift reason. Economic reason for privatisation can be identified as the
expectation for SOEs to be more efficient, while political reason is shown through the requirement
to support state budget or the government economic commitment (Aharoni, 1984). These reasons
are found within the Indonesian privatisation as seen through nationalisation and the IMF’s LoI
agreement. The privatisation in Indonesian is often used to provide a support for the state budget
and reduce corruption (Abeng, 2001). Privatisation of PT Semen Gresik, PT Indosat and fast-track
privatisation are examples of economic stabilisation’s influence on government privatisation
decisions. Meanwhile, political shift reason is found through the shift of political power in
Indonesian in 1966, which later becomes a starting point for (re)-privatisation in Indonesia. The
partial privatisation under New Order regime has shifted the centralisation economic which was set
by previous regime to the market orientation.
Focusing on proposition two, the change of SOEs market economy environment through
privatisation should alter the government and SOEs objectives. Privatisation policy in Indonesia does
not seem to make any different regarding the government policy. Limited changes in regard to
government control over the production and decision making process is also found through limited
changes in context of government objectives for SOEs. Social welfare expectation is still the
government main concern, even though the government encourages SOEs to meet profit and
efficiency objectives as shown through the implementation of UU BUMN no 19/2003 and PP
Privatisation no 33/2005. The importance of social welfare expectation is shown as the laws set
boundaries whether the SOEs allow or restriction to be privatised. At the same time, the laws
provide a “space” for SOEs to attain the social welfare expectation. This can be seen that the
privatisation in Indonesia is only a pattern or constant event taken by the Indonesian government in
order to resolve the financial or national economic problems. A part of path institutional changes,
the original government social welfare objectives still exist and affect government decisions
regarding the privatisation policy. Consequently, conflict of interests and constraints between state
welfare orientations and market pressure influence the government decisions. Partial privatisation is
the most popular choice for the Indonesian government to resolve conflict and financial problems.
The selection of partial privatisation is motivated by the possibility for the Indonesian government to
accommodate the state welfare orientation expectation and pressure from market.
100
In sum, the analysis above shows that privatisation in Indonesia are likely to become an alternative
event that has been repeated use as a subsequence during the timeline of evolution. The economic
and political power shift motivates the government to conduct privatisation in order to assure the
continuity of Indonesian SOEs journey. From these finding above, privatisation is seen as a pattern
whenever the government has to resolve the financial or national economic problems. Although
privatisation has been set for economic motivation, the non-economic reasons remained stronger.
The changes of SOEs market economy environment through privatisation and liberalisation
generates two consequences; the existence of social welfare expectations that in line with profit or
efficiency objectives; and the different treatment or classification of SOEs in relations to provision of
public utilities and privatisation policy.
101
Chapter 8:
The Objectives of State-Owned Enterprises in Practice:
Publicly Listed State-Owned Enterprise Cases
This chapter examines the extent to which publicly listed SOEs’ objectives were in harmony or
conflict following the intensive privatisation programme that ran from 2002 to 200421. This chapter
builds in Chapter 7, which showed that privatisation caused the development of financial objectives
such as profit and efficiency. Later, these objectives generated to the changes of SOEs structures.
Persero and Perum are the current existing structure as a result from the implementation of
privatisation policy. Privatisation also causes some changes in the SOEs business activities, for
example, removing monopoly rights for several new publicly listed SOEs following their privatisation.
In some cases, the changes may affect the company’s business activities and the possibility to meet
the government’s expectation. Meanwhile, the analysis of privatisation motives in Chapter 7 reveals
that privatisation is an alternative or causal event that occurs during the sequence of time which
later sharpens the SOEs objectives and structure. As the government set the SOEs for social welfare
purpose at the beginning of the evolution, the change makes the objectives are not purely economic
objectives in term of efficiency. The economic objectives in context of protecting national interest
are stronger as the motivation for the Indonesian SOEs privatisation. This situation has some
consequences, which one of them is on the obligation for publicly listed SOEs to the provision of
public utilities. Since the monopoly and protection from government is no longer available for the
publicly listed SOEs, the companies still have to deal with this issue social welfare obligation and to
compete fairly with other business entities.
Focusing on both content and interpretive analysis of government and SOE documents regarding
privatisation, this chapter analyses the issues identified in the preliminary analysis in Chapters 6 and
7 regarding government policies and objectives affecting publicly listed SOEs’ objectives and
business activities. There were 17 publicly listed SOEs during 2004–2010; however, this analysis
focuses on only 14 of them. PT Bank Tabungan Negara Tbk (state bank) and PT Krakatau Steel Tbk
(steel manufacturing SOE) are the exception for this analysis, since these companies were listed
relatively recently, in 2009 and 2010, and may not yet provide sufficient information to analyse the
changes.22 PT Pembangunan Perumahan Tbk (housing SOE) is also another exception in this chapter.
While the company was publicly listed in 2010, PT Pembangunan Perumahan Tbk underwent an
21
The term of publicly listed SOEs is used because the government remains the majority shareholder, although the company has been privatised. 22
Tbk, an abbreviation of Terbuka (open), is an indication that the company is publicly listed.
102
Employee Management Buy-Outs (EMBO) in 2004. The analysis of PT Pembangunan Perumahan
Tbk’s objectives shows no significant changes since the company was publicly listed. Therefore, PT
Pembangunan Perumahan Tbk is not included in this analysis. This chapter is important for the
further the performance and objectives analysis in Chapters 10 and 11, and is organised into four
sections: Section 8.1 examines publicly listed SOEs to provide a brief picture of current Indonesian
publicly listed SOEs; Section 8.2 analyses the government and SOEs objectives; Section 8.3 analyses
the policy implications of privatisation, focusing on the effects of the policy on the current publicly
listed SOEs; and Section 8.4 presents the findings from the previous sections in this chapter.
8.1 The Publicly Listed State-Owned Enterprises: A Brief Picture
From Chapters 6 and 7, privatisation in Indonesia shows different results from common privatisation
practices. As the market is a natural environment for economic activities that influence or shape
institutions (Landesmann & Pagano, 1994), the requirement to follow every change in the market
environment may cause changes to an organisation’s goals and practices. Privatisation, for example,
causes a change in control of ownership for SOEs, from state to market approaches (Newbery,
1996), or from government to private ownership (Bös, 1987). This also involves a change in
government and SOE orientation from social welfare or non-economic objectives to an economic or
financial orientation (Bös, 1987). An earlier study of privatisation shows that potential conflict
appears when the publicly listed SOEs have to meet both the government interest on the provision
of public utilities for community and the shareholders interest in regard to maximising their value
(Ogden and Watson, 1999). The further analyse in the following sections show the implications of
changes in the SOEs structure and objectives for publicly listed SOEs.
From the evolution of privatisation policy in Chapter 7, privatisation in Indonesia is likely to become
the national economic saviours whenever the government is confronted with fiscal problems or
external pressure. The analysis in the previous chapter, Chapter 7, shows despite the government’s
statement that privatisation is to extend community participation in SOE ownership (UU BUMN
2003, PP Privatisation 2005), reducing government involvement and control may not be the
government’s intention, since the government still holds majority ownership and control in most
privatised SOEs. The new ownership structures were represented by institutional investors who had
links with the government, as shown in Table 8.1. Table 8.1 shows that ownership was widespread
between individuals and institutions, where the majority of top local institutional shareholders were
still dominated by government institutions, such as pension funds, other SOEs, foundations or
cooperatives. These new compositions indicated that government gained cash flow from new
shareholders, but still had indirect control of SOEs through relationships and links with new
shareholders.
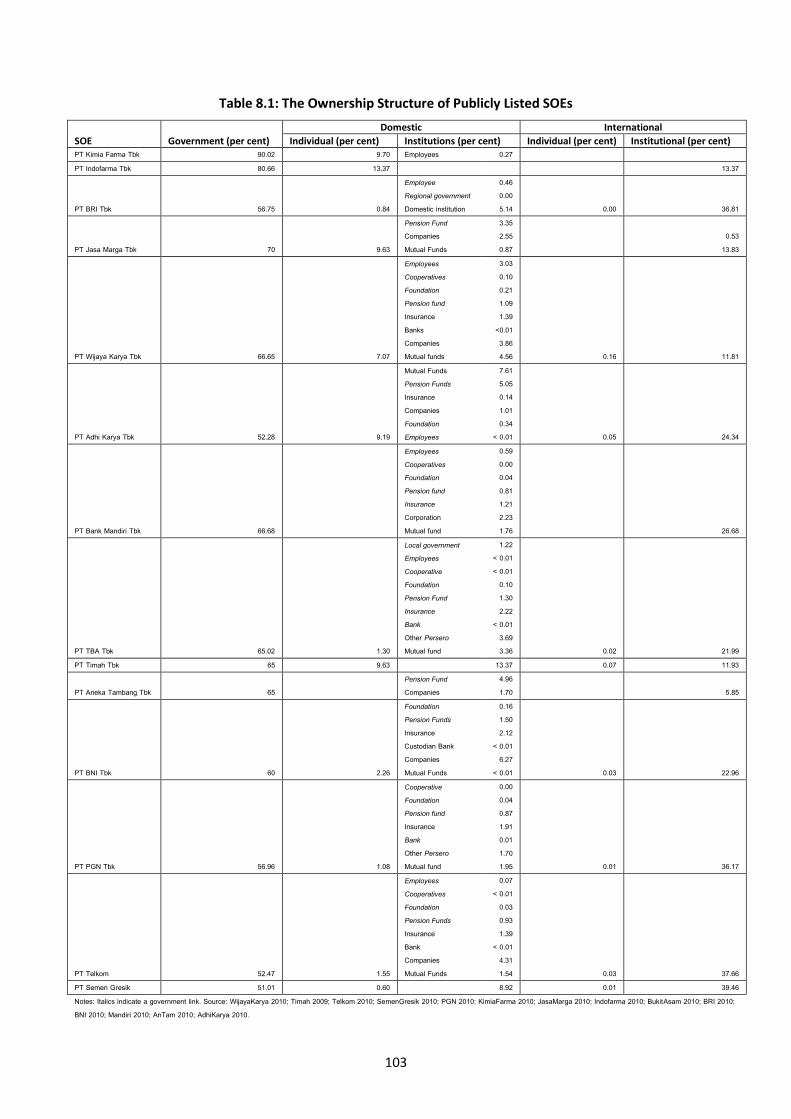
103
Table 8.1: The Ownership Structure of Publicly Listed SOEs
SOE Government (per cent)
Domestic International
Individual (per cent) Institutions (per cent) Individual (per cent) Institutional (per cent) PT Kimia Farma Tbk 90.02 9.70 Employees 0.27 PT Indofarma Tbk 80.66 13.37 13.37
PT BRI Tbk 56.75 0.84
Employee Regional government Domestic institution
0.46 0.00 5.14 0.00 36.81
PT Jasa Marga Tbk 70 9.63
Pension Fund Companies Mutual Funds
3.35 2.55 0.87
0.53 13.83
PT Wijaya Karya Tbk 66.65 7.07
Employees Cooperatives Foundation Pension fund Insurance Banks Companies Mutual funds
3.03 0.10 0.21 1.09 1.39
<0.01 3.86 4.56 0.16 11.81
PT Adhi Karya Tbk 52.28 9.19
Mutual Funds Pension Funds Insurance Companies Foundation Employees
7.61 5.05 0.14 1.01 0.34
< 0.01 0.05 24.34
PT Bank Mandiri Tbk 66.68
Employees Cooperatives Foundation Pension fund Insurance Corporation Mutual fund
0.59 0.00 0.04 0.81 1.21 2.23 1.76 26.68
PT TBA Tbk 65.02 1.30
Local government Employees Cooperative Foundation Pension Fund Insurance Bank Other Persero Mutual fund
1.22 < 0.01 < 0.01
0.10 1.30 2.22
< 0.01 3.69 3.36 0.02 21.99
PT Timah Tbk 65 9.63
13.37 0.07 11.93
PT Aneka Tambang Tbk 65 Pension Fund Companies
4.96 1.70 5.85
PT BNI Tbk 60 2.26
Foundation Pension Funds Insurance Custodian Bank Companies Mutual Funds
0.16 1.50 2.12
< 0.01 6.27
< 0.01 0.03 22.96
PT PGN Tbk 56.96 1.08
Cooperative Foundation Pension fund Insurance Bank Other Persero Mutual fund
0.00 0.04 0.87 1.91 0.01 1.70 1.95 0.01 36.17
PT Telkom 52.47 1.55
Employees Cooperatives Foundation Pension Funds Insurance Bank Companies Mutual Funds
0.07 < 0.01
0.03 0.93 1.39
< 0.01 4.31 1.54 0.03 37.66
PT Semen Gresik 51.01 0.60 8.92 0.01 39.46 Notes: Italics indicate a government link. Source: WijayaKarya 2010; Timah 2009; Telkom 2010; SemenGresik 2010; PGN 2010; KimiaFarma 2010; JasaMarga 2010; Indofarma 2010; BukitAsam 2010; BRI 2010; BNI 2010; Mandiri 2010; AnTam 2010; AdhiKarya 2010.
104
Privatisation can have a significant impact on market competition. Although the majority of
Indonesian publicly listed SOEs operate in an open and competitive market, some publicly listed
SOEs were experienced with removing their monopoly right and privileges as their market was
currently less regulated followed by the privatisation. Fourteen publicly listed SOEs operate in six
industries: banking, construction, pharmaceutical, mining, telecommunication and cement. Banking,
cement and construction and with the exception of PT Jasa Marga Tbk (road toll SOE), were run in
highly competitive industries where the government limited its involvement. Mining,
telecommunication, pharmaceutical and PT Jasa Marga Tbk were categorised as less competitive
industries, since the government remained in control and regulated these industries for strategic
purposes.23 For some publicly listed SOEs used to operate in highly regulated industries, for example
telecommunication, toll road, and mining industries; privatisation caused significant changes in their
industrial policy. In common practice, privatisation may reduce government control and
involvement, particularly for those SOEs whose products may operate under natural monopoly
(Baijal, 2002; Morgan & England, 1988). The market may force SOEs to operate in a more
competitive and thus potentially fairer system following the privatisation. Some indications show
that the government may withdraw from the production unit; while in practice, the government
provides the fees and charges for the SOEs to keep its control over certain good and services (Baijal,
2002). This situation applies with the Indonesian publicly listed SOEs. Several highly regulated
industries were opened up, following privatisation, to private participants. Examples of this were PT
Telekomunikasi Indonesia Tbk (PT Telkom/telecommunications SOE) and PT Jasa Marga Tbk, which
experienced the removal of their control right prior to privatisation. In practice, these industries still
find it difficult to attract private or foreign investors since the government still keeps its control of
the fees and tarrifs. This causes several SOEs to still operate with unfair or less competition, such as
PT Perusahaan Gas Negara Tbk (PT PGN/natural Gas SOE), PT Jasa Marga Tbk and PT Telkom Tbk.
This imbalanced competition is driven by the requirement for new entrants to have huge investment
funds, while the government still hold the residual control of fees and tariffs for their products.
These factors make it difficult for new entrants to compete with SOEs who receive support and
facilities from the government.
For some cases, privatisation may deal with constitution consideration. Some natural monopoly of
public services may be more efficient under the SOEs or public enterprises than private enterprises’
operation (Boardman and Vining, 1989). Non-economic side of public enterprises of SOEs became a
dilemma for government in relations to privatisation since privatisation might change the social
23
The mining industry is controlled due to the government requirement to support the state budget. Pharmaceutical, telecommunication and PT Jasa Marga Tbk companies are controlled in relation to the provision of public utilities related to their products or services.

105
effect on community (Morgan and England, 1988). This situation was found with Indonesian
privatisation particularly for SOEs with the provision of public utilities like pharmaceutical. While
pharmaceutical SOEs are a competitive industry, the importance of medicine for the community
means that the government provides certain privileges for these SOEs. Control and monopolies
remain noticeable, even after the privatisation of the SOEs, which was particularly intertwined with
the centralisation of economic policy as mentioned in the 1945 Constitution of Indonesia.
8.2 The Objectives
Privatisation brings particular changes to the way publicly listed SOEs operate their businesses.
Besides the change in company structure from non-privatised to publicly listed SOE, the presence of
new owners usually creates new perspectives for the company, affecting its culture, objectives and
profit maximising expectations (Boardman et al. 1986; Guthrie, 1990). For Indonesian SOEs,
privatisation is also expected to bring professionalism, reduce corruption and improve performance
(UU BUMN 2003; Abeng 2001, 2002; Tjager 2000). Changed objectives are the most common effects
following the inclusion of new owners, as they are likely to set new objectives that are mostly
dominated by economic or commercial goals. The role of objectives is important to determine the
end result of strategies and plans (Boyd & Levy, 1966; Granger, 1964; Keeney, 1988). Therefore, this
section focuses exclusively on how the privatisation policy caused the changes in the government-
stated objectives for SOEs and the SOEs objectives.
8.2.1 The Objectives Imposed by Government
As mentioned in Chapters 6 and 7, transfer of ownership from the government to private hands has
not fully taken place within Indonesian publicly listed SOEs. As shown in Table 8.1, the government
still holds majority control made the changes in the government-stated objectives were very limited.
Although the government has privatised fourteen SOEs since 1991, changes in government-stated
objectives only applied to PT Telkom Tbk, PT PGN Tbk and PT Bank Mandiri Tbk (state bank). The
changes of government-stated objectives for these publicly listed SOEs occurred as PT PGN Tbk and
PT Bank Mandiri Tbk were experienced with the change of their companies’ status, from non-
privatised to publicly listed SOEs. For PT Telkom Tbk, the change of the government-stated
objectives took place when the company was experienced with the change of the company’s scope
of business in relation to the company’s provision of public telecommunication facilities. The
government-stated objectives for the remaining publicly listed SOEs have not changed since their
establishment.
The changes of objectives for these four publicly listed SOEs were occurred prior to privatisation. The
change of government-stated objectives for PT Telkom was made when the government changed
106
the scope of business services (PP Perum Telkom 1980) and when the company structure was
changed to Persero status (PP Persero Telkom 1991, PP Perum Telkom 1974). The change of
government-stated objectives for PT PGN occurred as the company was separated from the national
electricity company (PLN) in 1965 (PP PLN and PGN 1965). The Indonesian government needed to
set new objectives for PT Bank Mandiri Tbk when the bank was established through the merger of
four state banks in 1998. For PT Bank Mandiri Tbk, the establishment during the market orientation
era meant that government-stated objectives for the bank differed from the objectives of other
SOEs. PT Bank Mandiri Tbk had more economic objectives, such as profit and efficiency, with a
limited number of social welfare expectations (PP Perbankan 1998). From these changes, the
economic or financial objectives emerged as part of the government-stated objectives was found
only with PT Bank Mandiri Tbk. For the rest of the publicly listed SOEs, there were no significant
changes in the government-stated objectives for the SOEs.
In relation to the introduction of profit and efficiency objectives, through UU BUMN no 19/2003 and
PP Privatisation no 33/2005, the government implemented the rules inconsistently. The
government-stated economic or financial objectives for each publicly listed SOE were still limited.
Profit was the government’s only economic or financial stated objective for the publicly listed SOEs
as shown in Table 8.2. Four publicly listed SOEs, PT Kimia Farma Tbk (pharmaceutical SOE), PT Aneka
Tambang Tbk (AnTam/gold mining SOE), PT Timah Tbk (tin SOE) and PT Bank Mandiri Tbk were the
companies with the government profit stated objectives. This could be attributed to the elimination
of overlapping policies, since publicly listed SOEs needed to comply with stock market regulations. In
contrast, social welfare or non-economic objectives were still more often to be found as part of the
government-stated objectives for the Indonesian publicly listed SOEs. National economic was the
most frequent government-stated objectives for publicly listed SOEs. Nine publicly listed SOEs had
the objective as part of the government-stated objectives. Meanwhile, the provision of public goods
and services was found within seven publicly listed SOEs which were the second most frequent
government-stated objectives. From Table 8.2, the government-stated social welfare or non-
economic objectives were more dominant than economic or financial objectives.

107
Table 8.2: Government-Stated objectives for Publicly Listed SOEs
No Objectives indicated Government-stated objectives
No. of SOEs holding the objectives
Total number of SOEs = 14
Economic or financial objectives
1 Profit 4
2 Quality
3 Market domination
4 Corporate principles
5 Efficiency
6 Resources utilisation
7 Reputation
8 Company value
9 Technology
10 Research
11 Environmental
Social welfare objectives
1 The provision of goods/services 7
2 Community development
3 Community prosperity 6
4 Community needs 5
5 Market supply
6 OHS 5
7 Pioneer
8 Supply & price stabilisation
9 National economy 9
10 National development 3
11 National security 1
12 Industrialisation 1
13 Government assignment/policy
14 Government needs
15 State income 2 Source: Data were obtained from the government rules for the establishment of the Indonesian publicly listed SOEs From 1945 to 2010.
8.2.2 The Company’s Constitution Objectives24
The role of objectives is an important part of the relationship between a company and its owners.
Understanding the relationship between owners and objectives is the key factor to evaluate whether
the company has successfully introduced strategies and achieved its objectives (Mascarenhas, 1989).
In the context of SOEs, the process of acknowledging government-stated objectives is a reflection of
the relationship between government and the SOE. As the government sets the objectives, these are
later recognised by the SOEs or their management. For the purpose of this study, the SOEs’
objectives are separated between the company constitution objectives, which refer to the Articles of
Association (AoA) and management objectives, as referred to in their vision and mission statements.
24
The SOE or company constitution objectives are the objectives that are stated in the Articles of Association, the organisation’s annual report or financial report.
108
The influences of market economy on the publicly listed SOEs begin to become apparent when the
company constitution diverged from those of the government. During the period of this study,
several publicly listed SOEs changed their objectives due changes in their economic environments as
shown in Table 8.3. Most of publicly listed SOEs made changes in their company constitution and
management’s objectives where the economic objectives started to replace the social welfare or
non-economic objectives. The change of objectives in both company constitution and management’s
objectives were found, for example, at PT AnTam Tbk, PT Telkom Tbk and PT TBA Tbk. PT AnTam Tbk
replaced the profit objective with efficiency and competition objectives in 2010, while PT TBA Tbk
removed industrialisation, the requirement to meet government policy and national economic
expectation in 2008. PT Telkom removed the requirement to meet government policy and the
provision of public goods and services in 2007. In addition to the changes of company’s institution
statement, the publicly listed SOEs did changes in their management’s vision and mission. The
changes of structure and status from non-privatised to become publicly listed SOEs generated the
changes of management’s vision and mission at PT Wijaya Karya Tbk (construction SOE), and PT PGN
Tbk. These publicly listed SOEs changed their structure and status from non-privatised to publicly
listed SOEs in 2003 and 2004. Changes in their objectives were noticeable when, for instance, PT
PGN Tbk introduced new objectives including growing from public company to a world class
company (PGN, 2004; 2008; 2009; 2010). The others publicly listed SOEs were also experienced with
the change of management’s objectives. These changes happened as the companies needed to focus
on their business activities or follow market regulations. Meanwhile, changes occurred within other
publicly listed SOEs, motivated by the financial crisis in 2007. The management did more often
changes in their objectives by focusing on the economic. Several economic or financial objectives
appeared to replace the social welfare or non-economic objectives as shown in Table 8.3.
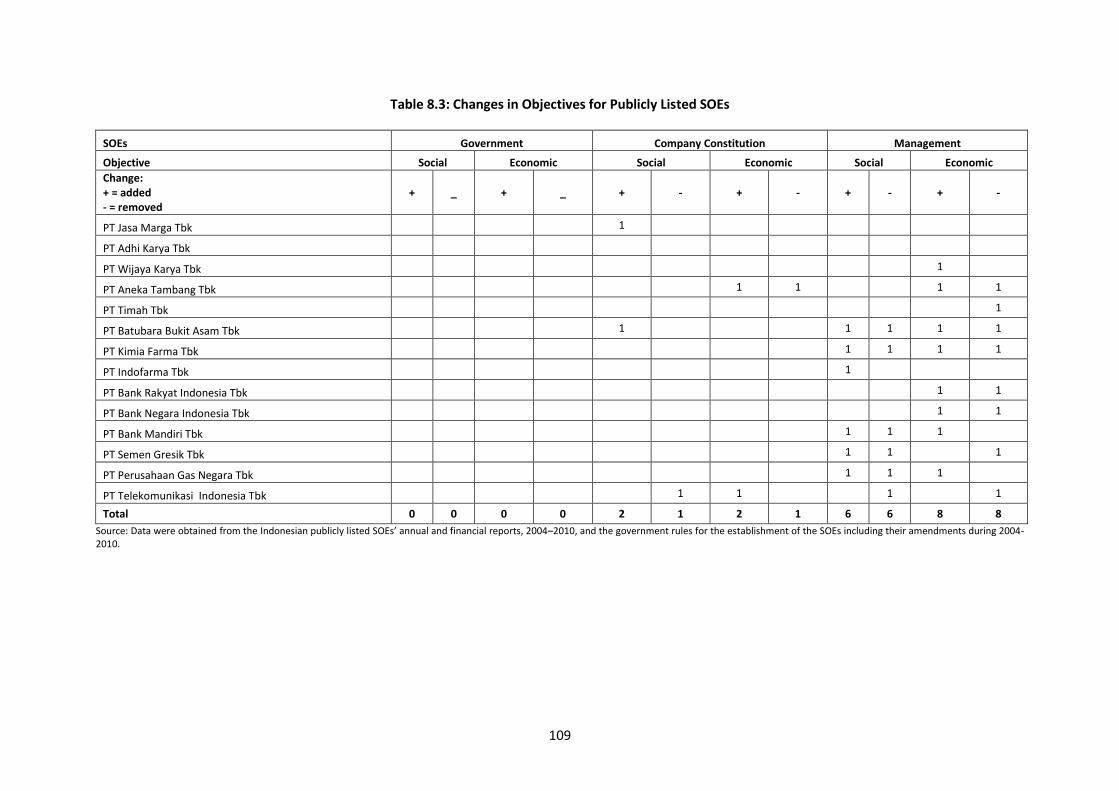
109
Table 8.3: Changes in Objectives for Publicly Listed SOEs
SOEs Government Company Constitution Management
Objective Social Economic Social Economic Social Economic
Change: + = added - = removed
+ _ + _ + - + - + - + -
PT Jasa Marga Tbk 1
PT Adhi Karya Tbk
PT Wijaya Karya Tbk 1
PT Aneka Tambang Tbk 1 1 1 1
PT Timah Tbk 1
PT Batubara Bukit Asam Tbk 1 1 1 1 1
PT Kimia Farma Tbk 1 1 1 1
PT Indofarma Tbk 1
PT Bank Rakyat Indonesia Tbk 1 1
PT Bank Negara Indonesia Tbk 1 1
PT Bank Mandiri Tbk 1 1 1
PT Semen Gresik Tbk 1 1 1
PT Perusahaan Gas Negara Tbk 1 1 1
PT Telekomunikasi Indonesia Tbk 1 1 1 1
Total 0 0 0 0 2 1 2 1 6 6 8 8
Source: Data were obtained from the Indonesian publicly listed SOEs’ annual and financial reports, 2004–2010, and the government rules for the establishment of the SOEs including their amendments during 2004-2010.
110
Referring to the changes in Table 8.3, the current objectives of publicly listed SOEs showed the
economic or financial objectives are more often to be found as part of the company constitutions
and management objectives. From previous table, Table 8.3, the government did not make any
changes in regard to its objectives for SOEs, while there were changes in the company constitution
and management. Table 8.4 shows the company constitution and management developed some
new objectives as the extension from the existing government-stated objectives. Table 8.4 also
shows the influence of changes in the economic environment made certain objectives, such as
market domination, quality and competitiveness appear as part of a number of publicly listed SOEs’
vision and mission statements. As shown in Table 8.4, quality and competition became one of the
most frequent objectives for publicly listed SOEs. At the same time, the requirement to comply with
regulations and policy made the implementation of good corporate governance or the
corporatisation principle objectives an important part of the AoA objectives or the companies’
constitution objectives statement.
The influence of government-stated objectives appeared as social welfare expectations were still the
SOEs’ main concern, although some economic or financial objectives had begun to be part of the
SOEs’ objectives. The appearance of social welfare objectives was also influenced by the
government’s inconsistency in applying financial objectives, which was mirrored by the SOEs. This
made the provision of public goods and services objective was the most frequent social welfare or
non-economic objectives for the SOEs, as shown in Table 8.4. This objective was followed by national
economic development and employee skill improvement objectives. Community development was
still one of the publicly listed SOEs’ main concerns. Several publicly listed SOEs still hold this
objective as part of their objectives. These more frequent social welfare maximising objectives
ensured that the profit and efficiency objectives were not the SOEs main concern; as shown, they
were less apparent. Focusing exclusively on each objective resource, the difference was visible
between the government and the SOEs objectives25. The differences appeared as the SOEs were
likely to focus on economic objectives such as competitive, quality of the products and meeting the
stakeholder’s expectation. The table also shows that not all the original government-stated
objectives were recognised by the SOEs. The government-stated provision of community needs
objective, for example, was found in five publicly listed SOEs, while only one the publicly listed SOEs
recognised the objective as part of its company’s constitution objectives.
25
For SOEs or companies’ constitution objectives, data were selected based on firm-year method since the SOEs and management did changes i in n their objectives several times during this period of study

111
Table 8.4: The Current Objectives of Publicly Listed SOEs
No Objectives indicated
Government-Stated objectives SOE objectives
(as combined between company and management objectives)
No. of SOEs holding the objectives No. of SOEs holding the
objectives (Firm-Year data)
Number of SOEs = 14
Economic or financial objectives
1 Profit 4 2
2 Performance 7
3 Quality 12
4 Competitive 11
5 Market domination 10
6 Customer satisfaction 5
7 Corporate principles26
7
8 Efficiency 3
9 Growth 3
10 Resources utilisation
11 Company value 11
12 Meeting shareholders’ expectations 8
13 Meeting stakeholders’ expectations 8
14 Productivity 7
15 Reputation 3
16 Technology 3
17 Research
18 Environmental 3
Social welfare objectives
1 The provision of goods & services 7 9
2 Employee skills 8
3 Employee welfare 3
4 OHS 5 3
5 Community development 4
6 Community prosperity 6 2
7 Community needs 5 1
8 Market supply 1
9 Supply & price stabilisation
10 Pioneer
11 National economy 9 4
12 National development 3 4
13 National security 1
14 Industrialisation 1 3
15 Government assignment/policy 2
16 Government needs
17 State income 2
18 Synergy 2 Source: Data was obtained from the Indonesian publicly listed SOEs’ annual and financial reports, 2004–2010, and the government rules for the establishment of the SOEs including their amendments.
26
Corporate principles objective are collected based on the government-stated objective for compliance to corporate
governance or corporate principles was stated in the rules when the company was established, including all the amendments to this rule.
112
8.3 Policy Implications
As government bodies, the SOEs were very sensitive to policy changes. The main motivation to
establish the SOEs commonly refer to the country’s constitution (Aharoni, 1981). This is also the
foundation of relationship between the government and SOEs. The relationship between the SOEs
and the government meant that the SOEs were required to comply with government policies.
Previous studies find that SOEs were also often used to facilitate government policies (Ang & Ding,
2006; Astami et al. 2010; Caporaso, 1982; Gillis, 1980; Martin, 1996; Yu, 2001). In several cases,
privatisation aimed to reduce the government involvement or protection within SOEs, this created
some changes that the new publicly listed companies had to adjust to in their new market
environments (Baijal, 2002; Morgan & England, 1988). In this case, privatisation also became a
driving factor for the government to review industrial policy. Focusing exclusively on industrial and
control policies, this section examines the implications of these policies on the Indonesian publicly
listed SOEs’ business activities, including their objectives. To support the analysis about the policy
implication, the last part of this section presents a case regarding how industrial and control policies
affects the publicly listed SOEs business activities and decision making process.
8.3.1 Industrial Policies
The privatisation of Indonesian SOEs also had implications for industrial policies. For some SOEs,
their roles included facilitating government industrial regulation (Caporaso ,1982; Dornstein, 1976;
Kole & Mulherin, 1997; Levy, 1987; Nellis & Kikeri, 1989), as well as industrialisation and national
economic development (Yu, 2001). As the industry no longer held a monopoly or highly regulated,
this caused changes for the government and the SOEs in the provision of public utilities and national
economic development. After privatisation, the role of government was more likely to ensure
economic and social stability than to regulate SOEs or markets (Bai et al. 2000; Ramamurti, 1999).
However, for some Indonesian industries that were highly regulated (such as telecommunications,
toll roads and natural gas), privatisation was a key to breaking up their monopoly by allowing private
participants to participate in these business activities. This situation might be considered to contrast
with the 1945 Constitution of Indonesia’s statement, where the government was to be the only
authority to operate and provide these products and services. In practice, only PT Jasa Marga Tbk
and PT Telkom Tbk experienced this type of change. After privatisation and the establishment of the
Badan Pengatur Jalan Tol (BPJT/Indonesia Toll Road Authority), PT Jasa Marga Tbk was no longer the
toll road authority body. Meanwhile, PT Telkom Tbk was no longer the single telecommunications
player for domestic phone lines following privatisation and the issuance of UU Telekomunikasi no
52/2002 (Telecommunication Act no. 52/2002), and the establishment of Badan Regulasi
Telekomunikasi Indonesia (BRTI/The Telecommunication Regulation Agency)(Telecommunication Act
113
2002). The establishment of new government structures was not limited to toll roads and
telecommunication industries. The mining industry also encountered the establishment of new
government structures, such as Badan Pengatur Hilir Minyak dan Gas Bumi (BPH MIGAS, the
government body with the authority to supervise and control the distribution of oil and natural gas).
The establishment of BPH MIGAS had some policy implications for the business and decision-making
process of PT PGN Tbk. These changes in SOE structures and authority might be seen as the
government detaching from providing products and services. Conversely, the government still holds
control through pricing, distribution and fees (Baijal, 2002).
The change of economic environment, new government bodies, and monopoly resulted in some
conflicts of interests and overlapping policies. Conflict commonly appeared when control over the
resources had implications for particular parties. Conflict in relation to industrial policy appeared
when the government controlled prices, tariffs and licences. Control also became an issue when
economic objectives were in conflict with regulatory constraints. Government control over price and
licences created some implications for SOEs decision-making process and business activities. In
certain cases, control of prices and tariffs were barriers for publicly listed SOEs to achieve their
economic or financial expectations, such as profit and efficiency. The control of tariffs for PT Jasa
Marga Tbk, for example, occurred because the tariff needed to be adjusted every two years. In
practice, the adjustment of tariffs had to deal with several obstacles creating risks for the company,
such as public objections and the projects’ achievement (JasaMarga, 2004; 2005). PT Telkom Tbk and
the mining publicly listed SOEs experienced licencing issues. The establishment of BRTI meant that
BRTI held the authority to control and monitor telecommunications licences. Several cases showed
that telecommunication licences were a barrier to PT Telkom Tbk fully meeting its profit and
efficiency objectives; for instance, the introduction of international code access caused limited cover
for PT Telkom in certain regions, or when the government changed the licence due to business
prospects (Telkom, 2004; 2005; 2006; 2007; 2008; 2009). A similar case is detailed in Section 7.3.4,
where licencing is still a major issue for mining publicly listed SOEs.
Privatisation in Indonesia still provided a space for government to facilitate privileges and protection
for publicly listed SOEs. Although not all the publicly listed SOEs had a duty to provide public utilities,
there was a pattern showing that government privileges still existed, even after privatisation. The
reason for this was that both the UU BUMN no. 19/2003 and PP Privatisation no. 33/2005 still
underlined the ability of the government to ask SOEs to carry out certain duties in relation to
providing public utilities (UU BUMN 2003; PP Privatisation 2005). The importance of medicine for the
community, for example, motivated the government to provide some privileges for PT Kimia Farma
Tbk and PT Indofarma Tbk. The majority of these SOEs’ business came from the government, as has
114
been shown through a number of Ministry of Health projects carried out by these companies. In
addition, PT Kimia Farma Tbk still held licences to produce narcotics and iodine drugs for social
welfare purposes. Several government policies also benefited the publicly listed SOEs when the
government encouraged companies to take part in new social welfare rules. The government
programmes in energy sustainability gave an opportunity for PTBA Tbk to develop briquette
products, even though these products were not accepted by the market (BukitAsam, 2004; 2005;
2006; 2007; 2008; 2009). Government privilege was also found through bank re-capitalisation
programmes. Following the fiscal problems at the beginning of the 2000s, most of the Indonesian
state banks obtained support from the government to resolve their internal financial problems (BNI
2008; Mandiri 2008b). This re-capitalisation programme did not apply to the private banks. Several
banks were still confronted with financial problems where government support was needed (BNI,
2007; Mandiri, 2009).
The provision of public utilities did not always result in special treatment for the SOEs. In some
cases, the provision of public utilities separated publicly listed SOEs from other business entities. For
example, the provision of public utilities encouraged the government to introduce a new regulation
for telecommunication operators to build a number of telecommunication networks in rural areas
during the period 2004–2008. At the same time, the Universal Service Obligation (USO) regulation
obligated every telecommunications operator to contribute 0.75 per cent of their profit to the USO.
Although the company had contributed five per cent annually to the USO, the detailed procedures
remained unclear (Telkom, 2004 ). In the meantime, as a government entity, PT Telkom had to
accept the greatest share of this social obligation (Telkom, 2008; 2009). This showed that
privatisation of SOEs did not prevent government involvement in SOEs to prioritise the provision of
public utilities.
8.3.2 Control Policy
As mentioned in the previous section, government control and protection were still the main issues
for Indonesian publicly listed SOEs. Government control, transparency and the privatisation process
in Indonesia are still main public critiques in regard to privatisation in Indonesia (Astami et al. 2010;
Daily, 1995; McLeod, 2002b; Pangestu & Habir, 1989; Sutojo, 1996). This made Indonesian
privatisation far from the public’s or the IMF’s expectations. The case of PT AnTam Tbk in relation to
the ASX requirements, and the IMF LoI, were two examples of how government control hindered
privatisation expectations. This section aims to analyse how the control system applied and what the
implications of the control system were for Indonesian publicly listed SOEs.
115
Owners control is a main critique for privatisation in Indonesia. In a market economy, equity
commonly works as a combination of cash flow and control rights, in the form of ‘one share, one
vote’. In contrast, several privatisation cases showed that cash flow and control might not follow this
common practice (Shleifer & Vishny, 1994). In their study, Shleifer and Vishny (1994) refuted the
combination of control rights and cash flow; since regulation after privatisation could mean a
transfer of cash flow without control rights, and based on the fact that private firms still had political
influence (Shleifer & Vishny, 1994: p. 102). This situation applied to Indonesian privatisation, in
which cash flow and control rights operated separately. Table 8.1 shows that the new structures of
Indonesian publicly listed SOEs are still dominated by government ownership. The government still
hold 51 per cent or more through direct and indirect ownership. From Table 8.1, in addition to
government ownership, the new biggest investors for publicly listed SOEs were still dominated by
the government subsidiaries such as other SOEs, pension fund or cooperative. These situations are a
major public critique for privatisation in Indonesia.
In addition to new ownership structures, government control was also found in the board structures.
Board structures were still dominated by bureaucrats who acted on behalf of government
representatives on both executive and supervisory boards. Assuming that non-independent
members were persons who had no relationship with majority shareholders (government) and
companies, privatisation in Indonesia had successfully implemented the aim to reduce government
intervention through gaining commercial culture from overseeing boards, even though both board
were still dominated by members who had affiliation with the majority shareholder (government) or
non-independent members.27 The management and supervisory boards were still controlled by non-
independent members, as shown in Table 8.5. Some independent executives were found within
banking companies, while the rest of the publicly listed SOEs’ members were still dominated by non-
independent members. Although Ramamurti (1999) argued that the role of bureaucrats was still
necessary, even though government ownership had been relinquished to build political and
economic institutions and to assist the SOEs, reform remained an important role (Ramamurti,
1999:p. 152). This composition suggested that the government was still resistant to moving from a
bureaucratic to a commercial culture in relation to partial privatisation SOEs.
27
Independent refers to the UU BUMN no 19/2003, meaning that the person has no relationship with majority shareholders or the company. If the person used to work for, or has retired from the company, he/she must have had no relationship with the company for a minimum of three years before he/she is considered as independent.

116
Table 8.5: Composition of the Board of Directors and Board of Commissioners among 15 SOEs Publicly Listed in 2009
SOE
Board of Commissioners Board of Directors28
Independent Non-independent Independent Non-independent
PT Kimia Farma Tbk 5 3 0 5
PT Indofarma Tbk 0 3 0 4
PT BNI Tbk 3 4 0 9
PT Jasa Marga Tbk 2 4 0 5
PT Wijaya Karya Tbk 2 3 0 5
PT Bank Mandiri Tbk 4 2 2 11
PT Tambang Batubara Bukit Asam Tbk 2 3 0 6
PT Timah Tbk 3 3 0 5
PT Bank Rakyat Indonesia Tbk 4 2 2 8
PT PGN Tbk 2 3 0 5
PT Telekomunikasi Indonesia Tbk 3 2 0 8
PT Semen Gresik Tbk 3 3 0 6
PT Adhi Karya Tbk 2 3 0 6
PT Aneka Tambang Tbk 2 3 0 6
PT Bank Tabungan Negara Tbk 2 2 2 6
Total number of members (people) 39 43 6 100
Source: MSOEs; AdhiKarya 2009; AnTam 2009; BNI 2009; BRI 2009; BTN 2009; BukitAsam 2009; Indofarma 2009; JasaMarga 2009; KimiaFarma 2009; Mandiri 2009; PGN 2009; SemenGresik 2009; Telkom 2009; Timah 2009; WijayaKarya 2009.
The composition of board structures revealed some implications for publicly listed SOE business
activities and objectives. In common practice, one of the privatisation goals was to discipline
managers to maximise shareholder values and company profits. After privatisation, the new owners
were expected to bring in the management and governance skills needed to move the bureaucratic
culture to a commercial culture that focused on competition and efficiency (Abeng, 2001; 2002).
Since SOEs were commonly operating under bureaucratic control on behalf of the government (Bai
et al., 2000), the ‘real’ owners were usually biased or unclear (Chang & Wong, 2009; McLellan, 2005;
OECD, 2005). Bureaucratic and political control was claimed as a reason for inefficiency, due to the
tendency to focus on the maximisation of social welfare. These ‘real’ owners resulted in the absence
of management discipline and control for maximising productivity (Jim Brumby, 1997; 2005; Shirley,
1999). At the same time, as government entities, SOE managers commonly performed two different
28
The board terminology is used in Indonesia is Dewan. There are two board structures in each SOE; Dewan Komisaris (Supervisory board for Persero) or Dewan Pengawas (Oversight board for Perum) and Dewan Direksi (management board). Director (Direktur), the title for each management board member, and a Commissioner (Komisaris) is a title for each supervisory board member for Persero (public limited liabilities), and anggota dewan pengawas (Oversight Board member) for Perum (public company)
117
functions: business management and political management. SOE business activities were commonly
influenced by managerial behaviour and orientation (Zif, 1981). As bureaucrats, they might
potentially have a role in political liaison between government and the company, and this allowed a
significant influence over the SOEs’ objectives, which were likely to be dominated by social welfare
maximisation goals (Javidan & Dastmalchian, 1988). Thus, the composition of the board structure for
Indonesian publicly listed SOEs, which were still dominated by non-independent members, ensured
the influence of social welfare maximisation on the SOEs’ objectives and business activities.
8.3.3 Mining: A Special Case
This section is a special case that presents to show how conflict of interest appears even after the
SOEs privatised. This section is a picture in regards to control and industrial policies are in conflict
and have implications on the publicly listed SOEs. This section also aims to show that privatisation
does not stop the government involvement in the publicly listed SOEs particularly in relation to the
provision of social welfare.
In contrast to other SOEs, the publicly listed mining SOEs revealed a unique case. Although only
occurring in publicly listed mining SOEs, similar potential cases existed in SOEs in different industries.
For the purpose of this study, the mining SOEs were examined separately as part of a broader
analysis of whether the government and SOE objectives were in harmony or conflict. Conflict
occurred mostly at the government level, but these conflicts had significant impact on the
operations of the SOEs. The mining license was the main factor in conflicts of interest between
government bodies and the SOEs. This was found to be the case for PT AnTam Tbk and PTBA Tbk.
The main licence issue emerged as a result of decentralisation policy, driven during the post-New
Order regime era, when the government introduced the Undang-Undang no. 32/2004 tentang
Otonomi Daerah (Regional Autonomy Act no. 32/2004) (Green, 2004) and the Undang-Undang no.
4/2009 tentang Pertambangan Mineral dan Batubara (Mineral and Coal Mining Act no. 4/2009).
These Acts required companies to improve local communities, support regional and state incomes,
and create job opportunities.
Conflict arose because the rules stated that authority over natural resources was held by both
central and regional government. The case of Integrated FeNi and the Stainless Steel project in Obi,
North Maluku Island for PT AnTam Tbk, showed how conflict occurred when the regional
government cancelled the mining licence (AnTam, 2008). In addition, the case of the coal mining
licence in Lahat, South Sumatera province, for PTBA Tbk where the regional government issued
licences for several miners to explore the same area owned by PTBA Tbk (BukitAsam, 2006), clearly
118
showed a conflict of power and interest between government bodies. Although the financial losses
could not be calculated, both companies suffered operationally.
In addition to these mining licence issues, publicly listed mining SOEs were also confronted with fee
issues. During this period of study, although issues concerning fees occurred in different ways, most
publicly listed mining SOEs had to deal with such issues. These usually applied to production; as the
government required the SOEs to pay fees for mining production. For example, the fee for tin
production was not only applied to PT Timah Tbk, but also to unconventional mines. The same
occurred with PTBA, as the company was asked to pay Rp. 500 per tonne of coal produced as a
donation to the regional government (BukitAsam, 2004). This donation was later used by the
regional government to buy the company’s ownership.29
8.4 The government-Stated Objectives in Practice: Discussion
This section discusses the government stated objectives for publicly listed SOEs, and examines
hypothesis one regarding whether the introduction of new objectives as a consequence of
privatisation policy causes conflicting objectives for new privatised SOEs objectives and business
activities. The hypothesis expects that the government and new privatised firm alter their objectives
following the implementation of privatisation policy and liberalisation of their market economy, and
that these changes generate conflicting objectives.
From the analysis in Chapters 6 and 7, privatisation is an alternative event that impacts the current
SOEs structure and objectives. Later, this event constructs the current SOEs objectives and structure
which may differ from the original framework or goal. The current structure of SOEs is likely to
facilitate the new government-stated objectives, profit and efficiency, which introduced through the
UU BUMN no 19/20003 and PP Privatisation no 33/2005 when privatisation has become part of the
SOEs evolution. In practice, the restricting the SOEs objectives and structure does not work evenly.
This section analysis shows the objectives apply in practice after the SOEs were privatised.
8.4.1 The Objectives in Harmony
As the government body, SOEs have an obligation to comply with the constitution and government
policy. As the constitution is the main reason for the government to establish SOEs (Aharoni, 1984),
this is also background for the relationship between the government and SOEs. This relationship has
some implications. For example is an obligation for SOEs to carry the government’s role and duty in
the provision of public utilities. This obligation has also an implication on the objectives.
29
The regional government owned around 1 per cent of the company.
119
Privatisation may not stop the government involvement in publicly listed SOEs even after the
privatisation. Natural monopolies which are commonly controlled by the government through SOEs
are still more efficient under the government authority (Yarrow, 1999; Bai et al. 2000). Although the
government may not be part of the company’s structure, the government may still be part of the
publicly listed SOEs business activities. The market, price, distribution and fees are some areas
where the government may still hold the control with the publicly listed SOEs (Baijal 2002; Bel 2005;
Yarrow, 1999). The empirical studies in regard to privatisation result show that the government
retain its control within the companies even after the privatisation through the golden share
ownership (Perotti, 1992; 1995; Bel, 2005). This makes the government involvement and influence
remain strong ever through the regulation, management or ownership within the company. This also
makes no significant changes in regard to the political objectives of the government for the
companies (Bel, 2005).
The studies of privatisation above are also found, in practice, with the case of Indonesian publicly
listed SOEs. Privatisation does not make any different in regard to the government control. The
structure of ownership and management shows that the Indonesian publicly listed SOEs are still
dominated by the government’s agents. The government retained its majority control have an
implication to the domination of social welfare or non-economic objectives. As indicated previously
in Table 8.3, social welfare objectives were still part of publicly listed SOEs. This is also supported by
the market for some Indonesian publicly listed SOEs are still highly regulated or the government still
provide some privileges for the SOEs as shown through the case of PT Kimia Farma Tbk, PT
Indofarma Tbk, PT Telkom Tbk, PT Jasa Marga Tbk and PT PGN Tbk.
The change of market economies after privatisation still placed social welfare or non-economic
objectives as a government priority. Although the provision of public utilities was not the most
frequent objective, several other non-economic objectives often appeared as part of government-
stated objectives. For example, the requirement for SOEs to support national economic and
contribute to state budgets made this requirement still part of the SOEs’ objectives. The high
dependence of the government on the SOEs’ budget support, which mainly came from taxes and
dividends, became clearly apparent for several publicly listed SOEs, particularly in mining. Four
publicly listed SOEs held this objective: PT AnTam Tbk, PT Timah Tbk, PTBA Tbk, and PT Kimia Farma
Tbk. As government bodies, several SOEs, including publicly listed SOEs, also had also an obligation
to provide employment. Four publicly listed SOEs were required to achieve this objective: PT Timah
Tbk, PT AnTam Tbk, PT Kimia Farma Tbk, and PT Semen Gresik Tbk. From these finding, it presume
that the government-stated objectives are likely to be in harmony with the SOEs’ company
constitution and management’s objectives.
120
8.4.2 The Objectives in Conflict
The subsection analyses in what extend the objectives are in conflict based on the privatisation and
institutional changes perspectives. From the privatisation perspective, the changes of ownership
structure through privatisation have some implications on the new publicly listed SOEs’ business and
objectives. The involvement of new owners may lead to uneasy situation for publicly listed SOEs in
regard to the requirement to meet multiple expectations. Earlier studies of SOEs show that profit
may not be the government main concern for SOEs (Boardman et al 1986; Hafsi, 1985; Martin, 1996;
Ramamurti, 1989). The existence of new shareholder with economic or value added expectation may
place the publicly listed SOEs’ management in difficult situation to deal or balance these
expectations (Ogden and Watson, 1999). The other impact of the privatisation is found when
privatisation aims to improve the SOEs performance and efficiency. Performance and efficiency are
two major public pressure that are motivated the government to conduct privatisation. In practices,
the provision of public utilities is commonly high cost due to socio-economic reasons (Hanschen and
Erspamer, 2004; Hamzah, 2007; Martin, 1996; Yu, 2001). This makes efficiency is not an easy goal for
SOEs. Privatisation may change the cost of the provision of public utilities as the market where SOEs
run the business may also be changed. In some case, privatisation may reduce the government
particularly politician and bureaucrats’ influence on the SOEs for social welfare reason. This
privatisation may generate the commercialisation of public utilities.
Privatisation in Indonesian shows that privatisation encouraged the government to open a number
of industries that had previously been SOEs only. Some market industries has no longer highly
regulated following the privatisation of the SOEs. From the analysis in Section 8.1, the government
remove the PT Telkom’s Tbk and PT Jasa Marga Tbk authority prior their privatisation. The change of
market economy activities has altered the SOEs’ objectives. Some publicly listed SOEs make changes
in their objectives as the consequence of financial crisis in 2007 or change of the management’s
structure. In contrast, the government has never made any changes for its objectives on each
individual SOE. Therefore, the gap between the government and SOE objectives is noticeable as
shown in Tables 8.3. From Table 8.3, publicly listed SOEs started to make some changes in their
objectives to adjust to these changes in their operational environment. The economic objectives,
such as market domination, competitiveness and quality, became part of the SOEs’ new objectives.
From the institutional changes perspective, the current SOEs structure and objectives for publicly
listed SOEs is a picture of how the organisation changes during period of time. From the analysis of
privatisation and the evolution of Indonesian SOEs in Chapters 6 and 7, privatisation is considered as
an event that disrupts the original of government-stated objectives for SOEs. This has some
consequences on the current publicly listed SOEs. The potential conflicting of interest and constraint
121
appears through limited of full privatisation occurred during this period of study unless the company
owned by foreign investors30. A similar conflict is also found through the gap between the
government privatisation plans and its realisation in Table 7.1. The Table shows that the constraint
to control the SOEs for social welfare purpose and regulation is intertwined with the economic
expectation and external pressure of privatisation.
The conflict of interest and constraint is also found amongst the government bodies. The conflict of
objectives and interest are found when privatisation affects the cost of the provision of public
utilities. Although the conflict between the government and new owners is limited, privatisation of
Indonesian SOEs shows some potential conflicting objectives and interest amongst the government
bodies. The conflict mostly occurs as the government economic objectives intertwine with the
regulation constraint, and the potential overlapping or conflict of the policies. Policy conflict in
Indonesia is driven by ideological reasons in context of control for natural resources. The case of the
Indonesian mining and telecommunications publicly listed SOEs, for example, indicates the conflict
between government bodies also affects company business activities (Telkom, 2008; 2009; Timah,
2009). The conflict of interest is also found from the decentralisation of regulation and the
separation of functions between regulatory bodies and shareholders cases. Overlapping policies also
create conflict of interest amongst the government agents as shown through the mining special case
in Section 8.3.3.
The control policy is still part of the institutional changes and privatisation conflict in Indonesian
cases. The conflict of control policy still hinders the company to meet the economic or financial
objectives. In most privatisation cases, privatisation breaks up the nature of government
monopolies and public services (Morgan & England, 1988). The reason is because this control of
companies by government or politicians is claimed as a reason for SOEs’ inefficiency and high rent or
risk (Ramamurti, 1999; Shleifer & Vishny, 1994). In Indonesia, several publicly listed SOEs, such as PT
Jasa Marga Tbk and PT Telkom Tbk; pharmaceutical publicly listed SOEs (PT Kimia Farma Tbk and PT
Indofarma Tbk); and mining publicly listed SOEs PT Aneka Tambang Tbk (PT AnTam/gold mining
SOE), PT Timah Tbk (tin SOE), PT Tambang Batubara Bukit Asam Tbk (PTBA/coal mining SOE), as well
as PT PGN Tbk are experience with this conflict. For several publicly listed SOEs, these control of
tariff led to conflict of interest and objectives as shown through the case of toll road tariff for PT Jasa
Marga Tbk. The case of toll road tariff revealed the conflict between financial and socio-economic
interest between the regulators, shareholders and the company. In the Indonesian publicly listed
30
During this period of study, two companies were fully privatised, PT Indocement Tunggal Prakasya Tbk and PT Wisma Nusantara Indonesia. Both the companies owned by foreign investors (Heidelberg for PT Indocement Tunggal Prakasya and JAL for PT Wisma Nusantara Indonesia).

122
SOEs, privileges still occurred and were identified in various ways. A common practice for these
publicly listed SOEs was for them to be still dominated by government projects. Privileges and
protection were also found in soft loans and refinancing to solve banks’ financial problems, or in
control price and distribution. These cases confirm that monopoly and privilege practices still
applied, even after the SOEs were privatised. This shows that control policy may become a barrier
for publicly listed SOEs to fairly compete in market economy and to achieve their economic or
financial objectives.
Referring to hypothesis one, the introduction of privatisation policy and liberalisation of market
economy for new privatised firm substantially encourages some changes. Privatisation removed the
firm control and authority as shown through the case of PT Telkom Tbk and PT Jasa Marga Tbk. The
analysis above shows that the privatisation policy encourages some changes as the new policy has
financial consequences. These consequences also encourages the firms have to review their
objectives. The changes of firm constitution and management objectives are identified. In contrast,
the introduction of privatisation policy does not make any different for the provision of public
utilities for the government. This concern is found through the government resistance to make
changes in the objectives for individual new privatised firm. The potential conflict appears as
consequence of this resistance.
In sum, from the analysis above, privatisation policy has significant impact on the publicly listed SOEs
objectives in practice. Partial privatisation is considered as a compromise between the constraint of
constitution and external pressure. Partial privatisation is also an outcome from the path of
institutional changes when privatisation becomes part of the sequence of the Indonesian SOEs’
evolution. These outcomes have implications on the publicly listed SOEs objectives as the objectives
are still influenced by the government in regard to the social welfare expectation. The change of
companies’ structure, from non-privatised to publicly listed, generated potential conflict of policy,
and objectives regarding the government and SOEs’ social welfare and financial expectations.
123
Chapter 9:
The Objectives of State Owned Enterprises in Practice:
Non Privatised State Owned Enterprises
This chapter examines whether the non-privatised SOEs’ objectives, in practice, are in harmony or
conflict following the implementation of privatisation policy. Chapters 6 and 7 show that the
implementation of the UU BUMN no. 19/2003 and PP Privatisation no. 33/2005 underlined the
importance of profit and efficiency objectives, along with the provision of public utilities. The
implications of privatisation policy are also found through the requirement for SOEs both publicly
listed and non-privatised to implement full corporatisation. Profit and efficiency objectives became
the main part of the implementation of full corporatisation though the UU BUMN no 19/2003 and
PP Privatisation no 33/2005. The implementation of UU BUMN no. 19/2003 and PP Privatisation no.
33/2005 also underline that provision of public utilities cannot hinder SOEs from being profitable.
For publicly listed SOEs as argued in Chapter 8, this change required them to make some
adjustments to their structure and objectives. However, there is limited information regarding the
effects of privatisation policy for non-privatised SOEs, particularly since the government is the only
owner of non-privatised SOEs.
The impact of privatisation policy in Indonesian is not limited to the introduction of profit and
efficiency objectives. The argument and analyses in Chapters 7 and 8 show that privatisation has
some consequences for the government industrial policies, particularly when privatisation breaks up
the government monopoly, and is then followed by commercialisation of public utilities. Although
privatisation may not directly affect the non-privatised SOEs, the previous analysis reveals the
possibilities for the government to review industrial policy, where the non-privatised SOEs operate
or run their business, as a consequence of privatisation policy. Some industries are no longer highly
regulated as a consequence of this policy. In contrast, the UU BUMN no. 19/2003 and PP
Privatisation no. 33/2005 still emphasise that some SOEs may not be available to be privatised. This
privatisation restriction makes some industries or SOEs remain highly regulated or monopolised
where the government still provide privileges and protection. In contrast, some other industries are
open for private and foreign investment participants. This causes some differences in the way the
government treats these SOEs and their objectives.
124
Using content analysis and interpretive analysis from government and SOE documents from 126 out
of 127 SOEs during 2004 to 2010, this chapter focuses on analysing the implications of privatisation
policy on the non-privatised SOEs’ objectives31. The chapter is divided in four sections: Section 9.1
the brief picture of Indonesia non-privatised SOEs; Section 9.2 focuses on analysing the objectives of
the government and SOEs; Section 9.3 examines the implication of privatisation policy and whether
the policy makes changes to SOEs objectives; Section 9.4 identify the SOEs’ objectives in practice in
what extend they are in conflict or harmony.
9.1 The Non-Privatised State-Owned Enterprises: A Brief Picture
The Indonesian non-privatised SOEs are still playing important roles in many socio-economic sectors
in Indonesia. The current structure of Indonesian non-privatised SOEs is categorised into two groups;
Perum and Persero. Perum runs in general welfare and whole owned by the government, while
Persero operates in more commercial basis where the share wholly or partly owned by the
government. In practice, the roles of SOEs, both non-privatised and publicly listed are mostly in
relations to social welfare provision and maintenance of economic stability. There are 127 non-
privatised SOEs which operate in approximately 35 industries, where most of them are linked with
the provision of public utilities or national economic development.32 Some SOEs operate as the
single player in their industries, due to lack of private participation or for national security reasons.
SOEs in strategic industries (energy, mining and fertiliser production) are in this category. Some of
these SOEs operate in a semi-competitive market due to their product niches and government
provision of privileges and protection. For example, the government still provided privileges and
protection for Perum Percetakan Negara Indonesia (Perum PNRI/ printing SOE), Perum Perusahaan
Uang Republik Indonesia (Perum Peruri/printing SOE for money or security paper), some insurance
SOEs and PT Pos Indonesia (postal SOE), due to these companies’ roles in providing public utilities.33
Some SOEs operated in competitive markets where their function was to improve the market
activities without disadvantaging other players. SOEs in trading, plantation, construction and
industrial estates were in this category. There is no much change in context of industrial policy
during this period of study, except for petroleum industry. The change of industrial policy occurred
31
There were 141 SOEs in Indonesia during 2004 to 2010. Fourteen were privatised and 127 SOEs were non-privatised. However, PT Reasuransi Indonesia is officially bankrupt, even though the government still admitted the company due to it being run by its subsidiary. For the purpose of this study, PT Reassuransi Indonesia is not examined. PT Sarana Multi Infrastruktur is a new SOE established in 2007, but only officially operating in 2010. There is not sufficient data for this company; therefore it is not included in this study. Therefore, there were only 140 SOEs examined for this thesis. 32
The industrial categorisation for this study refers to the Indonesian MSOEs’ industry categories. For this study, PT Pembangunan Perumahan, PT Bank Tabungan Negara and PT Krakatau Steel were still categorised as non-privatised SOEs, although they were privatised in 2010. 33
PT ASABRI (Insurance SOE for army and defence members), PT ASKES (health insurance SOE for government officers) are insurance SOEs to which government provides protection and privileges.
125
for petroleum industry when the government restructured PT Pertamina status (petroleum SOE),
from special agent under president’s authority to become the Persero structure. The change
occurred in 2003 following the government removed its protection for the industry. These roles and
changes affected for both the government and SOEs determination of their objectives.
Some SOEs still continue to rely on government support. During 2004–2010, ten SOEs obtained
subsidies from the government: two of these were under the Perum structure and the rest were
under the Persero structure. This showed that even the Persero structure, which entailed more
economic or financial objectives, still engaged with the PSO duty and get subsidies from the
government. For these SOEs, this role became part of their objectives and meshed with financial
objectives that might conflict with their other non-economic objectives. The reason for this conflict
emerged as the provision of public utilities was a government duty, which commonly merged with
inefficiency, slowness and a less profitable performance (Bai et al. 2000; Diah, 2003; Hanschen &
Erspamer, 2004; Mardjana, 1995; Martin, 1996; Willner, 1999). These services were usually large and
had less economic benefits for the company. The PSO services in Indonesian are not limited to public
utilities such as electricity, train and railway or postal services. PSO services in Indonesia are
including fertiliser, rice seed, petroleum, and passenger ship services. In addition to those SOEs,
Perum Antara (government media SOE) and Perum BULOG (basic staples distribution SOE) are in
these PSO categories. These PSOs services show the large and less benefit services of PSOs for the
companies’ benefits or performance.
The requirement for government support is not only limited for PSO duty. Some studies argued that
social roles were barriers for companies to be profitable (Hanschen & Erspamer, 2004; Martin,
1996). The fewer possibilities for companies to meet multiple objectives since, for instance, indirect
reimbursement for running the PSO were several barriers preventing these companies from
becoming profitable (Chang & Wong, 2009; Martin, 1996). Similar cases are found with the
Indonesian non-privatised SOEs. Several SOEs with PSO duties experiences indirect reimbursement
for running this service. For example, PT Pos Indonesia (post SOE) received their reimbursement in
2008 for the company’s PSO’s services in 2006 and 2007 (Pos 2008). Although the government
provided subsidies for these ten non-privatised SOEs, in practice, several SOEs such as PT
Perusahaan Listrik Negara (PT PLN/electricity SOE) and Perum Perusahaan Film Negara (Perum
PFN/film production SOE) still received government support due to their financial performance
issues (PFN, 2004; 2005; 2006; 2007; 2008; 2009; PLN, 2004; 2005; 2006; 2007; 2008; 2009). This
made the involvement of government in SOEs business activities a critical issue for public, in terms
of privileges and efficiency.

126
As the government is the only or major owners, the government influence in business process,
decision making process, and determine the objectives are noticeable. The influence of government
is found through the control structure. In addition to the Ministry of State Owned Enterprises
(MSOEs) who act as the state shareholders representative, the SOEs operate under around 18
ministerial regulation authority. The control structure is also found through the composition of
board members. The board members compositions, commissioners or supervisory board members
and management boards, were still dominated by non-independent members34. This control
structure has significant impacts on the objectives. The development of social welfare and non-
economic objectives, based on a number of studies, is also influenced by bureaucrats, who acting as
government representative shareholders, on SOE business activities and decision-making processes
(Abeng, 2001; 2002; Eric Williams, 2002; Javidan and Dastmalchian, 1988; Ramamurti, 1987; Willner,
1999; Yarrow, 1999; Chang and Wong, 2009). This involvement created a tendency for the SOEs to
accommodate their own interests beside their original objectives. Compare to publicly listed SOEs,
the government involvement in non-privatised are more often to be found. As mentioned in Chapter
1 Section 1.3, during this period of study, the government required the SOEs to take part in national
energy and food sustainability programmes (Sugiharto, 2005; MSOEs, 2012). This is an example on
how the government involvement may cause the SOEs to carry particular duty which is different
from the original government-stated objectives.
9.2 The Effect of Privatisation Policy
The introduction of privatisation policy generated changes in government and SOE objectives. The
UU BUMN no. 19/2003 and PP Privatisation no. 33/2005 identified the importance of financial
objectives, such as profit and efficiency, along with the provision of public utilities. The changes
mostly occurred after the government encouraged all SOEs, both publicly listed and non-privatised;
fully implement corporatisation practices a part of the introduction of fast track privatisation policy
in 2002. The implementation of UU BUMN no. 19/2003 and PP Privatisation no. 33/2005 also
worked with SOE business activities with regard to the provision of public utilities, as found through
the mechanism of PSO duties and government financial support only being available for limited
SOEs. This requirement had implications for their duty to provide public utilities. Through these laws,
provision of public utilities or PSO was no longer a barrier for SOEs to be profitable or to be
privatised. However, in practice this rule was applied differently; this is further analysed in this
section.
34
The data of board composition showed that 14 per cent of the commissioners or supervisory board members were independent, and only 4 per cent of the management board members were independent.
127
The changes of objectives were affected by changes in the economic environment in which the SOEs
operated. In this case, the changes of objectives were caused by the introduction of a new policy
which was linked with privatisation expectations. Privatisation aims, which mainly required the
government to reduce its involvement in the SOEs’ business activities and decision-making
processes, meant that some industries were no longer monopolised by the SOEs only. For example,
PT Pertamina was experience with the change of structure form special body under President’s
control to Persero. This change had an impact on the petroleum industry which has been opened to
private participation. The introduction of privatisation policy also caused some changes in the way
the government classified the SOEs. Through the laws, the government underlined the criteria for
privatisation which meant not all SOEs are available to be privatised (UU BUMN 2003; PP
Privatisation 2005). The rules emphasised that certain SOEs were to be restricted from privatisation
due to socio-political reasons. Based on the restricted categories, as referred to in the PP
Privatisation no. 33/2005, UU BUMN no 19/2003, and the Peraturan Presiden (PerPRes) no. 36/2010:
Daftar Negatif Investasi Indonesia (PerPRes Negatif list Investasi no. 36/2010 The Negative
Investments List), there were 39 SOEs categorised as restricted. This treatment diverged from both
government and SOE objectives as well as the criteria of SOEs as whether they allow to be privatised
or not.
9.3 The Objectives
Objectives have various roles in business activities. In addition to the relationship between agents
and principals, the roles of objectives have been shown to determine the aim of actions, or to
reduce differences during the process of achieving expectations (Boyd & Levy, 1966). A preliminary
analysis in Chapter 6 revealed that the Indonesian SOEs’ objectives evolved from socio-political to
socio-economic then from socio-economic to financial objectives. When the government introduced
economic or financial objectives through privatisation and corporatisation, the differences in
objectives created complexity or conflicting goals. Similar to Chapter 8, for the purpose of this study,
in addition to government-stated objectives, the SOE objectives are shown in detail by separating
the sources of objectives: company constitution objectives, as stated in AoA or financial reports; and
management objectives as stated in vision and mission statements.
Similar to the publicly listed SOEs, the government-stated objectives for the many individual
Indonesian SOEs have never been changed. The government has never made any changes in its
objectives for majority individual SOEs since the companies were established in 1960s. Some of the
SOEs were experiences with the changes of their structure, from Perum or Perjan to Persero
structure; it did not affect the government-stated objectives for the companies. However, during
128
this period of study, the government changed its objectives for ten SOEs, including SOEs with Perum
status. The changes are as shown in Table 9.1. These changes were:
1. Two SOEs were experienced with the change of government-stated objectives when the
government emphasised the national economic development as part of its objectives. The
SOEs were Perum Perhutani (forestry SOEs) and Perum BULOG.
2. Four SOEs were experienced a change of government-stated objectives when the
government reviewed these companies’ duties regarding the provision of goods and
services. The SOEs were Perum Jasa Tirta I and Perum Jasa Tirta II (water and irrigation
SOEs), PT Perusahaan Pengelola Aset (PT PPA/asset management SOE) and Perum Perumnas
(housing SOE for middle and lower class families).
3. Two SOEs, Perum Peruri and Perum PNRI, were experienced with the changes of the
government-stated objectives when the government emphasised the importance of the
national economy and the provision of goods and services. For these SOEs, the changes were
likely motivated by the requirement to reduce competition because their products were very
specific.35
4. The government changed its objectives for PT Jaminan Kredit Indonesia (PT Jamkrindo/credit
insurance SOE) and PT Pertamina (petroleum SOE) when the companies were changed to
Persero structure. The government-stated objectives for PT Jamkrindo were focused on the
national economy and provision of goods and services. For PT Pertamina, the government-
introduced profit objectives meshed with the company’s other objectives.
From these changes of the government-stated objectives, the changes were still dominated by the
additional or replacement of social welfare or non-economic objectives, while the changes of
government-stated economic or financial objective by introducing the profit objective took place for
PT Pertamina only.
The changes of government-stated objectives for these ten SOEs did not affect the companies’
constitution objectives. Table 9.1 shows that the change of the government-stated objectives was
wholly recognised by PT Jamkrindo only. Perum PNRI, Perum Perumnas and Perum Perhutani
acknowledged only some parts of the government’s stated new objectives. These companies
recognised the national development objective as part of their objectives, but not the provision of
goods and services objectives. This might be because these companies’ products are very specific
35
Most of the SOEs that experienced a change of objectives were SOEs with monopoly rights. Their products are very specific or are categorised as vital for the state and communities.
129
and less competitive.36 The remaining SOEs did not provide sufficient data to allow an analysis of the
consequences of these changes. Meanwhile for the other SOEs, since the government-stated
objectives remained relatively unchanged, the SOEs had to make some changes to their objectives to
adjust to market activities. For example, the financial crisis caused a lack in the government’s ability
to provide financial support to the SOEs; which had to deal with financial difficulties and
performance problems (Vernon, 1984). Lack of government support compelled the SOEs to find
alternative financial resources to support their businesses, and therefore economic or commercial
indicators began to constitute a larger portion of their objectives as shown in Table 9.1.
Competitiveness was one of the most common additional objectives, while customer satisfaction
started to become a concern for the SOEs.
In addition to company’s constitution objectives, management may add new objectives for the SOEs.
Although this part is not part of the analysis, the management vision and mission statement is added
part of this section to show potential difference between the governments stated objectives, the
company’s constitution and management vision statement. The ten SOEs that experienced changes
of government-stated objectives during the period 2003–2010 did not wholly acknowledge the new
objectives as part of their own objectives. The analysis of the management’s vision and mission
statements showed that the role of the market in determining objectives was observable; the
objectives of management started to demonstrate the domination of economic objectives. The
effect of competition showed that management had a tendency to strengthen their business by
focusing on quality, employees and meeting the stakeholders’ expectation.
36
Perum Perumnas operates in the provision of housing for low and middle class communities. Perum PNRI is a printing SOE for government purposes such as security and money. Perum Perhutani is forestry SOE in the Jawa/Java area. These SOEs are still the single business player in their areas.
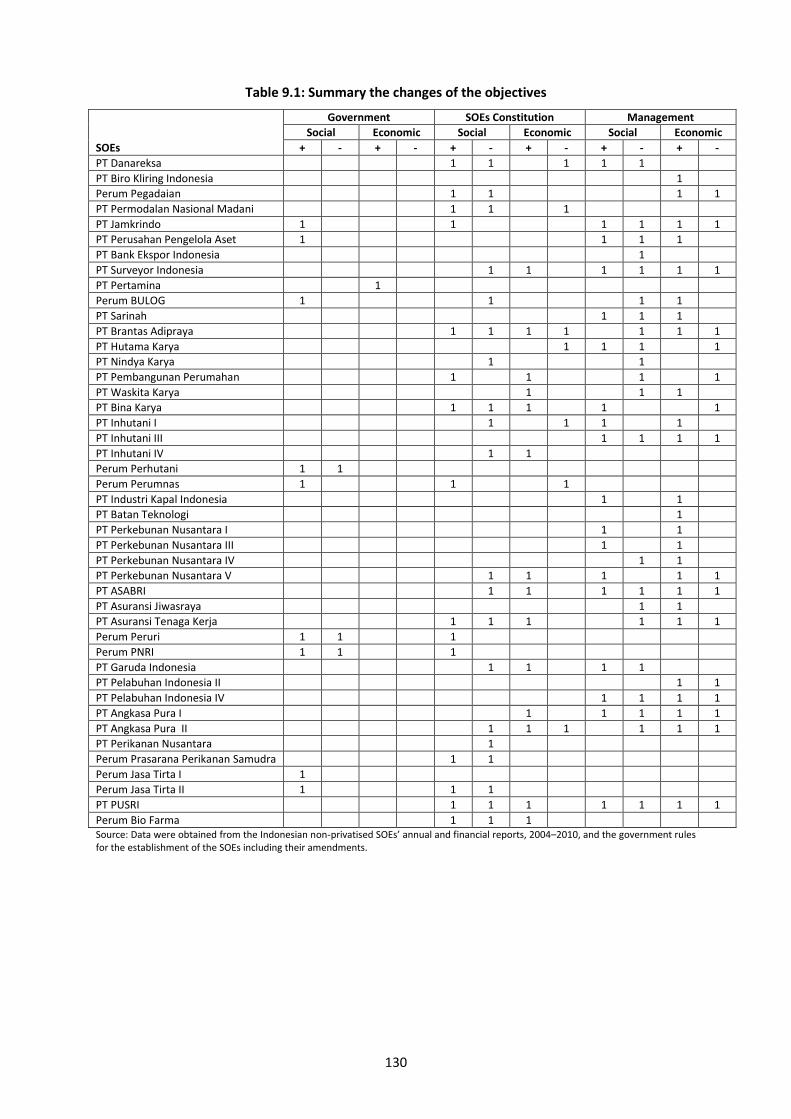
130
Table 9.1: Summary the changes of the objectives
SOEs
Government SOEs Constitution Management
Social Economic Social Economic Social Economic
+ - + - + - + - + - + -
PT Danareksa
1 1
1 1 1 PT Biro Kliring Indonesia
1
Perum Pegadaian
1 1
1 1
PT Permodalan Nasional Madani
1 1
1 PT Jamkrindo 1
1
1 1 1 1
PT Perusahan Pengelola Aset 1
1 1 1 PT Bank Ekspor Indonesia
1
PT Surveyor Indonesia
1 1
1 1 1 1
PT Pertamina 1
Perum BULOG 1
1
1 1 PT Sarinah
1 1 1
PT Brantas Adipraya
1 1 1 1
1 1 1
PT Hutama Karya
1 1 1
1
PT Nindya Karya
1
1 PT Pembangunan Perumahan
1
1
1
1
PT Waskita Karya
1
1 1 PT Bina Karya
1 1 1
1
1
PT Inhutani I
1
1 1
1 PT Inhutani III
1 1 1 1
PT Inhutani IV
1 1 Perum Perhutani 1 1
Perum Perumnas 1
1
1 PT Industri Kapal Indonesia
1
1
PT Batan Teknologi
1 PT Perkebunan Nusantara I
1
1
PT Perkebunan Nusantara III
1
1 PT Perkebunan Nusantara IV
1 1
PT Perkebunan Nusantara V
1 1
1
1 1
PT ASABRI
1 1
1 1 1 1
PT Asuransi Jiwasraya
1 1 PT Asuransi Tenaga Kerja
1 1 1
1 1 1
Perum Peruri 1 1
1 Perum PNRI 1 1 1
PT Garuda Indonesia
1 1
1 1 PT Pelabuhan Indonesia II 1 1
PT Pelabuhan Indonesia IV 1 1 1 1
PT Angkasa Pura I 1 1 1 1 1
PT Angkasa Pura II 1 1 1 1 1 1
PT Perikanan Nusantara 1
Perum Prasarana Perikanan Samudra 1 1
Perum Jasa Tirta I 1
Perum Jasa Tirta II 1 1 1
PT PUSRI 1 1 1 1 1 1 1
Perum Bio Farma 1 1 1 Source: Data were obtained from the Indonesian non-privatised SOEs’ annual and financial reports, 2004–2010, and the government rules for the establishment of the SOEs including their amendments.

131
From this analysis of objectives above, the government and SOEs objectives start to show
differences. Table 9.2 shows that the companies added new objectives as part of the SOEs’
objectives. The influence of market economy where the SOEs run their business appears as the
market domination and competition became part of the SOEs objectives. The influence of market
economy caused competition crucial for non-privatised without privatisation restriction as shown in
Table 9.2. Competition became the most frequent economic or financial objectives for non-
privatised SOEs without privatisation restriction. Since some of non-privatised SOEs with
privatisation restriction run in single market, competition was not their main concern. This group of
SOEs had a tendency to focus on quality. Therefore, quality was the most frequent economic or
financial objectives for non-privatised SOEs with privatisation restriction.
Some government social welfare or non-economic objectives were still acknowledged by non-
privatised SOEs as part of their obejctives. A number of non-privatised SOEs without privatisation
restriction were more likely to acknowledge the government social welfare objectives to be part of
their company’s objectives than non-privatised SOEs with privatisation restriction. In practice,
several social welfare or non-economic objectives less frequent appears to be part of the SOEs
objectives. For examples, the provision of public goods and services was less frequent to be part of
non-privatised SOEs with privatisation restriction objectives. The occupational health and safety was
no longer being part of non-privatised SOEs with privatisation restriction’s objectives, while the
provision of community needs and community prosperity were less frequent to be part of non-
privatised SOEs without privatisation restriction’s objectives. This situation makes a gap between the
government and companies’ constitution objectives as shown in Table 9.2.

132
Table 9.2: The Government and SOE Objectives in Non-privatised SOEs
No Objectives indicated
Government-Stated objectives
SOE objectives (as combined between company and
management objectives)
No. of SOEs holding the objectives No. of SOEs holding the objectives
Restricted for Privatisation
Non-restricted for Privatisation
Restricted for Privatisation
Non-restricted for Privatisation
Number of SOEs in total = 127
Economic of Financial Objectives
1 Profit 3 4 11 26
2 Performance 10 23
3 Quality 3 2 21 42
4 Competitive 17 58
5 Market domination 1 12 31
6 Customer satisfaction 7 12
7 Corporate principles37
4 3 11 24
8 Efficiency 1 4 11 14
9 Growth 5 22
10 Resources utilisation 1 2 7 9
11 Company value 1 6 15
12 Meeting shareholders’ expectation 7 19
13 Meeting stakeholders expectations 13 12
14 Productivity 3 6
15 Reputation 1 13
16 Technology 1 2 15
17 Research 1
18 Environmental 1 9 23
Social Welfare or Non-Economic Objectives
1 The provision of goods & services 29 45 19 49
2 Employee skills 14 40
3 Employee welfare 2
4 OHS 4 16 7
5 Community development 2 4 7 16
6 Community prosperity 7 18 8 8
7 Community needs 11 21 11 1
8 Market supply 1 7 4
9 Supply & price stabilisation 1 1 2
10 Pioneer 1 1 3
11 National economy 15 28 20 40
12 National development 10 5 20 39
13 National security 2 1 2 3
14 Industrialisation 1 12 3 18
15 Government assignment/policy 2 5 6 6
16 Government needs 1 4 3 2
17 State income 3 7 14
18 Synergy 2 Source: Data were obtained from the Indonesian non-privatised SOEs’ annual and financial reports, 2004–2010, and the government rules for the establishment of the SOEs including their amendments.
37
The corporate principles objectives are collected based on the government-statedobjective for compliance to corporate
governance or corporate principles was stated in the rules when the company was established, including all the amendments to this rule

133
9.4. Objectives in Practice: Discussion
This section identifies whether, in practice, the government and SOEs objectives were likely to be in
harmony or conflict. This section also examines hypothesis one regarding whether the introduction
of new objectives as a consequence of privatisation policy and liberalisation of the market economy
causes conflicting objectives for SOEs objectives and business activities. The hypothesis expects that
the privatisation policy may indirectly affect the non-privatised SOEs market. Therefore, the
government and SOEs have to review the objectives. The introduction of privatisation policy and
liberalisation of markets may alter the government objectives. A previous study identified control as
being one of the most common issues, causing difficulty not only for SOEs to determine the ‘owner’,
but also to sort out issues between their objectives (Vernon, 1984). In regard to the objectives issue,
the involvement of bureaucrats and politicians generated multiple objectives, not only for economic,
but also for other socio-political purposes (Shleifer & Vishny, 1994). Competing interests were a
factor that made the objectives statements vague and ambiguous (Javidan & Dastmalchian, 1988).
9.4.1 The Objectives in Harmony
The analyses in Chapters 6 and 7 showed that the SOEs’ objectives had been set since their
establishment. As corporate entities created by the government, the SOEs were more likely to
become vehicles to meet government public policy aims (Sundaram & Inkpen, 2004). With reference
to the previous sections in this chapter, most of the government’s objectives were recognised by the
SOEs as part of the companies’ constitution objectives. Later, SOEs extended the government-stated
objectives to include an additional ten new objectives as a consequence of changes in market
economy around the SOEs. Analysing each additional objective demonstrated that several new
objectives were modified from the original government-stated objectives. For example, quality was
modified from the government’s objectives for the provision of goods and services, which were
influenced by market competition. This modification was the process used to determine company
constitution objectives through the acknowledgement of the government’s objectives; while at the
same time, the company tried to accommodate changes in its business area. This acknowledgement
represented the obligation for SOEs to become public vehicles for the government to meet public
policy expectations.
9.4.1 The Objectives in Conflict
The path of institutional changes analysis in Chapter 6 shows a branching point of path which
determines the current SOEs’ objectives and structure. The introduction of privatisation during the
evolution of Indonesian SOEs has disrupted the original government-stated objectives for SOEs. This
shows through the introduction of profit and efficiency through UU BUMN no. 19/2003 and PP
134
Privatisation no. 33/2005. As mentioned in Chapter 6, Section 6.3.2.1, the government limited the
SOEs structure for Perum and Persero structure, because Perjan structure could not match this
economic policy requirement. This makes profit and efficiency are the government main concerns
for SOEs, both Perum and Persero (UU BUMN 2003; PP Privatisation 2005). In practice, both Perum
and Persero are still required to carry social welfare expectation as shown through the PSOs duty
that applies for both structure38. The laws also provide a “space” for the government to require the
SOEs to carry social welfare duty. These exceptional requirements may create conflicting objectives
for SOEs.
Most SOEs have operated in their industries since the beginning of Indonesian statehood when the
objectives framework was set. During the period of SOEs’ evolution, the change of market economy
following privatisation policy, monopoly breaking, and the financial crisis in 2007 ensured that the
SOEs reviewed their goals. Several studies of institutions and organisations showed how the
institutions developed constraints through creating standard and expected actions to reduce
uncertainty (Washington & Ventresca, 2004). In practice, several standard and expected actions
have been developed with clear objective statements whenever the SOEs or government
encountered changes in the economic environment as shown through the evolution of Indonesian
SOEs in Chapter 6. The implementation of profit and efficiency was a standard and expectation
action when the market economies around the SOEs were changed due to the pressures of
privatisation. In practice, the conflict between the state welfare orientation and market pressure
makes the change occurs improperly. The importance of social welfare has differed the treatment
and objectives of the non-privatised SOEs between the one with privatisation restriction and without
the restriction. Profit and efficiency may not be in conflict when the SOEs do not mainly operate for
the social welfare purposes.
Referring to hypothesis one, the introduction of privatisation policy and liberalisation of market
economy has indirectly affected the non-privatised SOEs market economy. The policy encourages
the government and SOEs to consider economic or financial objectives such as profit and efficiency.
The pressure to survive in market competition persuaded the SOEs to introduce several new
objectives. This situation is followed by the introduction of new government policies that underline
the profit and efficiency objectives. These new objectives were the requirement for SOEs to fully
implement the corporatisation practice, and it might cause different situations for SOEs. In contrast,
the government interest regarding the provision of public utilities discourages the changes. The
potential conflicting objectives appears when the SOEs have to accommodate both market and
38
As mentioned on Section 5.1, ten SOEs have PSOs duty, only two out of ten are under Perum structure. The others are under Persero structure.
135
government requirements. The analysis in previous section, Section 9.4.1, shows that there is less
possibility for SOEs not to follow the government-stated objectives because of its financial support
and privileges, and the bureaucratic influences. Meanwhile, focusing exclusively on each objective,
the analysis of changes in Section 9.3 revealed that not all SOEs fully acknowledged the
government’s new objectives as part of their own objectives. This indicates that the SOEs’
expectations might differ from the government goals.
In sum, from the analysis above shows, the change of market economy followed by the introduction
of privatisation policy indirectly motivates the government and SOEs to review their objectives. The
result shows that government alters the objective for certain SOEs only, while the rest remains
unchanged. In practice, the objectives are in harmony since the SOEs still highly rely on the
government support and privileges. Since the government is the only owner for these non-privatised
SOEs, the influence of the government in determining the SOEs objectives remain stronger.
However, potential conflicting appears as a consequence of the government inconsistency to
implement profit and efficiency objectives policy on each individual SOE. This inconsistency leads to
potential conflicting of objectives between the government and SOEs.
136
Chapter 10:
The Relations between the Government-Stated Objectives
And SOEs’ Financial Performance
This chapter examines SOEs’ performance in relation to attaining the government-stated objectives.
Mixed objectives are potentially conflicting, as identified in Chapters 8 (for publicly listed SOEs) and
9 (for non-privatised SOEs). These potential conflicting objectives occur when the government is
required to make changes in the market economy environment while still required to provide public
utilities and social welfare for the community through the roles of SOEs. The conflicts are
conceptually found when privatisation and the liberalisation of regulated market policies for SOEs
are implemented. This is the main area of analysis in this chapter.
The importance of the profit and efficiency objectives, which were formalised through UU BUMN no.
19/2003 and PP Privatisation no. 33/2005, exist alongside other government-stated social welfare
and non-economic objectives for each SOE. The analysis in Chapters 7–9 shows that the
government’s inconsistency in applying both the profit and efficiency objectives to individual SOEs
has generated potential conflicting objectives. This inconsistency is followed by the partial
privatisation of SOEs and the transferring of their monopoly status under the government authority.
This transfer still gives the Indonesian government an opportunity to control and protect privatised
firms. These inconsistencies result in potential differences between the government and SOEs’
objectives, and among the government bodies. Chapters 8 and 9 also identify that changes in
policies and conflicting objectives may affect SOEs’ performance.
This chapter focuses on analysing the potential for conflicting objectives for SOEs’ measurable
performance in relation to the government-stated objectives during the current political regime
2004–2010. This analysis distinguishes three types of SOEs: publicly listed SOEs, non-privatised
without privatisation restrictions and non-privatised with privatisation restrictions 39. This chapter is
divided into three sections. Section 10.1 briefly overviews SOEs’ objectives based on the analysis
from previous chapters. Section 10.2 describes the expected relations between SOEs’ measurable
performance and the government-stated objectives. Section 10.3 presents and discusses the
findings.
39
The term ‘publicly listed SOEs’ is used in this thesis because the government still owns more than 51 per cent, even if the firm has been publicly listed.
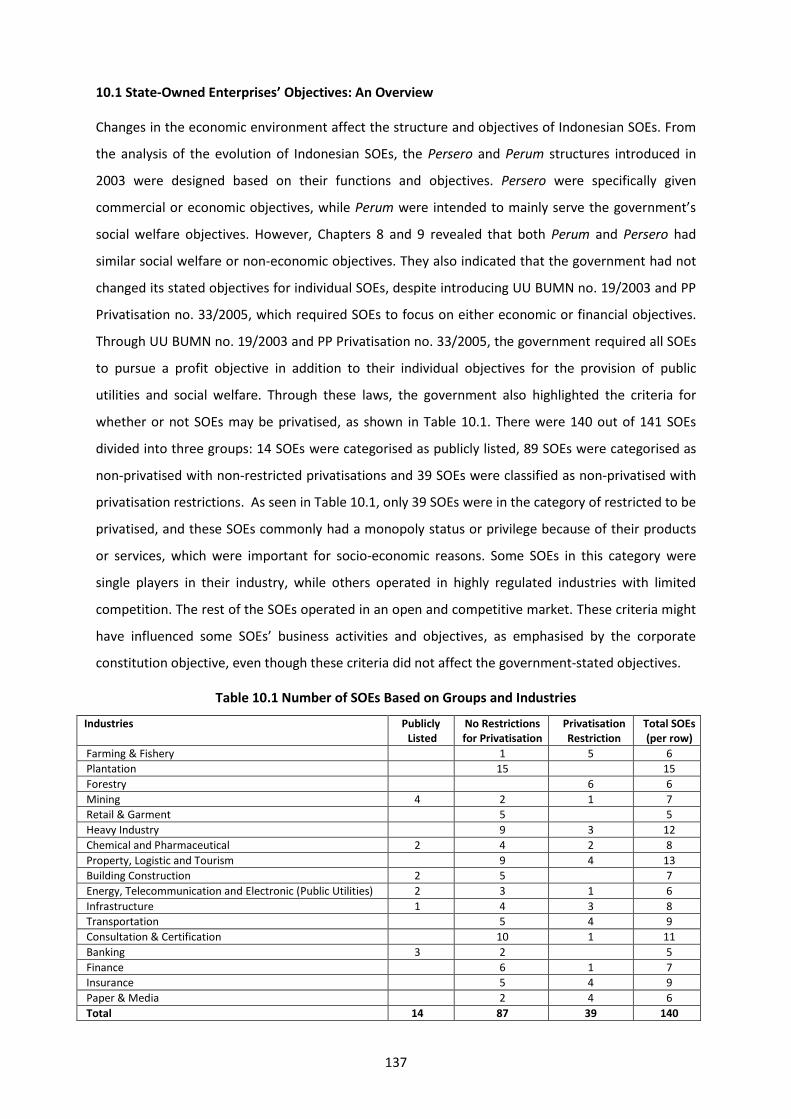
137
10.1 State-Owned Enterprises’ Objectives: An Overview
Changes in the economic environment affect the structure and objectives of Indonesian SOEs. From
the analysis of the evolution of Indonesian SOEs, the Persero and Perum structures introduced in
2003 were designed based on their functions and objectives. Persero were specifically given
commercial or economic objectives, while Perum were intended to mainly serve the government’s
social welfare objectives. However, Chapters 8 and 9 revealed that both Perum and Persero had
similar social welfare or non-economic objectives. They also indicated that the government had not
changed its stated objectives for individual SOEs, despite introducing UU BUMN no. 19/2003 and PP
Privatisation no. 33/2005, which required SOEs to focus on either economic or financial objectives.
Through UU BUMN no. 19/2003 and PP Privatisation no. 33/2005, the government required all SOEs
to pursue a profit objective in addition to their individual objectives for the provision of public
utilities and social welfare. Through these laws, the government also highlighted the criteria for
whether or not SOEs may be privatised, as shown in Table 10.1. There were 140 out of 141 SOEs
divided into three groups: 14 SOEs were categorised as publicly listed, 89 SOEs were categorised as
non-privatised with non-restricted privatisations and 39 SOEs were classified as non-privatised with
privatisation restrictions. As seen in Table 10.1, only 39 SOEs were in the category of restricted to be
privatised, and these SOEs commonly had a monopoly status or privilege because of their products
or services, which were important for socio-economic reasons. Some SOEs in this category were
single players in their industry, while others operated in highly regulated industries with limited
competition. The rest of the SOEs operated in an open and competitive market. These criteria might
have influenced some SOEs’ business activities and objectives, as emphasised by the corporate
constitution objective, even though these criteria did not affect the government-stated objectives.
Table 10.1 Number of SOEs Based on Groups and Industries
Industries Publicly Listed
No Restrictions for Privatisation
Privatisation Restriction
Total SOEs (per row)
Farming & Fishery 1 5 6
Plantation 15 15
Forestry 6 6
Mining 4 2 1 7
Retail & Garment 5 5
Heavy Industry 9 3 12
Chemical and Pharmaceutical 2 4 2 8
Property, Logistic and Tourism 9 4 13
Building Construction 2 5 7
Energy, Telecommunication and Electronic (Public Utilities) 2 3 1 6
Infrastructure 1 4 3 8
Transportation 5 4 9
Consultation & Certification 10 1 11
Banking 3 2 5
Finance 6 1 7
Insurance 5 4 9
Paper & Media 2 4 6
Total 14 87 39 140
138
As discussed in Chapters 8 and 9, the government and SOEs’ objectives started to show a difference,
which resulted from several factors. The first factor was the conflict between the state welfare
orientations and market pressure. The analyses in Chapters 6–9 revealed that the influence of state
welfare orientations was a reason for the government maintaining control of economic policy. This
also made the social welfare of the community the government’s main goal, as it was implemented
through the role of SOEs. In contrast, the government and SOEs also needed to accommodate
changes in the market where the SOEs ran their businesses. The pressure from the market was for
SOEs to run their businesses and compete fairly. This pressure resulted in the emergence of
economic or financial objectives, including profit and efficiency. These interests and pressures were
a driving factor for differences and conflicting objectives, as shown in Chapters 8 and 9.
The second factor was the government’s inconsistency in implementing the policy for the new
economic or financial objectives. The issuance of UU BUMN no. 19/2003 and PP Privatisation no.
33/2005, which underlined the importance of the profit and efficiency objectives, did not make any
difference to the government-stated objectives for individual SOEs. Later, these situations might
conflict with the government’s existing objectives. Table 10.2 presents the economic or financial
objectives and other objectives that were influenced by the market to become part of Indonesian
SOEs’ objectives. Table 10.2 also shows that the profit and efficiency objectives were still very
limited and appeared to be part of the government-stated objectives even for publicly listed SOEs
and those without privatisation restrictions. No publicly listed SOEs had the government-stated
objective for efficiency, while only four publicly listed SOEs had the government-stated objective for
profit. Profit and efficiency were found to be part of the government-stated objectives for only four
non-privatised SOEs without privatisation restrictions. Meanwhile, the other economic or financial
objectives were very limited as part of the government-stated objectives. These findings confirm
that economic or financial objectives were not the government’s main concern for SOEs.
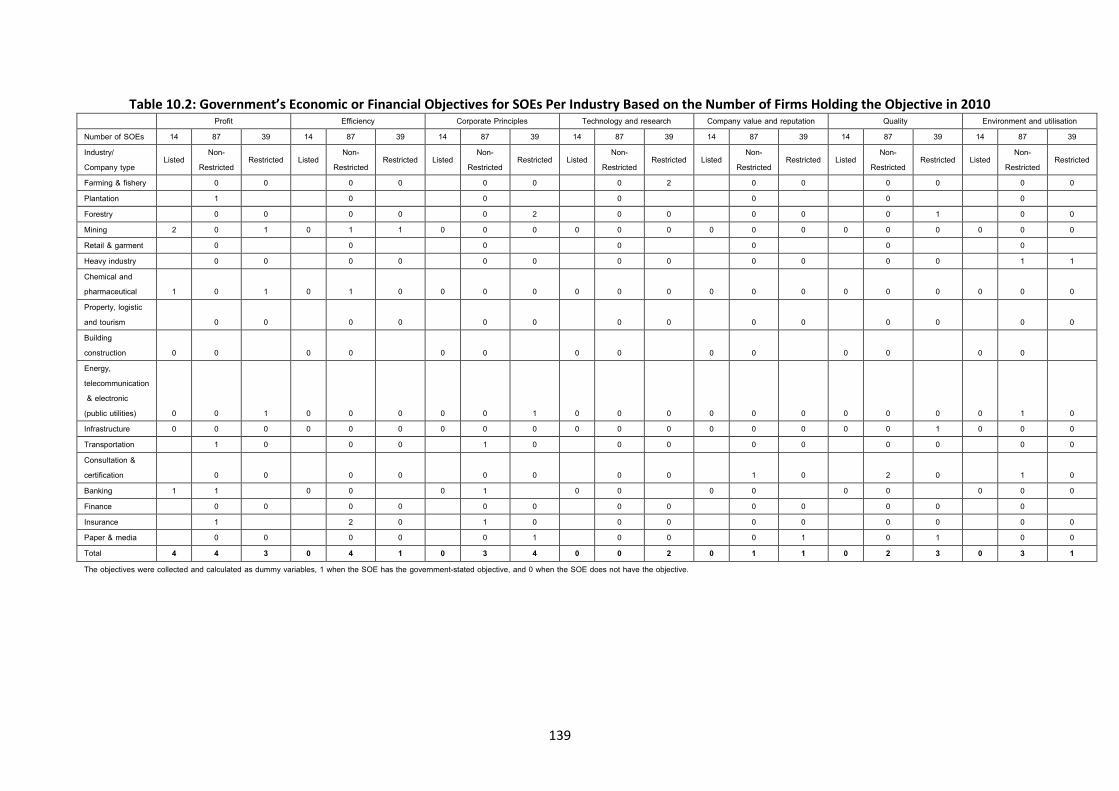
139
Table 10.2: Government’s Economic or Financial Objectives for SOEs Per Industry Based on the Number of Firms Holding the Objective in 2010 Profit Efficiency Corporate Principles Technology and research Company value and reputation Quality Environment and utilisation Number of SOEs 14 87 39 14 87 39 14 87 39 14 87 39 14 87 39 14 87 39 14 87 39 Industry/ Company type
Listed Non-
Restricted Restricted Listed
Non-Restricted
Restricted Listed Non-
Restricted Restricted Listed
Non-Restricted
Restricted Listed Non-
Restricted Restricted Listed
Non-Restricted
Restricted Listed Non-
Restricted Restricted
Farming & fishery 0 0 0 0 0 0 0 2 0 0 0 0 0 0 Plantation 1 0 0 0 0 0 0 Forestry 0 0 0 0 0 2 0 0 0 0 0 1 0 0 Mining 2 0 1 0 1 1 0 0 0 0 0 0 0 0 0 0 0 0 0 0 0 Retail & garment 0 0 0 0 0 0 0 Heavy industry 0 0 0 0 0 0 0 0 0 0 0 0 1 1 Chemical and pharmaceutical 1 0 1 0 1 0 0 0 0 0 0 0 0 0 0 0 0 0 0 0 0 Property, logistic and tourism 0 0 0 0 0 0 0 0 0 0 0 0 0 0 Building construction 0 0 0 0 0 0 0 0 0 0 0 0 0 0 Energy, telecommunication & electronic (public utilities) 0 0 1 0 0 0 0 0 1 0 0 0 0 0 0 0 0 0 0 1 0 Infrastructure 0 0 0 0 0 0 0 0 0 0 0 0 0 0 0 0 0 1 0 0 0 Transportation 1 0 0 0 1 0 0 0 0 0 0 0 0 0 Consultation & certification 0 0 0 0 0 0 0 0 1 0 2 0 1 0 Banking 1 1 0 0 0 1 0 0 0 0 0 0 0 0 0 Finance 0 0 0 0 0 0 0 0 0 0 0 0 0 Insurance 1 2 0 1 0 0 0 0 0 0 0 0 0 Paper & media 0 0 0 0 0 1 0 0 0 1 0 1 0 0 Total 4 4 3 0 4 1 0 3 4 0 0 2 0 1 1 0 2 3 0 3 1 The objectives were collected and calculated as dummy variables, 1 when the SOE has the government-stated objective, and 0 when the SOE does not have the objective.
140
The crucial role of the state in national economic development made the socio-political objectives
more dominant than other objectives. This happened at the time of the establishment of the SOE
model in Indonesia. Several studies of SOEs indicated that SOEs are often used to meet certain
purposes or to facilitate the government’s industrial policies (Levy, 1987; Caporaso, 1982; Dornstein,
1976; Kole and Mulherin, 1997; Nellis and Kikeri, 1989). Given that SOEs are the government’s
vehicle for industrialisation; this is one of the objectives of the government and SOEs. In his study of
public enterprises, Bhatt (1984) noted that the government established the SOE structure and
objectives to allow the state to be involved in national economic policy through SOEs (Bhatt, 1984).
This is also found in Indonesian SOEs. UU BUMN no. 19/2003 provides a ‘space’ for the government
to require SOEs to carry out particular duties (UU BUMN 2003). The analysis presented in Chapter 6
shows that SOEs were also supervised by their regulatory ministries, which also positively affected
the emergence of social-welfare-maximising objectives or the requirement for SOEs to carry out
other objectives (Abeng, 2000, 2001; Mardjana, 1995). This control resulted in some industries
remaining monopolised or experiencing less competition for socio-political reasons.
As shown in Table 10.3, most SOEs still held the government’s original socio-political objectives in
relation to industrialisation and national economic development. The provision of public goods and
services was still the main government-stated objective, as more than 50 per cent of SOEs in each
group had the objective. The requirement to support national economic activities was also one of
the government’s main concerns. The requirement for SOEs to improve or stabilise national
economic activities was shown in this objective, which was found in the majority of publicly listed
SOEs and those without privatisation restrictions. Industrialisation was still the government’s
concern for SOEs in heavy industry, chemical and pharmaceutical, and public utilities. Meanwhile,
Occupational Health and Safety (OHS) was also the more frequent government-stated objective for
SOEs. This can be seen as the SOEs or government’s obligation to provide jobs for the community, as
stated in Article 34 of the 1945 Constitution of Indonesia. These findings show that Indonesian SOEs
still played a role in facilitating the government’s industrial policy and being involved in national
economic activities. SOEs, particularly publicly listed SOEs and those without privatisation
restrictions were still used as the government’s economic vehicles in regards to stabilising national
economic or market activities.
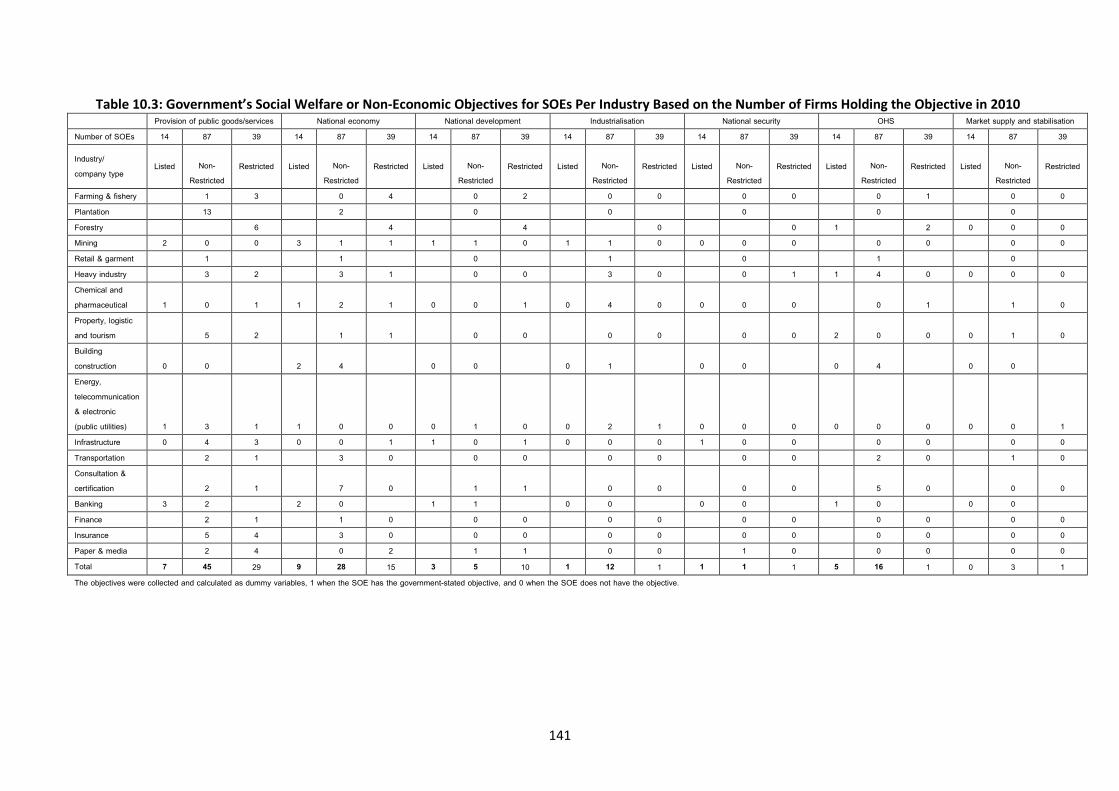
141
Table 10.3: Government’s Social Welfare or Non-Economic Objectives for SOEs Per Industry Based on the Number of Firms Holding the Objective in 2010 Provision of public goods/services National economy National development Industrialisation National security OHS Market supply and stabilisation
Number of SOEs 14 87 39 14 87 39 14 87 39 14 87 39 14 87 39 14 87 39 14 87 39
Industry/ company type
Listed Non- Restricted
Restricted Listed Non- Restricted
Restricted Listed Non- Restricted
Restricted Listed Non- Restricted
Restricted Listed Non- Restricted
Restricted Listed Non-Restricted
Restricted Listed Non-Restricted
Restricted
Farming & fishery 1 3 0 4 0 2 0 0 0 0 0 1 0 0 Plantation 13 2 0 0 0 0 0 Forestry 6 4 4 0 0 1 2 0 0 0 Mining 2 0 0 3 1 1 1 1 0 1 1 0 0 0 0 0 0 0 0 Retail & garment 1 1 0 1 0 1 0 Heavy industry 3 2 3 1 0 0 3 0 0 1 1 4 0 0 0 0 Chemical and pharmaceutical 1 0 1 1 2 1 0 0 1 0 4 0 0 0 0 0 1 1 0 Property, logistic and tourism 5 2 1 1 0 0 0 0 0 0 2 0 0 0 1 0 Building construction 0 0 2 4 0 0 0 1 0 0 0 4 0 0 Energy, telecommunication & electronic (public utilities) 1 3 1 1 0 0 0 1 0 0 2 1 0 0 0 0 0 0 0 0 1 Infrastructure 0 4 3 0 0 1 1 0 1 0 0 0 1 0 0 0 0 0 0 Transportation 2 1 3 0 0 0 0 0 0 0 2 0 1 0 Consultation & certification 2 1 7 0 1 1 0 0 0 0 5 0 0 0 Banking 3 2 2 0 1 1 0 0 0 0 1 0 0 0 Finance 2 1 1 0 0 0 0 0 0 0 0 0 0 0 Insurance 5 4 3 0 0 0 0 0 0 0 0 0 0 0 Paper & media 2 4 0 2 1 1 0 0 1 0 0 0 0 0 Total 7 45 29 9 28 15 3 5 10 1 12 1 1 1 1 5 16 1 0 3 1 The objectives were collected and calculated as dummy variables, 1 when the SOE has the government-stated objective, and 0 when the SOE does not have the objective.
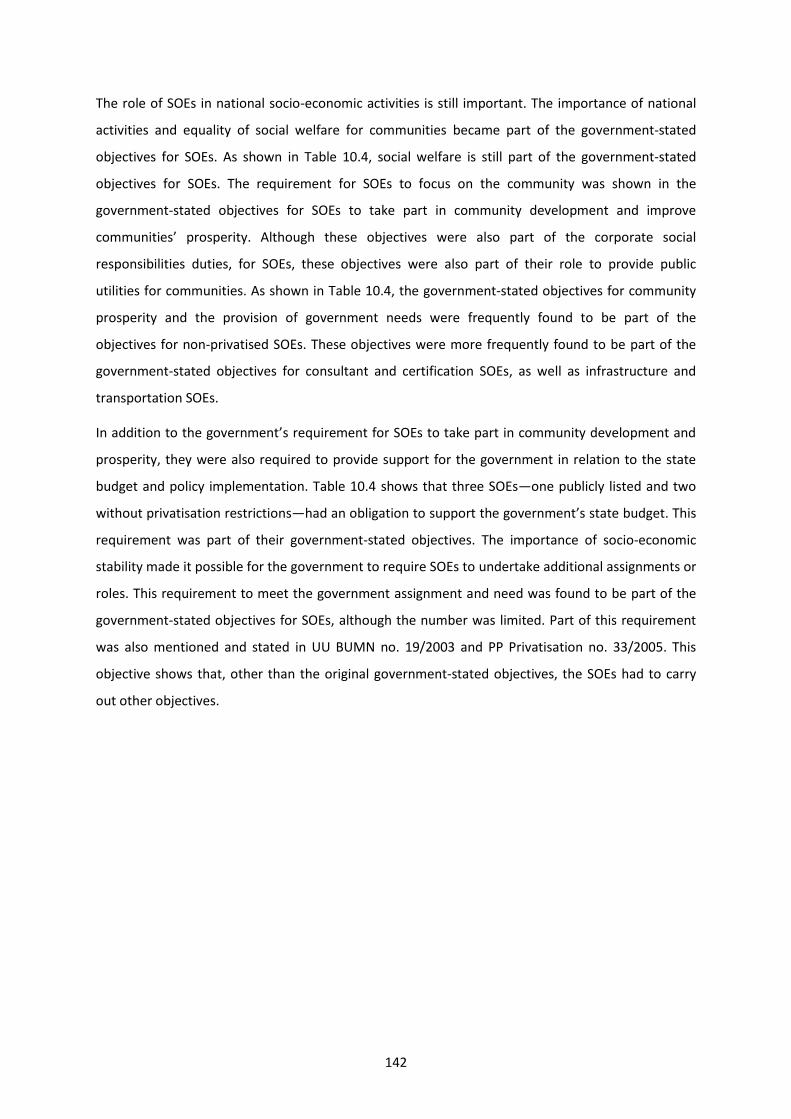
142
The role of SOEs in national socio-economic activities is still important. The importance of national
activities and equality of social welfare for communities became part of the government-stated
objectives for SOEs. As shown in Table 10.4, social welfare is still part of the government-stated
objectives for SOEs. The requirement for SOEs to focus on the community was shown in the
government-stated objectives for SOEs to take part in community development and improve
communities’ prosperity. Although these objectives were also part of the corporate social
responsibilities duties, for SOEs, these objectives were also part of their role to provide public
utilities for communities. As shown in Table 10.4, the government-stated objectives for community
prosperity and the provision of government needs were frequently found to be part of the
objectives for non-privatised SOEs. These objectives were more frequently found to be part of the
government-stated objectives for consultant and certification SOEs, as well as infrastructure and
transportation SOEs.
In addition to the government’s requirement for SOEs to take part in community development and
prosperity, they were also required to provide support for the government in relation to the state
budget and policy implementation. Table 10.4 shows that three SOEs—one publicly listed and two
without privatisation restrictions—had an obligation to support the government’s state budget. This
requirement was part of their government-stated objectives. The importance of socio-economic
stability made it possible for the government to require SOEs to undertake additional assignments or
roles. This requirement to meet the government assignment and need was found to be part of the
government-stated objectives for SOEs, although the number was limited. Part of this requirement
was also mentioned and stated in UU BUMN no. 19/2003 and PP Privatisation no. 33/2005. This
objective shows that, other than the original government-stated objectives, the SOEs had to carry
out other objectives.
143
Table 10.4: Government’s Social Welfare or Non-Economic Objectives for SOEs Per Industry Based on the Number of Firms Holding the Objective in 2010 Community development Community prosperity Community needs Government policy Government needs/interest State budget
Number of SOEs 14 87 39 14 87 39 14 87 39 14 87 39 14 87 39 14 87 39
Industries/ company type
Listed Non-Restricted
Restricted Listed Non-Restricted
Restricted Listed Non-Restricted
Restricted Listed Non-Restricted
Restricted Listed Non-Restricted
Restricted Listed Non-Restricted
Restricted
Farming & fishery 1 1 0 1 0 1 0 1 0 1 1 0 Plantation 0 1 0 0 1 2 Forestry 0 2 1 0 0 0 Mining 0 0 1 1 0 1 1 0 0 0 1 0 0 0 0 2 0 0 Retail & garment 0 1 1 1 0 0 Heavy industry 1 0 1 0 2 0 1 0 0 0 0 0 Chemical and pharmaceutical 0 1 0 1 1 0 1 1 2 0 0 0 0 0 0 0 0 0 Property, logistic and tourism 0 0 0 0 0 1 0 1 0 0 0 0 Building construction 0 0 2 3 2 2 0 0 0 0 0 0 Energy, telecommunication and electronic (public utilities) 0 0 0 1 0 1 1 1 1 0 1 0 0 0 0 0 0 0 Infrastructure 0 0 0 1 0 0 0 0 0 0 0 0 0 0 0 0 0 0 Transportation 0 0 3 1 3 1 0 0 1 0 0 0 Consultation & certification 0 0 7 0 7 0 0 0 1 0 0 0 Banking 0 0 0 0 0 0 0 0 0 0 0 0 Finance 0 0 0 1 1 1 1 0 1 0 0 0 Insurance 1 0 0 0 2 2 0 0 0 0 0 0 Paper & media 0 0 1 0 1 1 0 0 0 0 0 0 Total 0 4 2 6 18 7 5 21 11 0 5 2 0 4 1 2 3 0 The objectives were collected and calculated as dummy variables, 1 when the SOE has the government-stated objective, and 0 when the SOE does not have the objective.
144
As discussed in Chapters 8 and 9, during this period of study, the government and SOEs made some
changes to their objectives. Although the numbers were limited, the government also made changes
to its stated objectives for SOEs. Table 10.5 shows that the changes in government-stated objectives
occurred for non-privatised SOEs, both with and without privatisation restrictions. The changes were
found more frequently in relation to socio-political or non-economic objectives. Only one SOE—PT
Pertamina—experienced the introduction of the government-stated objective for profit. Table 10.5
shows that the government had a tendency to introduce new social welfare or non-economic
objectives for these SOEs. Compared to the government-stated objectives, changes in SOEs’
objectives occurred more frequently. These changes were made as companies replaced or removed
objectives, particularly their social welfare or non-economic objectives. Some social welfare or non-
economic objectives were replaced by economic or financial objectives during the period of this
study. Sixteen SOEs experienced the introduction of new economic or financial objectives, while
eight of those SOEs removed their economic or financial objectives. To provide detailed analysis,
some SOEs’ objectives were separated into the company’s constitution statement and management
statement objectives, as shown in the company’s vision and mission. Focusing exclusively on the
management sphere, Table 10.5 shows that management was likely to introduce new economic or
financial objectives, and also often remove social welfare or non-economic objectives.
The market economy had an influence in determining SOEs’ objectives, as shown by the number of
changes made by the government, the SOEs and their management. SOEs that encountered market
competition, such as publicly listed SOEs and those without privatisation restrictions, frequently
made changes to their economic or financial objectives. Meanwhile, SOEs with privatisation
restrictions often modified their social welfare or non-economic objectives. Removing social welfare
or non-economic objectives and introducing new economic or financial objectives occurred more
often than the introduction of social welfare or non-economic objectives or the removal of economic
or financial objectives. Non-privatised SOEs with privatisation restrictions frequently changed their
corporate constitution objectives, while changes to management objectives occurred more often in
publicly listed SOEs and non-privatised SOEs without privatisation restrictions. Fifty-seven SOEs
experienced changes to their objectives. The government made 13 changes in 10 SOEs. There were
63 changes to companies’ constitution statement objectives, while the management statement
objectives made 109 changes during this period of study.
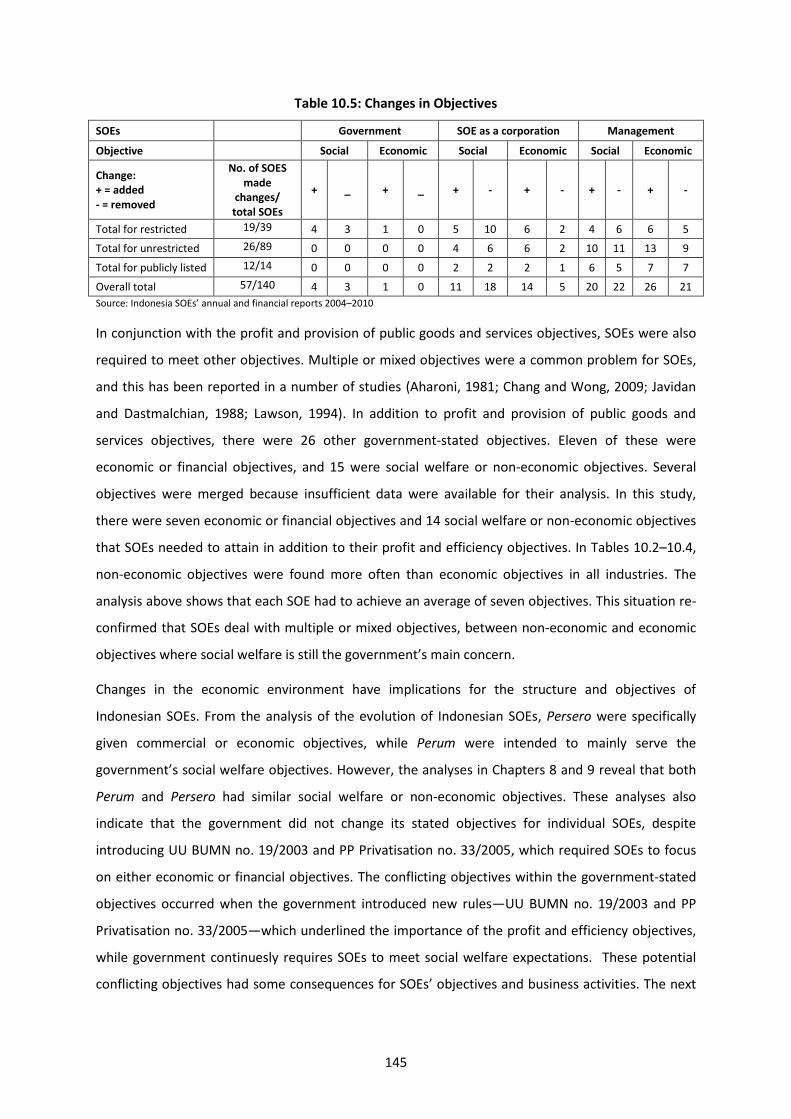
145
Table 10.5: Changes in Objectives
SOEs Government SOE as a corporation Management
Objective Social Economic Social Economic Social Economic
Change: + = added - = removed
No. of SOES made
changes/ total SOEs
+ _ + _ + - + - + - + -
Total for restricted 19/39 4 3 1 0 5 10 6 2 4 6 6 5
Total for unrestricted 26/89 0 0 0 0 4 6 6 2 10 11 13 9
Total for publicly listed 12/14 0 0 0 0 2 2 2 1 6 5 7 7
Overall total 57/140 4 3 1 0 11 18 14 5 20 22 26 21
Source: Indonesia SOEs’ annual and financial reports 2004–2010
In conjunction with the profit and provision of public goods and services objectives, SOEs were also
required to meet other objectives. Multiple or mixed objectives were a common problem for SOEs,
and this has been reported in a number of studies (Aharoni, 1981; Chang and Wong, 2009; Javidan
and Dastmalchian, 1988; Lawson, 1994). In addition to profit and provision of public goods and
services objectives, there were 26 other government-stated objectives. Eleven of these were
economic or financial objectives, and 15 were social welfare or non-economic objectives. Several
objectives were merged because insufficient data were available for their analysis. In this study,
there were seven economic or financial objectives and 14 social welfare or non-economic objectives
that SOEs needed to attain in addition to their profit and efficiency objectives. In Tables 10.2–10.4,
non-economic objectives were found more often than economic objectives in all industries. The
analysis above shows that each SOE had to achieve an average of seven objectives. This situation re-
confirmed that SOEs deal with multiple or mixed objectives, between non-economic and economic
objectives where social welfare is still the government’s main concern.
Changes in the economic environment have implications for the structure and objectives of
Indonesian SOEs. From the analysis of the evolution of Indonesian SOEs, Persero were specifically
given commercial or economic objectives, while Perum were intended to mainly serve the
government’s social welfare objectives. However, the analyses in Chapters 8 and 9 reveal that both
Perum and Persero had similar social welfare or non-economic objectives. These analyses also
indicate that the government did not change its stated objectives for individual SOEs, despite
introducing UU BUMN no. 19/2003 and PP Privatisation no. 33/2005, which required SOEs to focus
on either economic or financial objectives. The conflicting objectives within the government-stated
objectives occurred when the government introduced new rules—UU BUMN no. 19/2003 and PP
Privatisation no. 33/2005—which underlined the importance of the profit and efficiency objectives,
while government continuesly requires SOEs to meet social welfare expectations. These potential
conflicting objectives had some consequences for SOEs’ objectives and business activities. The next
146
section details the effects of these potential conflicting objectives and the government’s existing
objectives on SOEs’ financial performance.
10.2 Relations between SOEs’ Measurable Performance and Objectives
The picture of Indonesian SOEs thus far shows that social welfare objectives remained the
government’s main concern. At the same time, UU BUMN no. 19/2003 and PP Privatisation no.
33/2005 required SOEs to be profitable and efficient. This section examines the relations between
the government-stated objectives for SOEs and SOEs’ performance using the available financial
performance measure. This section is divided into two sub-sections. Section 10.2.1 presents the
available financial performance measure. Section 10.2.2 compares the mean financial performance
of three types of SOEs.
10.2.1 Available Performance Measure
Some financial performance measurements were employed to measure the relations between the
government-stated objectives and SOEs’ performance. Sixteen financial performance measurements
were each used as dependent variables. As the focus of the measurement was performance, several
financial performances were applied, particularly to examine whether the company was successful
in attaining the objectives as reflected in their measureable performance. Several additional
performance indicators were applied that were considered to present or reflect the social-welfare-
maximising objectives. The common performance measurements determined the efficiency (Reeves
and Ryan, 1998; Zhonghua and Ye, 2012). Therefore, the Indonesian government emphasised the
importance of all SOEs being efficient. Several profit and efficiency ratios were employed to measure
the reflection of these objectives:
- Return On Assets (ROA), measured by Earnings Before Interest and Tax (EBIT) divided by
total assets
- Return On Equity (ROE), measured by an emphasise on the equity impact as Earning After
Tax (EAT) divided by average equity (0.5 x (Equity t + Equity t-1))
- Operating profit return, measured by operating income divided by total assets
- Operating profit margin, measured by operating income divided by total sales
- EBIT margin, measured by EBIT divided by total sales
- Asset turnover, measured by total sales divided by total assets.
In addition to these profit and efficiency ratios, several financial performance measurements were
included as part of the measurement:
147
- Market value of equity was measured by multiplying the stock price with the shares (Berk
and DeMarzo, 2009; Brealey and Myers, 1991). It was only applied for publicly listed SOEs.
For non-privatised SOEs, the book value of equity was employed, which was measured by
total assets minus total debt and other liabilities’ shares (Berk and DeMarzo, 2009; Brealey
and Myers, 1991).
- Net income was considered the company’s profitability during the period of business.
- Operating income was the company’s income from its core business or operation during the
period of business (Berk and DeMarzo, 2009). It was also the company’s gross profit, which
was calculated from total revenue or sales after the deduction of operating expenses.
For banking, finance and insurance SOEs, the operating margin and ROA data were provided to
complement the analysis rather than interpret or compare them to other sectors. This is because of
the differences in operating expenses and asset structures. These financial performance
measurements were employed to estimate the relationship between the government-stated
objectives and SOEs’ financial performance.
As government entities, SOEs had an obligation to provide social welfare and public utilities. The
provision of public goods and services was found to be the most dominant objective for the
government and SOEs. The analysis in Section 10.1 shows that other social welfare and non-
economic objectives were frequently found within the government-stated objectives for SOEs. For
example, SOEs were commonly required to contribute to national economic factors such as
employment or GDP (Reeves and Ryan, 1998). Therefore, the performance measurement for SOEs
also had to consider their non-economic or social welfare objectives (Zhonghua and Ye, 2012). In
addition to these social welfare and non-economic objectives, Indonesian SOEs were required to
support the community through Program Kemitraan and Bina Lingkungan (PKBL/community
development through cooperative and environmental programmes). This was a reason to add
Corporate Social Responsibility (CSR) funds to this category. The non-economic or social-welfare-
maximising representative financial performance included:
- Effective corporate tax rate, measured based on the tax paid divided book income before
interest and tax (Gupta and Newberry, 1997). For this study, two different measurements—
tax divided by EBIT and tax divided by Earnings Before Tax (EBT)—were applied to obtain
detailed results on whether the company’s liabilities affected performance.
- Dividend payout ratio was measured based on the company’s dividend paid divided by
earnings (Berk and DeMarzo, 2009; Chay and Suh, 2009). For this study, two different

148
measurements—dividend paid divided by EBIT and dividend paid divided by EBT—were
applied to obtain detailed results on whether the company’s liabilities affected performance.
- Employment intensity was measured by the natural log of employees divided by sales.
- Labour cost was considered the company’s expenses for employment.
- CSR funds were part of the government’s requirement to provide support for community
development.
As part of the analysis, the model included five control variables: leverage, size (ln asset), company
type (publicly listed or non-privatised), year, and SOE industry. There was a large range in the size of
SOEs; therefore, natural log assets and leverage were applied to control this large range. As
mentioned in Section 5.2, some industries were combined because of some small numbers.
10.2.2 Compare Mean Performance of Three Types of SOEs
This section provides an overview of current Indonesian SOEs’ performance based on their mean
available financial performance. Table 10.6 shows the general mean financial performance of
Indonesian SOEs during 2004–2010. Based on this table, the current average performance of
Indonesian SOEs is poor and inefficient. The table shows that less than 10 per cent of the mean
financial performance of Indonesian SOEs showed a negative income and earnings performance. The
ROA mean in general was less than 5 per cent, while less than 10 per cent of SOEs showed a negative
ROA performance. A similar picture is presented in the mean ROE performance. ROE data showed a
relatively small performance, with less than 10 per cent for the groups’ average. This indicates the
inefficiency of Indonesian SOEs, where the capability for SOEs to use their available capital can only
generate less than 10 per cent of earnings. This inefficiency is supported by the fact that more than
10 per cent of Indonesian SOEs had negative equity during this period of study. This poor
performance could affect their ability to contribute to the state budget and community, as shown in
their tax, dividend and CSR performance. The mean of effective tax and dividend rates were
negatives, in particular when the interest was excluded from the measurement. This situation
indicated that SOEs still contributed to state budget, although they suffered from losses. This
occurred as SOEs got external supported to meet this expectation. As the number of employees is
quite high, their productivity, as shown in their mean employment intensity, was small. On average,
the employment intensity of Indonesian SOEs was less than 3 per cent.
Focusing specifically on individual indicators, the mean performance of Indonesian SOEs shows they
rely on non-core business as their major income. The reliance was explained through their mean
operating income as their gross profit after operating expenses, which was very small (Rp. 733.68
149
billion compared to their revenue or sales of Rp. 5,968.82 billion). This high reliance on non-core
business income was also supported by the operating profit margin and operating profit return. The
average operating profit margin was less than 0.02. This means that only 2 per cent of Indonesian
SOEs’ income actually comes from their core business. A similar picture was shown in their operating
profit returns, which were less than 0.05. This means that less than 5 per cent of their assets were
used to generate income from their core business.
The table also shows that Indonesian SOEs heavily relied on external financial support. Referring to
Table 10.6, the mean of Indonesian SOEs’ assets came from liabilities, such as soft loans or
government short-term borrowing, as discussed in Chapter 8. This liability performance was around
70 per cent of SOEs’ assets. This high reliance on external financial support was supported by SOEs’
mean EBIT and EBT performances, as well as their relations with the mean of net income. The mean
of net income was less than half of their mean EBIT and EBT, which indicated high interest paid
during this period of study. This situation supported the fact that Indonesian SOEs were likely to rely
on short-term borrowing, as shown in high liability performance, which might affect the high interest
paid. Focusing on their mean of equity, more than 10 per cent of SOEs showed negative equity.
Table 10.6 also shows a large gap in equity performance among the SOEs, as shown in the gap
between the maximum and minimum size of equity. Referring to these findings based in Table 10.6,
Indonesian SOEs are less likely to be able to make a profit from their revenues because of high
interest paid and reliance on non-core business income.
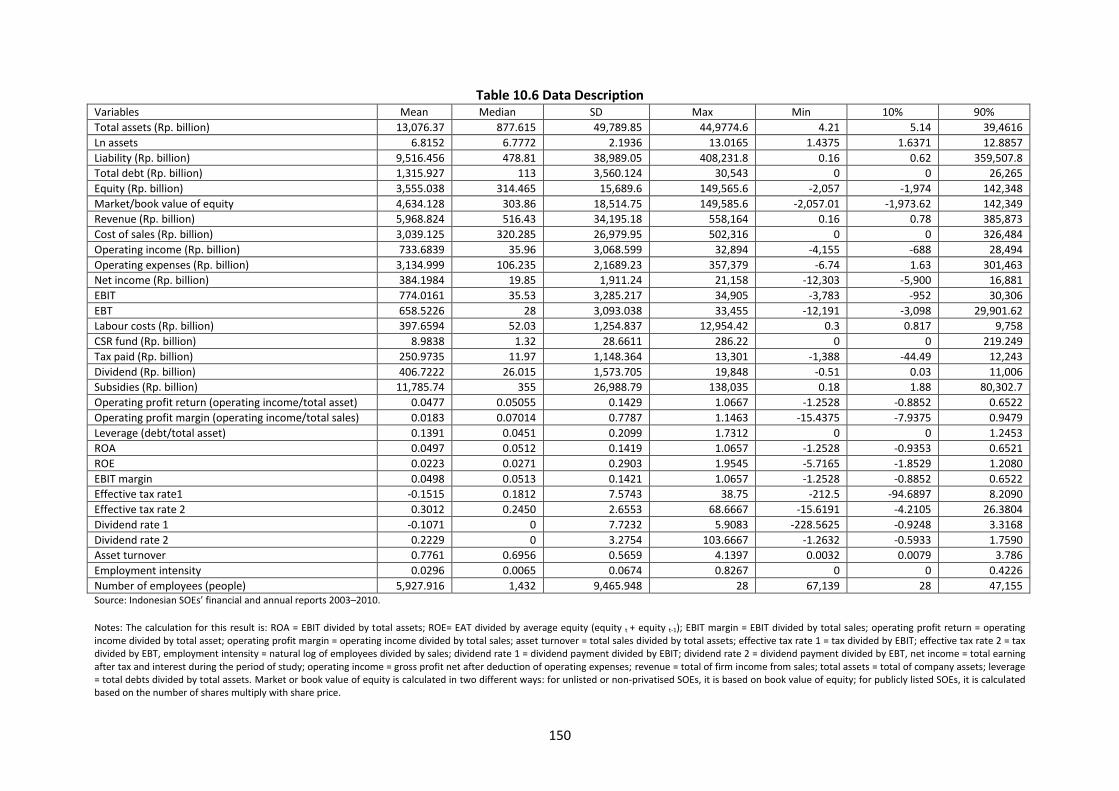
150
Table 10.6 Data Description Variables Mean Median SD Max Min 10% 90%
Total assets (Rp. billion) 13,076.37 877.615 49,789.85 44,9774.6 4.21 5.14 39,4616
Ln assets 6.8152 6.7772 2.1936 13.0165 1.4375 1.6371 12.8857
Liability (Rp. billion) 9,516.456 478.81 38,989.05 408,231.8 0.16 0.62 359,507.8
Total debt (Rp. billion) 1,315.927 113 3,560.124 30,543 0 0 26,265
Equity (Rp. billion) 3,555.038 314.465 15,689.6 149,565.6 -2,057 -1,974 142,348
Market/book value of equity 4,634.128 303.86 18,514.75 149,585.6 -2,057.01 -1,973.62 142,349
Revenue (Rp. billion) 5,968.824 516.43 34,195.18 558,164 0.16 0.78 385,873
Cost of sales (Rp. billion) 3,039.125 320.285 26,979.95 502,316 0 0 326,484
Operating income (Rp. billion) 733.6839 35.96 3,068.599 32,894 -4,155 -688 28,494
Operating expenses (Rp. billion) 3,134.999 106.235 2,1689.23 357,379 -6.74 1.63 301,463
Net income (Rp. billion) 384.1984 19.85 1,911.24 21,158 -12,303 -5,900 16,881
EBIT 774.0161 35.53 3,285.217 34,905 -3,783 -952 30,306
EBT 658.5226 28 3,093.038 33,455 -12,191 -3,098 29,901.62
Labour costs (Rp. billion) 397.6594 52.03 1,254.837 12,954.42 0.3 0.817 9,758
CSR fund (Rp. billion) 8.9838 1.32 28.6611 286.22 0 0 219.249
Tax paid (Rp. billion) 250.9735 11.97 1,148.364 13,301 -1,388 -44.49 12,243
Dividend (Rp. billion) 406.7222 26.015 1,573.705 19,848 -0.51 0.03 11,006
Subsidies (Rp. billion) 11,785.74 355 26,988.79 138,035 0.18 1.88 80,302.7
Operating profit return (operating income/total asset) 0.0477 0.05055 0.1429 1.0667 -1.2528 -0.8852 0.6522
Operating profit margin (operating income/total sales) 0.0183 0.07014 0.7787 1.1463 -15.4375 -7.9375 0.9479
Leverage (debt/total asset) 0.1391 0.0451 0.2099 1.7312 0 0 1.2453
ROA 0.0497 0.0512 0.1419 1.0657 -1.2528 -0.9353 0.6521
ROE 0.0223 0.0271 0.2903 1.9545 -5.7165 -1.8529 1.2080
EBIT margin 0.0498 0.0513 0.1421 1.0657 -1.2528 -0.8852 0.6522
Effective tax rate1 -0.1515 0.1812 7.5743 38.75 -212.5 -94.6897 8.2090
Effective tax rate 2 0.3012 0.2450 2.6553 68.6667 -15.6191 -4.2105 26.3804
Dividend rate 1 -0.1071 0 7.7232 5.9083 -228.5625 -0.9248 3.3168
Dividend rate 2 0.2229 0 3.2754 103.6667 -1.2632 -0.5933 1.7590
Asset turnover 0.7761 0.6956 0.5659 4.1397 0.0032 0.0079 3.786
Employment intensity 0.0296 0.0065 0.0674 0.8267 0 0 0.4226
Number of employees (people) 5,927.916 1,432 9,465.948 28 67,139 28 47,155 Source: Indonesian SOEs’ financial and annual reports 2003–2010.
Notes: The calculation for this result is: ROA = EBIT divided by total assets; ROE= EAT divided by average equity (equity t + equity t-1); EBIT margin = EBIT divided by total sales; operating profit return = operating income divided by total asset; operating profit margin = operating income divided by total sales; asset turnover = total sales divided by total assets; effective tax rate 1 = tax divided by EBIT; effective tax rate 2 = tax divided by EBT, employment intensity = natural log of employees divided by sales; dividend rate 1 = dividend payment divided by EBIT; dividend rate 2 = dividend payment divided by EBT, net income = total earning after tax and interest during the period of study; operating income = gross profit net after deduction of operating expenses; revenue = total of firm income from sales; total assets = total of company assets; leverage = total debts divided by total assets. Market or book value of equity is calculated in two different ways: for unlisted or non-privatised SOEs, it is based on book value of equity; for publicly listed SOEs, it is calculated based on the number of shares multiply with share price.
151
Table 10.7 shows the mean performance of Indonesian SOEs based on their type of group. The table
shows that, on average, publicly listed SOEs had the largest assets, while non-privatised SOEs with
privatisation restrictions had the largest revenue or sales. Publicly listed SOEs were the most
profitable group, as shown in their mean of net income, ROA and earnings performance—EBIT and
EBT. In the context of efficiency, publicly listed SOEs also had the most efficient performance
compared to other groups, as shown in their mean of ROE, operating profit margin and return
performance. In contrast, non-privatised SOEs with privatisation restrictions had the worst
performance for efficiency. The poor performance of non-privatised SOEs with privatisation
restrictions made it difficult for them to contribute to the state budget and community. This is
shown in their mean effective tax rates and dividend rates in Table 10.7. Non-privatised SOEs with
privatisation restrictions had a negative performance particularly when interest was included in the
measure. This shows that external funds and interest paid became an issue for SOEs and affected
their financial performance. While non-privatised SOEs with privatisation restrictions had a negative
mean effective tax and dividend performance, they made a better contribution to the community
than non-privatised SOEs without privatisation restrictions, as shown in their mean CSR fund
performance.
Focusing specifically on individual performance indicators in Table 10.7, it is shown that publicly
listed SOEs and non-privatised SOEs with privatisation restrictions highly relied on external funds, as
shown in their mean debt and liability performance. The groups’ mean liabilities showed that more
than half of SOEs’ operating funds came from external financial support such as subsidies or loans.
High reliance on short-term financial support resulted in high interest rates, which affected SOEs’
financial performance, as shown in their mean EBIT and EBT performance. Besides external financial
support, Table 10.7 also shows SOEs’ reliance on non-core business income. All groups present a
reliance on non-core business income, as shown in their mean operating income performance.
Publicly listed SOEs earned the highest operating income among the groups. Compared to their
mean revenue, most SOEs could earn less than one-third of their income from operating income or
core business activities. This is supported by their mean operating profit margin performance.
Publicly listed SOEs showed that around 24 per cent of their operating income came from their core
business, while non-privatised SOEs without privatisation restrictions earned only around 7 per cent
of their mean operating income from their core business activities. Although non-privatised SOEs
with privatisation restrictions had a mean operating income of Rp. 1,015.62 billion, the mean
operating profit margin performance showed a negative performance. This occurred because some
SOEs had a negative operating income, which affected their performance. This negative result is
explained in detail in the industrial performances analysis in Tables 10.8 and 10.9.

152
SOEs’ poor performance significantly affected their ability to achieve their social welfare objectives.
Table 10.7 shows that publicly listed SOEs made the largest contribution to the state budget through
tax paid and dividends, with the average of their effective tax rates around 0.3–0.6. Lower-income
performance, as shown in the mean net income and operating income, made it difficult for non-
privatised SOEs with privatisation restrictions to contribute to dividends and CSR funds. Although the
table shows that SOEs had better performance for CSR funds, their dividend rate was very small and
tended to be negative. This negative performance was particularly shown when SOEs had an
obligation to pay interest. Their average of dividend rates, for example, was around -0.7 to 0.09.
Negative dividend rate was presented when interest was included as part of measurement. Despite
of their financial losses, high reliance on external fund made the SOEs able to distribute dividend.
The other social welfare representative financial performance was related to employment, as SOEs
were often required to meet the employment objective. Table 10.7 shows that publicly listed SOEs
had the largest number of employees. Consequently, their mean labour costs were higher than
other groups of SOEs. The high numbers of employees has consequences on their productivity, as
shown in the mean employment intensity. This figure shows that most Indonesian SOEs were labour-
intensive, which is part of the government’s objectives for SOEs to resolve employment issues.
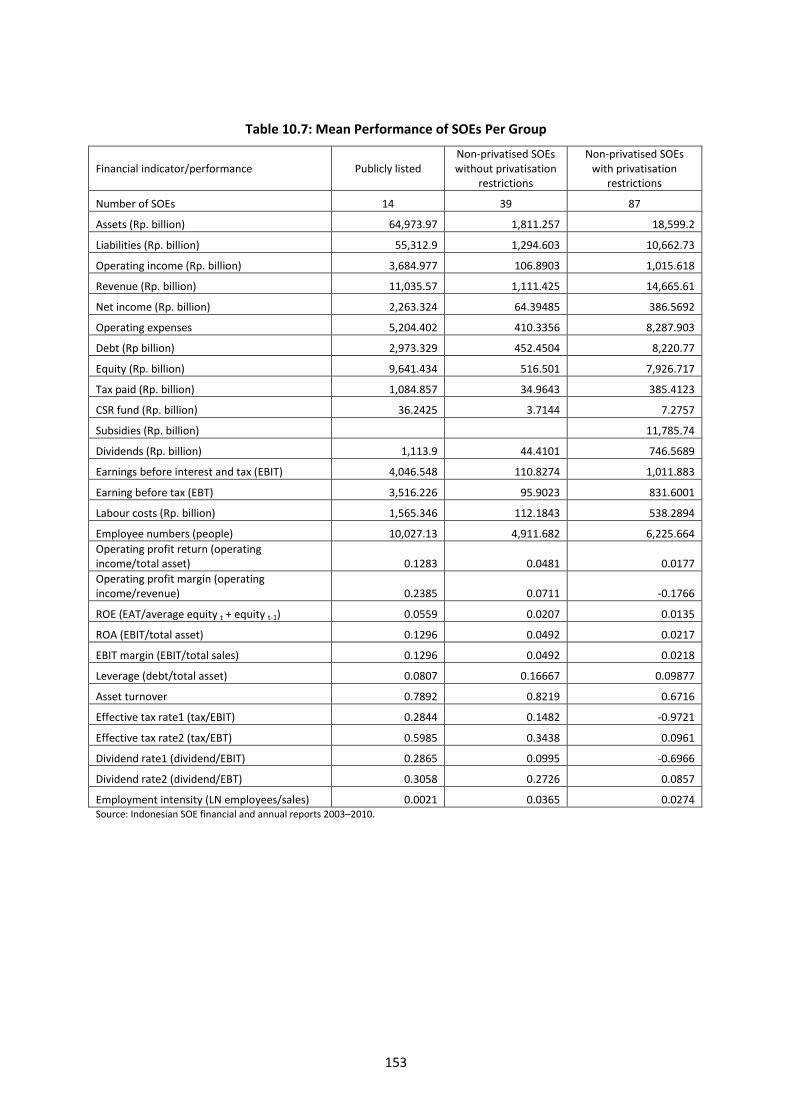
153
Table 10.7: Mean Performance of SOEs Per Group
Financial indicator/performance Publicly listed Non-privatised SOEs without privatisation
restrictions
Non-privatised SOEs with privatisation
restrictions
Number of SOEs 14 39 87
Assets (Rp. billion) 64,973.97 1,811.257 18,599.2
Liabilities (Rp. billion) 55,312.9 1,294.603 10,662.73
Operating income (Rp. billion) 3,684.977 106.8903 1,015.618
Revenue (Rp. billion) 11,035.57 1,111.425 14,665.61
Net income (Rp. billion) 2,263.324 64.39485 386.5692
Operating expenses 5,204.402 410.3356 8,287.903
Debt (Rp billion) 2,973.329 452.4504 8,220.77
Equity (Rp. billion) 9,641.434 516.501 7,926.717
Tax paid (Rp. billion) 1,084.857 34.9643 385.4123
CSR fund (Rp. billion) 36.2425 3.7144 7.2757
Subsidies (Rp. billion) 11,785.74
Dividends (Rp. billion) 1,113.9 44.4101 746.5689
Earnings before interest and tax (EBIT) 4,046.548 110.8274 1,011.883
Earning before tax (EBT) 3,516.226 95.9023 831.6001
Labour costs (Rp. billion) 1,565.346 112.1843 538.2894
Employee numbers (people) 10,027.13 4,911.682 6,225.664
Operating profit return (operating income/total asset) 0.1283 0.0481 0.0177
Operating profit margin (operating income/revenue) 0.2385 0.0711 -0.1766
ROE (EAT/average equity t + equity t-1) 0.0559 0.0207 0.0135
ROA (EBIT/total asset) 0.1296 0.0492 0.0217
EBIT margin (EBIT/total sales) 0.1296 0.0492 0.0218
Leverage (debt/total asset) 0.0807 0.16667 0.09877
Asset turnover 0.7892 0.8219 0.6716
Effective tax rate1 (tax/EBIT) 0.2844 0.1482 -0.9721
Effective tax rate2 (tax/EBT) 0.5985 0.3438 0.0961
Dividend rate1 (dividend/EBIT) 0.2865 0.0995 -0.6966
Dividend rate2 (dividend/EBT) 0.3058 0.2726 0.0857
Employment intensity (LN employees/sales) 0.0021 0.0365 0.0274 Source: Indonesian SOE financial and annual reports 2003–2010.

154
Table 10.8 presents the detailed mean performance of SOEs based on their groups and industries.
Publicly listed SOEs in public utilities presented the highest mean operating income among SOEs.
Meanwhile, non-privatised SOEs with privatisation restrictions in mining showed the highest mean
net income among SOEs. The number of SOEs in non-privatised SOEs without privatisation
restrictions had a negative income performance in both operating income and net income. Non-
privatised SOEs without privatisation restrictions in transportation had the lowest mean operating
income performance, while chemical and pharmaceutical non-privatised SOEs without privatisation
restrictions had the smallest mean net income performance. Farming and fishery non-privatised
SOEs without privatisation restrictions had the lowest mean operating profit margin of -0.44, while
their operating profit return was -0.23. The largest mean operating profit margin and return
performance were publicly listed SOEs in infrastructure and mining. Publicly listed SOEs in
infrastructure had a 0.41 mean operating profit margin, while publicly listed SOEs in mining had a
0.23 mean operating profit margin. This operating profit performance supports the description and
previous analysis that Indonesian SOEs’ income came from non-core business activities.
Focusing exclusively on their leverage and debt performance, this result supports previous study
regarding SOEs’ high reliance on government support. High reliance on external funds was shown in
their leverage and debt performance. Farming and fishery non-privatised SOEs without privatisation
restrictions had the highest mean leverage performance of 0.67. This performance indicated that
SOEs had to finance their operation by relying on external funds to keep operating. This high reliance
on external funds was also shown in their negative mean equity performance. Consequently, the
SOEs found it difficult to be profitable or efficient. This poor performance was shown through their
negative mean ROE, operating profit margin and ROA performance. In the context of efficiency,
mining non-privatised SOEs without privatisation restrictions had the lowest ROE performance of -
0.43. Farming and fishery non-privatised SOEs without privatisation restrictions had a negative EBIT
margin of -0.22.
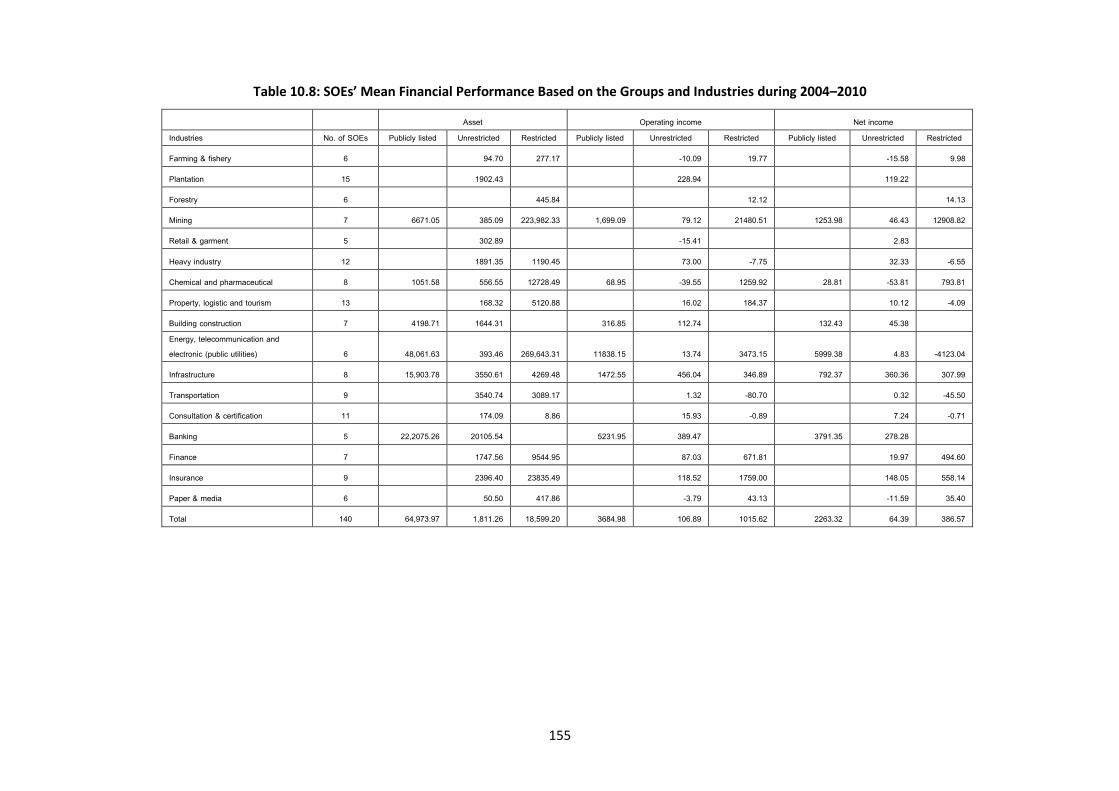
155
Table 10.8: SOEs’ Mean Financial Performance Based on the Groups and Industries during 2004–2010
Asset Operating income Net income
Industries No. of SOEs Publicly listed Unrestricted Restricted Publicly listed Unrestricted Restricted Publicly listed Unrestricted Restricted
Farming & fishery 6 94.70 277.17 -10.09 19.77 -15.58 9.98
Plantation 15 1902.43 228.94 119.22
Forestry 6 445.84 12.12 14.13
Mining 7 6671.05 385.09 223,982.33 1,699.09 79.12 21480.51 1253.98 46.43 12908.82
Retail & garment 5 302.89 -15.41 2.83
Heavy industry 12 1891.35 1190.45 73.00 -7.75 32.33 -6.55
Chemical and pharmaceutical 8 1051.58 556.55 12728.49 68.95 -39.55 1259.92 28.81 -53.81 793.81
Property, logistic and tourism 13 168.32 5120.88 16.02 184.37 10.12 -4.09
Building construction 7 4198.71 1644.31 316.85 112.74 132.43 45.38 Energy, telecommunication and electronic (public utilities) 6 48,061.63 393.46 269,643.31 11838.15 13.74 3473.15 5999.38 4.83 -4123.04
Infrastructure 8 15,903.78 3550.61 4269.48 1472.55 456.04 346.89 792.37 360.36 307.99
Transportation 9 3540.74 3089.17 1.32 -80.70 0.32 -45.50
Consultation & certification 11 174.09 8.86 15.93 -0.89 7.24 -0.71
Banking 5 22,2075.26 20105.54 5231.95 389.47 3791.35 278.28
Finance 7 1747.56 9544.95 87.03 671.81 19.97 494.60
Insurance 9 2396.40 23835.49 118.52 1759.00 148.05 558.14
Paper & media 6 50.50 417.86 -3.79 43.13 -11.59 35.40
Total 140 64,973.97 1,811.26 18,599.20 3684.98 106.89 1015.62 2263.32 64.39 386.57
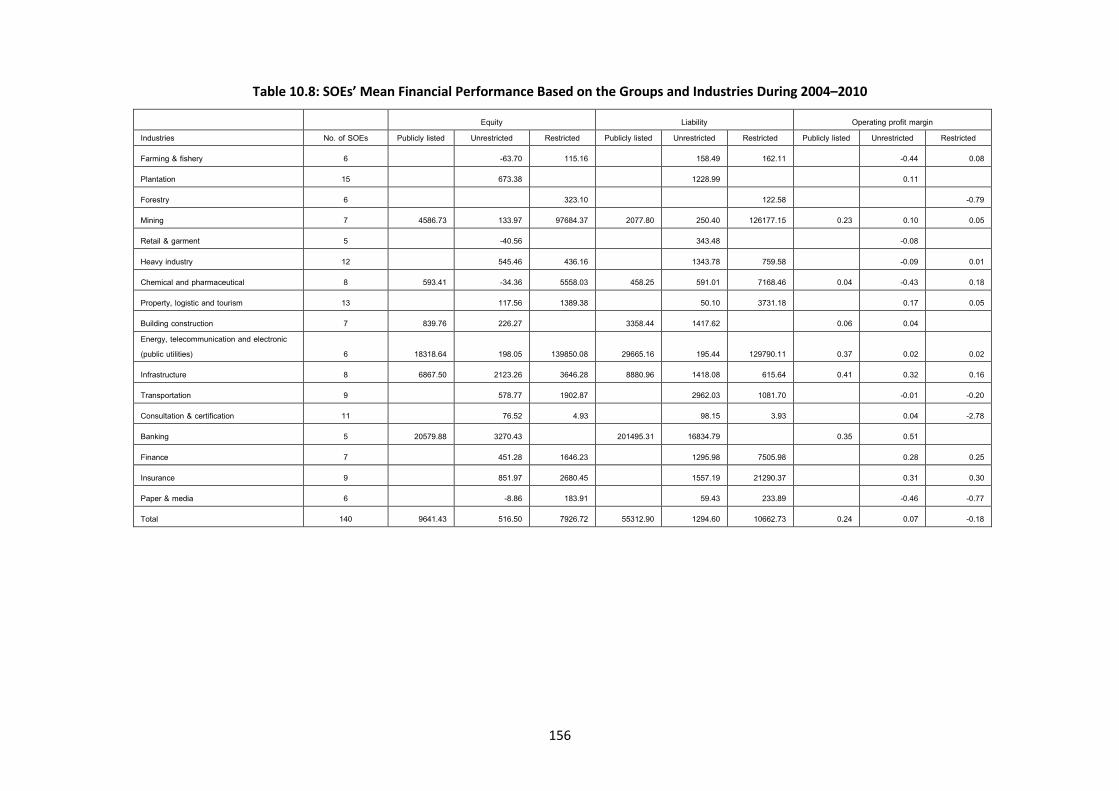
156
Table 10.8: SOEs’ Mean Financial Performance Based on the Groups and Industries During 2004–2010
Equity Liability Operating profit margin
Industries No. of SOEs Publicly listed Unrestricted Restricted Publicly listed Unrestricted Restricted Publicly listed Unrestricted Restricted
Farming & fishery 6 -63.70 115.16 158.49 162.11 -0.44 0.08
Plantation 15 673.38 1228.99 0.11
Forestry 6 323.10 122.58 -0.79
Mining 7 4586.73 133.97 97684.37 2077.80 250.40 126177.15 0.23 0.10 0.05
Retail & garment 5 -40.56 343.48 -0.08
Heavy industry 12 545.46 436.16 1343.78 759.58 -0.09 0.01
Chemical and pharmaceutical 8 593.41 -34.36 5558.03 458.25 591.01 7168.46 0.04 -0.43 0.18
Property, logistic and tourism 13 117.56 1389.38 50.10 3731.18 0.17 0.05
Building construction 7 839.76 226.27 3358.44 1417.62 0.06 0.04 Energy, telecommunication and electronic (public utilities) 6 18318.64 198.05 139850.08 29665.16 195.44 129790.11 0.37 0.02 0.02
Infrastructure 8 6867.50 2123.26 3646.28 8880.96 1418.08 615.64 0.41 0.32 0.16
Transportation 9 578.77 1902.87 2962.03 1081.70 -0.01 -0.20
Consultation & certification 11 76.52 4.93 98.15 3.93 0.04 -2.78
Banking 5 20579.88 3270.43 201495.31 16834.79 0.35 0.51
Finance 7 451.28 1646.23 1295.98 7505.98 0.28 0.25
Insurance 9 851.97 2680.45 1557.19 21290.37 0.31 0.30
Paper & media 6 -8.86 183.91 59.43 233.89 -0.46 -0.77
Total 140 9641.43 516.50 7926.72 55312.90 1294.60 10662.73 0.24 0.07 -0.18
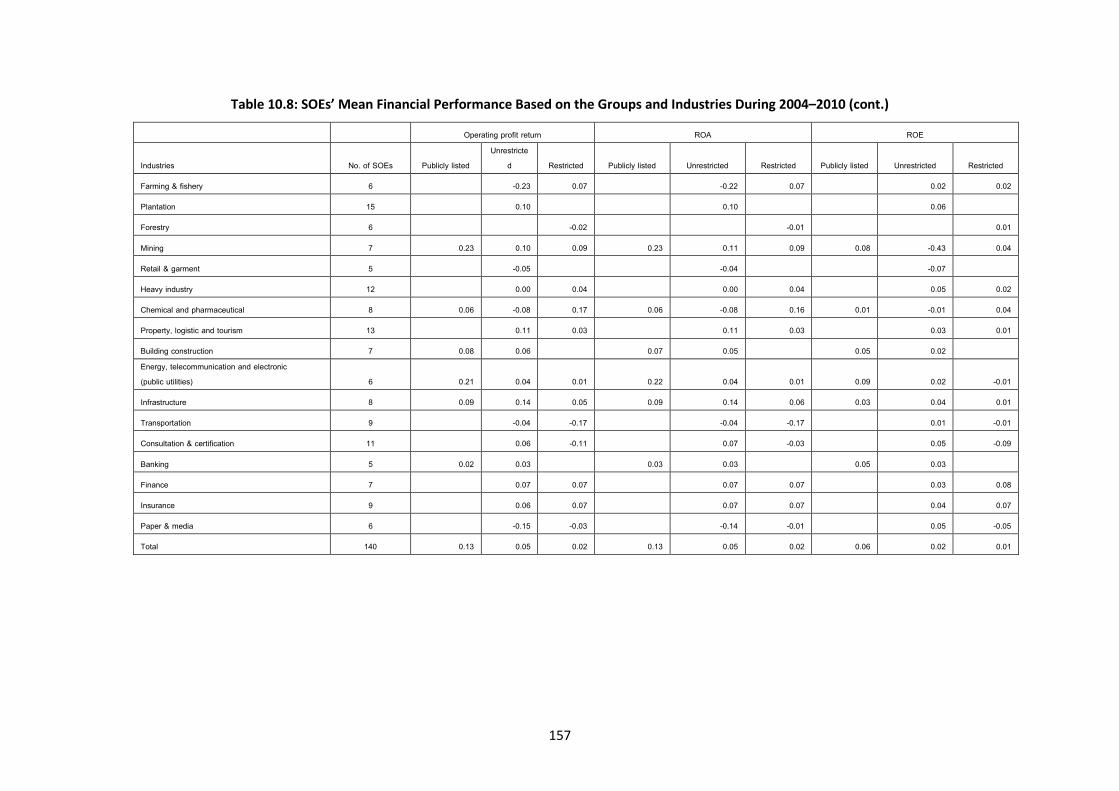
157
Table 10.8: SOEs’ Mean Financial Performance Based on the Groups and Industries During 2004–2010 (cont.)
Operating profit return ROA ROE
Industries No. of SOEs Publicly listed Unrestricte
d Restricted Publicly listed Unrestricted Restricted Publicly listed Unrestricted Restricted
Farming & fishery 6
-0.23 0.07
-0.22 0.07
0.02 0.02
Plantation 15
0.10
0.10
0.06 Forestry 6
-0.02
-0.01
0.01
Mining 7 0.23 0.10 0.09 0.23 0.11 0.09 0.08 -0.43 0.04
Retail & garment 5
-0.05
-0.04
-0.07 Heavy industry 12
0.00 0.04
0.00 0.04
0.05 0.02
Chemical and pharmaceutical 8 0.06 -0.08 0.17 0.06 -0.08 0.16 0.01 -0.01 0.04
Property, logistic and tourism 13
0.11 0.03
0.11 0.03
0.03 0.01
Building construction 7 0.08 0.06
0.07 0.05
0.05 0.02 Energy, telecommunication and electronic
(public utilities) 6 0.21 0.04 0.01 0.22 0.04 0.01 0.09 0.02 -0.01
Infrastructure 8 0.09 0.14 0.05 0.09 0.14 0.06 0.03 0.04 0.01
Transportation 9
-0.04 -0.17
-0.04 -0.17
0.01 -0.01
Consultation & certification 11
0.06 -0.11
0.07 -0.03
0.05 -0.09
Banking 5 0.02 0.03
0.03 0.03
0.05 0.03 Finance 7
0.07 0.07
0.07 0.07
0.03 0.08
Insurance 9
0.06 0.07
0.07 0.07
0.04 0.07
Paper & media 6
-0.15 -0.03
-0.14 -0.01
0.05 -0.05
Total 140 0.13 0.05 0.02 0.13 0.05 0.02 0.06 0.02 0.01
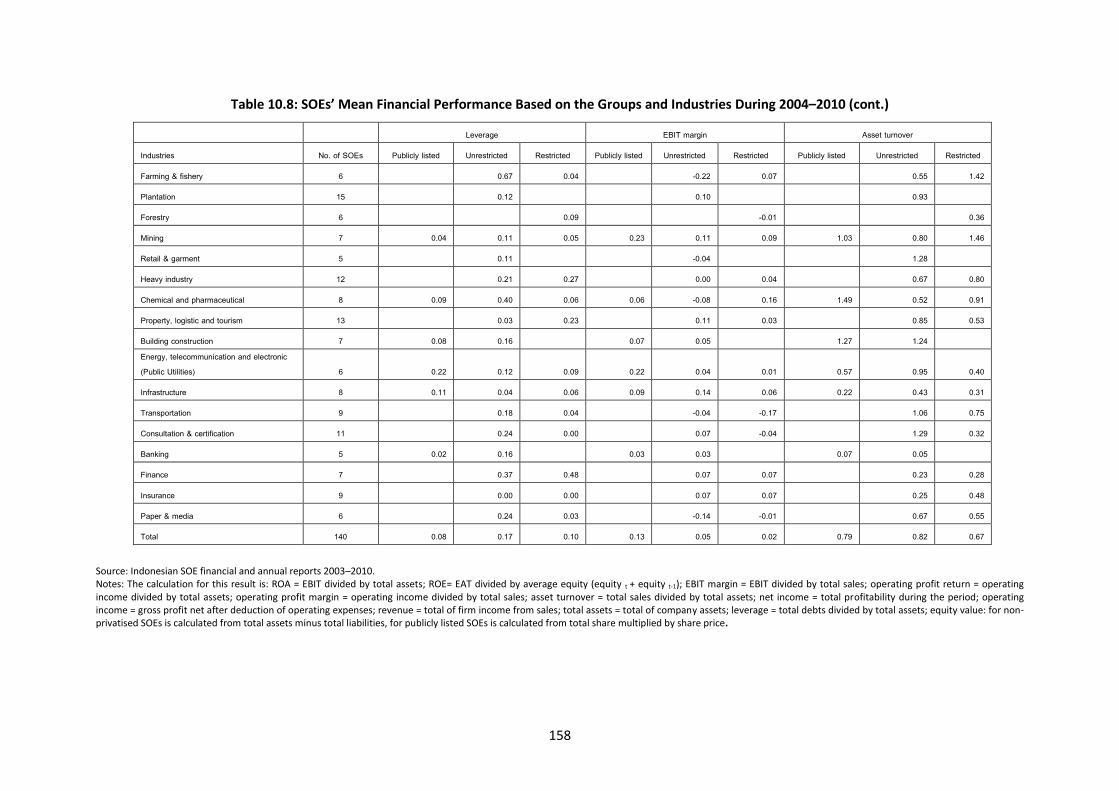
158
Table 10.8: SOEs’ Mean Financial Performance Based on the Groups and Industries During 2004–2010 (cont.)
Leverage EBIT margin Asset turnover
Industries No. of SOEs Publicly listed Unrestricted Restricted Publicly listed Unrestricted Restricted Publicly listed Unrestricted Restricted
Farming & fishery 6
0.67 0.04
-0.22 0.07
0.55 1.42
Plantation 15
0.12
0.10
0.93 Forestry 6
0.09
-0.01
0.36
Mining 7 0.04 0.11 0.05 0.23 0.11 0.09 1.03 0.80 1.46
Retail & garment 5
0.11
-0.04
1.28 Heavy industry 12
0.21 0.27
0.00 0.04
0.67 0.80
Chemical and pharmaceutical 8 0.09 0.40 0.06 0.06 -0.08 0.16 1.49 0.52 0.91
Property, logistic and tourism 13
0.03 0.23
0.11 0.03
0.85 0.53
Building construction 7 0.08 0.16
0.07 0.05
1.27 1.24 Energy, telecommunication and electronic
(Public Utilities) 6 0.22 0.12 0.09 0.22 0.04 0.01 0.57 0.95 0.40
Infrastructure 8 0.11 0.04 0.06 0.09 0.14 0.06 0.22 0.43 0.31
Transportation 9
0.18 0.04
-0.04 -0.17
1.06 0.75
Consultation & certification 11
0.24 0.00
0.07 -0.04
1.29 0.32
Banking 5 0.02 0.16
0.03 0.03
0.07 0.05 Finance 7
0.37 0.48
0.07 0.07
0.23 0.28
Insurance 9
0.00 0.00
0.07 0.07
0.25 0.48
Paper & media 6
0.24 0.03
-0.14 -0.01
0.67 0.55
Total 140 0.08 0.17 0.10 0.13 0.05 0.02 0.79 0.82 0.67
Source: Indonesian SOE financial and annual reports 2003–2010. Notes: The calculation for this result is: ROA = EBIT divided by total assets; ROE= EAT divided by average equity (equity t + equity t-1); EBIT margin = EBIT divided by total sales; operating profit return = operating income divided by total assets; operating profit margin = operating income divided by total sales; asset turnover = total sales divided by total assets; net income = total profitability during the period; operating income = gross profit net after deduction of operating expenses; revenue = total of firm income from sales; total assets = total of company assets; leverage = total debts divided by total assets; equity value: for non-privatised SOEs is calculated from total assets minus total liabilities, for publicly listed SOEs is calculated from total share multiplied by share price.
159
Table 10.9 presents SOEs’ mean available social welfare representative financial performance based
on groups and industries. Taxes and dividends were the two main SOE contributions to the state
budget, while CSR fund, labour cost and employment intensity represented the other social welfare
or non-economic objectives. Focusing exclusively on tax and dividend contributions, Table 10.9
shows that non-privatised SOEs with privatisation restrictions found it difficult to meet these
expectations. High reliance on external funds made it difficult for farming and fishery, public utilities,
property and logistics, transportation, and insurance non-privatised SOEs to contribute through
taxes. These groups of SOEs had a negative mean effective tax rate. Non-privatised SOEs with
privatisation restrictions in public utilities had the smallest mean effective tax rate when interest
was included in the measurement, while non-privatised SOEs with privatisation restrictions in
property and logistics had the smallest mean effective tax rate when interest was excluded in the
measurement. This performance supports the prior analysis that interest plays an important role in
determining Indonesian SOEs’ financial performance. Besides taxes, SOEs were required to
contribute through dividend payments. The influence of interest is shown in both dividend rate
calculations, as the mean dividend rate was better when interest was excluded from the
measurement. Publicly listed SOEs in mining and banking had the largest mean dividend rate, while
non-privatised SOEs with privatisation restrictions in insurance had the lowest mean effective tax
and dividend rates when interest was excluded in the measurement (-6.79 and 7.28 respectively).
Besides state budget contributions, SOEs were required to contribute to community development
and employment. Non-privatised SOEs with privatisation restrictions in public utilities had the
largest mean number of employees (average of 45,645), while non-privatised SOEs with privatisation
restrictions in the consultant and certification group had the smallest mean number of employees
(average of 38). The small number of employees meant that SOEs in this group had the highest
employment intensity performance among other SOEs. This number of SOEs also indicates that
Indonesian SOEs were labour-intensive companies that were considered part of the government’s
requirement regarding employment expectations. For CSR fund performance, publicly listed SOEs in
banking had the highest mean CSR fund performance, while non-privatisation SOEs without
privatisation restrictions in transportation had the smallest mean CSR fund performance.
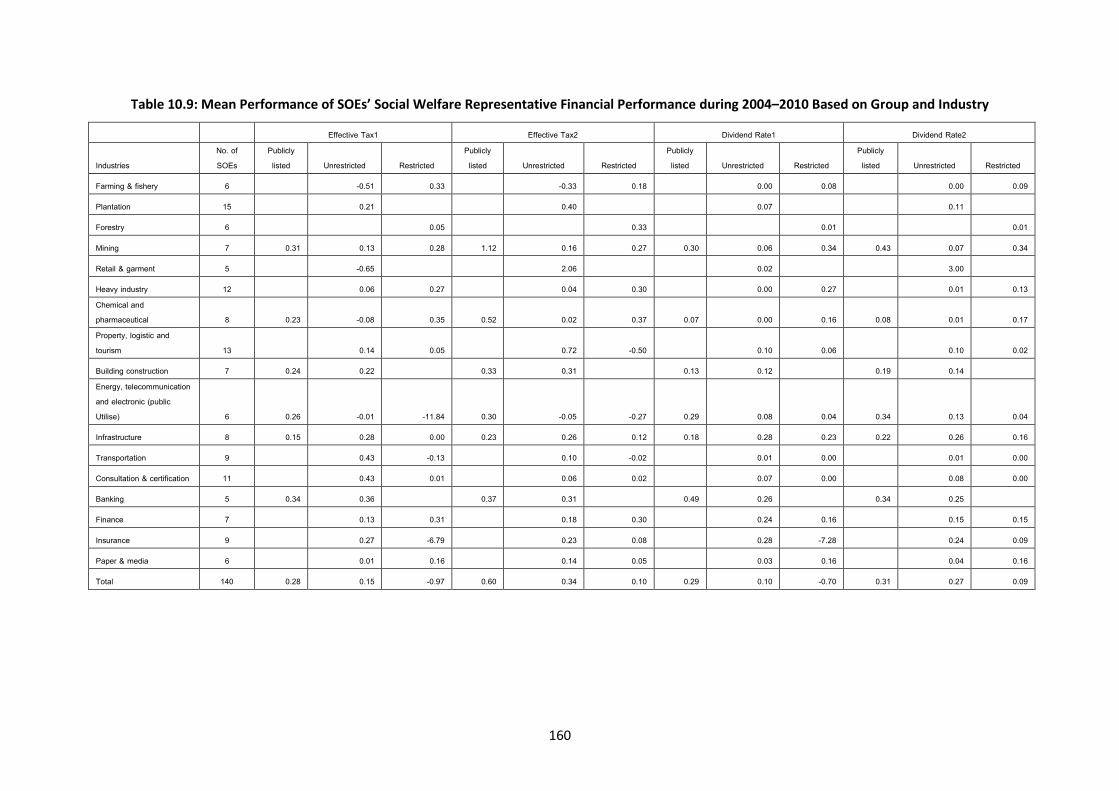
160
Table 10.9: Mean Performance of SOEs’ Social Welfare Representative Financial Performance during 2004–2010 Based on Group and Industry
Effective Tax1 Effective Tax2 Dividend Rate1 Dividend Rate2
Industries No. of SOEs
Publicly listed Unrestricted Restricted
Publicly listed Unrestricted Restricted
Publicly listed Unrestricted Restricted
Publicly listed Unrestricted Restricted
Farming & fishery 6
-0.51 0.33
-0.33 0.18
0.00 0.08
0.00 0.09
Plantation 15
0.21
0.40
0.07
0.11 Forestry 6
0.05
0.33
0.01
0.01
Mining 7 0.31 0.13 0.28 1.12 0.16 0.27 0.30 0.06 0.34 0.43 0.07 0.34
Retail & garment 5
-0.65
2.06
0.02
3.00 Heavy industry 12
0.06 0.27
0.04 0.30
0.00 0.27
0.01 0.13
Chemical and pharmaceutical 8 0.23 -0.08 0.35 0.52 0.02 0.37 0.07 0.00 0.16 0.08 0.01 0.17 Property, logistic and tourism 13
0.14 0.05
0.72 -0.50
0.10 0.06
0.10 0.02
Building construction 7 0.24 0.22
0.33 0.31
0.13 0.12
0.19 0.14 Energy, telecommunication
and electronic (public Utilise) 6 0.26 -0.01 -11.84 0.30 -0.05 -0.27 0.29 0.08 0.04 0.34 0.13 0.04
Infrastructure 8 0.15 0.28 0.00 0.23 0.26 0.12 0.18 0.28 0.23 0.22 0.26 0.16
Transportation 9
0.43 -0.13
0.10 -0.02
0.01 0.00
0.01 0.00
Consultation & certification 11
0.43 0.01
0.06 0.02
0.07 0.00
0.08 0.00
Banking 5 0.34 0.36
0.37 0.31
0.49 0.26
0.34 0.25 Finance 7
0.13 0.31
0.18 0.30
0.24 0.16
0.15 0.15
Insurance 9
0.27 -6.79
0.23 0.08
0.28 -7.28
0.24 0.09
Paper & media 6
0.01 0.16
0.14 0.05
0.03 0.16
0.04 0.16
Total 140 0.28 0.15 -0.97 0.60 0.34 0.10 0.29 0.10 -0.70 0.31 0.27 0.09
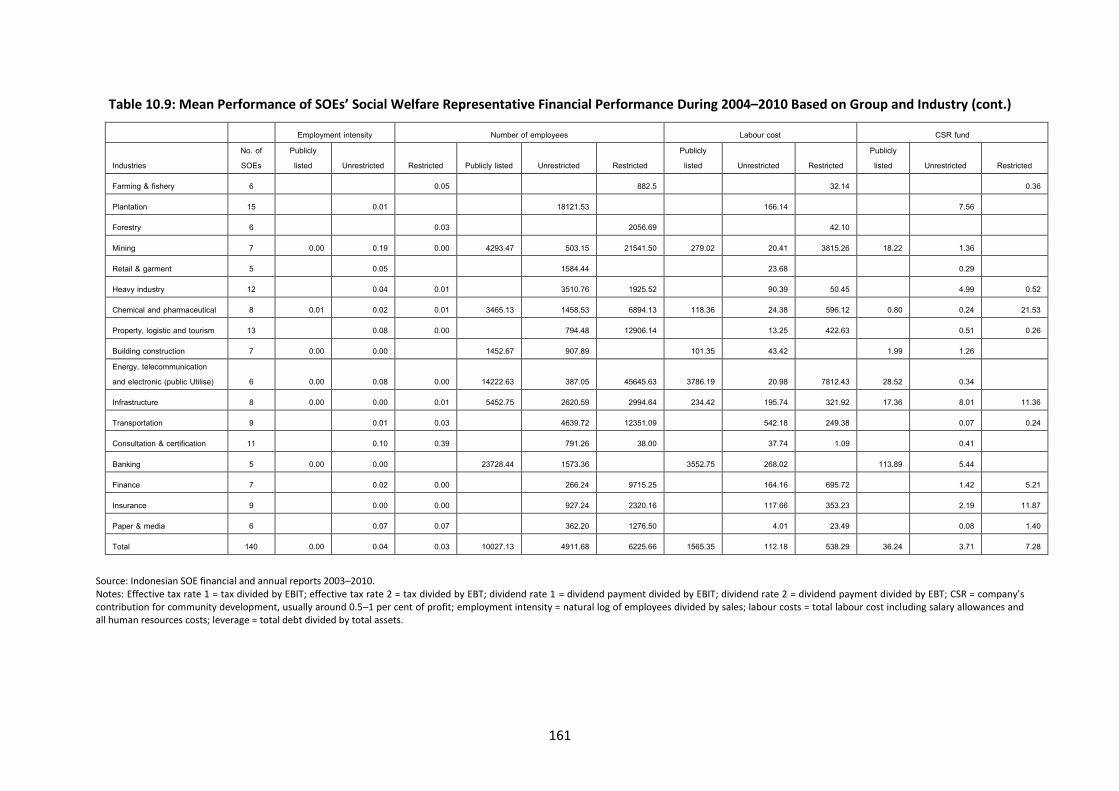
161
Table 10.9: Mean Performance of SOEs’ Social Welfare Representative Financial Performance During 2004–2010 Based on Group and Industry (cont.)
Employment intensity Number of employees Labour cost CSR fund
Industries No. of SOEs
Publicly listed Unrestricted Restricted Publicly listed Unrestricted Restricted
Publicly listed Unrestricted Restricted
Publicly listed Unrestricted Restricted
Farming & fishery 6
0.05
882.5
32.14
0.36
Plantation 15
0.01
18121.53
166.14
7.56 Forestry 6
0.03
2056.69
42.10
Mining 7 0.00 0.19 0.00 4293.47 503.15 21541.50 279.02 20.41 3815.26 18.22 1.36 Retail & garment 5
0.05
1584.44
23.68
0.29
Heavy industry 12
0.04 0.01
3510.76 1925.52
90.39 50.45
4.99 0.52
Chemical and pharmaceutical 8 0.01 0.02 0.01 3465.13 1458.53 6894.13 118.36 24.38 596.12 0.80 0.24 21.53
Property, logistic and tourism 13
0.08 0.00
794.48 12906.14
13.25 422.63
0.51 0.26
Building construction 7 0.00 0.00
1452.67 907.89
101.35 43.42
1.99 1.26 Energy, telecommunication
and electronic (public Utilise) 6 0.00 0.08 0.00 14222.63 387.05 45645.63 3786.19 20.98 7812.43 28.52 0.34 Infrastructure 8 0.00 0.00 0.01 5452.75 2620.59 2994.64 234.42 195.74 321.92 17.36 8.01 11.36
Transportation 9
0.01 0.03
4639.72 12351.09
542.18 249.38
0.07 0.24
Consultation & certification 11
0.10 0.39
791.26 38.00
37.74 1.09
0.41 Banking 5 0.00 0.00
23728.44 1573.36
3552.75 268.02
113.89 5.44
Finance 7
0.02 0.00
266.24 9715.25
164.16 695.72
1.42 5.21
Insurance 9
0.00 0.00
927.24 2320.16
117.66 353.23
2.19 11.87
Paper & media 6
0.07 0.07
362.20 1276.50
4.01 23.49
0.08 1.40
Total 140 0.00 0.04 0.03 10027.13 4911.68 6225.66 1565.35 112.18 538.29 36.24 3.71 7.28
Source: Indonesian SOE financial and annual reports 2003–2010. Notes: Effective tax rate 1 = tax divided by EBIT; effective tax rate 2 = tax divided by EBT; dividend rate 1 = dividend payment divided by EBIT; dividend rate 2 = dividend payment divided by EBT; CSR = company’s contribution for community development, usually around 0.5–1 per cent of profit; employment intensity = natural log of employees divided by sales; labour costs = total labour cost including salary allowances and all human resources costs; leverage = total debt divided by total assets.
162
10.3 The Relations between Objectives and Performance
This chapter presents the first method that was employed: two-sample t-test. The other method,
regression test, is presented in Chapter 11. The test aims to examine whether there are differences
between two groups of SOEs with and without the objectives of SOEs’ performance. As mentioned in
Chapters 5 and 10, 26 objectives were combined to give a total of 21 objectives in order to obtain
sufficient data. Seventeen financial performance indicators were used based on the sufficient data
to be measured or represent the objectives. In this section, the objectives are categorised as
economic or financial objectives and social welfare or non-economic objectives. There are seven
economic or financial objectives and 14 social welfare or non-economic objectives. The test focuses
on examining differences in SOEs’ performance between two groups of SOEs with and without the
objectives for α = 0.05 or 1.9647.
Table 10.10 shows whether the government-stated economic or financial objectives made a
difference to SOEs’ performance. Focusing exclusively on the potential for conflicting or
complementary government-stated economic or financial objectives, potential conflicts occur when
the objectives generate negative effects or prevent SOEs from showing better performance. In
contrast, the government-stated economic or financial objectives potentially complement SOEs’
performance when the result is positive. A positive result means that the objectives generates or
improves SOEs’ performance. SOEs’ performance in Table 10.10 shows differences between two
groups of SOEs. The government-stated profit and efficiency objectives differentiate most SOEs’
financial performance, except ROE, asset turnover and leverage. The government-stated profit
objective distinguishes SOEs’ operating profit margin, operating profit return, operating income,
ROA, EBIT margin, liability, market/book value of equity and net income performance, and the
objective may worsen SOEs’ performance. The government-stated efficiency objective distinguishes
SOEs’ operating profit margin, operating profit return, ROA and EBIT margin. The objective is
associated positively with SOEs’ performance. The government-stated efficiency objective also
differentiates SOEs’ operating income, net income, liability and market/book value of equity. The
objective shows negative effects on these performances. The other government-stated economic or
financial objectives, such as compliance with corporate principles, corporate value and reputation
improvement, environment and resource utilisation, and technology and research objectives,
differentiate some SOEs’ performance. The objectives, except the government-stated objectives for
environment and resources utilisation, and quality, tend to be positively associated with most SOEs’
financial performance. The government-stated environment and resources utilisation objectives
generate have a negative effect on SOEs’ operating profit return, while the government-stated
quality objective has a negative effect on asset turnover and liability performance.
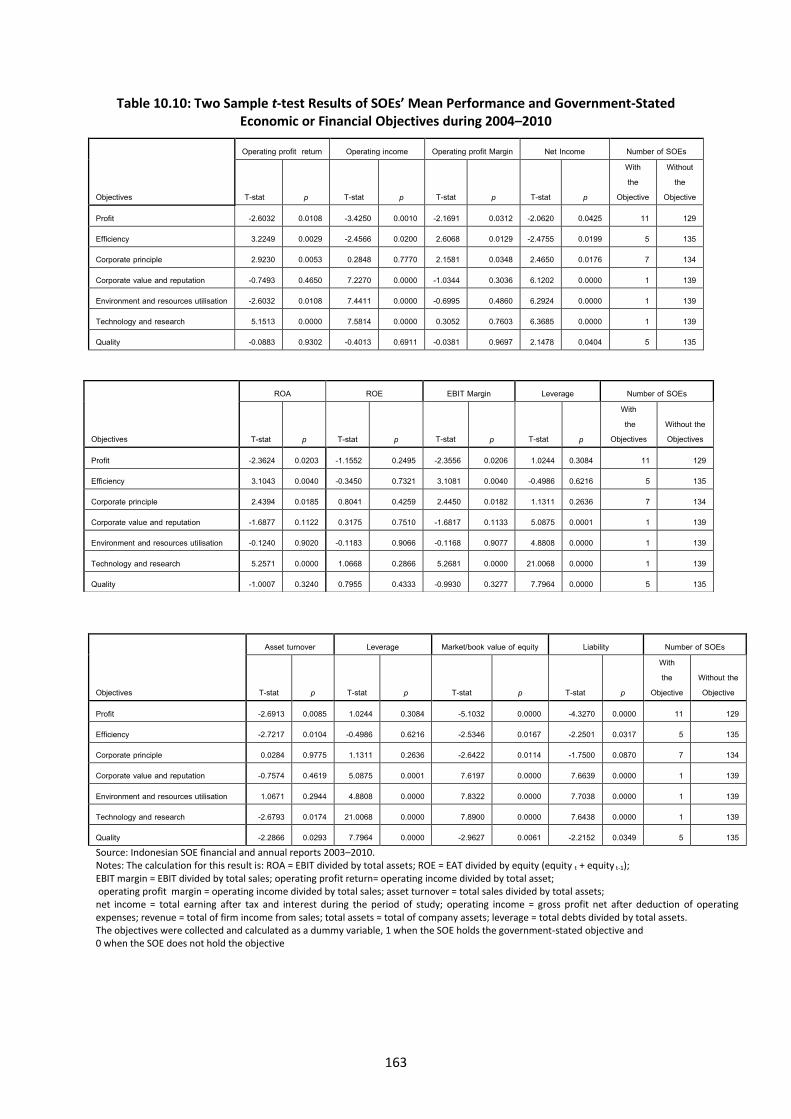
163
Table 10.10: Two Sample t-test Results of SOEs’ Mean Performance and Government-Stated Economic or Financial Objectives during 2004–2010
Objectives
Operating profit return Operating income Operating profit Margin Net Income Number of SOEs
T-stat p T-stat p T-stat p T-stat p
With the
Objective
Without the
Objective
Profit -2.6032 0.0108 -3.4250 0.0010 -2.1691 0.0312 -2.0620 0.0425 11 129
Efficiency 3.2249 0.0029 -2.4566 0.0200 2.6068 0.0129 -2.4755 0.0199 5 135
Corporate principle 2.9230 0.0053 0.2848 0.7770 2.1581 0.0348 2.4650 0.0176 7 134
Corporate value and reputation -0.7493 0.4650 7.2270 0.0000 -1.0344 0.3036 6.1202 0.0000 1 139
Environment and resources utilisation -2.6032 0.0108 7.4411 0.0000 -0.6995 0.4860 6.2924 0.0000 1 139
Technology and research 5.1513 0.0000 7.5814 0.0000 0.3052 0.7603 6.3685 0.0000 1 139
Quality -0.0883 0.9302 -0.4013 0.6911 -0.0381 0.9697 2.1478 0.0404 5 135
Objectives
ROA ROE EBIT Margin Leverage Number of SOEs
T-stat p T-stat p T-stat p T-stat p
With the
Objectives Without the Objectives
Profit -2.3624 0.0203 -1.1552 0.2495 -2.3556 0.0206 1.0244 0.3084 11 129
Efficiency 3.1043 0.0040 -0.3450 0.7321 3.1081 0.0040 -0.4986 0.6216 5 135
Corporate principle 2.4394 0.0185 0.8041 0.4259 2.4450 0.0182 1.1311 0.2636 7 134
Corporate value and reputation -1.6877 0.1122 0.3175 0.7510 -1.6817 0.1133 5.0875 0.0001 1 139
Environment and resources utilisation -0.1240 0.9020 -0.1183 0.9066 -0.1168 0.9077 4.8808 0.0000 1 139
Technology and research 5.2571 0.0000 1.0668 0.2866 5.2681 0.0000 21.0068 0.0000 1 139
Quality -1.0007 0.3240 0.7955 0.4333 -0.9930 0.3277 7.7964 0.0000 5 135
Objectives
Asset turnover Leverage Market/book value of equity Liability Number of SOEs
T-stat p T-stat p T-stat p T-stat p
With the
Objective Without the Objective
Profit -2.6913 0.0085 1.0244 0.3084 -5.1032 0.0000 -4.3270 0.0000 11 129
Efficiency -2.7217 0.0104 -0.4986 0.6216 -2.5346 0.0167 -2.2501 0.0317 5 135
Corporate principle 0.0284 0.9775 1.1311 0.2636 -2.6422 0.0114 -1.7500 0.0870 7 134
Corporate value and reputation -0.7574 0.4619 5.0875 0.0001 7.6197 0.0000 7.6639 0.0000 1 139
Environment and resources utilisation 1.0671 0.2944 4.8808 0.0000 7.8322 0.0000 7.7038 0.0000 1 139
Technology and research -2.6793 0.0174 21.0068 0.0000 7.8900 0.0000 7.6438 0.0000 1 139
Quality -2.2866 0.0293 7.7964 0.0000 -2.9627 0.0061 -2.2152 0.0349 5 135 Source: Indonesian SOE financial and annual reports 2003–2010. Notes: The calculation for this result is: ROA = EBIT divided by total assets; ROE = EAT divided by equity (equity t + equity t-1); EBIT margin = EBIT divided by total sales; operating profit return= operating income divided by total asset; operating profit margin = operating income divided by total sales; asset turnover = total sales divided by total assets; net income = total earning after tax and interest during the period of study; operating income = gross profit net after deduction of operating expenses; revenue = total of firm income from sales; total assets = total of company assets; leverage = total debts divided by total assets. The objectives were collected and calculated as a dummy variable, 1 when the SOE holds the government-stated objective and 0 when the SOE does not hold the objective
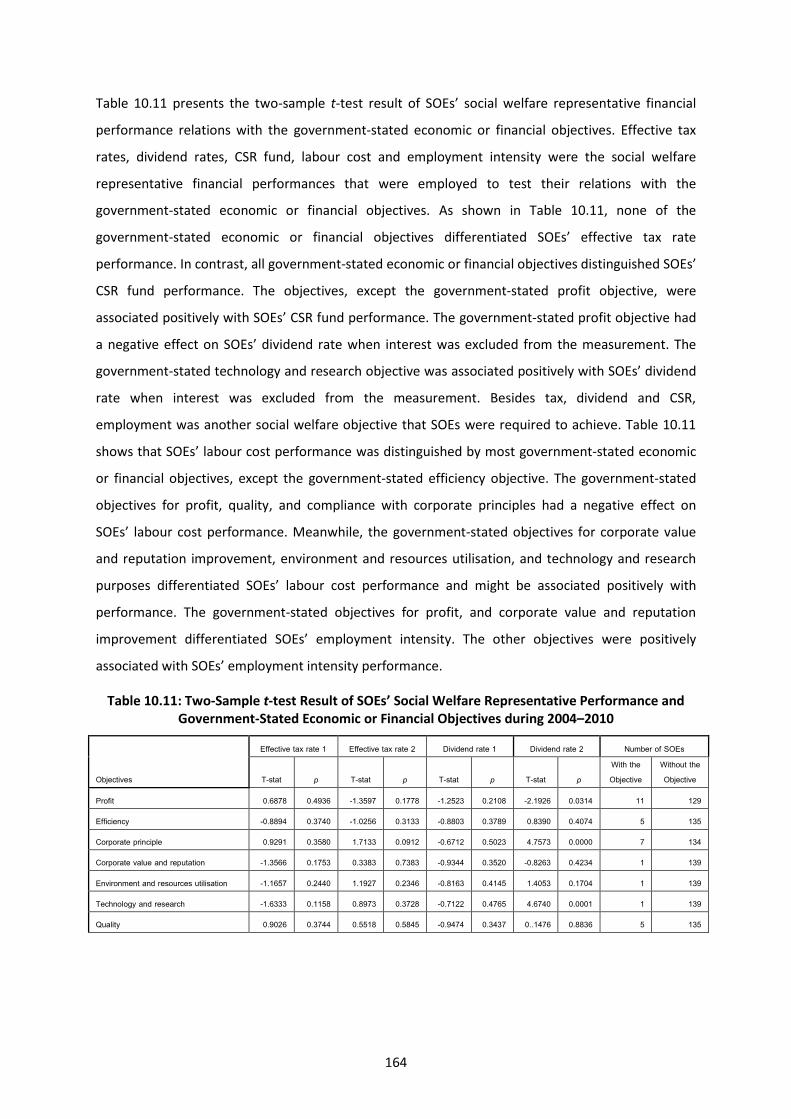
164
Table 10.11 presents the two-sample t-test result of SOEs’ social welfare representative financial
performance relations with the government-stated economic or financial objectives. Effective tax
rates, dividend rates, CSR fund, labour cost and employment intensity were the social welfare
representative financial performances that were employed to test their relations with the
government-stated economic or financial objectives. As shown in Table 10.11, none of the
government-stated economic or financial objectives differentiated SOEs’ effective tax rate
performance. In contrast, all government-stated economic or financial objectives distinguished SOEs’
CSR fund performance. The objectives, except the government-stated profit objective, were
associated positively with SOEs’ CSR fund performance. The government-stated profit objective had
a negative effect on SOEs’ dividend rate when interest was excluded from the measurement. The
government-stated technology and research objective was associated positively with SOEs’ dividend
rate when interest was excluded from the measurement. Besides tax, dividend and CSR,
employment was another social welfare objective that SOEs were required to achieve. Table 10.11
shows that SOEs’ labour cost performance was distinguished by most government-stated economic
or financial objectives, except the government-stated efficiency objective. The government-stated
objectives for profit, quality, and compliance with corporate principles had a negative effect on
SOEs’ labour cost performance. Meanwhile, the government-stated objectives for corporate value
and reputation improvement, environment and resources utilisation, and technology and research
purposes differentiated SOEs’ labour cost performance and might be associated positively with
performance. The government-stated objectives for profit, and corporate value and reputation
improvement differentiated SOEs’ employment intensity. The other objectives were positively
associated with SOEs’ employment intensity performance.
Table 10.11: Two-Sample t-test Result of SOEs’ Social Welfare Representative Performance and Government-Stated Economic or Financial Objectives during 2004–2010
Objectives
Effective tax rate 1 Effective tax rate 2 Dividend rate 1 Dividend rate 2 Number of SOEs
T-stat p T-stat p T-stat p T-stat p With the Objective
Without the Objective
Profit 0.6878 0.4936 -1.3597 0.1778 -1.2523 0.2108 -2.1926 0.0314 11 129
Efficiency -0.8894 0.3740 -1.0256 0.3133 -0.8803 0.3789 0.8390 0.4074 5 135
Corporate principle 0.9291 0.3580 1.7133 0.0912 -0.6712 0.5023 4.7573 0.0000 7 134
Corporate value and reputation -1.3566 0.1753 0.3383 0.7383 -0.9344 0.3520 -0.8263 0.4234 1 139
Environment and resources utilisation -1.1657 0.2440 1.1927 0.2346 -0.8163 0.4145 1.4053 0.1704 1 139
Technology and research -1.6333 0.1158 0.8973 0.3728 -0.7122 0.4765 4.6740 0.0001 1 139
Quality 0.9026 0.3744 0.5518 0.5845 -0.9474 0.3437 0..1476 0.8836 5 135
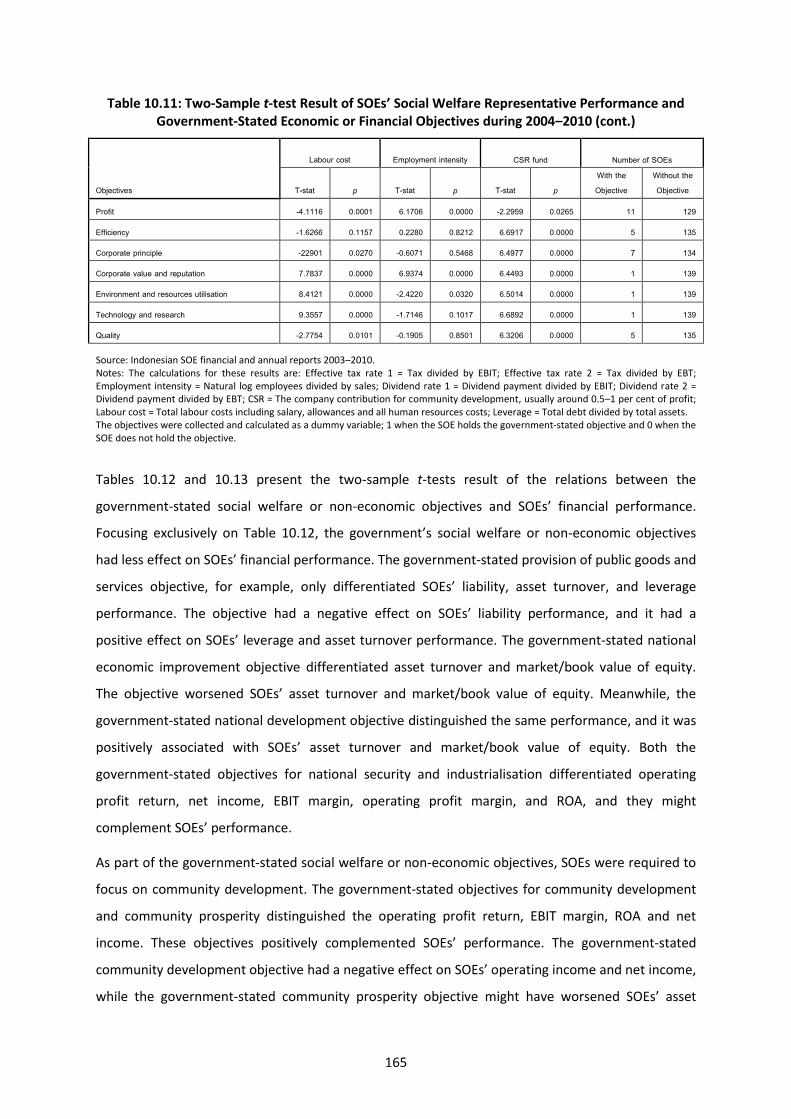
165
Table 10.11: Two-Sample t-test Result of SOEs’ Social Welfare Representative Performance and Government-Stated Economic or Financial Objectives during 2004–2010 (cont.)
Objectives
Labour cost Employment intensity CSR fund Number of SOEs
T-stat p T-stat p T-stat p With the Objective
Without the Objective
Profit -4.1116 0.0001 6.1706 0.0000 -2.2959 0.0265 11 129
Efficiency -1.6266 0.1157 0.2280 0.8212 6.6917 0.0000 5 135
Corporate principle -22901 0.0270 -0.6071 0.5468 6.4977 0.0000 7 134
Corporate value and reputation 7.7837 0.0000 6.9374 0.0000 6.4493 0.0000 1 139
Environment and resources utilisation 8.4121 0.0000 -2.4220 0.0320 6.5014 0.0000 1 139
Technology and research 9.3557 0.0000 -1.7146 0.1017 6.6892 0.0000 1 139
Quality -2.7754 0.0101 -0.1905 0.8501 6.3206 0.0000 5 135
Source: Indonesian SOE financial and annual reports 2003–2010. Notes: The calculations for these results are: Effective tax rate 1 = Tax divided by EBIT; Effective tax rate 2 = Tax divided by EBT; Employment intensity = Natural log employees divided by sales; Dividend rate 1 = Dividend payment divided by EBIT; Dividend rate 2 = Dividend payment divided by EBT; CSR = The company contribution for community development, usually around 0.5–1 per cent of profit; Labour cost = Total labour costs including salary, allowances and all human resources costs; Leverage = Total debt divided by total assets. The objectives were collected and calculated as a dummy variable; 1 when the SOE holds the government-stated objective and 0 when the SOE does not hold the objective.
Tables 10.12 and 10.13 present the two-sample t-tests result of the relations between the
government-stated social welfare or non-economic objectives and SOEs’ financial performance.
Focusing exclusively on Table 10.12, the government’s social welfare or non-economic objectives
had less effect on SOEs’ financial performance. The government-stated provision of public goods and
services objective, for example, only differentiated SOEs’ liability, asset turnover, and leverage
performance. The objective had a negative effect on SOEs’ liability performance, and it had a
positive effect on SOEs’ leverage and asset turnover performance. The government-stated national
economic improvement objective differentiated asset turnover and market/book value of equity.
The objective worsened SOEs’ asset turnover and market/book value of equity. Meanwhile, the
government-stated national development objective distinguished the same performance, and it was
positively associated with SOEs’ asset turnover and market/book value of equity. Both the
government-stated objectives for national security and industrialisation differentiated operating
profit return, net income, EBIT margin, operating profit margin, and ROA, and they might
complement SOEs’ performance.
As part of the government-stated social welfare or non-economic objectives, SOEs were required to
focus on community development. The government-stated objectives for community development
and community prosperity distinguished the operating profit return, EBIT margin, ROA and net
income. These objectives positively complemented SOEs’ performance. The government-stated
community development objective had a negative effect on SOEs’ operating income and net income,
while the government-stated community prosperity objective might have worsened SOEs’ asset

166
turnover performance. The government-stated provision of community needs objective
differentiated SOEs’ operating income and net income. The objective had a positive effect on these
performances. Meanwhile, this government objective had a negative effect on SOEs’ asset turnover
performance.
As part of the government body, SOEs were also required to contribute to the state budget and
support the government’s activities. The government-stated objectives for compliance with
government policy and provision of special needs distinguished SOEs’ operating income, net income,
liability, operating profit margin, asset turnover, and market/book value of equity. These objectives
had a negative effect on SOEs’ operating profit margin and asset turnover. In contrast, they
positively complemented the other performances. The government-stated compliance with
government policy objective had a negative effect on SOEs’ operating profit return. The
government-stated state budget contribution objective distinguished SOEs’ liability and asset
turnover performance, and it might have worsened these SOEs’ performance.
Table 10.12: Two-Sample t-test Result of the Relations between SOEs’ Financial Performance and Government-Stated Social Welfare or Non-Economic Objectives during 2004–2010
Objectives
Operating profit return Operating income Operating profit margin Net Income Number of SOEs
T-stat P T-stat P T-stat P T-stat P With the Objective
Without the Objective
Provision of public goods and services -1.7375 0.0827 0.1039 09173 -0.0776 0.9382 0.7321 0.4644 81 59
National economic 1.3331 0.1828 -1.8674 0.0623 1.3157 0.1886 -1.3222 0.1867 52 88
National development 1.1925 0.2347 1.8869 0.0596 1.4661 0.1447 0.6374 0.5241 18 122
National security 3.1502 0.0035 3.9080 0.0001 2.0363 0.0500 3.3249 0.0011 4 136
Industrialisation 3.1139 0.0023 1.2673 0.2067 2.2888 0.0236 2.7612 0.0067 14 126
OHS 1.2307 0.2192 1.2534 0.2106 1.8344 0.0676 -0.0726 0.9422 20 120
Community development 5.3552 0.0000 -2.2381 0.0303 3.2154 0.0024 -2.2308 0.0308 11 129
Community prosperity 3.0763 0.0023 -1.6605 0.0980 1.3332 0.1830 -0.6073 0.5442 31 109
Community needs 1.6647 0.0966 2.3135 0.0209 0.3012 0.7633 2.9769 0.0030 37 103
Government policy -2.0844 0.0430 5.0779 0.0000 -3.1330 0.0022 4.4042 0.0000 7 133
Government special needs -1.0759 0.2884 6.0580 0.0000 -3.1707 0.0020 5.1950 0.0000 5 135
State budget -0.7955 0.4315 0.2968 0.7678 -0.4511 0.6536 -0.5685 0.5724 5 135
Market supply and stabilisation 2.7241 0.0108 -0.3664 0.7168 -2.1910 0.0335 2.2040 0.0361 2 138

167
Table 10.12: Two-Sample t-test Result of the Relations between SOEs’ Financial Performance and Government-Stated Social Welfare or Non-Economic Objectives during 2004–2010
Objectives
ROA ROE Leverage Number of SOEs
T-stat p T-stat p T-stat p With the Objective
Without the Objective
Provision of public goods and services -1.7956 0.0729 -1.3720 0.1709 6.2510 0.0000 81 59
National economic 1.1956 0.2322 0.7620 0.4465 0.3313 0.7405 52 88
National development 0.9410 0.3480 1.0288 0.3054 4.6602 0.0000 18 122
National security 3.2882 0.0024 -0.0401 0.9682 -1.7954 0.0815 4 136
Industrialisation 3.2395 0.0015 1.1548 0.2508 -3.9884 0.0001 14 126
OHS 1.2072 0.2282 -0.7549 0.4510 -0.0436 0.9653 20 120
Community development 5.1305 0.0000 0.6460 0.5218 -0.5941 0.5555 11 129
Community prosperity 2.8616 0.0045 -0.5648 0.5725 -1.6406 0.1016 31 109
Community needs 1.4354 0.1518 -0.8753 0.3819 -1.1805 0.2383 37 103
Government policy -1.9924 0.0526 1.0515 0.2993 0.4597 0.6477 7 133
Government special needs -1.1449 0.2590 -0.5691 0.5699 2.8216 0.0070 5 135
State budget -0.7324 0.4686 -1.1547 0.2535 -1.5533 0.1313 5 135
Market supply and stabilisation 2.7843 0.0093 -0.2659 0.7908 0.5789 0.5670 2 138 Source: Indonesian SOE financial and annual reports 2003–2010. Notes: The calculation for this result is: ROA = EBIT divided by total assets; ROE = EAT divided by equity (equity t + equity t-1); EBIT margin = EBIT divided by total sales; operating profit return = opeating income divided by total sales’ operating profit margin = operating income divided by total sales; asset turnover = total sales divided by total assets; net income = total earning after tax and interest during the period of study; operating income = gross profit net after deduction of operating expenses; revenue = total of firm income from sales; total assets = total of company assets; leverage = total debts divided by total assets.The objectives were collected and calculated as a dummy variable, 1 when the SOE holds the government-stated objective and 0 when the SOE does not hold the objective.
Objectives
Market Value of Equity EBIT Margin Liability Asset Turnover Number of SOEs
T-stat P T-stat P T-stat P T-stat P With the Objective
Without the Objective
Provision of public goods and services -0.3478 0.7281 -1.850 0.0699 -2.2152 0.0349 5.6571 0.0000 81 59
National economic -4.5745 0.0000 1.2158 0.2244 -2.6359 0.0086 -3.5399 0.0004 52 88
National development 2.2964 0.0220 0.8934 0.3729 -0.2812 0.7788 2.4426 0.0154 18 122
National security 2.6712 0.0093 3.2906 0.0024 5.3361 0.0000 2.8102 0.0081 4 136
Industrialisation -2.0540 0.0425 3.2477 0.0015 -0.4717 0.6380 -1.5128 0.1327 14 126
OHS 1.0368 0.3006 1.2208 0.2230 -0.0853 0.9321 -7.4861 0.0000 20 120
Community development -2.2210 0.0315 5.1354 0.000 -1.8790 0.0665 1.1792 0.2444 11 129
Community prosperity -3.6713 0.0003 2.8784 0.0043 -0.5568 0.5780 -6.0714 0.0000 31 109
Community needs -1.8430 0.0663 1.4506 0.1475 1.5619 0.1187 -3.7926 0.0002 37 103
Government policy 4.9759 0.0000 -1.9888 0.0530 6.2711 0.0000 -3.9677 0.0002 7 133
Government special needs 6.9620 0.0000 -1.1417 0.2603 6.9264 0.0000 -3.4358 0.0013 5 135
State budget 1.1658 0.2483 -0.7292 0.4706 6.5257 0.0000 -2.2799 0.0278 5 135
Market supply and stabilisation -2.9717 0.0061 2.7888 0.0092 -2.2640 0.0317 1.2890 0.2079 2 138
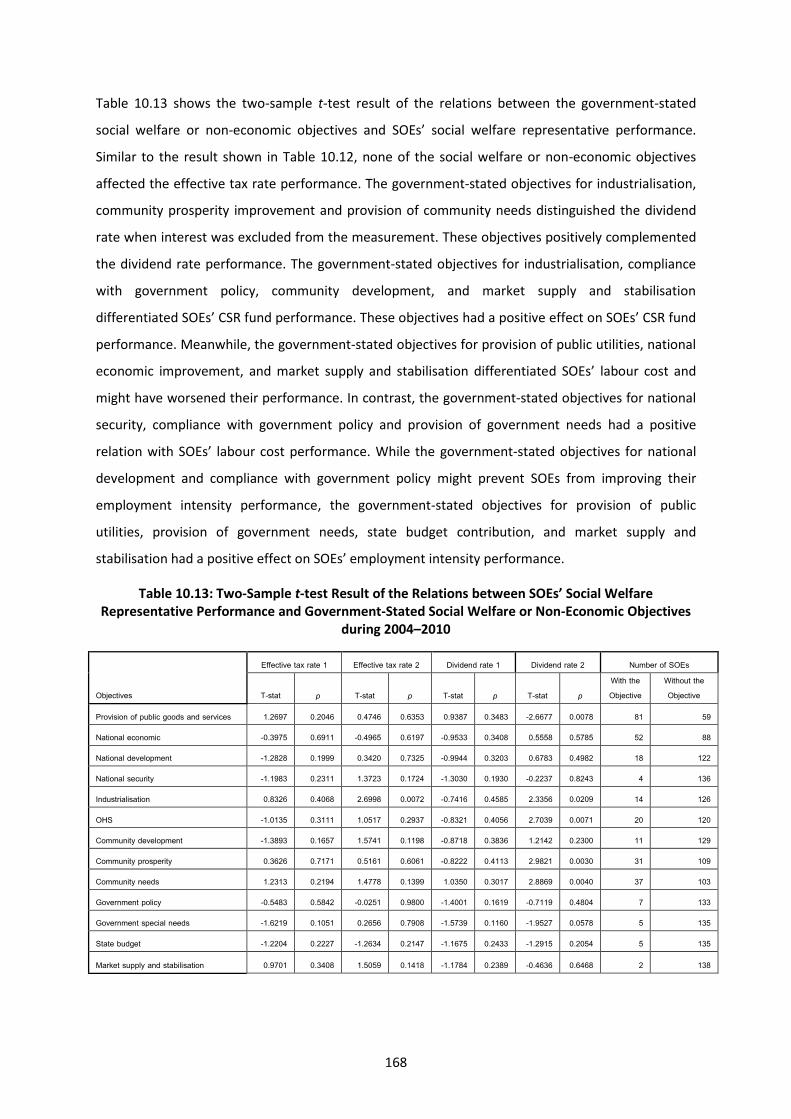
168
Table 10.13 shows the two-sample t-test result of the relations between the government-stated
social welfare or non-economic objectives and SOEs’ social welfare representative performance.
Similar to the result shown in Table 10.12, none of the social welfare or non-economic objectives
affected the effective tax rate performance. The government-stated objectives for industrialisation,
community prosperity improvement and provision of community needs distinguished the dividend
rate when interest was excluded from the measurement. These objectives positively complemented
the dividend rate performance. The government-stated objectives for industrialisation, compliance
with government policy, community development, and market supply and stabilisation
differentiated SOEs’ CSR fund performance. These objectives had a positive effect on SOEs’ CSR fund
performance. Meanwhile, the government-stated objectives for provision of public utilities, national
economic improvement, and market supply and stabilisation differentiated SOEs’ labour cost and
might have worsened their performance. In contrast, the government-stated objectives for national
security, compliance with government policy and provision of government needs had a positive
relation with SOEs’ labour cost performance. While the government-stated objectives for national
development and compliance with government policy might prevent SOEs from improving their
employment intensity performance, the government-stated objectives for provision of public
utilities, provision of government needs, state budget contribution, and market supply and
stabilisation had a positive effect on SOEs’ employment intensity performance.
Table 10.13: Two-Sample t-test Result of the Relations between SOEs’ Social Welfare Representative Performance and Government-Stated Social Welfare or Non-Economic Objectives
during 2004–2010
Objectives
Effective tax rate 1 Effective tax rate 2 Dividend rate 1 Dividend rate 2 Number of SOEs
T-stat p T-stat p T-stat p T-stat p With the Objective
Without the Objective
Provision of public goods and services 1.2697 0.2046 0.4746 0.6353 0.9387 0.3483 -2.6677 0.0078 81 59
National economic -0.3975 0.6911 -0.4965 0.6197 -0.9533 0.3408 0.5558 0.5785 52 88
National development -1.2828 0.1999 0.3420 0.7325 -0.9944 0.3203 0.6783 0.4982 18 122
National security -1.1983 0.2311 1.3723 0.1724 -1.3030 0.1930 -0.2237 0.8243 4 136
Industrialisation 0.8326 0.4068 2.6998 0.0072 -0.7416 0.4585 2.3356 0.0209 14 126
OHS -1.0135 0.3111 1.0517 0.2937 -0.8321 0.4056 2.7039 0.0071 20 120
Community development -1.3893 0.1657 1.5741 0.1198 -0.8718 0.3836 1.2142 0.2300 11 129
Community prosperity 0.3626 0.7171 0.5161 0.6061 -0.8222 0.4113 2.9821 0.0030 31 109
Community needs 1.2313 0.2194 1.4778 0.1399 1.0350 0.3017 2.8869 0.0040 37 103
Government policy -0.5483 0.5842 -0.0251 0.9800 -1.4001 0.1619 -0.7119 0.4804 7 133
Government special needs -1.6219 0.1051 0.2656 0.7908 -1.5739 0.1160 -1.9527 0.0578 5 135
State budget -1.2204 0.2227 -1.2634 0.2147 -1.1675 0.2433 -1.2915 0.2054 5 135
Market supply and stabilisation 0.9701 0.3408 1.5059 0.1418 -1.1784 0.2389 -0.4636 0.6468 2 138
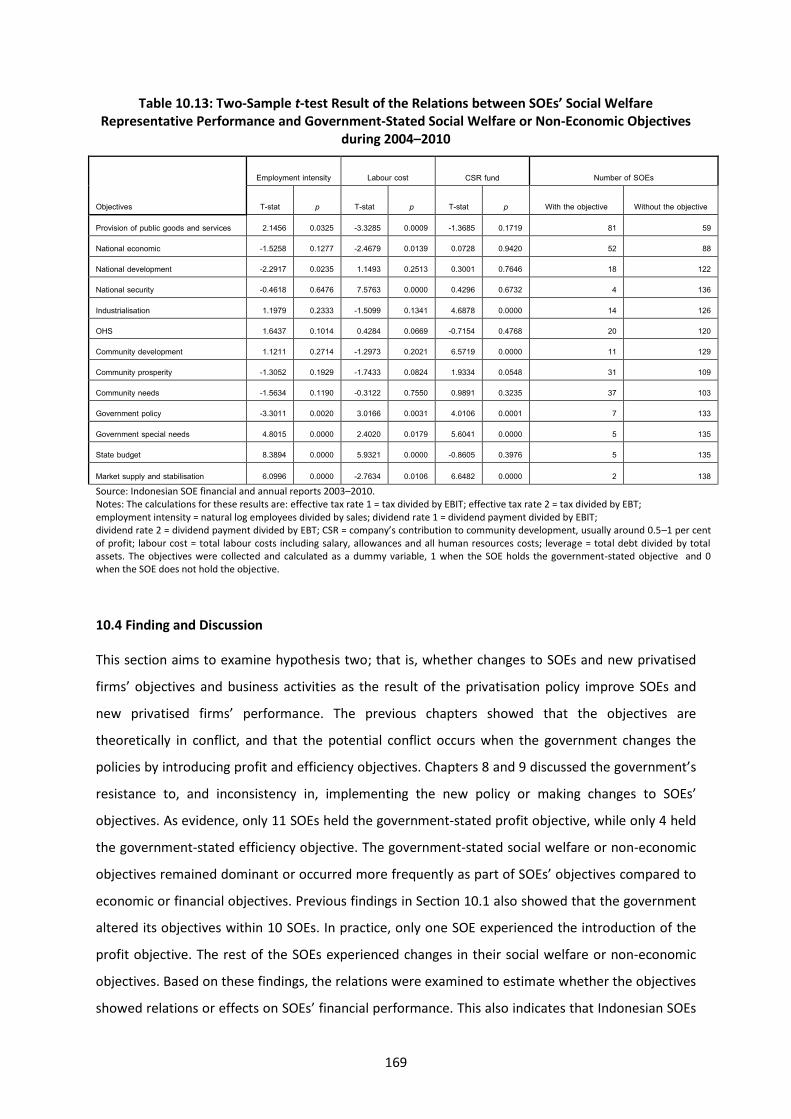
169
Table 10.13: Two-Sample t-test Result of the Relations between SOEs’ Social Welfare Representative Performance and Government-Stated Social Welfare or Non-Economic Objectives
during 2004–2010
Objectives
Employment intensity Labour cost CSR fund Number of SOEs
T-stat p T-stat p T-stat p With the objective Without the objective
Provision of public goods and services 2.1456 0.0325 -3.3285 0.0009 -1.3685 0.1719 81 59
National economic -1.5258 0.1277 -2.4679 0.0139 0.0728 0.9420 52 88
National development -2.2917 0.0235 1.1493 0.2513 0.3001 0.7646 18 122
National security -0.4618 0.6476 7.5763 0.0000 0.4296 0.6732 4 136
Industrialisation 1.1979 0.2333 -1.5099 0.1341 4.6878 0.0000 14 126
OHS 1.6437 0.1014 0.4284 0.0669 -0.7154 0.4768 20 120
Community development 1.1211 0.2714 -1.2973 0.2021 6.5719 0.0000 11 129
Community prosperity -1.3052 0.1929 -1.7433 0.0824 1.9334 0.0548 31 109
Community needs -1.5634 0.1190 -0.3122 0.7550 0.9891 0.3235 37 103
Government policy -3.3011 0.0020 3.0166 0.0031 4.0106 0.0001 7 133
Government special needs 4.8015 0.0000 2.4020 0.0179 5.6041 0.0000 5 135
State budget 8.3894 0.0000 5.9321 0.0000 -0.8605 0.3976 5 135
Market supply and stabilisation 6.0996 0.0000 -2.7634 0.0106 6.6482 0.0000 2 138 Source: Indonesian SOE financial and annual reports 2003–2010. Notes: The calculations for these results are: effective tax rate 1 = tax divided by EBIT; effective tax rate 2 = tax divided by EBT; employment intensity = natural log employees divided by sales; dividend rate 1 = dividend payment divided by EBIT; dividend rate 2 = dividend payment divided by EBT; CSR = company’s contribution to community development, usually around 0.5–1 per cent of profit; labour cost = total labour costs including salary, allowances and all human resources costs; leverage = total debt divided by total assets. The objectives were collected and calculated as a dummy variable, 1 when the SOE holds the government-stated objective and 0 when the SOE does not hold the objective.
10.4 Finding and Discussion
This section aims to examine hypothesis two; that is, whether changes to SOEs and new privatised
firms’ objectives and business activities as the result of the privatisation policy improve SOEs and
new privatised firms’ performance. The previous chapters showed that the objectives are
theoretically in conflict, and that the potential conflict occurs when the government changes the
policies by introducing profit and efficiency objectives. Chapters 8 and 9 discussed the government’s
resistance to, and inconsistency in, implementing the new policy or making changes to SOEs’
objectives. As evidence, only 11 SOEs held the government-stated profit objective, while only 4 held
the government-stated efficiency objective. The government-stated social welfare or non-economic
objectives remained dominant or occurred more frequently as part of SOEs’ objectives compared to
economic or financial objectives. Previous findings in Section 10.1 also showed that the government
altered its objectives within 10 SOEs. In practice, only one SOE experienced the introduction of the
profit objective. The rest of the SOEs experienced changes in their social welfare or non-economic
objectives. Based on these findings, the relations were examined to estimate whether the objectives
showed relations or effects on SOEs’ financial performance. This also indicates that Indonesian SOEs

170
are based on labour intensive which is influenced by the government objective regarding the
employment.
Section 10.2 indicated that Indonesian SOEs’ poor and inefficient performance resulted from their
heavy reliance on external financial support and non-core business incomes. Most of the external
financial support was short-term loans that may generate high interest. As most SOEs were
obligated to pay interest, they found it difficult to contribute to the state budget and community
development. This situation was supported by the small to negative performance of tax, dividends
and CSR funds. Meanwhile, employment remained the problem of SOEs when overstaffing led to
poor productivity, as shown in SOEs’ employment intensity.
The tests showed different results compared to the prior qualitative findings in Chapters 8 and 9
regarding the relations between the government-stated objectives and SOEs’ performance. Further
tests indicated the relations between the objectives and SOEs’ performance, even though the
numbers were limited. Tables 10.10–10.13 show that some objectives do not have relations with
SOEs’ performance. Two of the government’s major concerns—profit and efficiency expectations as
part of the new government policies and objectives—had a limited influence on SOEs’ financial
performance. This result is different from hypothesis two’s expectation that changes to SOEs and
new privatised firms’ objectives as a result of introducing the profit and efficiency objective would
improve SOEs or privatised firms’ performance.
Chapters 7–9 showed that the government remained concerned about the social welfare and non-
economic objectives. These two sample t-test results differed from hypotheses one and two’s
expectations in this thesis, which expected that the introduction of the privatisation policy would
alter the government’s objectives. The role of SOEs as government vehicles regarding the provision
of public utilities and national economic development became part of the government-stated
objectives for SOEs. The test results showed limited relations between the government-stated
objectives for provision of public utilities and national economic matters with SOEs’ financial
performance. From these limited relations, the results indicated that the objectives tended to
generate negative effects on SOEs’ financial performance. These results support earlier studies
regarding SOEs’ social welfare duties, which tended to prevent SOEs from being profitable or
efficient (Bai et al., 2000; Boycko et al., 1996). The government-stated objectives for community
development matters showed positive relations with SOEs’ financial performance. This result is
explained by the Indonesian government’s requirement for SOEs to spend a portion of their profits
on community development programs. Meanwhile, the analysis showed that none of the
government-stated objectives had relations with SOEs’ social welfare representative financial
performance unless the SOEs had external financial support. This was shown in the positive result in
171
the relations between the objectives and SOEs’ effective tax and dividend rates when interest was
not part of the measurement.
In summary, the Indonesian government’s inconsistency in, and resistance to, making changes
regarding its government-stated objectives for each SOE had two implications. The first consequence
was potential conflicting objectives, which appeared because the government resisted removing
social welfare and non-economic objectives as part of its stated objectives for SOEs. In practice,
conflicting objectives occurred between the government and SOEs’ objectives; while for the
government-stated objectives, the objectives were theoretically in conflict. The second consequence
was limited relations between the government-stated objectives and SOEs’ performance. Limited
government-stated objectives influence SOEs’ financial performance. From these limited relations,
the government-stated objectives had a tendency to worsen SOEs’ financial performance.

172
Chapter 11:
The Success of State-Owned Enterprises in Achieving
Government-Stated Objectives
This chapter examines the relations between government-stated objectives and SOEs’ financial
performance. It focuses on SOEs’ performance and government objectives following the
introduction of UU BUMN no. 19/2003 and PP Privatisation no. 33/2005. This chapter emphasises
the test based on the results from Chapters 6 to 10 using multivariate analysis. A regression test is
employed to examine and estimate the relations and implications of government-stated objectives
on SOEs’ financial performance following the introduction of privatisation policies in 2003.
The analyses’ results from Chapters 6 to 9 show that government-stated objectives are theoretically
in conflict. The government’s inconsistency and resistance to make changes regarding its stated
objectives for SOEs may result in conflicting objectives. These theoretically conflicting objectives are
also shown through the two sample t-test results, which indicate that there are limited relations
between the objectives and performance. These limited relations indicate that the government-
stated objectives may prevent better performance from SOEs. Based on these results, the regression
method is employed to examine and estimate the relations between government-stated objectives
and SOEs’ financial performance. This chapter is separated into four sections: Section 11.1 describes
the data; Section 11.2 presents the regression test results; Section 11.3 discusses potential
conflicting objectives; and Section 11.4 presents the findings and discussion.
11.1 Measurable Data and Hypotheses
As mentioned in Chapters 8 and 9, policies distinguish SOEs into three groups: publicly listed firms,
non-privatisation SOEs without privatisation restrictions and non-privatisation SOEs with
privatisation restrictions. A significant amount of data was classified and combined to obtain
sufficient data for analysis in this thesis. Twenty-six objectives were combined to give a total of 21
objectives, comprising seven economic or financial objectives and 14 social welfare or non-economic
objectives. Further, 14 financial performance indicators were employed in this thesis, as mentioned
in Section 10.1. For this thesis, the financial performance indicators were considered dependent
variables, while the objectives were treated as independent variables. To analyse these relations,
this thesis developed the model shown in Equation (1). The model included five control variables:
leverage, size (ln asset), company type, year, and SOE industry. As mentioned in Chapter 5, there is a

173
large range in the size of SOEs. Therefore, natural log asset was applied to control this large range of
SOEs. The model was developed as:
Financial Performance =
β0+ Σ βn objectives + β23 Size +β24 leverage + β25Company type + Σ n=1 Year + Σ n=1 Industrial sector + Ɛ (1)
Or in detail, the model is:
Financial performance
=
β0 + β1 profit + β2 efficiency + β3 corporate principles + β4 corporate value and reputation
+ β5 provision of public goods and services + β6 quality + β7 environment and resources
utilisation + β8 technology and research + β9 national economic + β10 national
development + β 11 national security + β12 industrialisation + β13 OHS + β14 community
development + β15 community prosperity + β16 community needs + β17 government policy + β18 government needs/assignments + β19 state budget + β20 market supply + β 21
market and price stabilisation + β22 Ln Asset + β23 leverage +β 24 company type + Σ n=1 year + Σ n=1 industrial sector + Ɛ
(1) Note: The model explanations are given in Appendix 1.
For this test, the hypotheses are tested based on the knowledge gaps from the literature review in
Chapter 2. The hypotheses are:
H1: The introduction of new objectives resulting from the privatisation policy and the liberalisation of the market economy cause conflicting objectives for SOEs and new privatised firms’ objectives and business activities. H2: Changes to SOEs and new privatised objectives and business activities resulting from the privatisation policy improve SOEs and new privatised firms’ performance.
11.2 Test Result
The results from the qualitative analyses in Chapters 8 and 9 show that the introduction of the
privatisation policy and the liberalisation of the market economy result in changes to government-
stated objectives for SOEs. These changes are shown in the introduction of new objectives—profit
and efficiency—as part of the government objectives. The introduction of these new objectives is
aimed at improving SOEs’ financial performance. Therefore, for this thesis, the profit and efficiency
objectives are expected to complement SOEs’ financial performance. In contrast, the objectives are
theoretically in conflict because the Indonesian government is inconsistent in implementing the
policies. The social welfare and non-economic objectives are still the dominant part of the
government-stated objectives for each SOE. Early studies of SOEs showed that the social welfare
duties and objectives have a tendency to prevent SOEs from being profitable and efficient (Bai et al.,
2000; Boycko et al., 1996). Based on these studies, the social welfare and non-economic objectives

174
are conflicting and prevent SOEs from being profitable and efficient. These findings are used as
predictions for further tests regarding relations between the objectives and SOEs’ performance.
Tables 11.1 and 11.2 present the regression results of the relations between the government’s
objectives and SOEs’ performance. The results show that the government-stated profit objective
does not have any relations with the financial performance of all publicly listed SOEs. It also shows
no relations with the financial performance of most non-privatised SOEs without privatisation
restrictions, except for the performance of ROE. The objective increases 2.3 points for the SOEs’ ROE
performance. The government-stated profit objective is associated positively with non-privatised
SOEs with privatisation restrictions’ EBIT margin and ROA for around 8.09 points. In contrast, the
objective hinders SOEs’ operating income, market/book value of equity and net income
performance. The efficiency objective does not affect any of the SOEs’ financial performance.
Focusing exclusively on each group of SOEs, Table 11.1 shows that non-privatised SOEs with
privatisation restrictions show more relations between other government-stated economic or
financial objectives and SOEs’ financial performance. The government-stated objectives for
compliance with corporate principles, corporate value and reputation improvement, environment
and resource utilisation, technology and research, and quality—show their relation with SOEs’ ROA,
EBIT margin, operating profit return, asset turnover, and net income performance. The government-
stated compliance with corporate principle objective may prevent SOEs from improving their
financial performance, except for operating income, asset turnover, and net income performance.
The other government economic or financial objectives may increase SOEs’ ROA, EBIT margin and
operating profit margin. However, the government-stated objective for technology and research
may prevent non-privatised SOEs with privatisation restrictions from improving their net income
performance.
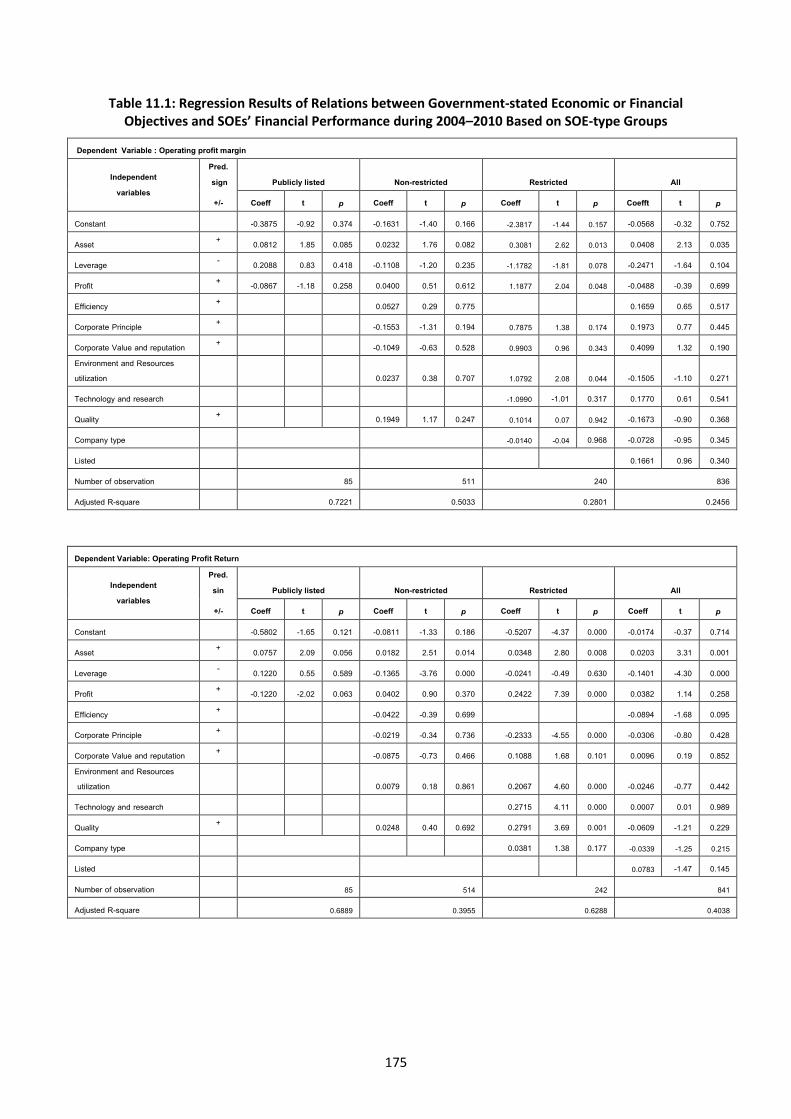
175
Table 11.1: Regression Results of Relations between Government-stated Economic or Financial Objectives and SOEs’ Financial Performance during 2004–2010 Based on SOE-type Groups
Dependent Variable : Operating profit margin
Independent variables
Pred. sign Publicly listed Non-restricted Restricted All
+/- Coeff t p Coeff t p Coeff t p Coefft t p
Constant -0.3875 -0.92 0.374 -0.1631 -1.40 0.166 -2.3817 -1.44 0.157 -0.0568 -0.32 0.752
Asset + 0.0812 1.85 0.085 0.0232 1.76 0.082 0.3081 2.62 0.013 0.0408 2.13 0.035
Leverage - 0.2088 0.83 0.418 -0.1108 -1.20 0.235 -1.1782 -1.81 0.078 -0.2471 -1.64 0.104
Profit + -0.0867 -1.18 0.258 0.0400 0.51 0.612 1.1877 2.04 0.048 -0.0488 -0.39 0.699
Efficiency + 0.0527 0.29 0.775 0.1659 0.65 0.517
Corporate Principle + -0.1553 -1.31 0.194 0.7875 1.38 0.174 0.1973 0.77 0.445
Corporate Value and reputation + -0.1049 -0.63 0.528 0.9903 0.96 0.343 0.4099 1.32 0.190 Environment and Resources utilization
0.0237 0.38 0.707 1.0792 2.08 0.044 -0.1505 -1.10 0.271
Technology and research -1.0990 -1.01 0.317 0.1770 0.61 0.541
Quality + 0.1949 1.17 0.247 0.1014 0.07 0.942 -0.1673 -0.90 0.368
Company type -0.0140 -0.04 0.968 -0.0728 -0.95 0.345
Listed 0.1661 0.96 0.340
Number of observation 85 511 240 836
Adjusted R-square 0.7221 0.5033 0.2801 0.2456
Dependent Variable: Operating Profit Return
Independent variables
Pred. sin Publicly listed Non-restricted Restricted All
+/- Coeff t p Coeff t p Coeff t p Coeff t p
Constant -0.5802 -1.65 0.121 -0.0811 -1.33 0.186 -0.5207 -4.37 0.000 -0.0174 -0.37 0.714
Asset + 0.0757 2.09 0.056 0.0182 2.51 0.014 0.0348 2.80 0.008 0.0203 3.31 0.001
Leverage - 0.1220 0.55 0.589 -0.1365 -3.76 0.000 -0.0241 -0.49 0.630 -0.1401 -4.30 0.000
Profit + -0.1220 -2.02 0.063 0.0402 0.90 0.370 0.2422 7.39 0.000 0.0382 1.14 0.258
Efficiency + -0.0422 -0.39 0.699 -0.0894 -1.68 0.095
Corporate Principle + -0.0219 -0.34 0.736 -0.2333 -4.55 0.000 -0.0306 -0.80 0.428
Corporate Value and reputation + -0.0875 -0.73 0.466 0.1088 1.68 0.101 0.0096 0.19 0.852 Environment and Resources utilization
0.0079 0.18 0.861 0.2067 4.60 0.000 -0.0246 -0.77 0.442
Technology and research 0.2715 4.11 0.000 0.0007 0.01 0.989
Quality + 0.0248 0.40 0.692 0.2791 3.69 0.001 -0.0609 -1.21 0.229
Company type 0.0381 1.38 0.177 -0.0339 -1.25 0.215
Listed 0.0783 -1.47 0.145
Number of observation 85 514 242 841
Adjusted R-square 0.6889 0.3955 0.6288 0.4038
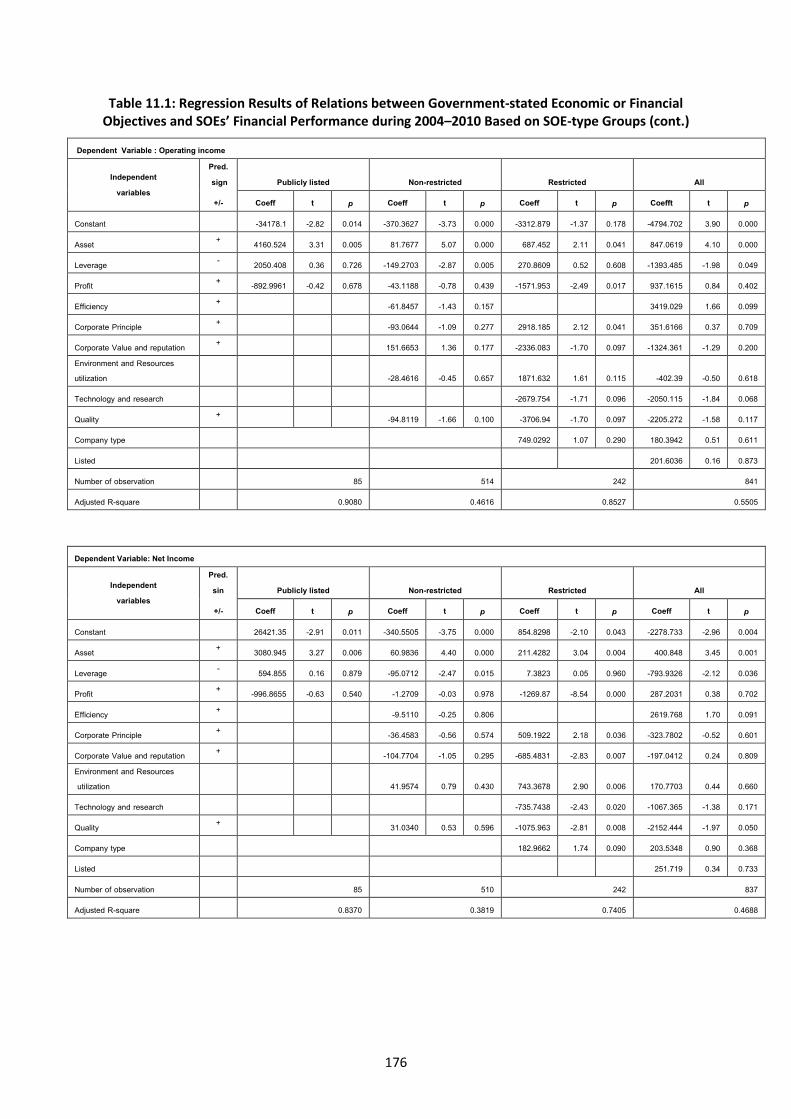
176
Table 11.1: Regression Results of Relations between Government-stated Economic or Financial Objectives and SOEs’ Financial Performance during 2004–2010 Based on SOE-type Groups (cont.)
Dependent Variable : Operating income
Independent variables
Pred. sign Publicly listed Non-restricted Restricted All
+/- Coeff t p Coeff t p Coeff t p Coefft t p
Constant -34178.1 -2.82 0.014 -370.3627 -3.73 0.000 -3312.879 -1.37 0.178 -4794.702 3.90 0.000
Asset + 4160.524 3.31 0.005 81.7677 5.07 0.000 687.452 2.11 0.041 847.0619 4.10 0.000
Leverage - 2050.408 0.36 0.726 -149.2703 -2.87 0.005 270.8609 0.52 0.608 -1393.485 -1.98 0.049
Profit + -892.9961 -0.42 0.678 -43.1188 -0.78 0.439 -1571.953 -2.49 0.017 937.1615 0.84 0.402
Efficiency + -61.8457 -1.43 0.157 3419.029 1.66 0.099
Corporate Principle + -93.0644 -1.09 0.277 2918.185 2.12 0.041 351.6166 0.37 0.709
Corporate Value and reputation + 151.6653 1.36 0.177 -2336.083 -1.70 0.097 -1324.361 -1.29 0.200 Environment and Resources utilization
-28.4616 -0.45 0.657 1871.632 1.61 0.115 -402.39 -0.50 0.618
Technology and research -2679.754 -1.71 0.096 -2050.115 -1.84 0.068
Quality + -94.8119 -1.66 0.100 -3706.94 -1.70 0.097 -2205.272 -1.58 0.117
Company type 749.0292 1.07 0.290 180.3942 0.51 0.611
Listed 201.6036 0.16 0.873
Number of observation 85 514 242 841
Adjusted R-square 0.9080 0.4616 0.8527 0.5505
Dependent Variable: Net Income
Independent variables
Pred. sin Publicly listed Non-restricted Restricted All
+/- Coeff t p Coeff t p Coeff t p Coeff t p
Constant 26421.35 -2.91 0.011 -340.5505 -3.75 0.000 854.8298 -2.10 0.043 -2278.733 -2.96 0.004
Asset + 3080.945 3.27 0.006 60.9836 4.40 0.000 211.4282 3.04 0.004 400.848 3.45 0.001
Leverage - 594.855 0.16 0.879 -95.0712 -2.47 0.015 7.3823 0.05 0.960 -793.9326 -2.12 0.036
Profit + -996.8655 -0.63 0.540 -1.2709 -0.03 0.978 -1269.87 -8.54 0.000 287.2031 0.38 0.702
Efficiency + -9.5110 -0.25 0.806 2619.768 1.70 0.091
Corporate Principle + -36.4583 -0.56 0.574 509.1922 2.18 0.036 -323.7802 -0.52 0.601
Corporate Value and reputation + -104.7704 -1.05 0.295 -685.4831 -2.83 0.007 -197.0412 0.24 0.809 Environment and Resources utilization
41.9574 0.79 0.430 743.3678 2.90 0.006 170.7703 0.44 0.660
Technology and research -735.7438 -2.43 0.020 -1067.365 -1.38 0.171
Quality + 31.0340 0.53 0.596 -1075.963 -2.81 0.008 -2152.444 -1.97 0.050
Company type 182.9662 1.74 0.090 203.5348 0.90 0.368
Listed 251.719 0.34 0.733
Number of observation 85 510 242 837
Adjusted R-square 0.8370 0.3819 0.7405 0.4688

177
Table 11.1: Regression Results of Relations between Government-stated Economic or Financial Objectives and SOEs’ Financial Performance during 2004–2010 Based on SOE-type Groups (cont.)
Dependent Variable: ROA
Independent variables
Pred.sign Publicly listed Non-restricted Restricted All
+/- Coeff t p Coeff t p Coeff t p Coeff t p
Constant -0.6077 -1.66 0.120 -0.1024 -1.74 0.085 -0.4252 -3.95 0.000 -0.0137 -0.30 0.767
Asset + 0.0814 2.14 0.051 0.0218 3.02 0.003 0.0280 2.26 0.029 0.0202 3.35 0.001
Leverage - 0.0837 0.35 0.733 -0.1561 -3.78 0.000 -0.0217 -0.41 0.681 -0.1466 -4.32 0.000
Profit + -0.1314 -2.06 0.058 0.0603 1.28 0.205 0.2342 8.09 0.000 0.0240 0.77 0.442
Efficiency + -0.0427 -0.40 0.691 -0.0865 -1.66 0.099
Corporate Principle + -0.0420 -0.65 0.517 -0.2370 -5.00 0.000 -0.0129 -0.34 0.735
Corporate Value and reputation + -0.0917 -0.84 0.405 0.1296 2.61 0.013 0.0182 0.43 0.664
Environment and Resources utilization 0.0185 0.44 0.665 0.3256 3.64 0.001 -0.3300 -1.01 0.316
Technology and research 0.2949 4.05 0.000 0.0021 0.04 0.965
Quality + 0.0049 0.08 0.933 0.3256 4.44 0.000 -0.0521 -1.14 0.257
Company type
1.28 0.208 -0.0319 -1.19 0.236
Listed 0.0815 1.53 0.127
Number of observation 85 514 242 841
Adjusted R-square 0.6800 0.3872 0.6033 0.3941
Dependent Variable : EBIT Margin
Independent variables
Pred. Sign Publicly listed Non-restricted Restricted All
+/- Coeff t p Coeff t p Coeff t p Coeff t p
Constant -0.6077 -1.66 0.120 -0.4252 -1.74 0.085 -0.1024 3.95 0.000 -0.0137 0.30 0.767
Asset + 0.0814 2.14 0.051 0.0280 3.02 0.003 0.0218 2.26 0.029 0.0202 3.35 0.001
Leverage - 0.0837 0.35 0.733 -0.0217 -3.78 0.000 -0.1561 -0.41 0.681 -0.1466 -4.32 0.000
Profit + -0.1314 -2.06 0.058 0.2342 1.28 0.205 0.0603 8.09 0.000 0.0240 0.77 0.442
Efficiency + -0.40 0.691 -0.0427 -0.0865 -1.66 0.099
Corporate Principle + -0.2370 -0.65 0.517 -0.0420 -5.00 0.000 -0.0129 -0.34 0.735
Corporate Value and reputation + 0.1296 -0.84 0.405 -0.0917 2.61 0.013 0.0182 0.43 0.664
Environment and Resources utilization 0.3256 0.44 0.665 0.0185 4.05 0.000 -0.0330 -1.01 0.316
Technology and research 0.2949 5.14 0.000 0.0021 0.04 0.965
Quality + 0.3256 0.08 0.933 0.0049 4.44 0.000 -0.0521 0.09 0.931
Company type 1.28 0.208 -0.0319 -1.19 0.236
Listed 0.0815 1.53 0.127
Number of observation 85 514 242 841
Adjusted R-square 0.6800 0.3872 0.6033 0.3941
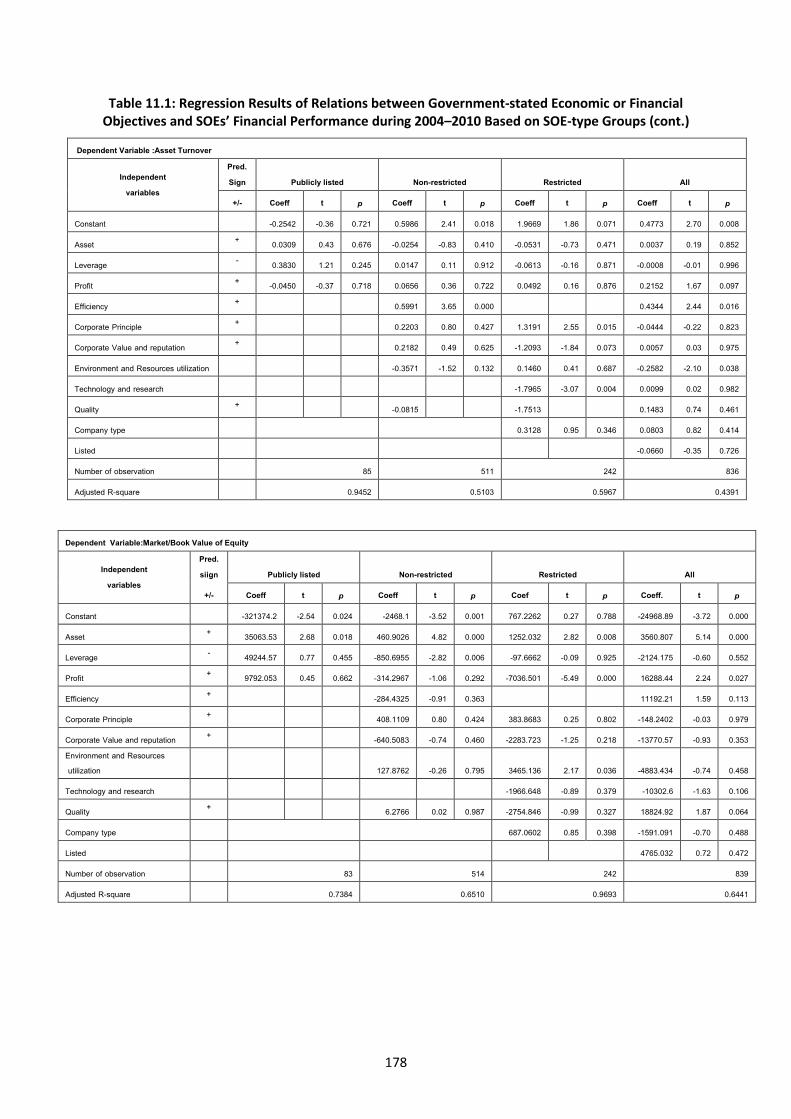
178
Table 11.1: Regression Results of Relations between Government-stated Economic or Financial Objectives and SOEs’ Financial Performance during 2004–2010 Based on SOE-type Groups (cont.)
Dependent Variable :Asset Turnover
Independent variables
Pred. Sign Publicly listed Non-restricted Restricted All
+/- Coeff t p Coeff t p Coeff t p Coeff t p
Constant -0.2542 -0.36 0.721 0.5986 2.41 0.018 1.9669 1.86 0.071 0.4773 2.70 0.008
Asset + 0.0309 0.43 0.676 -0.0254 -0.83 0.410 -0.0531 -0.73 0.471 0.0037 0.19 0.852
Leverage - 0.3830 1.21 0.245 0.0147 0.11 0.912 -0.0613 -0.16 0.871 -0.0008 -0.01 0.996
Profit + -0.0450 -0.37 0.718 0.0656 0.36 0.722 0.0492 0.16 0.876 0.2152 1.67 0.097
Efficiency + 0.5991 3.65 0.000 0.4344 2.44 0.016
Corporate Principle + 0.2203 0.80 0.427 1.3191 2.55 0.015 -0.0444 -0.22 0.823
Corporate Value and reputation + 0.2182 0.49 0.625 -1.2093 -1.84 0.073 0.0057 0.03 0.975
Environment and Resources utilization -0.3571 -1.52 0.132 0.1460 0.41 0.687 -0.2582 -2.10 0.038
Technology and research -1.7965 -3.07 0.004 0.0099 0.02 0.982
Quality + -0.0815 -1.7513 0.1483 0.74 0.461
Company type 0.3128 0.95 0.346 0.0803 0.82 0.414
Listed -0.0660 -0.35 0.726
Number of observation 85 511 242 836
Adjusted R-square 0.9452 0.5103 0.5967 0.4391
Dependent Variable:Market/Book Value of Equity
Independent variables
Pred.siign Publicly listed Non-restricted Restricted All
+/- Coeff t p Coeff t p Coef t p Coeff. t p
Constant -321374.2 -2.54 0.024 -2468.1 -3.52 0.001 767.2262 0.27 0.788 -24968.89 -3.72 0.000
Asset + 35063.53 2.68 0.018 460.9026 4.82 0.000 1252.032 2.82 0.008 3560.807 5.14 0.000
Leverage - 49244.57 0.77 0.455 -850.6955 -2.82 0.006 -97.6662 -0.09 0.925 -2124.175 -0.60 0.552
Profit + 9792.053 0.45 0.662 -314.2967 -1.06 0.292 -7036.501 -5.49 0.000 16288.44 2.24 0.027
Efficiency + -284.4325 -0.91 0.363 11192.21 1.59 0.113
Corporate Principle + 408.1109 0.80 0.424 383.8683 0.25 0.802 -148.2402 -0.03 0.979
Corporate Value and reputation + -640.5083 -0.74 0.460 -2283.723 -1.25 0.218 -13770.57 -0.93 0.353 Environment and Resources utilization
127.8762 -0.26 0.795 3465.136 2.17 0.036 -4883.434 -0.74 0.458
Technology and research -1966.648 -0.89 0.379 -10302.6 -1.63 0.106
Quality + 6.2766 0.02 0.987 -2754.846 -0.99 0.327 18824.92 1.87 0.064
Company type 687.0602 0.85 0.398 -1591.091 -0.70 0.488
Listed 4765.032 0.72 0.472
Number of observation 83 514 242 839
Adjusted R-square 0.7384 0.6510 0.9693 0.6441

179
Table 11.1: Regression Results of Relations between Government-stated Economic or Financial Objectives and SOEs’ Financial Performance during 2004–2010 Based on SOE-type Groups (cont.)
Dependent variable : ROE
Independent variables
Pred. Sign Publicly listed Non-restricted Restricted All
+/- Coeff t p Coeff. t p Coeff. t p Coeff t p
Constant -0.1412 -1.18 0.256 -0.3046 -1.97 0.052 -0.2492 -4.54 0.000 -0.2353 -1.38 0.169
Asset + 0.0233 1.89 0.080 0.0368 1.96 0.063 0.0046 0.51 0.612 0.0260 1.58 0.117
Leverage - 0.0828 1.19 0.254 -0.1314 -1.88 0.063 0.0135 0.26 0.794 -0.0825 -1.49 0.137
Profit + -0.0335 -1.63 0.126 0.1852 2.31 0.023 -0.0404 -1.70 0.097 0.0110 0.32 0.753
Efficiency + 0.1505 1.77 0.080 0.1298 2.17 0.032
Corporate principle + -0.2475 -2.12 0.037 -0.0640 -1.64 0.110 -0.0641 -1.84 0.068
Corporate value and reputation + -0.2051 -1.07 0.288 0.0993 1.71 0.096 0.0155 0.27 0.786
Environment and resources utilisation 0.1023 1.12 0.265 0.0524 1.59 0.121 0.0562 1.12 0.265
Technology and research 0.0919 1.57 0.126 0.0075 0.15 0.884
Quality + 0.0185 0.23 0.815 -0.0545 -0.75 0.461 -0.1455 -2.02 0.029
Company type 0.0799 4.38 0.000 0.0235 0.95 0.342
Perum/listed 0.0067 0.20 0.841
No. of observations
85 512 242 839
Adjusted R-square 0.4879 0.0122 -0.0163 0.0044 Source: Indonesian SOE financial and annual reports 2003–2010. Notes: Data were collected as follows: ROA = EBIT divided by total assets; ROE = EAT divided by average equity (equity t + equity t-1); EBIT margin = EBIT divided by total sales; operating profit margin = operating income divided by total sales; operating profit return = operating income divided by total assets; asset turnover = total sales divided by total assets; The objectives were collected and calculated as dummy variables: 1 when the SOE had the government-stated objective and 0 otherwise.
Table 11.2 presents the relations between the government-stated economic or financial objectives
and SOEs’ social welfare representative financial performance. The results show limited relations
between the objectives and performance. The government-stated profit objective positively affects
publicly listed SOEs’ dividend rates, effective tax rate when interest is included in measurement and
employment intensity performance only. The profit objective only shows a positive relation with
non-privatised SOEs without privatisation restrictions’ effective tax rate when the interest is
excluded in the measurement. Meanwhile, the profit objective shows a negative effect of -3.34 and
-4.22 points for non-privatised SOEs with privatisation restrictions’ labour cost and employment
intensity respectively. The government-stated efficiency objective only presents a relation with non-
privatised SOEs without privatisation restrictions’ effective tax rate when interest is excluded in the
measurement of 2.02 points, while the objective shows a negative effect of -2.33 points for non-
privatised SOEs without privatisation restrictions’ employment intensity performance.
The other government-stated economic or financial objectives only present a few indications of
relations with SOEs’ social welfare representative financial performance. None of the other
government-stated economic or financial objectives shows relations with publicly listed SOEs’ social
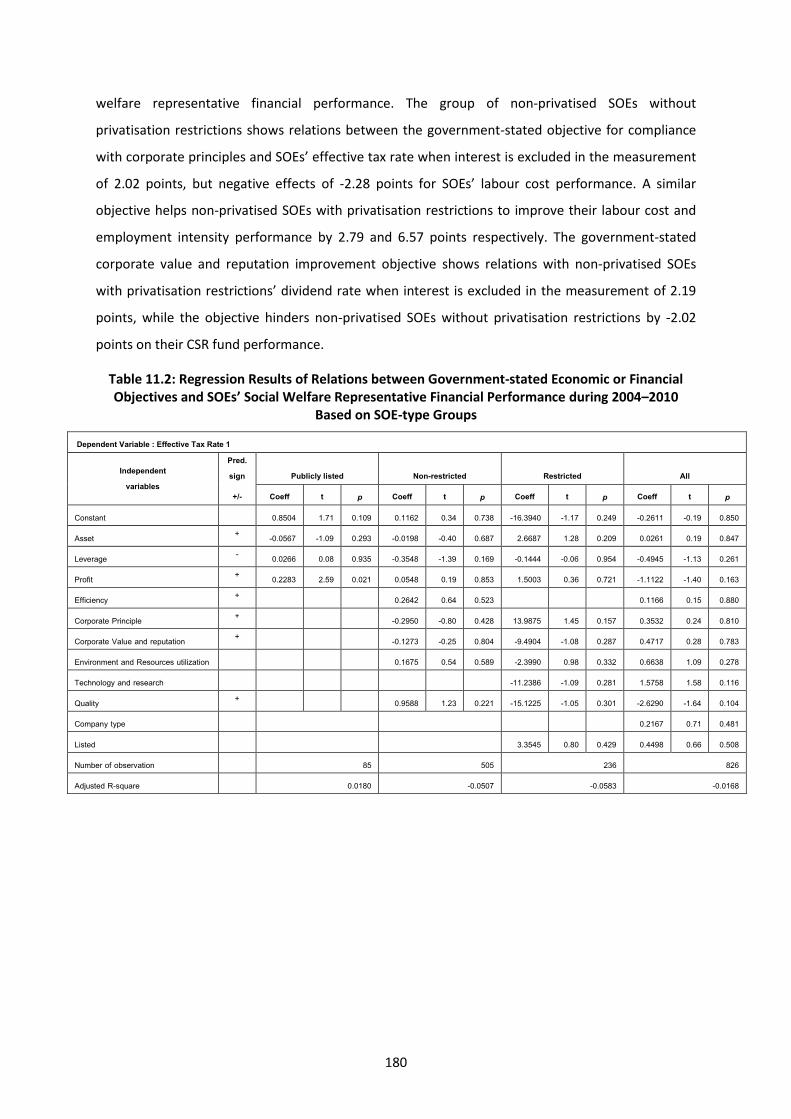
180
welfare representative financial performance. The group of non-privatised SOEs without
privatisation restrictions shows relations between the government-stated objective for compliance
with corporate principles and SOEs’ effective tax rate when interest is excluded in the measurement
of 2.02 points, but negative effects of -2.28 points for SOEs’ labour cost performance. A similar
objective helps non-privatised SOEs with privatisation restrictions to improve their labour cost and
employment intensity performance by 2.79 and 6.57 points respectively. The government-stated
corporate value and reputation improvement objective shows relations with non-privatised SOEs
with privatisation restrictions’ dividend rate when interest is excluded in the measurement of 2.19
points, while the objective hinders non-privatised SOEs without privatisation restrictions by -2.02
points on their CSR fund performance.
Table 11.2: Regression Results of Relations between Government-stated Economic or Financial Objectives and SOEs’ Social Welfare Representative Financial Performance during 2004–2010
Based on SOE-type Groups
Dependent Variable : Effective Tax Rate 1
Independent variables
Pred. sign Publicly listed Non-restricted Restricted All
+/- Coeff t p Coeff t p Coeff t p Coeff t p
Constant 0.8504 1.71 0.109 0.1162 0.34 0.738 -16.3940 -1.17 0.249 -0.2611 -0.19 0.850
Asset + -0.0567 -1.09 0.293 -0.0198 -0.40 0.687 2.6687 1.28 0.209 0.0261 0.19 0.847
Leverage - 0.0266 0.08 0.935 -0.3548 -1.39 0.169 -0.1444 -0.06 0.954 -0.4945 -1.13 0.261
Profit + 0.2283 2.59 0.021 0.0548 0.19 0.853 1.5003 0.36 0.721 -1.1122 -1.40 0.163
Efficiency + 0.2642 0.64 0.523 0.1166 0.15 0.880
Corporate Principle + -0.2950 -0.80 0.428 13.9875 1.45 0.157 0.3532 0.24 0.810
Corporate Value and reputation + -0.1273 -0.25 0.804 -9.4904 -1.08 0.287 0.4717 0.28 0.783
Environment and Resources utilization 0.1675 0.54 0.589 -2.3990 0.98 0.332 0.6638 1.09 0.278
Technology and research -11.2386 -1.09 0.281 1.5758 1.58 0.116
Quality + 0.9588 1.23 0.221 -15.1225 -1.05 0.301 -2.6290 -1.64 0.104
Company type 0.2167 0.71 0.481
Listed 3.3545 0.80 0.429 0.4498 0.66 0.508
Number of observation 85 505 236 826
Adjusted R-square 0.0180 -0.0507 -0.0583 -0.0168
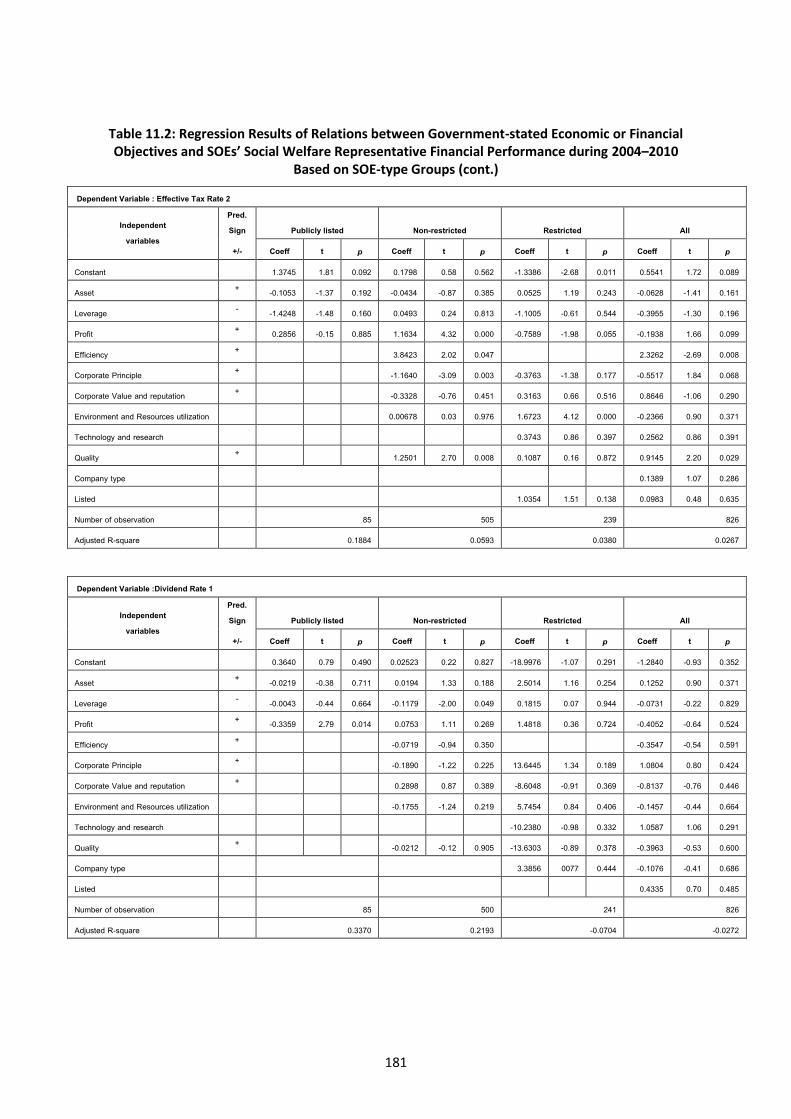
181
Table 11.2: Regression Results of Relations between Government-stated Economic or Financial Objectives and SOEs’ Social Welfare Representative Financial Performance during 2004–2010
Based on SOE-type Groups (cont.)
Dependent Variable : Effective Tax Rate 2
Independent variables
Pred. Sign Publicly listed Non-restricted Restricted All
+/- Coeff t p Coeff t p Coeff t p Coeff t p
Constant 1.3745 1.81 0.092 0.1798 0.58 0.562 -1.3386 -2.68 0.011 0.5541 1.72 0.089
Asset + -0.1053 -1.37 0.192 -0.0434 -0.87 0.385 0.0525 1.19 0.243 -0.0628 -1.41 0.161
Leverage - -1.4248 -1.48 0.160 0.0493 0.24 0.813 -1.1005 -0.61 0.544 -0.3955 -1.30 0.196
Profit + 0.2856 -0.15 0.885 1.1634 4.32 0.000 -0.7589 -1.98 0.055 -0.1938 1.66 0.099
Efficiency + 3.8423 2.02 0.047 2.3262 -2.69 0.008
Corporate Principle + -1.1640 -3.09 0.003 -0.3763 -1.38 0.177 -0.5517 1.84 0.068
Corporate Value and reputation + -0.3328 -0.76 0.451 0.3163 0.66 0.516 0.8646 -1.06 0.290
Environment and Resources utilization 0.00678 0.03 0.976 1.6723 4.12 0.000 -0.2366 0.90 0.371
Technology and research 0.3743 0.86 0.397 0.2562 0.86 0.391
Quality + 1.2501 2.70 0.008 0.1087 0.16 0.872 0.9145 2.20 0.029
Company type 0.1389 1.07 0.286
Listed 1.0354 1.51 0.138 0.0983 0.48 0.635
Number of observation 85 505 239 826
Adjusted R-square 0.1884 0.0593 0.0380 0.0267
Dependent Variable :Dividend Rate 1
Independent variables
Pred. Sign Publicly listed Non-restricted Restricted All
+/- Coeff t p Coeff t p Coeff t p Coeff t p
Constant 0.3640 0.79 0.490 0.02523 0.22 0.827 -18.9976 -1.07 0.291 -1.2840 -0.93 0.352
Asset + -0.0219 -0.38 0.711 0.0194 1.33 0.188 2.5014 1.16 0.254 0.1252 0.90 0.371
Leverage - -0.0043 -0.44 0.664 -0.1179 -2.00 0.049 0.1815 0.07 0.944 -0.0731 -0.22 0.829
Profit + -0.3359 2.79 0.014 0.0753 1.11 0.269 1.4818 0.36 0.724 -0.4052 -0.64 0.524
Efficiency + -0.0719 -0.94 0.350 -0.3547 -0.54 0.591
Corporate Principle + -0.1890 -1.22 0.225 13.6445 1.34 0.189 1.0804 0.80 0.424
Corporate Value and reputation + 0.2898 0.87 0.389 -8.6048 -0.91 0.369 -0.8137 -0.76 0.446
Environment and Resources utilization -0.1755 -1.24 0.219 5.7454 0.84 0.406 -0.1457 -0.44 0.664
Technology and research -10.2380 -0.98 0.332 1.0587 1.06 0.291
Quality + -0.0212 -0.12 0.905 -13.6303 -0.89 0.378 -0.3963 -0.53 0.600
Company type 3.3856 0077 0.444 -0.1076 -0.41 0.686
Listed 0.4335 0.70 0.485
Number of observation 85 500 241 826
Adjusted R-square 0.3370 0.2193 -0.0704 -0.0272
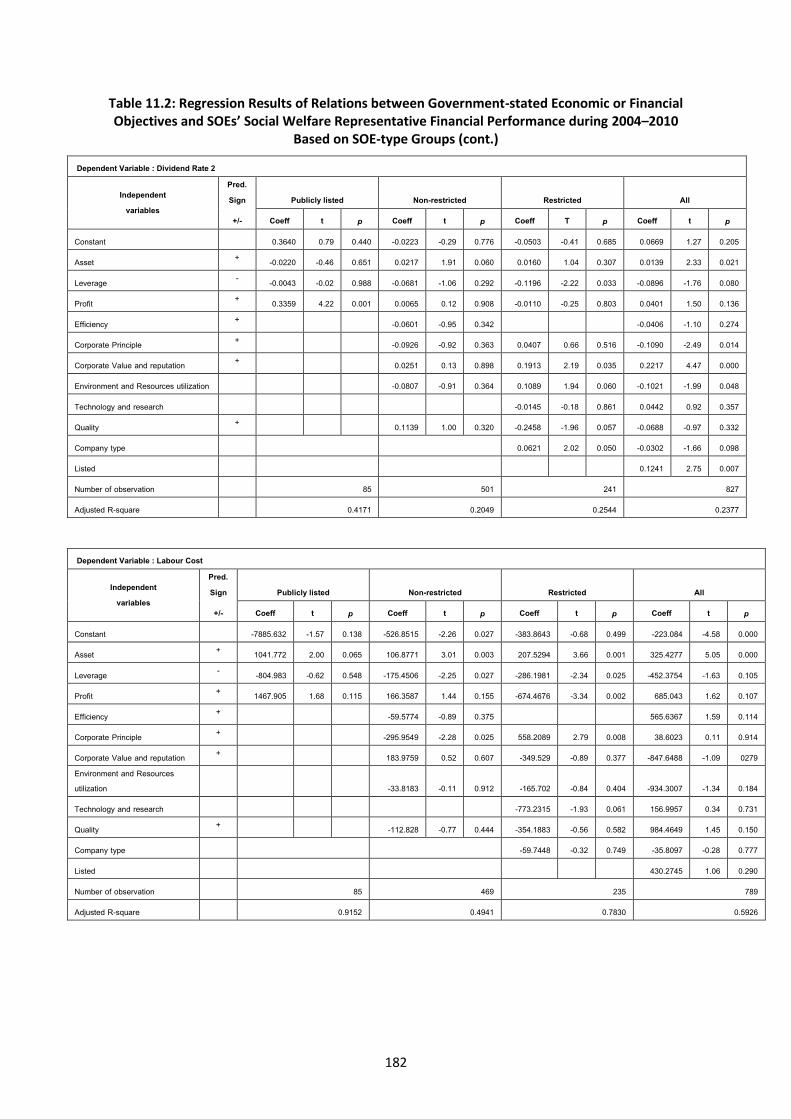
182
Table 11.2: Regression Results of Relations between Government-stated Economic or Financial Objectives and SOEs’ Social Welfare Representative Financial Performance during 2004–2010
Based on SOE-type Groups (cont.)
Dependent Variable : Dividend Rate 2
Independent variables
Pred. Sign Publicly listed Non-restricted Restricted All
+/- Coeff t p Coeff t p Coeff T p Coeff t p
Constant 0.3640 0.79 0.440 -0.0223 -0.29 0.776 -0.0503 -0.41 0.685 0.0669 1.27 0.205
Asset + -0.0220 -0.46 0.651 0.0217 1.91 0.060 0.0160 1.04 0.307 0.0139 2.33 0.021
Leverage - -0.0043 -0.02 0.988 -0.0681 -1.06 0.292 -0.1196 -2.22 0.033 -0.0896 -1.76 0.080
Profit + 0.3359 4.22 0.001 0.0065 0.12 0.908 -0.0110 -0.25 0.803 0.0401 1.50 0.136
Efficiency + -0.0601 -0.95 0.342 -0.0406 -1.10 0.274
Corporate Principle + -0.0926 -0.92 0.363 0.0407 0.66 0.516 -0.1090 -2.49 0.014
Corporate Value and reputation + 0.0251 0.13 0.898 0.1913 2.19 0.035 0.2217 4.47 0.000
Environment and Resources utilization -0.0807 -0.91 0.364 0.1089 1.94 0.060 -0.1021 -1.99 0.048
Technology and research -0.0145 -0.18 0.861 0.0442 0.92 0.357
Quality + 0.1139 1.00 0.320 -0.2458 -1.96 0.057 -0.0688 -0.97 0.332
Company type 0.0621 2.02 0.050 -0.0302 -1.66 0.098
Listed 0.1241 2.75 0.007
Number of observation 85 501 241 827
Adjusted R-square 0.4171 0.2049 0.2544 0.2377
Dependent Variable : Labour Cost
Independent variables
Pred. Sign Publicly listed Non-restricted Restricted All
+/- Coeff t p Coeff t p Coeff t p Coeff t p
Constant -7885.632 -1.57 0.138 -526.8515 -2.26 0.027 -383.8643 -0.68 0.499 -223.084 -4.58 0.000
Asset + 1041.772 2.00 0.065 106.8771 3.01 0.003 207.5294 3.66 0.001 325.4277 5.05 0.000
Leverage - -804.983 -0.62 0.548 -175.4506 -2.25 0.027 -286.1981 -2.34 0.025 -452.3754 -1.63 0.105
Profit + 1467.905 1.68 0.115 166.3587 1.44 0.155 -674.4676 -3.34 0.002 685.043 1.62 0.107
Efficiency + -59.5774 -0.89 0.375 565.6367 1.59 0.114
Corporate Principle + -295.9549 -2.28 0.025 558.2089 2.79 0.008 38.6023 0.11 0.914
Corporate Value and reputation + 183.9759 0.52 0.607 -349.529 -0.89 0.377 -847.6488 -1.09 0279 Environment and Resources utilization
-33.8183 -0.11 0.912 -165.702 -0.84 0.404 -934.3007 -1.34 0.184
Technology and research -773.2315 -1.93 0.061 156.9957 0.34 0.731
Quality + -112.828 -0.77 0.444 -354.1883 -0.56 0.582 984.4649 1.45 0.150
Company type -59.7448 -0.32 0.749 -35.8097 -0.28 0.777
Listed 430.2745 1.06 0.290
Number of observation 85 469 235 789
Adjusted R-square 0.9152 0.4941 0.7830 0.5926
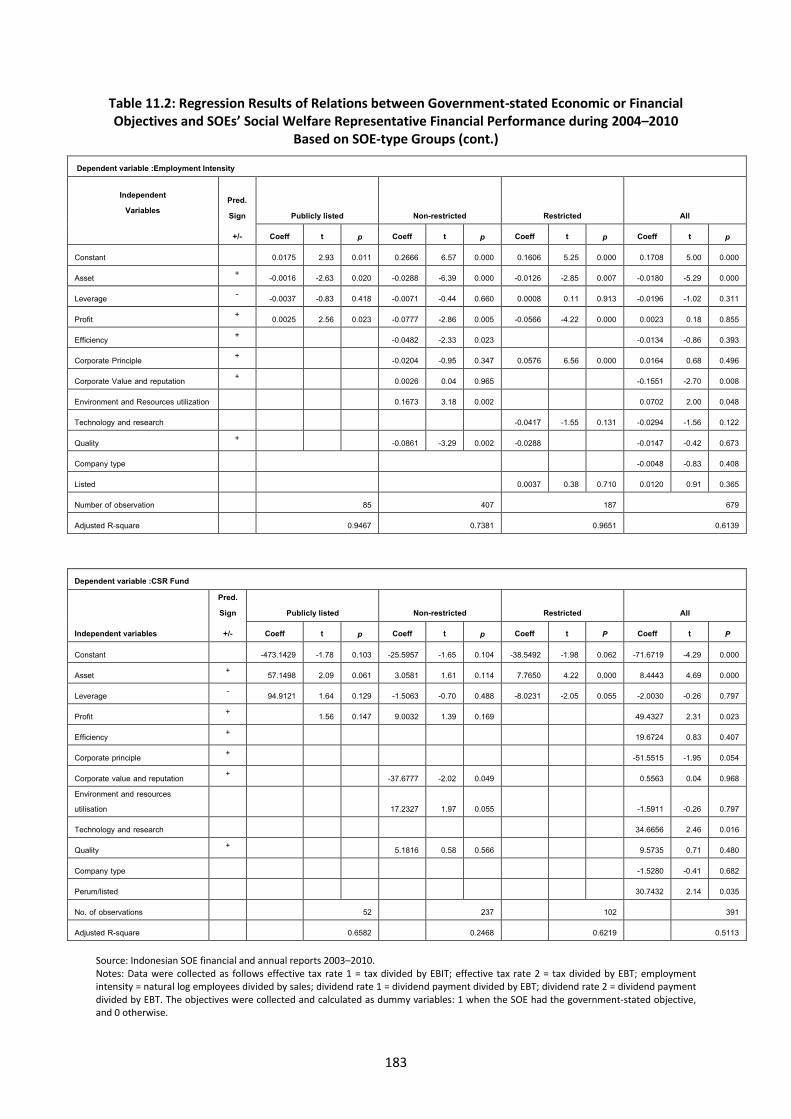
183
Table 11.2: Regression Results of Relations between Government-stated Economic or Financial Objectives and SOEs’ Social Welfare Representative Financial Performance during 2004–2010
Based on SOE-type Groups (cont.)
Dependent variable :Employment Intensity
Independent Variables
Pred. Sign Publicly listed Non-restricted Restricted All
+/- Coeff t p Coeff t p Coeff t p Coeff t p
Constant 0.0175 2.93 0.011 0.2666 6.57 0.000 0.1606 5.25 0.000 0.1708 5.00 0.000
Asset + -0.0016 -2.63 0.020 -0.0288 -6.39 0.000 -0.0126 -2.85 0.007 -0.0180 -5.29 0.000
Leverage - -0.0037 -0.83 0.418 -0.0071 -0.44 0.660 0.0008 0.11 0.913 -0.0196 -1.02 0.311
Profit + 0.0025 2.56 0.023 -0.0777 -2.86 0.005 -0.0566 -4.22 0.000 0.0023 0.18 0.855
Efficiency + -0.0482 -2.33 0.023 -0.0134 -0.86 0.393
Corporate Principle + -0.0204 -0.95 0.347 0.0576 6.56 0.000 0.0164 0.68 0.496
Corporate Value and reputation + 0.0026 0.04 0.965 -0.1551 -2.70 0.008
Environment and Resources utilization 0.1673 3.18 0.002 0.0702 2.00 0.048
Technology and research -0.0417 -1.55 0.131 -0.0294 -1.56 0.122
Quality + -0.0861 -3.29 0.002 -0.0288 -0.0147 -0.42 0.673
Company type -0.0048 -0.83 0.408
Listed 0.0037 0.38 0.710 0.0120 0.91 0.365
Number of observation 85 407 187 679
Adjusted R-square 0.9467 0.7381 0.9651 0.6139
Dependent variable :CSR Fund
Independent variables
Pred. Sign Publicly listed Non-restricted Restricted All
+/- Coeff t p Coeff t p Coeff t P Coeff t P
Constant -473.1429 -1.78 0.103 -25.5957 -1.65 0.104 -38.5492 -1.98 0.062 -71.6719 -4.29 0.000
Asset + 57.1498 2.09 0.061 3.0581 1.61 0.114 7.7650 4.22 0.000 8.4443 4.69 0.000
Leverage - 94.9121 1.64 0.129 -1.5063 -0.70 0.488 -8.0231 -2.05 0.055 -2.0030 -0.26 0.797
Profit + 1.56 0.147 9.0032 1.39 0.169 49.4327 2.31 0.023
Efficiency + 19.6724 0.83 0.407
Corporate principle + -51.5515 -1.95 0.054
Corporate value and reputation + -37.6777 -2.02 0.049 0.5563 0.04 0.968 Environment and resources utilisation
17.2327 1.97 0.055 -1.5911 -0.26 0.797
Technology and research 34.6656 2.46 0.016
Quality + 5.1816 0.58 0.566 9.5735 0.71 0.480
Company type -1.5280 -0.41 0.682
Perum/listed 30.7432 2.14 0.035
No. of observations 52 237 102 391
Adjusted R-square 0.6582 0.2468 0.6219 0.5113 Source: Indonesian SOE financial and annual reports 2003–2010. Notes: Data were collected as follows effective tax rate 1 = tax divided by EBIT; effective tax rate 2 = tax divided by EBT; employment intensity = natural log employees divided by sales; dividend rate 1 = dividend payment divided by EBT; dividend rate 2 = dividend payment divided by EBT. The objectives were collected and calculated as dummy variables: 1 when the SOE had the government-stated objective, and 0 otherwise.
184
Tables 11.3 and 11.4 present the regression results of the relations between government-stated
social welfare or non-economic objectives and SOEs’ financial performance. The government-stated
social welfare or non-economic objectives show limited relations with SOEs’ financial performance.
In Table 11.3, publicly listed SOEs only show some relations between the government objectives and
SOEs’ performance. The government-stated objective for the provision of public goods and services
only shows relations with publicly listed SOEs’ operating profit margin, asset turnover and ROE
performance. The objective may worsen SOEs’ operating profit margin and ROE performance, while
it improves SOEs’ asset turnover performance by 24.26 points. The government-stated objectives for
national economic improvement shows a negative effect on the operating profit margin, net income,
operating profit return, asset turnover and market/book value of equity. However, this objective
helps SOEs to improve their asset turnover and ROE performance. The government-stated national
development objective hinders SOEs’ ability to improve their ROE, asset turnover and operating
profit margin performance. The requirement for SOEs to meet the government community
development objectives also has limited effects on SOEs’ performance. The government-stated
provision of community needs objective indicates its relations with operating profit return, asset
turnover, ROA, market/book value of equity, operating income and EBIT margin. Most of these
relations are negative, except market/book value of equity performance. This means that the
objective prevents SOEs from performing better, except for market/book value of equity
performance. The government-stated state budget contribution objective has relations with asset
turnover, operating income and market/book value of equity. The objective decreases the
market/book value of equity by -6.49 points, and it increases operating income and asset turnover
by 2.53 and 6.15 points respectively.
Non-privatised SOEs without privatisation restrictions indicate a similar picture to publicly listed
SOEs. The government-stated provision of public utilities objective shows relations with SOEs’ asset
turnover and ROE of 2.35 and 2.16 points respectively. The government-stated objectives for
national economic improvement and national development do not have any relations with SOEs’
financial performance. Meanwhile, the government-stated community development objective has
negative effects on SOEs’ net income, operating profit margin, operating profit return, operating
income, EBIT margin and ROA. The requirement for SOEs to meet the government-stated state
budget contribution objective results in negative effects on SOEs’ operating profit margin, operating
profit return, ROE, ROA and EBIT margin performance.
Non-privatised SOEs with privatisation restriction also indicates a similar picture to the other two
groups of SOEs. The government-stated objective for provision of public goods and services shows
its relations with several SOEs financial performance such as operating profit return, net income,
185
ROA, EBIT margin and ROE. The objective helps the SOEs to improve these financial performances,
except for their net income performance. Table 11.13 shows that the government-stated objective
for provision of public goods and services hinders the SOEs to improve their net income
performance for-8.54 points. Meanwhile, the government-stated objective for national economic
improvement shows its relations with the SOEs’ operating profit return, ROA, and EBIT margin, and
the objective helps the SOEs to improve these financial performances. The requirement for SOEs to
meet the government-stated objectives for community development and community prosperity
show their negative effects on the SOEs’ operating profit return, ROA, and EBIT margin
performances. Both the government-stated objective for community development reduces the
SOEs’ ROA and EBIT margin performance of -3.26 points. In contrast, the government-stated
objectives for community prosperity and provision of community need help the SOEs to improve
their net income performance. None of the SOEs financial performance shows their relations with
the government-stated objectives for contribution to state budget.
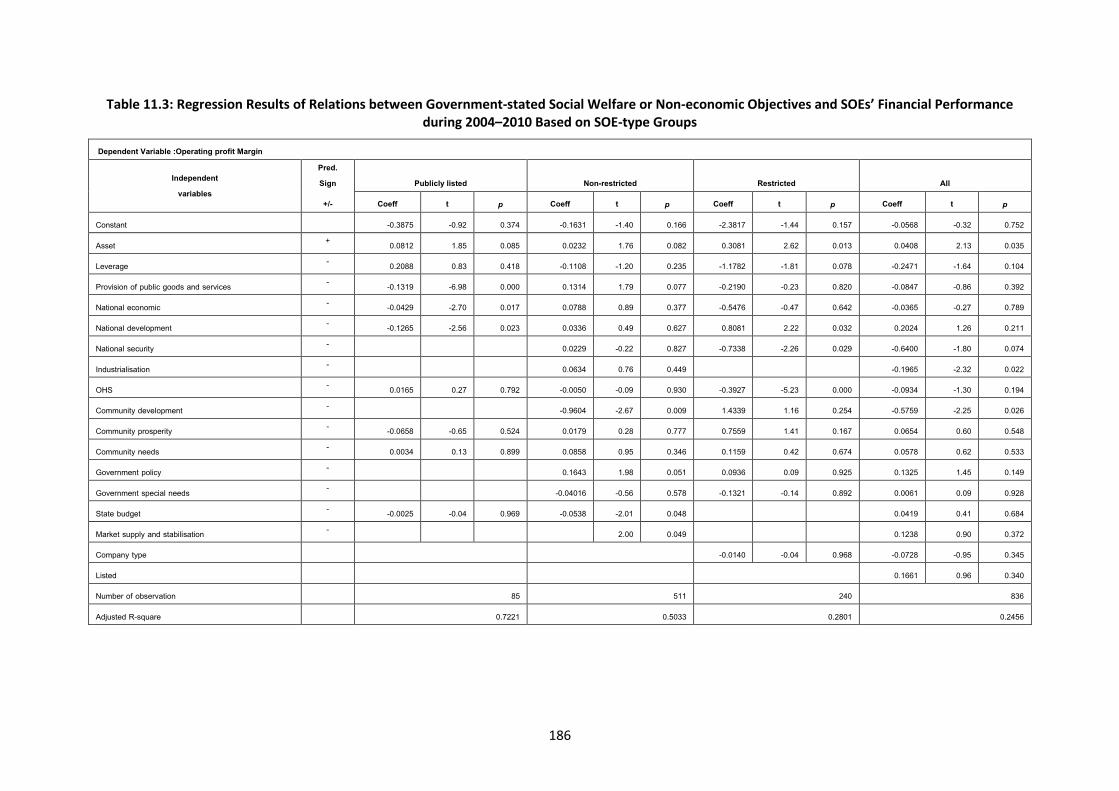
186
Table 11.3: Regression Results of Relations between Government-stated Social Welfare or Non-economic Objectives and SOEs’ Financial Performance during 2004–2010 Based on SOE-type Groups
Dependent Variable :Operating profit Margin
Independent variables
Pred. Sign Publicly listed Non-restricted Restricted All
+/- Coeff t p Coeff t p Coeff t p Coeff t p
Constant -0.3875 -0.92 0.374 -0.1631 -1.40 0.166 -2.3817 -1.44 0.157 -0.0568 -0.32 0.752
Asset + 0.0812 1.85 0.085 0.0232 1.76 0.082 0.3081 2.62 0.013 0.0408 2.13 0.035
Leverage - 0.2088 0.83 0.418 -0.1108 -1.20 0.235 -1.1782 -1.81 0.078 -0.2471 -1.64 0.104
Provision of public goods and services - -0.1319 -6.98 0.000 0.1314 1.79 0.077 -0.2190 -0.23 0.820 -0.0847 -0.86 0.392
National economic - -0.0429 -2.70 0.017 0.0788 0.89 0.377 -0.5476 -0.47 0.642 -0.0365 -0.27 0.789
National development - -0.1265 -2.56 0.023 0.0336 0.49 0.627 0.8081 2.22 0.032 0.2024 1.26 0.211
National security - 0.0229 -0.22 0.827 -0.7338 -2.26 0.029 -0.6400 -1.80 0.074
Industrialisation - 0.0634 0.76 0.449 -0.1965 -2.32 0.022
OHS - 0.0165 0.27 0.792 -0.0050 -0.09 0.930 -0.3927 -5.23 0.000 -0.0934 -1.30 0.194
Community development - -0.9604 -2.67 0.009 1.4339 1.16 0.254 -0.5759 -2.25 0.026
Community prosperity - -0.0658 -0.65 0.524 0.0179 0.28 0.777 0.7559 1.41 0.167 0.0654 0.60 0.548
Community needs - 0.0034 0.13 0.899 0.0858 0.95 0.346 0.1159 0.42 0.674 0.0578 0.62 0.533
Government policy - 0.1643 1.98 0.051 0.0936 0.09 0.925 0.1325 1.45 0.149
Government special needs - -0.04016 -0.56 0.578 -0.1321 -0.14 0.892 0.0061 0.09 0.928
State budget - -0.0025 -0.04 0.969 -0.0538 -2.01 0.048 0.0419 0.41 0.684
Market supply and stabilisation - 2.00 0.049 0.1238 0.90 0.372
Company type -0.0140 -0.04 0.968 -0.0728 -0.95 0.345
Listed 0.1661 0.96 0.340
Number of observation 85 511 240 836
Adjusted R-square 0.7221 0.5033 0.2801 0.2456
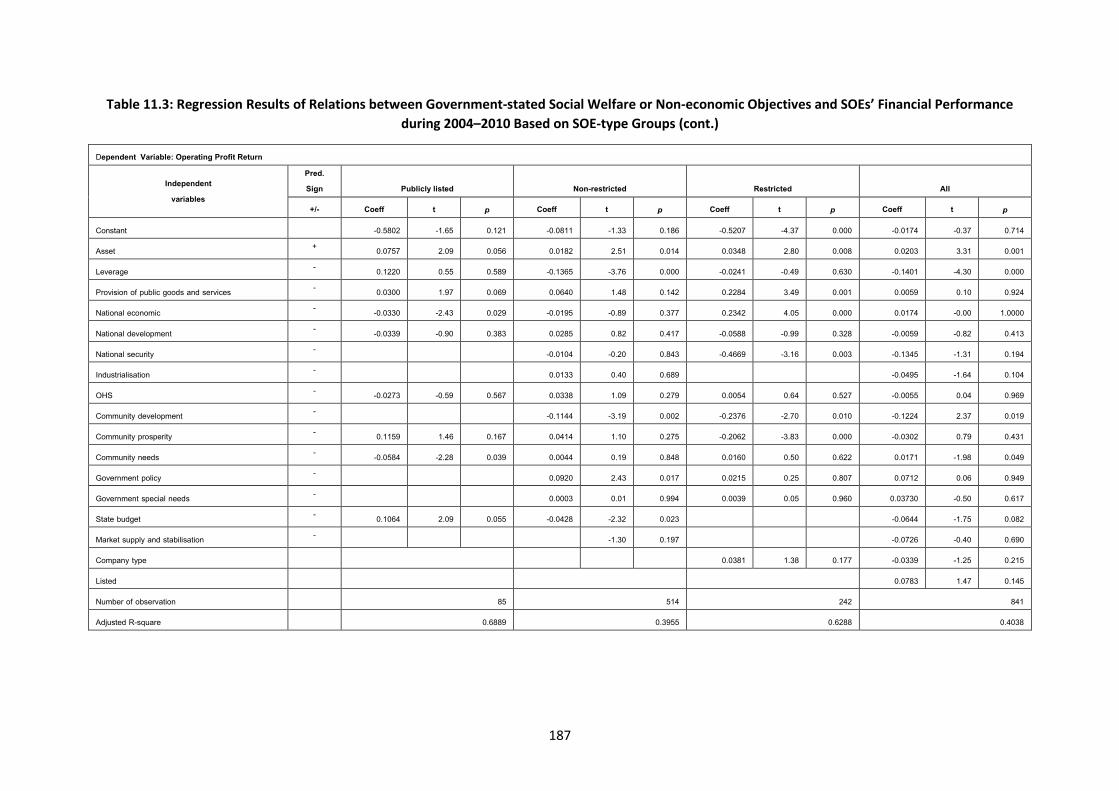
187
Table 11.3: Regression Results of Relations between Government-stated Social Welfare or Non-economic Objectives and SOEs’ Financial Performance
during 2004–2010 Based on SOE-type Groups (cont.)
Dependent Variable: Operating Profit Return
Independent variables
Pred. Sign Publicly listed Non-restricted Restricted All
+/- Coeff t p Coeff t p Coeff t p Coeff t p
Constant -0.5802 -1.65 0.121 -0.0811 -1.33 0.186 -0.5207 -4.37 0.000 -0.0174 -0.37 0.714
Asset + 0.0757 2.09 0.056 0.0182 2.51 0.014 0.0348 2.80 0.008 0.0203 3.31 0.001
Leverage - 0.1220 0.55 0.589 -0.1365 -3.76 0.000 -0.0241 -0.49 0.630 -0.1401 -4.30 0.000
Provision of public goods and services - 0.0300 1.97 0.069 0.0640 1.48 0.142 0.2284 3.49 0.001 0.0059 0.10 0.924
National economic - -0.0330 -2.43 0.029 -0.0195 -0.89 0.377 0.2342 4.05 0.000 0.0174 -0.00 1.0000
National development - -0.0339 -0.90 0.383 0.0285 0.82 0.417 -0.0588 -0.99 0.328 -0.0059 -0.82 0.413
National security - -0.0104 -0.20 0.843 -0.4669 -3.16 0.003 -0.1345 -1.31 0.194
Industrialisation - 0.0133 0.40 0.689 -0.0495 -1.64 0.104
OHS - -0.0273 -0.59 0.567 0.0338 1.09 0.279 0.0054 0.64 0.527 -0.0055 0.04 0.969
Community development - -0.1144 -3.19 0.002 -0.2376 -2.70 0.010 -0.1224 2.37 0.019
Community prosperity - 0.1159 1.46 0.167 0.0414 1.10 0.275 -0.2062 -3.83 0.000 -0.0302 0.79 0.431
Community needs - -0.0584 -2.28 0.039 0.0044 0.19 0.848 0.0160 0.50 0.622 0.0171 -1.98 0.049
Government policy - 0.0920 2.43 0.017 0.0215 0.25 0.807 0.0712 0.06 0.949
Government special needs - 0.0003 0.01 0.994 0.0039 0.05 0.960 0.03730 -0.50 0.617
State budget - 0.1064 2.09 0.055 -0.0428 -2.32 0.023 -0.0644 -1.75 0.082
Market supply and stabilisation - -1.30 0.197 -0.0726 -0.40 0.690
Company type 0.0381 1.38 0.177 -0.0339 -1.25 0.215
Listed 0.0783 1.47 0.145
Number of observation 85 514 242 841
Adjusted R-square 0.6889 0.3955 0.6288 0.4038
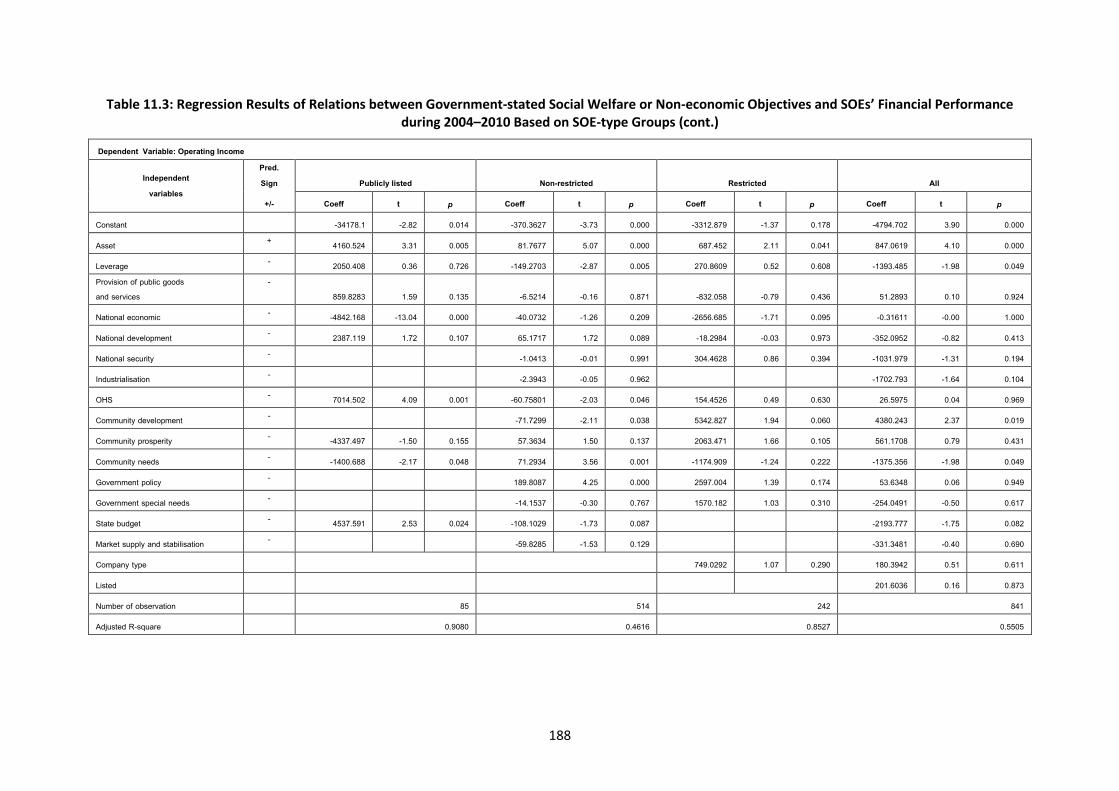
188
Table 11.3: Regression Results of Relations between Government-stated Social Welfare or Non-economic Objectives and SOEs’ Financial Performance during 2004–2010 Based on SOE-type Groups (cont.)
Dependent Variable: Operating Income
Independent variables
Pred. Sign Publicly listed Non-restricted Restricted All
+/- Coeff t p Coeff t p Coeff t p Coeff t p
Constant -34178.1 -2.82 0.014 -370.3627 -3.73 0.000 -3312.879 -1.37 0.178 -4794.702 3.90 0.000
Asset + 4160.524 3.31 0.005 81.7677 5.07 0.000 687.452 2.11 0.041 847.0619 4.10 0.000
Leverage - 2050.408 0.36 0.726 -149.2703 -2.87 0.005 270.8609 0.52 0.608 -1393.485 -1.98 0.049 Provision of public goods and services
- 859.8283 1.59 0.135 -6.5214 -0.16 0.871 -832.058 -0.79 0.436 51.2893 0.10 0.924
National economic - -4842.168 -13.04 0.000 -40.0732 -1.26 0.209 -2656.685 -1.71 0.095 -0.31611 -0.00 1.000
National development - 2387.119 1.72 0.107 65.1717 1.72 0.089 -18.2984 -0.03 0.973 -352.0952 -0.82 0.413
National security - -1.0413 -0.01 0.991 304.4628 0.86 0.394 -1031.979 -1.31 0.194
Industrialisation - -2.3943 -0.05 0.962 -1702.793 -1.64 0.104
OHS - 7014.502 4.09 0.001 -60.75801 -2.03 0.046 154.4526 0.49 0.630 26.5975 0.04 0.969
Community development - -71.7299 -2.11 0.038 5342.827 1.94 0.060 4380.243 2.37 0.019
Community prosperity - -4337.497 -1.50 0.155 57.3634 1.50 0.137 2063.471 1.66 0.105 561.1708 0.79 0.431
Community needs - -1400.688 -2.17 0.048 71.2934 3.56 0.001 -1174.909 -1.24 0.222 -1375.356 -1.98 0.049
Government policy - 189.8087 4.25 0.000 2597.004 1.39 0.174 53.6348 0.06 0.949
Government special needs - -14.1537 -0.30 0.767 1570.182 1.03 0.310 -254.0491 -0.50 0.617
State budget - 4537.591 2.53 0.024 -108.1029 -1.73 0.087 -2193.777 -1.75 0.082
Market supply and stabilisation - -59.8285 -1.53 0.129 -331.3481 -0.40 0.690
Company type 749.0292 1.07 0.290 180.3942 0.51 0.611
Listed 201.6036 0.16 0.873
Number of observation 85 514 242 841
Adjusted R-square 0.9080 0.4616 0.8527 0.5505
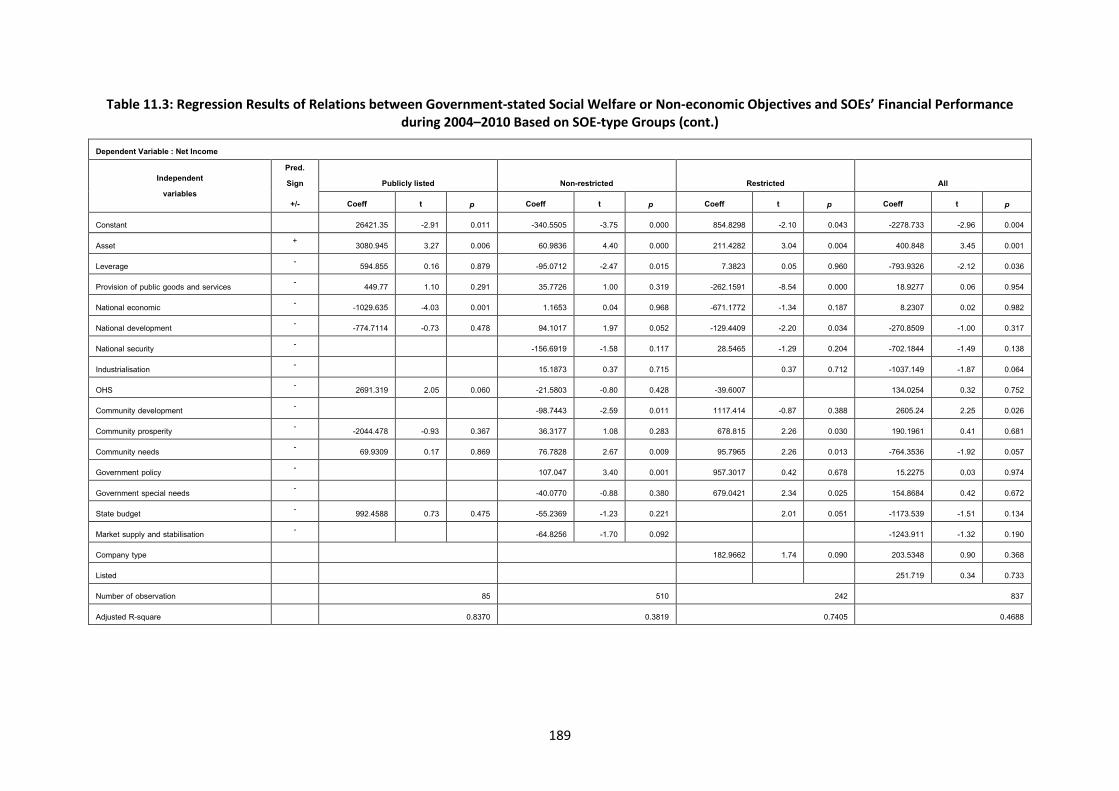
189
Table 11.3: Regression Results of Relations between Government-stated Social Welfare or Non-economic Objectives and SOEs’ Financial Performance during 2004–2010 Based on SOE-type Groups (cont.)
Dependent Variable : Net Income
Independent variables
Pred. Sign Publicly listed Non-restricted Restricted All
+/- Coeff t p Coeff t p Coeff t p Coeff t p
Constant 26421.35 -2.91 0.011 -340.5505 -3.75 0.000 854.8298 -2.10 0.043 -2278.733 -2.96 0.004
Asset + 3080.945 3.27 0.006 60.9836 4.40 0.000 211.4282 3.04 0.004 400.848 3.45 0.001
Leverage - 594.855 0.16 0.879 -95.0712 -2.47 0.015 7.3823 0.05 0.960 -793.9326 -2.12 0.036
Provision of public goods and services - 449.77 1.10 0.291 35.7726 1.00 0.319 -262.1591 -8.54 0.000 18.9277 0.06 0.954
National economic - -1029.635 -4.03 0.001 1.1653 0.04 0.968 -671.1772 -1.34 0.187 8.2307 0.02 0.982
National development - -774.7114 -0.73 0.478 94.1017 1.97 0.052 -129.4409 -2.20 0.034 -270.8509 -1.00 0.317
National security - -156.6919 -1.58 0.117 28.5465 -1.29 0.204 -702.1844 -1.49 0.138
Industrialisation - 15.1873 0.37 0.715 0.37 0.712 -1037.149 -1.87 0.064
OHS - 2691.319 2.05 0.060 -21.5803 -0.80 0.428 -39.6007 134.0254 0.32 0.752
Community development - -98.7443 -2.59 0.011 1117.414 -0.87 0.388 2605.24 2.25 0.026
Community prosperity - -2044.478 -0.93 0.367 36.3177 1.08 0.283 678.815 2.26 0.030 190.1961 0.41 0.681
Community needs - 69.9309 0.17 0.869 76.7828 2.67 0.009 95.7965 2.26 0.013 -764.3536 -1.92 0.057
Government policy - 107.047 3.40 0.001 957.3017 0.42 0.678 15.2275 0.03 0.974
Government special needs - -40.0770 -0.88 0.380 679.0421 2.34 0.025 154.8684 0.42 0.672
State budget - 992.4588 0.73 0.475 -55.2369 -1.23 0.221 2.01 0.051 -1173.539 -1.51 0.134
Market supply and stabilisation - -64.8256 -1.70 0.092 -1243.911 -1.32 0.190
Company type 182.9662 1.74 0.090 203.5348 0.90 0.368
Listed 251.719 0.34 0.733
Number of observation 85 510 242 837
Adjusted R-square 0.8370 0.3819 0.7405 0.4688
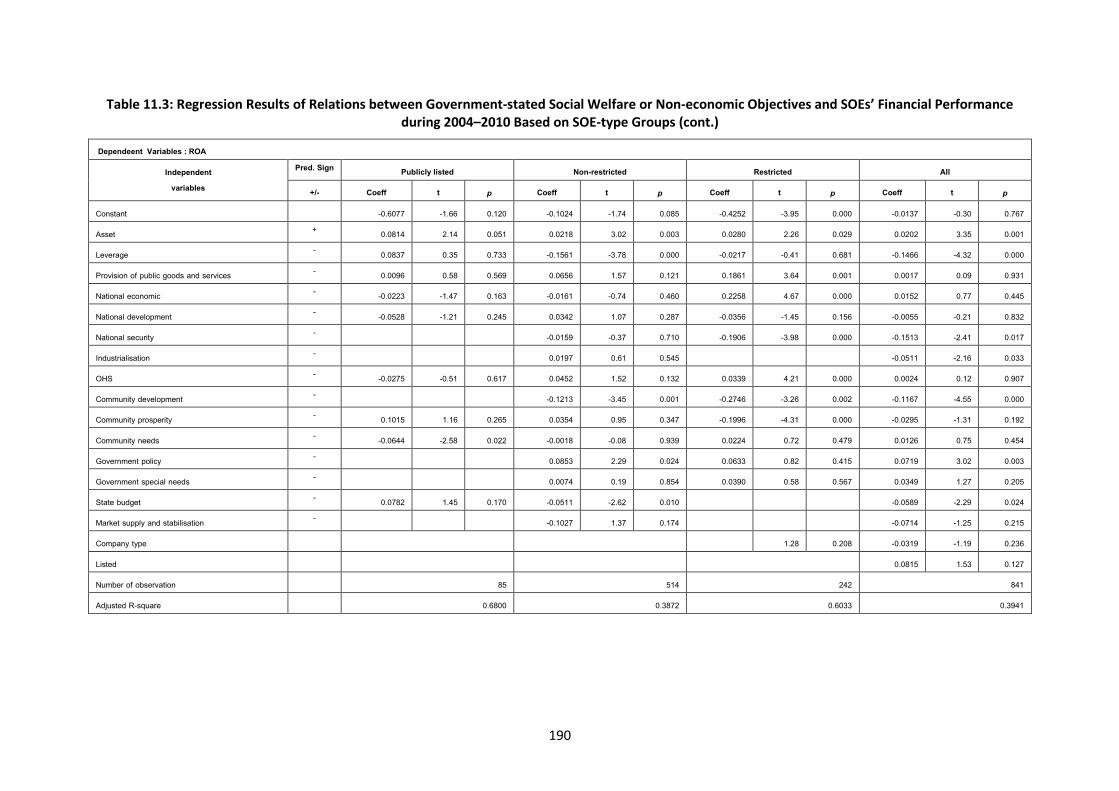
190
Table 11.3: Regression Results of Relations between Government-stated Social Welfare or Non-economic Objectives and SOEs’ Financial Performance during 2004–2010 Based on SOE-type Groups (cont.)
Dependeent Variables : ROA
Independent variables
Pred. Sign Publicly listed Non-restricted Restricted All
+/- Coeff t p Coeff t p Coeff t p Coeff t p
Constant -0.6077 -1.66 0.120 -0.1024 -1.74 0.085 -0.4252 -3.95 0.000 -0.0137 -0.30 0.767
Asset + 0.0814 2.14 0.051 0.0218 3.02 0.003 0.0280 2.26 0.029 0.0202 3.35 0.001
Leverage - 0.0837 0.35 0.733 -0.1561 -3.78 0.000 -0.0217 -0.41 0.681 -0.1466 -4.32 0.000
Provision of public goods and services - 0.0096 0.58 0.569 0.0656 1.57 0.121 0.1861 3.64 0.001 0.0017 0.09 0.931
National economic - -0.0223 -1.47 0.163 -0.0161 -0.74 0.460 0.2258 4.67 0.000 0.0152 0.77 0.445
National development - -0.0528 -1.21 0.245 0.0342 1.07 0.287 -0.0356 -1.45 0.156 -0.0055 -0.21 0.832
National security - -0.0159 -0.37 0.710 -0.1906 -3.98 0.000 -0.1513 -2.41 0.017
Industrialisation - 0.0197 0.61 0.545 -0.0511 -2.16 0.033
OHS - -0.0275 -0.51 0.617 0.0452 1.52 0.132 0.0339 4.21 0.000 0.0024 0.12 0.907
Community development - -0.1213 -3.45 0.001 -0.2746 -3.26 0.002 -0.1167 -4.55 0.000
Community prosperity - 0.1015 1.16 0.265 0.0354 0.95 0.347 -0.1996 -4.31 0.000 -0.0295 -1.31 0.192
Community needs - -0.0644 -2.58 0.022 -0.0018 -0.08 0.939 0.0224 0.72 0.479 0.0126 0.75 0.454
Government policy - 0.0853 2.29 0.024 0.0633 0.82 0.415 0.0719 3.02 0.003
Government special needs - 0.0074 0.19 0.854 0.0390 0.58 0.567 0.0349 1.27 0.205
State budget - 0.0782 1.45 0.170 -0.0511 -2.62 0.010 -0.0589 -2.29 0.024
Market supply and stabilisation - -0.1027 1.37 0.174 -0.0714 -1.25 0.215
Company type
1.28 0.208 -0.0319 -1.19 0.236
Listed 0.0815 1.53 0.127
Number of observation 85 514 242 841
Adjusted R-square 0.6800 0.3872 0.6033 0.3941

191
Table 11.3: Regression Results of Relations between Government-stated Social Welfare or Non-economic Objectives and SOEs’ Financial Performance during 2004–2010 Based on SOE-type Groups (cont.)
Dependent Variable : EBIT Margin
Independent variables
Pred. Sign Publicly listed Non-restricted Restricted All
+/- Coeff t p Coeff t p Coeff t p Coeff t p
Constant -0.6077 -1.66 0.120 -0.4252 -1.74 0.085 -0.1024 3.95 0.000 -0.0137 0.30 0.767
Asset + 0.0814 2.14 0.051 0.0280 3.02 0.003 0.0218 2.26 0.029 0.0202 3.35 0.001
Leverage - 0.0837 0.35 0.733 -0.0217 -3.78 0.000 -0.1561 -0.41 0.681 -0.1466 -4.32 0.000
Provision of public goods and services - 0.0095 0.58 0.569 0.0656 1.57 0.121 0.1861 3.64 0.001 0.0018 0.09 0.931
National economic - -0.0223 -1.47 0.163 -0.0161 -0.74 0.460 0.2258 4.67 0.000 0.0153 0.77 0.445
National development - --0.0528 -1.21 0.245 0.0342 1.07 0.287 -0.0356 -1.45 0.156 -0.0055 -0.21 0.832
National security - -0.0159 -0.37 0.710 -0.1906 -3.98 0.000 -0.1514 -2.41 0.017
Industrialisation - 0.0196 0.61 0.545 -0.0510 -2.16 0.832
OHS - -0.0275 -0.51 0.617 0.0452 1.52 0.132 0.0339 4.21 0.000 0.0024 0.12 0.907
Community development - -0.1213 -3.45 0.001 -0.2476 -3.26 0.002 -0.1166 -4.55 0.000
Community prosperity - 0.1015 1.16 0.265 0.0354 0.95 0.347 -0.1996 -4.31 0.000 -0.0295 -1.31 0.192
Community needs - -0.0643 -2.58 0.022 -0.0018 -0.08 0.939 0.0224 0.72 0.047 0.0127 0.75 0.454
Government policy - 0.0857 2.29 0.024 0.0633 0.82 0.415 0.0719 3.02 0.003
Government special needs - 0.0074 0.19 0.854 0.0390 0.58 0.567 0.0349 1.27 0.205
State budget - 0.0782 1.45 0.170 -0.0511 -2.62 0.010 -0.0589 -2.29 0.024
Market supply and stabilisation - -0.1026 -1.37 0.174 -0.0714 -1.25 0.215
Company type 1.28 0.208 -0.0319 -1.19 0.236
Listed 0.0815 1.53 0.127
Number of observation 85 514 242 841
Adjusted R-square 0.6800 0.3872 0.6033 0.3941
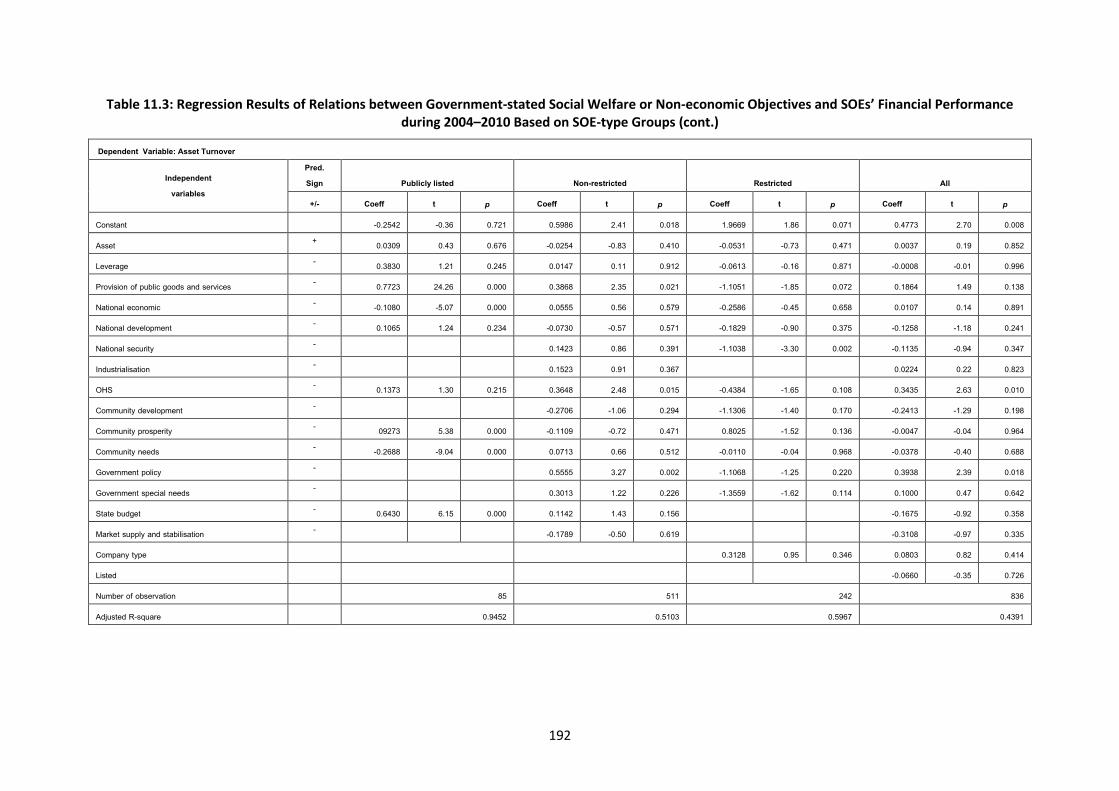
192
Table 11.3: Regression Results of Relations between Government-stated Social Welfare or Non-economic Objectives and SOEs’ Financial Performance during 2004–2010 Based on SOE-type Groups (cont.)
Dependent Variable: Asset Turnover
Independent variables
Pred. Sign Publicly listed Non-restricted Restricted All
+/- Coeff t p Coeff t p Coeff t p Coeff t p
Constant -0.2542 -0.36 0.721 0.5986 2.41 0.018 1.9669 1.86 0.071 0.4773 2.70 0.008
Asset + 0.0309 0.43 0.676 -0.0254 -0.83 0.410 -0.0531 -0.73 0.471 0.0037 0.19 0.852
Leverage - 0.3830 1.21 0.245 0.0147 0.11 0.912 -0.0613 -0.16 0.871 -0.0008 -0.01 0.996
Provision of public goods and services - 0.7723 24.26 0.000 0.3868 2.35 0.021 -1.1051 -1.85 0.072 0.1864 1.49 0.138
National economic - -0.1080 -5.07 0.000 0.0555 0.56 0.579 -0.2586 -0.45 0.658 0.0107 0.14 0.891
National development - 0.1065 1.24 0.234 -0.0730 -0.57 0.571 -0.1829 -0.90 0.375 -0.1258 -1.18 0.241
National security - 0.1423 0.86 0.391 -1.1038 -3.30 0.002 -0.1135 -0.94 0.347
Industrialisation - 0.1523 0.91 0.367 0.0224 0.22 0.823
OHS - 0.1373 1.30 0.215 0.3648 2.48 0.015 -0.4384 -1.65 0.108 0.3435 2.63 0.010
Community development - -0.2706 -1.06 0.294 -1.1306 -1.40 0.170 -0.2413 -1.29 0.198
Community prosperity - 09273 5.38 0.000 -0.1109 -0.72 0.471 0.8025 -1.52 0.136 -0.0047 -0.04 0.964
Community needs - -0.2688 -9.04 0.000 0.0713 0.66 0.512 -0.0110 -0.04 0.968 -0.0378 -0.40 0.688
Government policy - 0.5555 3.27 0.002 -1.1068 -1.25 0.220 0.3938 2.39 0.018
Government special needs - 0.3013 1.22 0.226 -1.3559 -1.62 0.114 0.1000 0.47 0.642
State budget - 0.6430 6.15 0.000 0.1142 1.43 0.156 -0.1675 -0.92 0.358
Market supply and stabilisation - -0.1789 -0.50 0.619 -0.3108 -0.97 0.335
Company type 0.3128 0.95 0.346 0.0803 0.82 0.414
Listed -0.0660 -0.35 0.726
Number of observation 85 511 242 836
Adjusted R-square 0.9452 0.5103 0.5967 0.4391
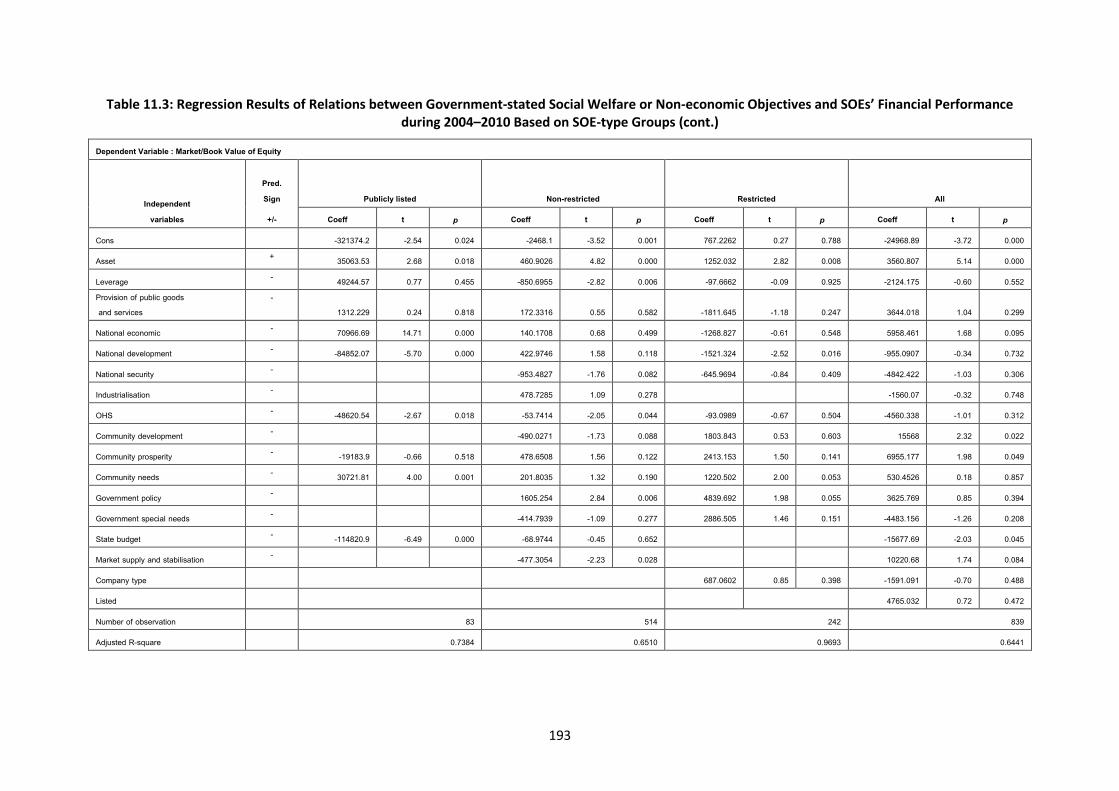
193
Table 11.3: Regression Results of Relations between Government-stated Social Welfare or Non-economic Objectives and SOEs’ Financial Performance during 2004–2010 Based on SOE-type Groups (cont.)
Dependent Variable : Market/Book Value of Equity
Independent variables
Pred. Sign Publicly listed Non-restricted Restricted All
+/- Coeff t p Coeff t p Coeff t p Coeff t p
Cons -321374.2 -2.54 0.024 -2468.1 -3.52 0.001 767.2262 0.27 0.788 -24968.89 -3.72 0.000
Asset + 35063.53 2.68 0.018 460.9026 4.82 0.000 1252.032 2.82 0.008 3560.807 5.14 0.000
Leverage - 49244.57 0.77 0.455 -850.6955 -2.82 0.006 -97.6662 -0.09 0.925 -2124.175 -0.60 0.552 Provision of public goods and services
- 1312.229 0.24 0.818 172.3316 0.55 0.582 -1811.645 -1.18 0.247 3644.018 1.04 0.299
National economic - 70966.69 14.71 0.000 140.1708 0.68 0.499 -1268.827 -0.61 0.548 5958.461 1.68 0.095
National development - -84852.07 -5.70 0.000 422.9746 1.58 0.118 -1521.324 -2.52 0.016 -955.0907 -0.34 0.732
National security - -953.4827 -1.76 0.082 -645.9694 -0.84 0.409 -4842.422 -1.03 0.306
Industrialisation - 478.7285 1.09 0.278 -1560.07 -0.32 0.748
OHS - -48620.54 -2.67 0.018 -53.7414 -2.05 0.044 -93.0989 -0.67 0.504 -4560.338 -1.01 0.312
Community development - -490.0271 -1.73 0.088 1803.843 0.53 0.603 15568 2.32 0.022
Community prosperity - -19183.9 -0.66 0.518 478.6508 1.56 0.122 2413.153 1.50 0.141 6955.177 1.98 0.049
Community needs - 30721.81 4.00 0.001 201.8035 1.32 0.190 1220.502 2.00 0.053 530.4526 0.18 0.857
Government policy - 1605.254 2.84 0.006 4839.692 1.98 0.055 3625.769 0.85 0.394
Government special needs - -414.7939 -1.09 0.277 2886.505 1.46 0.151 -4483.156 -1.26 0.208
State budget - -114820.9 -6.49 0.000 -68.9744 -0.45 0.652 -15677.69 -2.03 0.045
Market supply and stabilisation - -477.3054 -2.23 0.028 10220.68 1.74 0.084
Company type 687.0602 0.85 0.398 -1591.091 -0.70 0.488
Listed 4765.032 0.72 0.472
Number of observation 83 514 242 839
Adjusted R-square 0.7384 0.6510 0.9693 0.6441
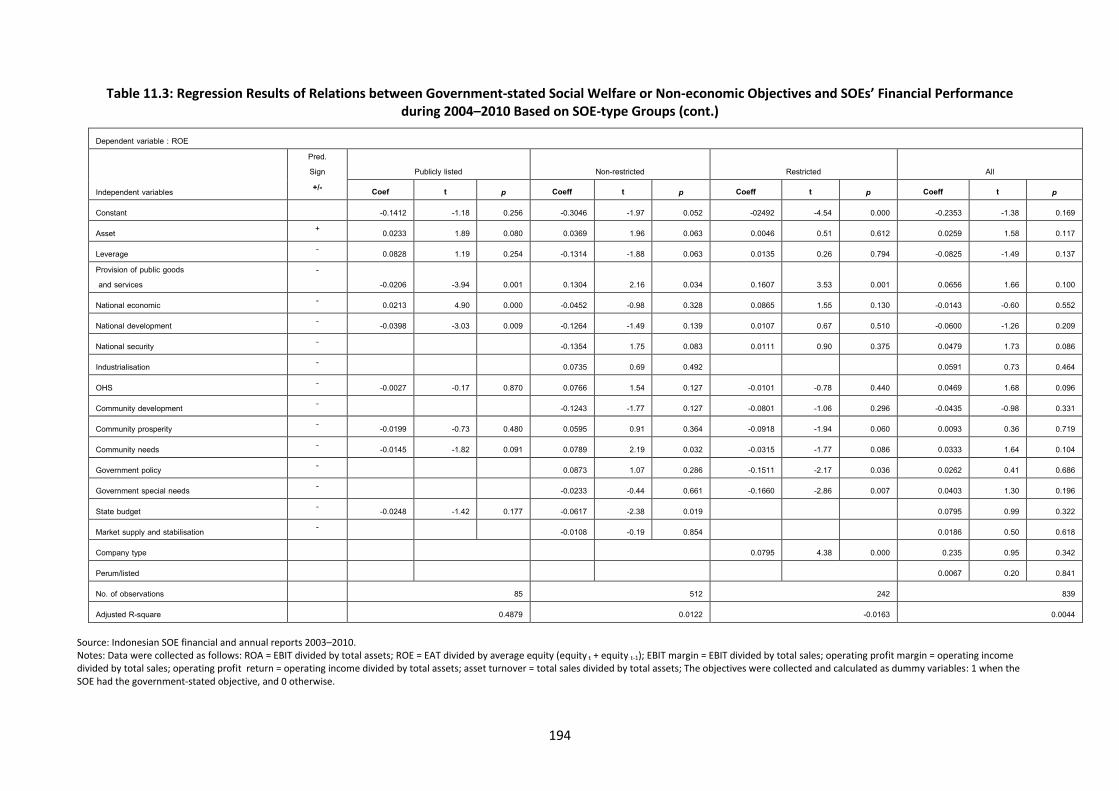
194
Table 11.3: Regression Results of Relations between Government-stated Social Welfare or Non-economic Objectives and SOEs’ Financial Performance during 2004–2010 Based on SOE-type Groups (cont.)
Dependent variable : ROE
Independent variables
Pred. Sign Publicly listed Non-restricted Restricted All +/- Coef t p Coeff t p Coeff t p Coeff t p
Constant -0.1412 -1.18 0.256 -0.3046 -1.97 0.052 -02492 -4.54 0.000 -0.2353 -1.38 0.169
Asset + 0.0233 1.89 0.080 0.0369 1.96 0.063 0.0046 0.51 0.612 0.0259 1.58 0.117
Leverage - 0.0828 1.19 0.254 -0.1314 -1.88 0.063 0.0135 0.26 0.794 -0.0825 -1.49 0.137 Provision of public goods and services
- -0.0206 -3.94 0.001 0.1304 2.16 0.034 0.1607 3.53 0.001 0.0656 1.66 0.100
National economic - 0.0213 4.90 0.000 -0.0452 -0.98 0.328 0.0865 1.55 0.130 -0.0143 -0.60 0.552
National development - -0.0398 -3.03 0.009 -0.1264 -1.49 0.139 0.0107 0.67 0.510 -0.0600 -1.26 0.209
National security - -0.1354 1.75 0.083 0.0111 0.90 0.375 0.0479 1.73 0.086
Industrialisation - 0.0735 0.69 0.492 0.0591 0.73 0.464
OHS - -0.0027 -0.17 0.870 0.0766 1.54 0.127 -0.0101 -0.78 0.440 0.0469 1.68 0.096
Community development - -0.1243 -1.77 0.127 -0.0801 -1.06 0.296 -0.0435 -0.98 0.331
Community prosperity - -0.0199 -0.73 0.480 0.0595 0.91 0.364 -0.0918 -1.94 0.060 0.0093 0.36 0.719
Community needs - -0.0145 -1.82 0.091 0.0789 2.19 0.032 -0.0315 -1.77 0.086 0.0333 1.64 0.104
Government policy - 0.0873 1.07 0.286 -0.1511 -2.17 0.036 0.0262 0.41 0.686
Government special needs - -0.0233 -0.44 0.661 -0.1660 -2.86 0.007 0.0403 1.30 0.196
State budget - -0.0248 -1.42 0.177 -0.0617 -2.38 0.019 0.0795 0.99 0.322
Market supply and stabilisation - -0.0108 -0.19 0.854 0.0186 0.50 0.618
Company type 0.0795 4.38 0.000 0.235 0.95 0.342
Perum/listed 0.0067 0.20 0.841
No. of observations 85 512 242 839
Adjusted R-square 0.4879 0.0122 -0.0163 0.0044
Source: Indonesian SOE financial and annual reports 2003–2010. Notes: Data were collected as follows: ROA = EBIT divided by total assets; ROE = EAT divided by average equity (equity t + equity t-1); EBIT margin = EBIT divided by total sales; operating profit margin = operating income divided by total sales; operating profit return = operating income divided by total assets; asset turnover = total sales divided by total assets; The objectives were collected and calculated as dummy variables: 1 when the SOE had the government-stated objective, and 0 otherwise.
195
Table 11.4 presents the regression results of the relations between government-stated social welfare
or non-economic objectives and SOEs’ social welfare representative financial performance. The table
shows that the government-stated social welfare or non-economic objectives show more relations
with publicly listed SOEs’ social welfare representative financial performance than government-stated
for economic or financial objectives. The government-stated provision of public goods and services
objective shows relations with publicly listed SOEs’ CSR fund performance only. The government-
stated national economic improvement objective shows negative effects on SOEs’ labour cost
performance of -8.15 points. The objective helps SOEs to improve their performance in employment
intensity performance by 2.95 points. The influence of interest is found through two different dividend
rate calculations. The interest increases the dividend rate by 12.01 points when it is included in the
measurement. When the interest is excluded, the objective improves the dividend rate by 18.01
points. The government-stated objective for community prosperity shows negative effects on labour
cost, CSR funds and employment intensity performance. The government-stated provision of
community needs objective generates a positive effect of 4.53 points on SOEs’ employment intensity
performance. Meanwhile, the government-stated state budget contribution objective may prevent
SOEs from improving their effective tax rates and dividend rates financial performance
The regression results of the relations between government-stated social welfare or non-economic
objectives and non-privatised SOEs’ social welfare representative financial performance also support
the previous results regarding the important role of interest in SOEs’ financial performance. Table 11.4
shows the role of interest in improving performance of effective tax rates and dividend rates. For
example, government-stated national development objective has a positive effect on non-privatised
SOEs without privatisation restrictions’ dividend rate performance when the interest is part of the
measurement. In contrast, the objective does not show any relation with SOEs’ dividend rate
performance when the interest is not part of the measurement. The government-stated objectives for
national economic development and OHS show effects on non-privatised SOEs with privatisation
restrictions’ effective tax rates when the interest is not part of the measurement.
The requirement for SOEs to achieve government community development matters and other non-
economic objectives also affects non-privatised SOEs’ performance. The government-stated objectives
for community development show a positive effect on both non-privatised SOEs’ group performance
for employment intensity. While government-stated compliance with the government policy objective
improves non-privatised SOEs with privatisation restrictions’ employment intensity and CSR fund, it
hinders non-privatised SOEs without privatisation restrictions’ employment intensity by -2.08 points.
None of non-privatised SOEs’ social welfare representative financial performance is influenced by the
government-stated state budget contribution objective.
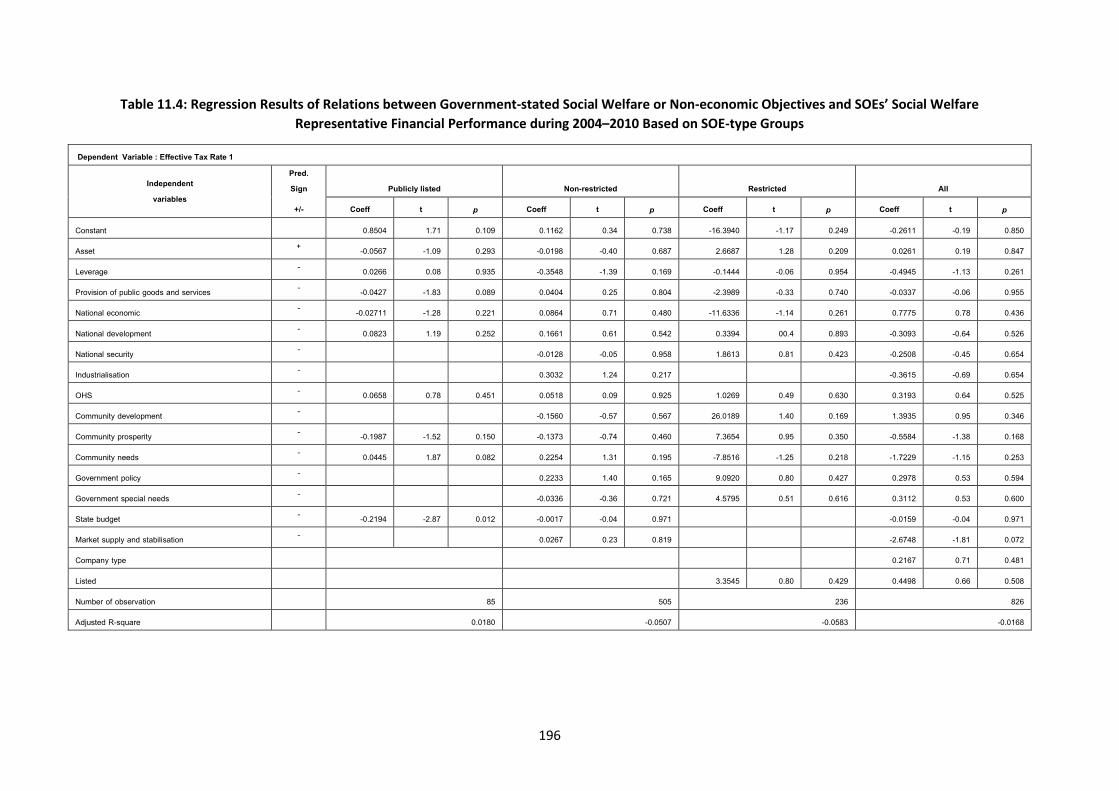
196
Table 11.4: Regression Results of Relations between Government-stated Social Welfare or Non-economic Objectives and SOEs’ Social Welfare
Representative Financial Performance during 2004–2010 Based on SOE-type Groups
Dependent Variable : Effective Tax Rate 1
Independent variables
Pred. Sign Publicly listed Non-restricted Restricted All
+/- Coeff t p Coeff t p Coeff t p Coeff t p
Constant 0.8504 1.71 0.109 0.1162 0.34 0.738 -16.3940 -1.17 0.249 -0.2611 -0.19 0.850
Asset + -0.0567 -1.09 0.293 -0.0198 -0.40 0.687 2.6687 1.28 0.209 0.0261 0.19 0.847
Leverage - 0.0266 0.08 0.935 -0.3548 -1.39 0.169 -0.1444 -0.06 0.954 -0.4945 -1.13 0.261
Provision of public goods and services - -0.0427 -1.83 0.089 0.0404 0.25 0.804 -2.3989 -0.33 0.740 -0.0337 -0.06 0.955
National economic - -0.02711 -1.28 0.221 0.0864 0.71 0.480 -11.6336 -1.14 0.261 0.7775 0.78 0.436
National development - 0.0823 1.19 0.252 0.1661 0.61 0.542 0.3394 00.4 0.893 -0.3093 -0.64 0.526
National security - -0.0128 -0.05 0.958 1.8613 0.81 0.423 -0.2508 -0.45 0.654
Industrialisation - 0.3032 1.24 0.217 -0.3615 -0.69 0.654
OHS - 0.0658 0.78 0.451 0.0518 0.09 0.925 1.0269 0.49 0.630 0.3193 0.64 0.525
Community development - -0.1560 -0.57 0.567 26.0189 1.40 0.169 1.3935 0.95 0.346
Community prosperity - -0.1987 -1.52 0.150 -0.1373 -0.74 0.460 7.3654 0.95 0.350 -0.5584 -1.38 0.168
Community needs - 0.0445 1.87 0.082 0.2254 1.31 0.195 -7.8516 -1.25 0.218 -1.7229 -1.15 0.253
Government policy - 0.2233 1.40 0.165 9.0920 0.80 0.427 0.2978 0.53 0.594
Government special needs - -0.0336 -0.36 0.721 4.5795 0.51 0.616 0.3112 0.53 0.600
State budget - -0.2194 -2.87 0.012 -0.0017 -0.04 0.971 -0.0159 -0.04 0.971
Market supply and stabilisation - 0.0267 0.23 0.819 -2.6748 -1.81 0.072
Company type 0.2167 0.71 0.481
Listed 3.3545 0.80 0.429 0.4498 0.66 0.508
Number of observation 85 505 236 826
Adjusted R-square 0.0180 -0.0507 -0.0583 -0.0168
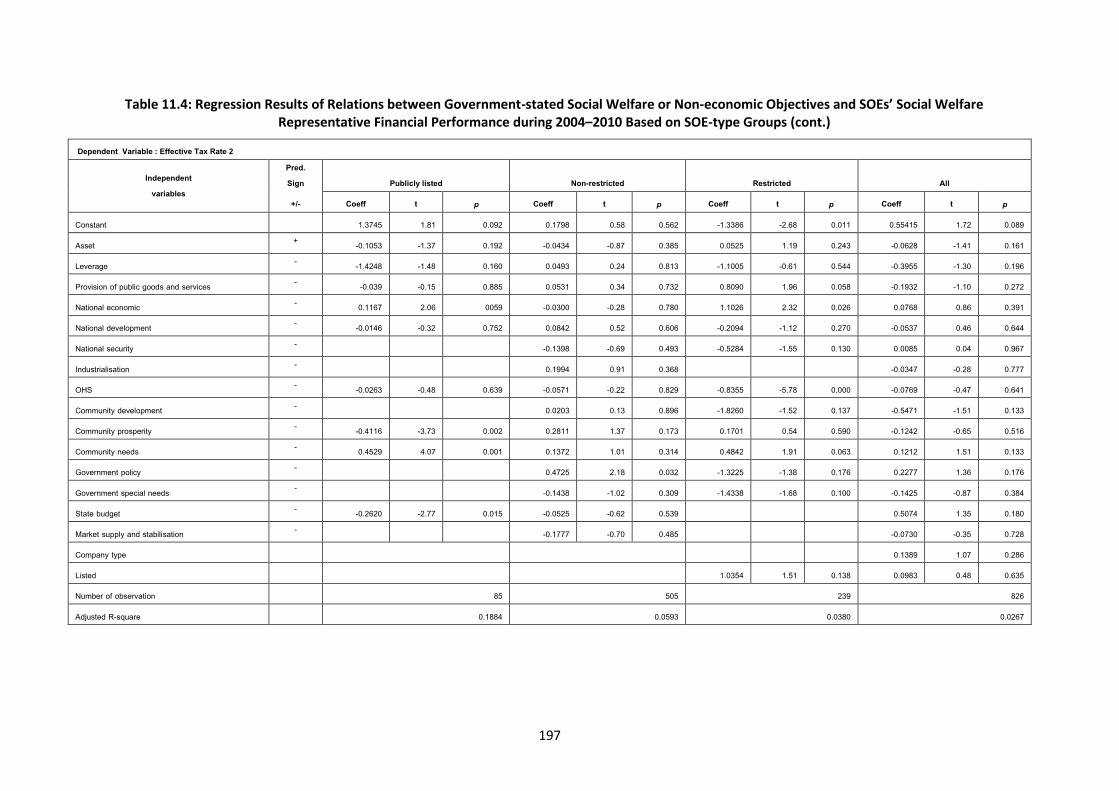
197
Table 11.4: Regression Results of Relations between Government-stated Social Welfare or Non-economic Objectives and SOEs’ Social Welfare Representative Financial Performance during 2004–2010 Based on SOE-type Groups (cont.)
Dependent Variable : Effective Tax Rate 2
Independent variables
Pred. Sign Publicly listed Non-restricted Restricted All
+/- Coeff t p Coeff t p Coeff t p Coeff t p
Constant 1.3745 1.81 0.092 0.1798 0.58 0.562 -1.3386 -2.68 0.011 0.55415 1.72 0.089
Asset + -0.1053 -1.37 0.192 -0.0434 -0.87 0.385 0.0525 1.19 0.243 -0.0628 -1.41 0.161
Leverage - -1.4248 -1.48 0.160 0.0493 0.24 0.813 -1.1005 -0.61 0.544 -0.3955 -1.30 0.196
Provision of public goods and services - -0.039 -0.15 0.885 0.0531 0.34 0.732 0.8090 1.96 0.058 -0.1932 -1.10 0.272
National economic - 0.1167 2.06 0059 -0.0300 -0.28 0.780 1.1026 2.32 0.026 0.0768 0.86 0.391
National development - -0.0146 -0.32 0.752 0.0842 0.52 0.606 -0.2094 -1.12 0.270 -0.0537 0.46 0.644
National security - -0.1398 -0.69 0.493 -0.5284 -1.55 0.130 0.0085 0.04 0.967
Industrialisation - 0.1994 0.91 0.368 -0.0347 -0.28 0.777
OHS - -0.0263 -0.48 0.639 -0.0571 -0.22 0.829 -0.8355 -5.78 0.000 -0.0769 -0.47 0.641
Community development - 0.0203 0.13 0.896 -1.8260 -1.52 0.137 -0.5471 -1.51 0.133
Community prosperity - -0.4116 -3.73 0.002 0.2811 1.37 0.173 0.1701 0.54 0.590 -0.1242 -0.65 0.516
Community needs - 0.4529 4.07 0.001 0.1372 1.01 0.314 0.4842 1.91 0.063 0.1212 1.51 0.133
Government policy - 0.4725 2.18 0.032 -1.3225 -1.38 0.176 0.2277 1.36 0.176
Government special needs - -0.1438 -1.02 0.309 -1.4338 -1.68 0.100 -0.1425 -0.87 0.384
State budget - -0.2620 -2.77 0.015 -0.0525 -0.62 0.539 0.5074 1.35 0.180
Market supply and stabilisation - -0.1777 -0.70 0.485 -0.0730 -0.35 0.728
Company type 0.1389 1.07 0.286
Listed 1.0354 1.51 0.138 0.0983 0.48 0.635
Number of observation 85 505 239 826
Adjusted R-square 0.1884 0.0593 0.0380 0.0267

198
Table 11.4: Regression Results of Relations between Government-stated Social Welfare or Non-economic Objectives and SOEs’ Social Welfare Representative Financial Performance during 2004–2010 Based on SOE-type Groups (cont.)
Dependent Variable : Dividend Rate 1
Independent variables
Pred. Sign Publicly listed Non-restricted Restricted All
+/- Coeff t p Coeff t p Coeff t p Coeff t p
Constant 0.3640 0.79 0.490 0.02523 0.22 0.827 -18.9976 -1.07 0.291 -1.2840 -0.93 0.352
Asset + -0.0219 -0.38 0.711 0.0194 1.33 0.188 2.5014 1.16 0.254 0.1252 0.90 0.371
Leverage - -0.0043 -0.44 0.664 -0.1179 -2.00 0.049 0.1815 0.07 0.944 -0.0731 -0.22 0.829
Provision of public goods and services - -0.0080 -0.30 0.767 -0.0054 -0.67 0.505 -1.4768 -0.20 0.842 0.4903 0.86 0.389
National economic - 0.2677 12.01 0.000 -0.1138 -1.95 0.054 -10.5599 -1.02 0.314 1.0587 1.01 0.316
National development - 0.0096 0.13 0.895 0.0358 2.10 0.038 0.2441 0.10 0.924 1.0619 -0.26 0.796
National security - 0.0669 -0.92 0.358 2.1466 0.85 0.401 -0.1165 -0.67 0.507
Industrialisation - 0.0119 -1.20 0.234 -0.3152 -0.24 0.807
OHS - -0.0958 -1.08 0.298 0.0423 1.07 0.289 1.4494 0.64 0.527 -0.0755 0.62 0.539
Community development - -0.0385 -0.99 0.325 24.589 1.28 0.209 0.23155 0.97 0.334
Community prosperity - -0.2669 -1.86 0.084 0.0303 -0.66 0.509 6.5080 0.82 0.416 1.4189 0.07 0.946
Community needs - 0.0475 1.38 0.188 0.06114 2.43 0.017 -8.6382 -1.27 0.211 -1.712 -1.08 0.283
Government policy - 0.06440 1.60 0.114 7.9058 0.68 0.498 0.5683 1.12 0.264
Government special needs - 0.0976 1.28 0.220 3.6189 0.39 0.697 -0.0485 -0.12 0.907
State budget - -0.4564 -5.20 0.000 -0.0021 1.24 0.220 -0.1039 -0.26 0.793
Market supply and stabilisation - 0.1739 1.25 0.214 -0.4008 -0.62 0.538
Company type 3.3856 0077 0.444 -0.1076 -0.41 0.686
Listed 0.4335 0.70 0.485
Number of observation 85 500 241 826
Adjusted R-square 0.3370 0.2193 -0.0704 -0.0272
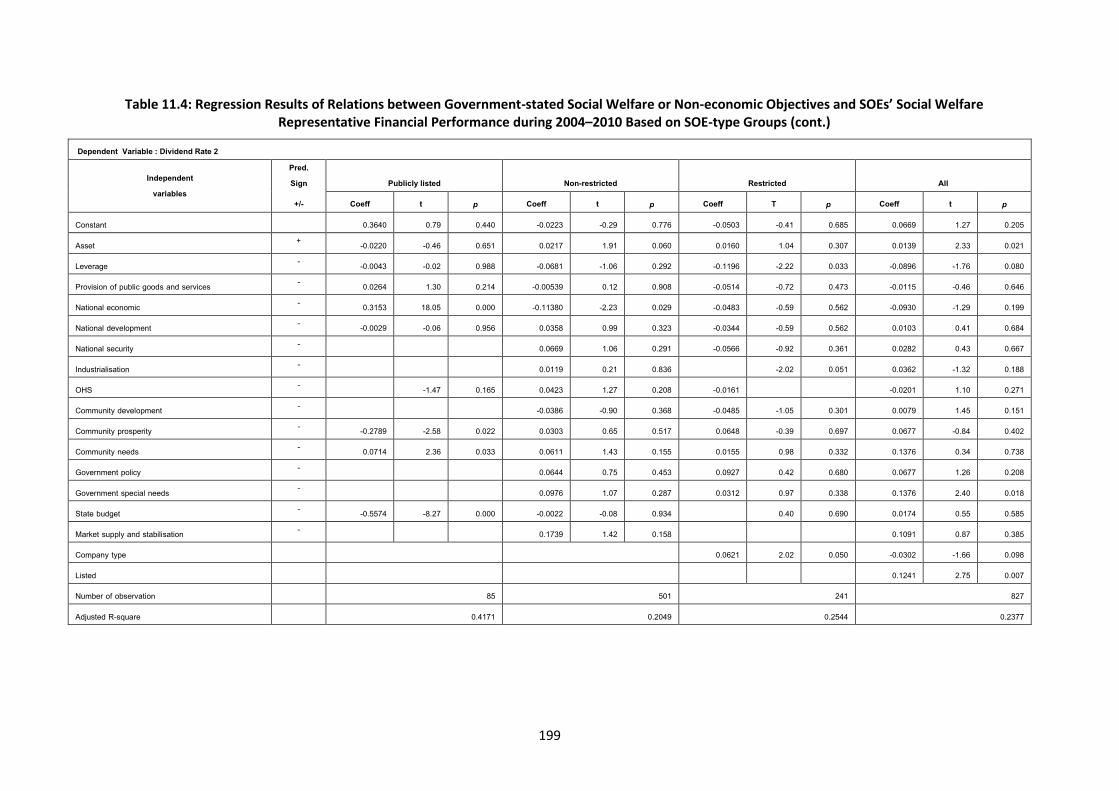
199
Table 11.4: Regression Results of Relations between Government-stated Social Welfare or Non-economic Objectives and SOEs’ Social Welfare Representative Financial Performance during 2004–2010 Based on SOE-type Groups (cont.)
Dependent Variable : Dividend Rate 2
Independent variables
Pred. Sign Publicly listed Non-restricted Restricted All
+/- Coeff t p Coeff t p Coeff T p Coeff t p
Constant 0.3640 0.79 0.440 -0.0223 -0.29 0.776 -0.0503 -0.41 0.685 0.0669 1.27 0.205
Asset + -0.0220 -0.46 0.651 0.0217 1.91 0.060 0.0160 1.04 0.307 0.0139 2.33 0.021
Leverage - -0.0043 -0.02 0.988 -0.0681 -1.06 0.292 -0.1196 -2.22 0.033 -0.0896 -1.76 0.080
Provision of public goods and services - 0.0264 1.30 0.214 -0.00539 0.12 0.908 -0.0514 -0.72 0.473 -0.0115 -0.46 0.646
National economic - 0.3153 18.05 0.000 -0.11380 -2.23 0.029 -0.0483 -0.59 0.562 -0.0930 -1.29 0.199
National development - -0.0029 -0.06 0.956 0.0358 0.99 0.323 -0.0344 -0.59 0.562 0.0103 0.41 0.684
National security - 0.0669 1.06 0.291 -0.0566 -0.92 0.361 0.0282 0.43 0.667
Industrialisation - 0.0119 0.21 0.836 -2.02 0.051 0.0362 -1.32 0.188
OHS - -1.47 0.165 0.0423 1.27 0.208 -0.0161 -0.0201 1.10 0.271
Community development - -0.0386 -0.90 0.368 -0.0485 -1.05 0.301 0.0079 1.45 0.151
Community prosperity - -0.2789 -2.58 0.022 0.0303 0.65 0.517 0.0648 -0.39 0.697 0.0677 -0.84 0.402
Community needs - 0.0714 2.36 0.033 0.0611 1.43 0.155 0.0155 0.98 0.332 0.1376 0.34 0.738
Government policy - 0.0644 0.75 0.453 0.0927 0.42 0.680 0.0677 1.26 0.208
Government special needs - 0.0976 1.07 0.287 0.0312 0.97 0.338 0.1376 2.40 0.018
State budget - -0.5574 -8.27 0.000 -0.0022 -0.08 0.934 0.40 0.690 0.0174 0.55 0.585
Market supply and stabilisation - 0.1739 1.42 0.158 0.1091 0.87 0.385
Company type 0.0621 2.02 0.050 -0.0302 -1.66 0.098
Listed 0.1241 2.75 0.007
Number of observation 85 501 241 827
Adjusted R-square 0.4171 0.2049 0.2544 0.2377
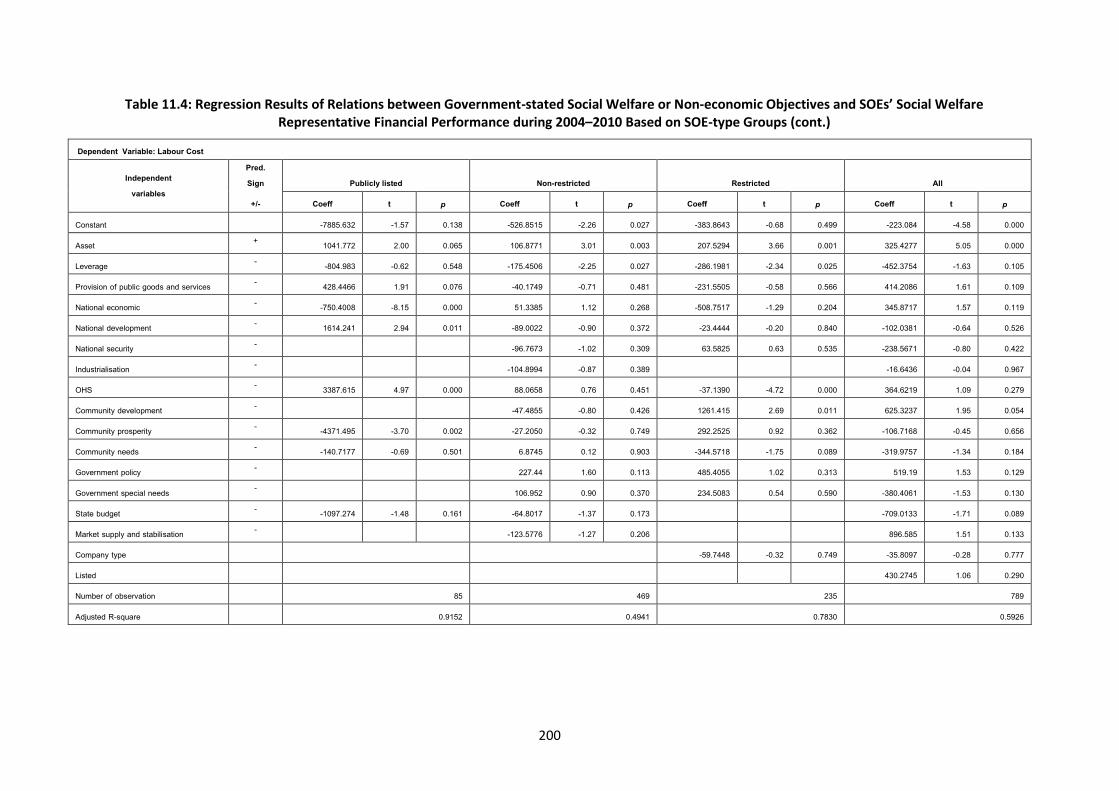
200
Table 11.4: Regression Results of Relations between Government-stated Social Welfare or Non-economic Objectives and SOEs’ Social Welfare Representative Financial Performance during 2004–2010 Based on SOE-type Groups (cont.)
Dependent Variable: Labour Cost
Independent variables
Pred. Sign Publicly listed Non-restricted Restricted All
+/- Coeff t p Coeff t p Coeff t p Coeff t p
Constant -7885.632 -1.57 0.138 -526.8515 -2.26 0.027 -383.8643 -0.68 0.499 -223.084 -4.58 0.000
Asset + 1041.772 2.00 0.065 106.8771 3.01 0.003 207.5294 3.66 0.001 325.4277 5.05 0.000
Leverage - -804.983 -0.62 0.548 -175.4506 -2.25 0.027 -286.1981 -2.34 0.025 -452.3754 -1.63 0.105
Provision of public goods and services - 428.4466 1.91 0.076 -40.1749 -0.71 0.481 -231.5505 -0.58 0.566 414.2086 1.61 0.109
National economic - -750.4008 -8.15 0.000 51.3385 1.12 0.268 -508.7517 -1.29 0.204 345.8717 1.57 0.119
National development - 1614.241 2.94 0.011 -89.0022 -0.90 0.372 -23.4444 -0.20 0.840 -102.0381 -0.64 0.526
National security - -96.7673 -1.02 0.309 63.5825 0.63 0.535 -238.5671 -0.80 0.422
Industrialisation - -104.8994 -0.87 0.389 -16.6436 -0.04 0.967
OHS - 3387.615 4.97 0.000 88.0658 0.76 0.451 -37.1390 -4.72 0.000 364.6219 1.09 0.279
Community development - -47.4855 -0.80 0.426 1261.415 2.69 0.011 625.3237 1.95 0.054
Community prosperity - -4371.495 -3.70 0.002 -27.2050 -0.32 0.749 292.2525 0.92 0.362 -106.7168 -0.45 0.656
Community needs - -140.7177 -0.69 0.501 6.8745 0.12 0.903 -344.5718 -1.75 0.089 -319.9757 -1.34 0.184
Government policy - 227.44 1.60 0.113 485.4055 1.02 0.313 519.19 1.53 0.129
Government special needs - 106.952 0.90 0.370 234.5083 0.54 0.590 -380.4061 -1.53 0.130
State budget - -1097.274 -1.48 0.161 -64.8017 -1.37 0.173 -709.0133 -1.71 0.089
Market supply and stabilisation - -123.5776 -1.27 0.206 896.585 1.51 0.133
Company type -59.7448 -0.32 0.749 -35.8097 -0.28 0.777
Listed 430.2745 1.06 0.290
Number of observation 85 469 235 789
Adjusted R-square 0.9152 0.4941 0.7830 0.5926
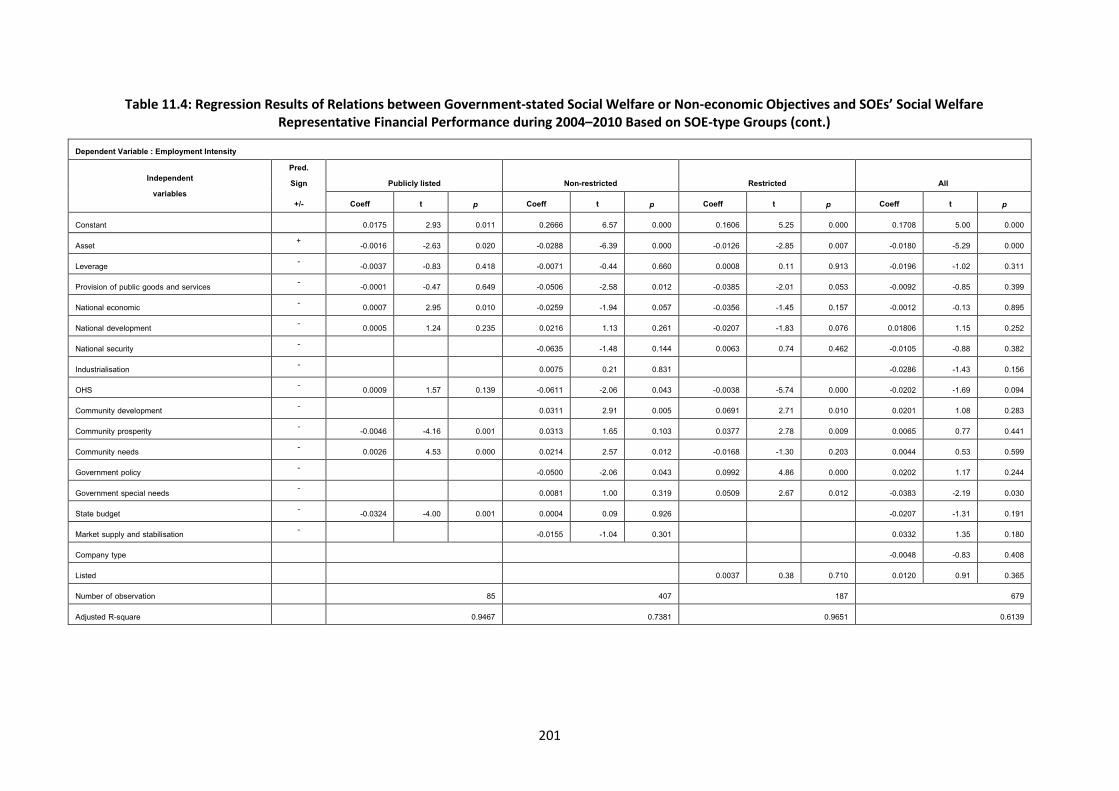
201
Table 11.4: Regression Results of Relations between Government-stated Social Welfare or Non-economic Objectives and SOEs’ Social Welfare Representative Financial Performance during 2004–2010 Based on SOE-type Groups (cont.)
Dependent Variable : Employment Intensity
Independent variables
Pred. Sign Publicly listed Non-restricted Restricted All
+/- Coeff t p Coeff t p Coeff t p Coeff t p
Constant 0.0175 2.93 0.011 0.2666 6.57 0.000 0.1606 5.25 0.000 0.1708 5.00 0.000
Asset + -0.0016 -2.63 0.020 -0.0288 -6.39 0.000 -0.0126 -2.85 0.007 -0.0180 -5.29 0.000
Leverage - -0.0037 -0.83 0.418 -0.0071 -0.44 0.660 0.0008 0.11 0.913 -0.0196 -1.02 0.311
Provision of public goods and services - -0.0001 -0.47 0.649 -0.0506 -2.58 0.012 -0.0385 -2.01 0.053 -0.0092 -0.85 0.399
National economic - 0.0007 2.95 0.010 -0.0259 -1.94 0.057 -0.0356 -1.45 0.157 -0.0012 -0.13 0.895
National development - 0.0005 1.24 0.235 0.0216 1.13 0.261 -0.0207 -1.83 0.076 0.01806 1.15 0.252
National security - -0.0635 -1.48 0.144 0.0063 0.74 0.462 -0.0105 -0.88 0.382
Industrialisation - 0.0075 0.21 0.831 -0.0286 -1.43 0.156
OHS - 0.0009 1.57 0.139 -0.0611 -2.06 0.043 -0.0038 -5.74 0.000 -0.0202 -1.69 0.094
Community development - 0.0311 2.91 0.005 0.0691 2.71 0.010 0.0201 1.08 0.283
Community prosperity - -0.0046 -4.16 0.001 0.0313 1.65 0.103 0.0377 2.78 0.009 0.0065 0.77 0.441
Community needs - 0.0026 4.53 0.000 0.0214 2.57 0.012 -0.0168 -1.30 0.203 0.0044 0.53 0.599
Government policy - -0.0500 -2.06 0.043 0.0992 4.86 0.000 0.0202 1.17 0.244
Government special needs - 0.0081 1.00 0.319 0.0509 2.67 0.012 -0.0383 -2.19 0.030
State budget - -0.0324 -4.00 0.001 0.0004 0.09 0.926 -0.0207 -1.31 0.191
Market supply and stabilisation - -0.0155 -1.04 0.301 0.0332 1.35 0.180
Company type -0.0048 -0.83 0.408
Listed 0.0037 0.38 0.710 0.0120 0.91 0.365
Number of observation 85 407 187 679
Adjusted R-square 0.9467 0.7381 0.9651 0.6139
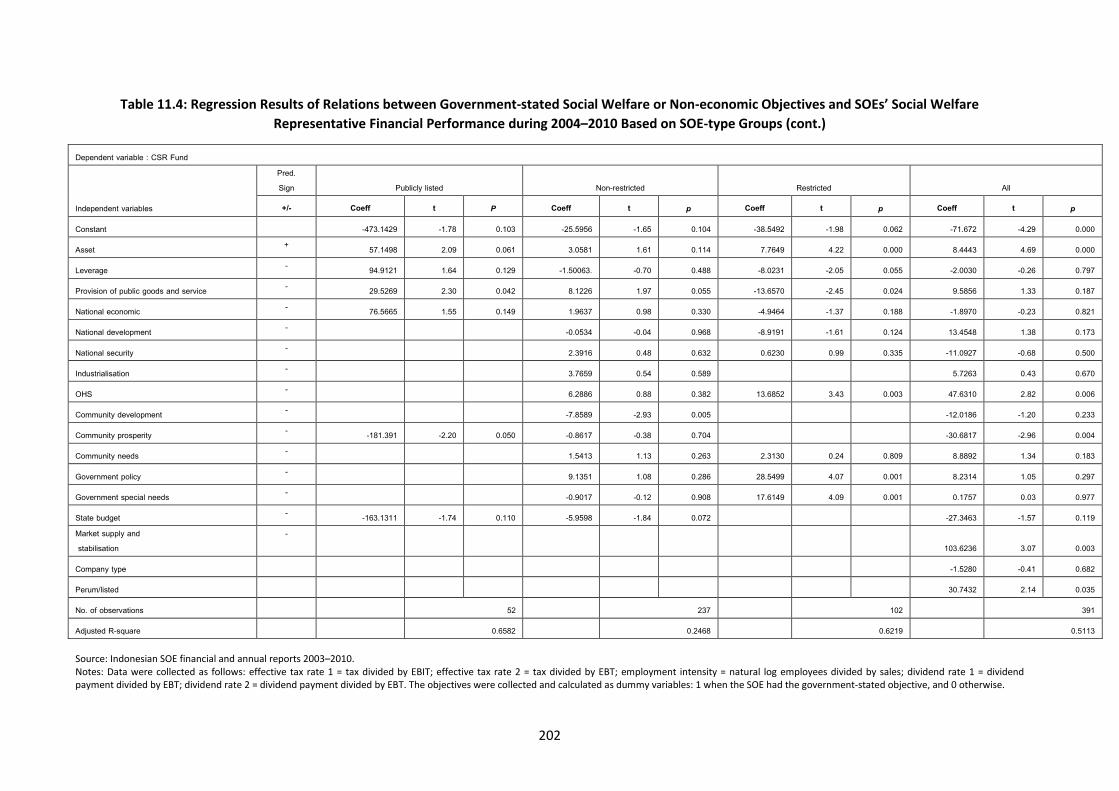
202
Table 11.4: Regression Results of Relations between Government-stated Social Welfare or Non-economic Objectives and SOEs’ Social Welfare
Representative Financial Performance during 2004–2010 Based on SOE-type Groups (cont.)
Dependent variable : CSR Fund
Independent variables
Pred. Sign Publicly listed Non-restricted Restricted All
+/- Coeff t P Coeff t p Coeff t p Coeff t p
Constant -473.1429 -1.78 0.103 -25.5956 -1.65 0.104 -38.5492 -1.98 0.062 -71.672 -4.29 0.000
Asset + 57.1498 2.09 0.061 3.0581 1.61 0.114 7.7649 4.22 0.000 8.4443 4.69 0.000
Leverage - 94.9121 1.64 0.129 -1.50063. -0.70 0.488 -8.0231 -2.05 0.055 -2.0030 -0.26 0.797
Provision of public goods and service - 29.5269 2.30 0.042 8.1226 1.97 0.055 -13.6570 -2.45 0.024 9.5856 1.33 0.187
National economic - 76.5665 1.55 0.149 1.9637 0.98 0.330 -4.9464 -1.37 0.188 -1.8970 -0.23 0.821
National development - -0.0534 -0.04 0.968 -8.9191 -1.61 0.124 13.4548 1.38 0.173
National security - 2.3916 0.48 0.632 0.6230 0.99 0.335 -11.0927 -0.68 0.500
Industrialisation - 3.7659 0.54 0.589 5.7263 0.43 0.670
OHS - 6.2886 0.88 0.382 13.6852 3.43 0.003 47.6310 2.82 0.006
Community development - -7.8589 -2.93 0.005 -12.0186 -1.20 0.233
Community prosperity - -181.391 -2.20 0.050 -0.8617 -0.38 0.704 -30.6817 -2.96 0.004
Community needs - 1.5413 1.13 0.263 2.3130 0.24 0.809 8.8892 1.34 0.183
Government policy - 9.1351 1.08 0.286 28.5499 4.07 0.001 8.2314 1.05 0.297
Government special needs - -0.9017 -0.12 0.908 17.6149 4.09 0.001 0.1757 0.03 0.977
State budget - -163.1311 -1.74 0.110 -5.9598 -1.84 0.072 -27.3463 -1.57 0.119 Market supply and stabilisation
- 103.6236 3.07 0.003
Company type -1.5280 -0.41 0.682
Perum/listed 30.7432 2.14 0.035
No. of observations 52 237 102 391
Adjusted R-square 0.6582 0.2468 0.6219 0.5113 Source: Indonesian SOE financial and annual reports 2003–2010. Notes: Data were collected as follows: effective tax rate 1 = tax divided by EBIT; effective tax rate 2 = tax divided by EBT; employment intensity = natural log employees divided by sales; dividend rate 1 = dividend payment divided by EBT; dividend rate 2 = dividend payment divided by EBT. The objectives were collected and calculated as dummy variables: 1 when the SOE had the government-stated objective, and 0 otherwise.
203
11.3 Potential Conflicting Objectives
Referring to Chapters 8 and 9, the analysis of government-stated objectives and the privatisation
policy shows that there are some potentially conflicting objectives. These potential conflicts arise
following the implementation of privatisation policies that encourage SOEs to have multiple or
mixed objectives, including economic and financial along with non-economic objectives. Conflicts
also occur as a result of competing interests between the market and state welfare orientations in
regard to economic control policy. This thesis shows that, on average, each SOE holds at least seven
objectives, with three government-stated objectives and four corporate objectives. This thesis
conducts additional tests to estimate whether there is sufficient evidence to support previous
qualitative results in this thesis regarding potential conflicts of objectives that may affect SOEs’
performance. This is done using a similar regression model as shown in Equation (1).
From the previous test in Section 11.1, the combined seven economic and financial objectives tested
against the combined 14 social welfare and non-economic objectives showed limited effects on
SOEs’ performance. Meanwhile, the analysis in Chapters 8 and 9 showed that potentially conflicting
objectives occurred following the introduction of new profit and efficiency objectives. This section
focuses on the extent to which SOEs’ financial performance is affected when only two objectives
(profit and efficiency) are tested against the 14 social welfare and non-economic objectives. Early
studies regarding public service obligations showed that profit and efficiency are the most common
objectives that are hindered by social welfare maximising and national economic objectives
(Hanschen, 2004; Martin, 1996). Using this assumption, this section focuses only on SOEs that hold
government-stated profit and efficiency objectives combined with social welfare maximising and
non-economic objectives. Tests between the combined profit and efficiency objectives against the
government-stated social welfare and non-economic objectives resulted in no effects on all SOEs’
financial performance. This is because the profit and efficiency objectives were eliminated (or
‘omitted’) when the testing specifically focused on combining only the profit and efficiency
objectives against the social welfare and non-economic objectives.
11.4 Discussion and Findings
This section aimed to provide sufficient evidence to support the results regarding the examination of
hypotheses one and two. Hypothesis one examined whether the introduction of new objectives
resulting from the privatisation policy and the liberalisation of the market economy resulted in
conflicting objectives for SOEs and new privatised firms’ objectives and business activities.
Hypothesis two examined whether changes to SOEs’ and new privatised firms’ objectives and
business activities resulting from the privatisation policy improved their performance. The
204
preliminary results from the qualitative analysis and two-sample t-tests showed that the
government-stated objectives were theoretically in conflict because the government was
inconsistent in implementing its new policies regarding the introduction of the profit and efficiency
objectives. This inconsistency affected the relations between the objectives and performance, as
shown in the two-sample t-test results, which indicated that the objectives tend to decrease
financial performance. Using the regression results, this chapter examined and estimated the
relations between the government-stated objectives and SOEs’ financial performance.
The regression results also showed the lesser ability of SOE groups to estimate relations between the
objectives and performance. Tables 11.1–11.4 indicated that non-privatised SOEs show more
relations between the government-stated objectives and financial performance than publicly listed
SOEs. The government-stated economic or financial objectives indicated some positive relations with
non-privatised SOEs’ financial performance. The government-stated profit objective showed a
positive estimated relation with the ROA and EBIT margin for non-privatised SOEs with privatisation
restrictions, and for ROE performance for non-privatised SOEs without privatisation restrictions. In
contrast, this profit objective showed a negative association of -8.54 points for non-privatised SOEs
with privatisation restrictions’ net income. None of the SOEs’ financial performance, except for non-
privatised SOEs without privatisation restriction’s employment intensity and effective tax rates when
the interest is excluded in measurement, estimated the relations with the government-stated
efficiency objectives.
The government-stated social welfare or non-economic objectives showed more influences on each
SOE group’s performance. Publicly listed SOEs showed more relations between the government-
stated social welfare or non-economic objectives and SOEs’ financial performances. The objectives
could prevent SOEs from showing better financial performance. The estimation of the relations
between SOEs’ social welfare representative financial performance and the government-stated
social welfare or non-economic objectives supports the results from the previous two-sample t-test.
Limited relations between the government-stated social welfare or non-economic objectives and
SOEs’ social welfare representative financial performance showed that Indonesian SOEs can only
make contributions through taxes and dividends when they are supported by external funds. Table
11.4 showed that when interest is part of the measurement, SOEs’ social welfare representative
financial performance, such as taxes and dividends, is improved. Contradictory relations are found as
the government-stated state budget contribution objective prevents publicly listed SOEs from
contributing through taxes and dividends, as shown through their effective tax and dividend rates
performance.
205
In summary, a high reliance on non-core business and external financial support makes it difficult for
SOEs to meet the government’s expectations. Despite the introduction of new rules regarding the
implementation of profit and efficiency objectives, the Indonesian government has shown
inconsistency and resistance to changing or implementing them for each SOE. This has resulted in
few to no relations between the government-stated objectives and SOEs’ financial performances.
Further effects were found in SOEs’ lack of ability to make contributions to state budget or
community development, as most SOEs showed poor performance. Meanwhile, the estimation of
the relations between the government-stated social welfare or non-economic objectives and SOEs’
financial performance supports previous studies, which found that public service obligation and
social welfare duties prevent SOEs from being profitable and efficient. A contradictory result was
found when the government encouraged SOEs to make contributions to the state budget, as the
objective prevented SOEs from making contributions, as shown in the tax and dividend results.
Employment remains an issue for both publicly listed and non-privatised SOEs. The government-
stated objective regarding employment matters may worsen SOEs’ productivity and financial
performance. Focusing exclusively on hypothesis two, whether the changes to SOEs’ and new
privatised firms’ objectives and business activities as the result of the privatisation policy improve
SOEs’ and new privatised firm’s performance, the results showed that changes to SOEs’ and new
privatised firms’ objectives and business activities resulting from the privatisation policy do not
affect SOEs’ and new privatised firms’ performance. These results are supported by the fact that
most Indonesian SOEs are highly reliant on external financial support and non-core business
incomes. SOEs still deal with poor performance and inefficiency issues, as shown from the results in
this chapter. The results from the qualitative analysis showed that the government-stated objectives
for SOEs are theoretically in conflict. In fact, the regression results did not support this result. The
regression results showed that the theoretically conflicting objectives have no effect on SOEs’
financial performance. Based on these results, Indonesian SOEs can be successful vehicles for
attaining the government-stated social welfare objectives; however, these social welfare and non-
economic expectations create risks for SOEs’ other (financial) performance, which may hinder their
ability to independently carry out their social welfare duties unless the government keeps providing
(financial) support.

206
Chapter 12:
Discussion and Conclusion
This Chapter first summarises this thesis and then discusses the main results based. The last part of
this chapter discusses the contribution and implications and limitations. Future research is the next
section which is aimed to show potential studies as results or may need further analysis from this
thesis. Conclusion is the last section of this chapter.
12.1 Summary
This thesis assesses the extent to which Indonesian SOEs are successful vehicles for attaining
government objectives by examining three main issues. First, the evolution of SOEs is examined in
relation to the historical changes in government-stated objectives for SOEs. Second, as a crucial
element in the evolution of Indonesian SOEs, this thesis examines the implications of privatisation
policy and partial privatisation on the government-stated objectives for SOEs. Third, the thesis
evaluates the potential for Indonesian SOE objectives to be in harmony or conflict.
12.1.1 The Evolution of SOEs in Relation to the Historical Changes in Government-Stated Objectives
for SOEs
The evolution of SOEs in relation to the historical changes in government-stated objectives for SOEs
is examined using historical path analysis. This analysis shows that the evolution of Indonesian SOEs
occurred in three main stages in terms of policy and political regimes: Indonesianisation (1945-
1958), Nationalisation (1958-1965) and Corporatisation (1965-2010). The Indonesianisation and
Nationalisation stages occurred under Old Order political regime. The Corporatisation stage was
spread across two political regimes. It was initiated in 1968 under New Order regime (1965-1998)
and continued under the Reformation regime (from 1998).
The first period of evolution, Indonesianisation, commenced with Indonesia’s political independence
in 1945 and continued until to 1958. In this period, SOEs were established as Indonesia state
enterprises to achieve socio-political purposes, as a consequence of centralisation control policy
when the political and economic state was unstable. The centralisation control policy was mainly
intended to protect the nation’s resources from conflict and abuse of power. The state enterprises
generally carried multiple socio-political objectives.
The second period of evolution, Nationalisation, commenced in 1958 in response to ongoing
economic and political conflict between the new Indonesian republic and its old colonial rulers, The
Netherlands. Labour unrest and challenges to the government’s authority led the government to

207
forcibly take over Dutch companies, often using the military to ensure control these companies and
other nationalised business. A new SOE structure, Perusahaan Negara, was introduced to eliminate
diversity in organisation structure of nationalised entities and previously held state-owned entities,
followed by categorising the companies based on purposes; provision of service, handling of public
interest and obtaining review. The centralisation of control over resources under 822 state
companies attracted international economic reprisals, leading to a change in the political regime in
1965.
The third period of evolution is the corporatisation of SOEs that from commenced in 1969 and
continued to 2010. With the implementation of corporatisation policies, the Perusahaan Negara was
modified into three different structures; Perjan, Perum and Persero. However, this corporatisation
was limited to management scope. Perjan (Bureau Enterprise) is an enterprise providing public
services without any explicit profit making objective. Perum (Public Company) is an incorporated
entity providing public utilities that have an explicit profit objective and with management structures
that are intended to follow orthodox private sector corporations in market-oriented economies.
Persero (limited liability) is a corporation owned by the government through share ownership and
operated on a commercial basis. In 1983, the Indonesian government introduced the Badan Usaha
Milik Negara (BUMN/SOE) structure to replace the Perusahaan Negara. The introduction of the
BUMN structure was driven by increased market orientation policies that emphasised the profit
objectives, particularly for the Persero. The introduction of fast track privatisation in 2002 increased
the emphasis on economic objectives and included implementation of full corporatisation principles
for all SOEs. Facilitating the fast tract privatisation program lead to profit and efficiency objectives
becoming the affected SOEs’ and the government’s main concerns. Consequently, the government
eliminated the Perjan structure because it was considered to be a barrier to implementing the full
corporatisation principles where profit and efficiency objectives become main concerns.
12.1.2 The Implications of Privatisation Policy, and Partial Privatisation, on the Government-Stated
Objectives for SOEs
The implications of privatisation policy and partial privatisation on the government-stated objectives
for SOEs are examined through historical path analysis. Indonesia’s moves towards a market
economy included the introduction of privatisation policies. Privatisation in Indonesia occurred in
two periods; these were the re-privatisations of nationalised enterprises in 1966 and partial
privatisations of SOEs since 1971. Re-privatisations were the consequence of external pressures for
the Indonesian government to compensate previous owners of the nationalisation companies, which
led the government to transfer full ownership back to previous owners in 1966. Since 1971,
208
privatisations Indonesia were motivated by the implementation of market orientation policy. This
was mainly affected through partial privatisation.
The analyses in Chapters 6 and 7 show the privatisation policies substantially affected government-
stated SOEs’ objectives. Profit and efficiency objectives become the government and SOEs main
concern as the government issued regulations to the UU BUMN no. 19/2003 (SOEs Act no 19/2003)
and to and PP Privatisation no. 33/2005 (Privatisation Rule no 33/2005). As discussed in Chapter 7
privatisation policy in Indonesian is aimed to support state budget or enhance market development.
Potential conflicting objectives emerged when the government was required to accommodate public
and market pressure regarding fair competition for SOEs. Through privatisation policy, the
government was required to open the markets which used to be monopolised for SOEs only. This
makes economic objectives such as profit and efficiency become SOEs and government concerns. In
practice, the potential for conflicting objectives is increased when the government retains its control
of partially privatised SOEs and continues to impose social welfare and non-economic objectives,
while the government also encourages SOEs and partial privatised SOEs to achieve profit and
efficiency objectives as stated on the SOEs Act no 19/2003 and Privatisation Rule no 33/2005.
12.1.3 The Potential for Indonesian SOE Objectives to be in Harmony or Conflict
Interpretive content analyses are used to examine the potential for the Indonesian SOEs objectives
to be in harmony or conflict in Chapters 8 and 9. The results show that the government is
inconsistent in implementing the new policies for SOEs. The government did not change its stated
social welfare and non-economic objectives for any partially privatised SOEs, which nonetheless
were expected to meet market expectations. The analysis in Chapter 9 shows that the government
changed its stated social welfare and non-economic objectives for ten non-privatised SOEs but
introduced a government-stated profit objective for only one, PT Pertamina.
The analyses in Chapters 8 and 9 show SOEs’ management tended to restate their versions of SOEs’
objectives to accommodate both the government and market interests. The interpretive analysis in
Chapters 8 and 9 indicate substantial potential for conflict in attempting to satisfy the government’s
social welfare and non-economic objectives and the inferred profitability and efficiency objectives of
market investors.
12.1.4. Overall Evidence as to the Extent to which the Indonesian SOEs are Successful Vehicles for
Attaining Government Objectives
The potential for conflict between social welfare and non-economic objectives and profitability and
efficiency objectives is assessed quantitatively in Chapters 10 and 11. As reported in Chapter 10, t-
tests indicate some weak negative relations between various government objectives and SOEs’
209
financial performance. This is also supported by the regression results reported in Chapter 11. The
regression results indicate that social welfare objectives have some tendency to impair the SOEs’
financial performance, but they are not sufficiently persuasive to conclude that the potentially
conflicting social welfare and non-economic objectives impact on SOEs’ financial performance.
Overall, the analyses reveal some major SOEs issues. Poor financial performance and inefficiency are
a major problem for Indonesian SOEs, which are highly reliant on non-core business income and
external financial support through subsidies and or other government financial support. The poor
performance and inefficiency is often as a consequence of the requirement for SOEs to carry
additional duties other than their original or existing duties. This additional duty usually affects the
SOEs financial performance as reported through several cases in Chapter 8. This situation is
consistent with earlier SOEs studies that show that government involvement in SOEs’ decisions and
business activities may affect the SOEs financial performance (Ang and Ding, 2006; Astami et al.,
2010; Shirley, 1999; Shleifer and Vishny, 1994).
Centralisation of control in Indonesian emerged as a consequence of the failure of the market
orientation policies during Indonesianisation period. In practice, the historical analysis in Chapters 6
and 7 show that the fiscal problems occur as a consequence of the government centralisation of
economic policy control. This centralisation of control makes the Indonesian government objectives
for SOEs are still dominated by social welfare or non-financial objectives. Profit and efficiency
objectives which were introduced through UU BUMN no. 19/2003 and Privatisation Rule no.
33/2005 are still limited to be part of the SOEs or government’s objectives for SOEs. The domination
of social welfare and non-economic objectives are in relations to the provision of public goods and
services. Meanwhile, the rules still provide a space for the government to ask the SOEs to carry
social welfare or socio-political obligations other than existing objectives, even after the firms are
privatised. This poor performance and inefficiency is occurred as the consequences of theses social
welfare duties. Social welfare may hinder the possibility for SOEs to earn profit (Hamzah, 2007;
Hanschen and Erspamer, 2004; Martin, 1996) as shown through the quantitative results in this
thesis. High cost of production requires the government support for SOEs to keep running their
business (Hill, 1982). The fact that the Indonesian SOEs rely on the external financial supports is
shown through their financial figures in Chapters 10 and 11. Negative equity requires support from
the government other than subsidies as found through several cases such as PT PLN and Perum PFN.
Several other cases in Chapters 8 and 9 shows the government support through soft loans or
privileges for SOEs to get access for financial support.
The implementation of privatisation policy aimed to improve the SOEs performance. In practice, the
policy fails to meet the economic expectations. Privatisation policy is followed by the liberalisation of

210
market economy affects both the Indonesian publicly listed SOEs and non-privatised SOEs’ objectives
and business activities. Privatisation policy brings the economic or financial objectives; profit and
efficiency to be part of the government and SOEs concerns. In practice, privatisation does not seem
to make any different for the Indonesian government-stated objectives for each individual SOE. The
content analysis in Chapters 8 and 9 shows the government is inconsistent to implement the new
policies. The conflicting objectives start when government-stated objectives for social welfare and
non-economic should be in line with profit and efficiency objectives. Further analysis in Chapters 10
and 11 indicate some weak negative relations between the objectives and financial performance.
Decoupling appears as a consequence of the Indonesian government inconsistency to implement
new rules. Decoupling emerges when the changes are the consequences of external pressure or
coercive. Coercive changes occur when the change is driven by enforcement internal or external the
organisation (DiMaggio and Powell, 1983; Mizruchi and Fein, 1999). The pressure for the Indonesian
government to reform its SOEs is motivated by the requirement to resolve fiscal problems and the
IMF engagement. Partial privatisation is a reflection of decoupling which is selected as to
accommodate both interests. Partial privatisation allows the government to meet the privatisation
expectation, while this also allows the government to keep controlling the new privatised firm as
shown on earlier studies of privatisation in various emerging market economies (Boubakri et al.,
2005b; 2005c, Milne, 1992; Ramamurti, 1999; Shirley, 1999). Although fully privatisation has been
done in very limited numbers, in particular for the companies which were less political sensitivity or
the government was minority shareholders; partial privatisation is selected by the Indonesian
government to meet both the IMF’s privatisation and the 1945 Constitution of Indonesia
expectations. Partial privatisation is also argued to allow the government to assure the quality and
quantity of public services and goods for community (Ramamurti, 1999). This situation is supported
by the fact that the Indonesian government remains controlling the tariff and distribution for
publicly listed SOEs as shown within toll road, telecommunication and mining publicly listed SOEs
cases in Chapter 8.
12.2 Contributions
This thesis better informs Indonesian SOEs policy development and contributes to the research
literature concerned with Indonesian government policy development and, more broadly, the
consequences of (partial) privatisation policies in emerging markets, and to the literature regarding
government objectives and SOE performance.
PSOs usually relate to government duties for the provision of public goods and services due to the
absence of private participants able to provide the necessary products. Although earlier studies
211
show mixed results with respect to government ownership, subsidies, supply and the cost of PSOs
(Anderson, 1983), the Indonesian SOEs demonstrate that certain public utilities can be operated on a
commercial basis. Commercialisation of PSOs may enable the SOEs to attain other objectives and
improve their performance. This can be achieved through separate financial control for PSO duties.
Separate financial control makes it easy for the SOEs to attain their social welfare objectives without
disadvantaging their other objectives.
This thesis also contributes to the study of government policies for SOEs. The results from this thesis
show the important roles of government policy for SOEs. This thesis shows the government policies
are still a major problem preventing the SOEs from attaining their objectives. Overlapping
regulations make it difficult for SOEs to accommodate all parties’ interests, particularly when the
interests are conflicting. In contrast, the results of this thesis also present the crucial role of
government policy in enabling SOEs to operate their businesses and to make business decisions. The
implementation of privatisation policy, for example, encourages the development of economic
objectives such as profit, efficiency and competition. In practice, management authority in decision
making process and limited government involvement are shown to have positive impacts on the
ability of SOEs to meet the expectations.
Privatisation policies in particular partial privatisation provide certain contributions to studies of
SOEs. This study of the Indonesian privatisation shows that privatisation is more likely to be
undertaken for socio-economic purposes. This thesis demonstrates that the process of privatisation
and re-privatisation in Indonesia become a pattern for the government to achieved national
economic stability and resolve fiscal problems. This means that privatisation has no effect on the
SOEs’ objectives, performances, and policies. This study reveals that this unfinished privatisation or
partial privatisation is actually due to the government’s intention to accommodate various parties’
interests and the legal constraints that emphasise that control policies should remain in the
government’s hands.
SOEs’ performance is also one of these thesis contributions. This study reveals some implications
from the previous path of institutional changes or the evolution including the government
involvement and control which claim as determinant factor for this poor performance and
inefficiency. The long term performance expectation for the Indonesian SOEs is set to provide social
welfare equality for community. The current performance of Indonesian SOEs is considered as the
best outcome for society even though it is not the most efficient performance. This current
performance is considered to give the best outcome in relations to distribution of benefits and
resources allocation for community. This current performance is also a reflection of the government
212
legitimacy and political interest protection. This result supports the previous SOEs study to
understand why the government keep its SOEs running in poor performance.
The evolution of government objectives and their implications for SOE activities and performance
are the main focus of this thesis. The reported analyses contribute to the academic literature by
demonstrating the continuing importance of government-stated objectives following patial
privatisation. The historical path analysis of Indonesian government-stated objectives for SOEs
shows a crucial continuing influence of socio-economic dynamics during the establishment and
development of SOEs. The analysis of government objectives for SOEs in relation to policy
development and market reforms identified potential conflict between various government-stated
objectives for SOEs. However, the potentially conflicting objectives only weakly explain differences in
SOEs financial performance. The evolution of government-stated objectives also demonstrates
limited changes to SOEs’ objectives even when market and structures are changed, suggesting that
the government either decoupled its SOE objective setting processes from its privatisation programs,
or that partial privatisations were not regarded as a potential source of conflict in determining
objectives. This analysis of government-stated objectives also supports early studies of the roles and
function of SOEs and government in social welfare and national stabilisation. Government resistance
to changes causes the objectives to be dominated by non-financial expectations rather than financial
expectations. These non-financial objectives influence SOEs’ financial performance. The reported
analysis of SOEs financial performance shows that SOEs are high reliance on government or external
financial support to attain these non-financial objectives. The results are expected to better inform
SOEs policy development in developing countries like Indonesia.
12.3 Implications of this Thesis for Government and SOEs Policies and Development
The results from this thesis have implications for the future government and SOEs policy and
development. The results from this thesis show that the changes of market economy encourage the
government to review and issues numbers of new public policies regarding SOEs. This thesis shows
that privatisation drives the government to open the market including the market for non-privatised
SOEs. Opening market economy for private participants encourages fair competition and the
development of economic expectations. The changes of market also encourage SOEs managers to
make some adjustments regarding their objectives and business activities. Profit, efficiency and
competition become part of SOEs managers concerns following the changes of market economy.
This situation should be followed by government commitment to implement this liberalisation and
new policies.
213
This thesis shows that government policies are still major problem preventing SOEs from attaining
the main or existing objectives. Overlapping regulations make it difficult for SOEs to accommodate
all parties’ interests. The establishment of SOEs supervisory and control agent like the Indonesian
Ministry of SOEs may reduce these overlapping issues. Managing or coordinating these policies
under certain agent or government body will considerably reduce these problems. By reducing these
policies issues, SOEs management is able to focus on the existing objectives and eliminate the
uncertainty. This situation is crucial for SOEs and management since SOEs play important roles in the
emerging market economies like Indonesia.
Privatisation is a critical policy issue for Indonesian SOEs. As the most conventional economic policy,
privatisation is likely to become the state’s economic saviour, used to resolve national economic or
fiscal problems. This thesis shows that privatisation has political cost implications for the Indonesian
government rather than economic benefits for the SOEs. This political cost makes limited use of the
goals of privatisation, which emphasise improvement in performance and reducing the
government’s involvement. Since the Indonesian publicly listed SOEs also rely on the non-core
business income and external financial supports, though there is a need for further study of these
issues, the current situation is not beneficial for the sustainability of the SOEs and the Indonesian
national economy in particular when the government continues to use privatisation for the state
economic saviour.
The improvement of SOE performance is crucial for Indonesian SOEs, since this meaningfully affects
other contributions from the SOEs to the Indonesian national economy. This thesis shows that lack
of control and commitment from the government is a key factor for the Indonesian SOEs poor
performance. Focusing on corporatisation may be an alternative for the government to improve the
SOEs’ performance without compromising the 1945 Constitution’s goal. The implementation of
corporatisation should be followed by the government control and commitment. The government
control and commitment to implement profit and efficiency objectives are crucial. Meanwhile,
commercialisation of PSOs may enable the SOEs to attain other social objectives, while SOEs can
improve their performance. By separating their financial report for PSOs’ duties enables the SOEs to
focus on social welfare expectation without disadvantages the firm’s financial performance. To meet
this expectation, control policy from the government and the role of supervisory boards are needed,
particularly to eliminate conflicts of interest and improve the financial performances.
214
12.4 Limitations
The analysis of SOE objectives and performance is constrained by missing data as a result of the
unavailability of some SOEs’ annual reports. This occurs because some SOEs have not published their
financial report, although the government and the public encourage SOEs to publish their financial
reports. These situations make it difficult to treat all data equally particularly for social welfare
representative financial performance such as employees’ number, dividend and CSR fund are often
not available.
A more substantial limitation to the analysis in this thesis is the inability to measure performance in
relation many of the socio-political of welfare objectives. While some proxies for socio-political of
welfare have been considered, a consequence of this general limitation is the emphasis on financial
performance outcomes in the empirical analysis.
12.5 Future Research
Given the results in this thesis, at least two related areas of require further study to better
understand determinants of SOE effectiveness as vehicles for government policy.
First, further analysis is needed to understand the implications of managements’ changes to their
statements of their SOEs’ objectives, as identified in Chapters 8 and 9. Managements’ restatements
of SOEs’ objectives may have important implications for SOE performance. The analysis in Chapters 8
and 9 reveals that, while the government seldom modified objectives to reflect market interests in
partially-privatised or privatisable SOEs, but management often incorporated growth, efficiency and
profit objectives in their restatements of their SOEs’ objectives. Given that the statistical tests reveal
only weak or no relations between the government’s stated objectives and SOE performance, it is
plausible but not assured that managements’ choices are more influential in this regard.
Second, Chapter 8 suggests that changes in the government’s industrial policies may impact on SOE
performance. The analysis in this study suggests that changes in industrial policy have a substantial
influence on the SOEs’ decision-making processes and performance. As government agencies, the
SOEs play an important role in the industrialisation process. Because all Indonesian SOEs operate
across more than one industrial sector, the SOEs must deal with more than one ministerial authority.
There is potential for conflict between the interests and directions given to SOEs by different
ministerial agencies; for example, one ministry may emphasise efficiency or profitability while
another may emphasise socio-political or welfare objectives. The impacts on individual SOEs may
vary with a number of factors, including differences in the political importance of individual SOEs or
the attributes of SOE management.
215
These two issues are related through the choices of management in emphasising particular
government-stated objectives or by or adopting objectives not formally determined by government.
Analysis of these potentially complex relations is beyond the scope of this thesis.
12.6 Conclusion
This thesis assessed the extent to which the Indonesian SOEs are successful vehicles for attaining the
government objectives. The analyses indicate potential for conflict between government-stated
objectives. The potential conflict is particularly evident when the government has been inconsistent
in implementing new policies that confer profit and efficiency objectives on SOEs, while the
government continues to emphasise SOEs’ social welfare objectives. This potential conflict is mainly
found when changes in government policy introduce general profit and efficiency requirements but
the government does not make changes its stated objectives for individual SOEs, with social welfare
objectives dominating the formally stated objectives for individual SOEs. Empirical analysis shows
some weak negative relations between government-stated objectives and SOEs financial
performance. The financial analysis in Chapters 10 and 11 suggests that the need to subsidise social
welfare and non-economic objectives makes the Indonesian SOEs highly reliant on the non-core
business income (such as subsidies and asset disposals) and external financial support (such as soft
loans from government-controlled lenders).
Overall, while Indonesian SOEs may have potential to become more successful vehicles for attaining
the government socio-economic objectives, these social welfare and non-economic objectives are
likely to continue to impede the attainment of financial objectives.
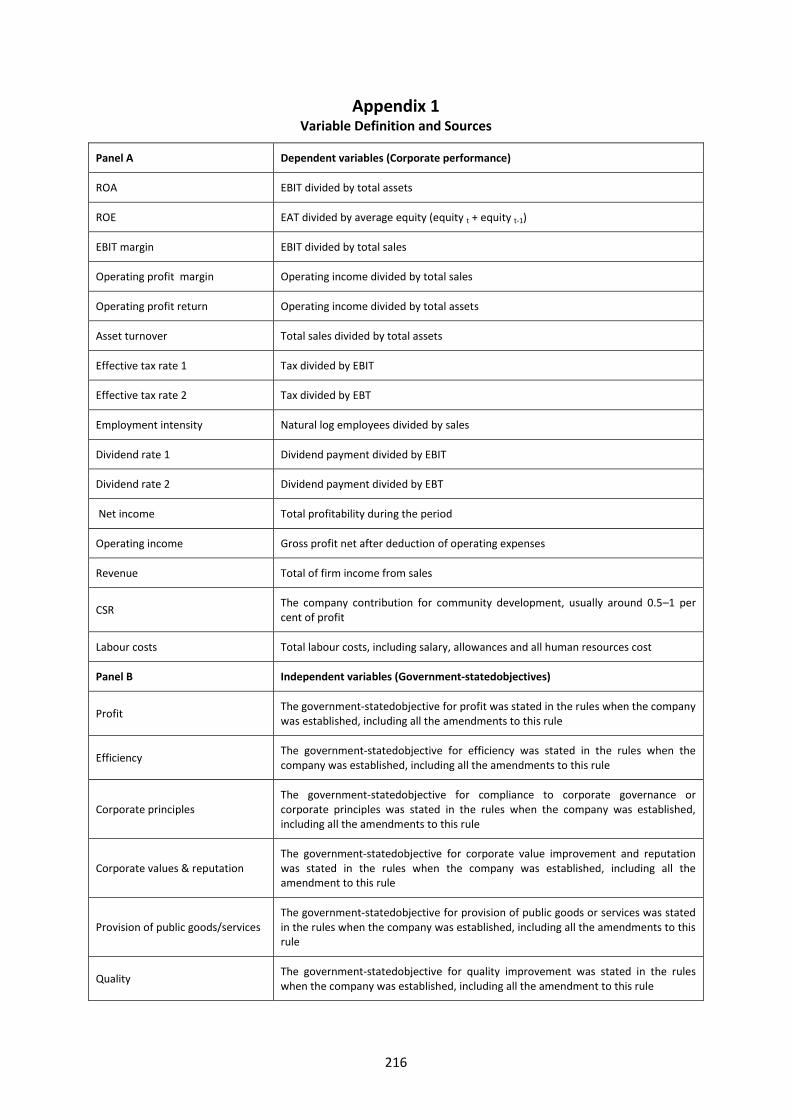
216
Appendix 1 Variable Definition and Sources
Panel A Dependent variables (Corporate performance)
ROA EBIT divided by total assets
ROE EAT divided by average equity (equity t + equity t-1)
EBIT margin EBIT divided by total sales
Operating profit margin Operating income divided by total sales
Operating profit return Operating income divided by total assets
Asset turnover Total sales divided by total assets
Effective tax rate 1 Tax divided by EBIT
Effective tax rate 2 Tax divided by EBT
Employment intensity Natural log employees divided by sales
Dividend rate 1 Dividend payment divided by EBIT
Dividend rate 2 Dividend payment divided by EBT
Net income Total profitability during the period
Operating income Gross profit net after deduction of operating expenses
Revenue Total of firm income from sales
CSR The company contribution for community development, usually around 0.5–1 per cent of profit
Labour costs Total labour costs, including salary, allowances and all human resources cost
Panel B Independent variables (Government-statedobjectives)
Profit The government-statedobjective for profit was stated in the rules when the company was established, including all the amendments to this rule
Efficiency The government-statedobjective for efficiency was stated in the rules when the company was established, including all the amendments to this rule
Corporate principles The government-statedobjective for compliance to corporate governance or corporate principles was stated in the rules when the company was established, including all the amendments to this rule
Corporate values & reputation The government-statedobjective for corporate value improvement and reputation was stated in the rules when the company was established, including all the amendment to this rule
Provision of public goods/services The government-statedobjective for provision of public goods or services was stated in the rules when the company was established, including all the amendments to this rule
Quality The government-statedobjective for quality improvement was stated in the rules when the company was established, including all the amendment to this rule
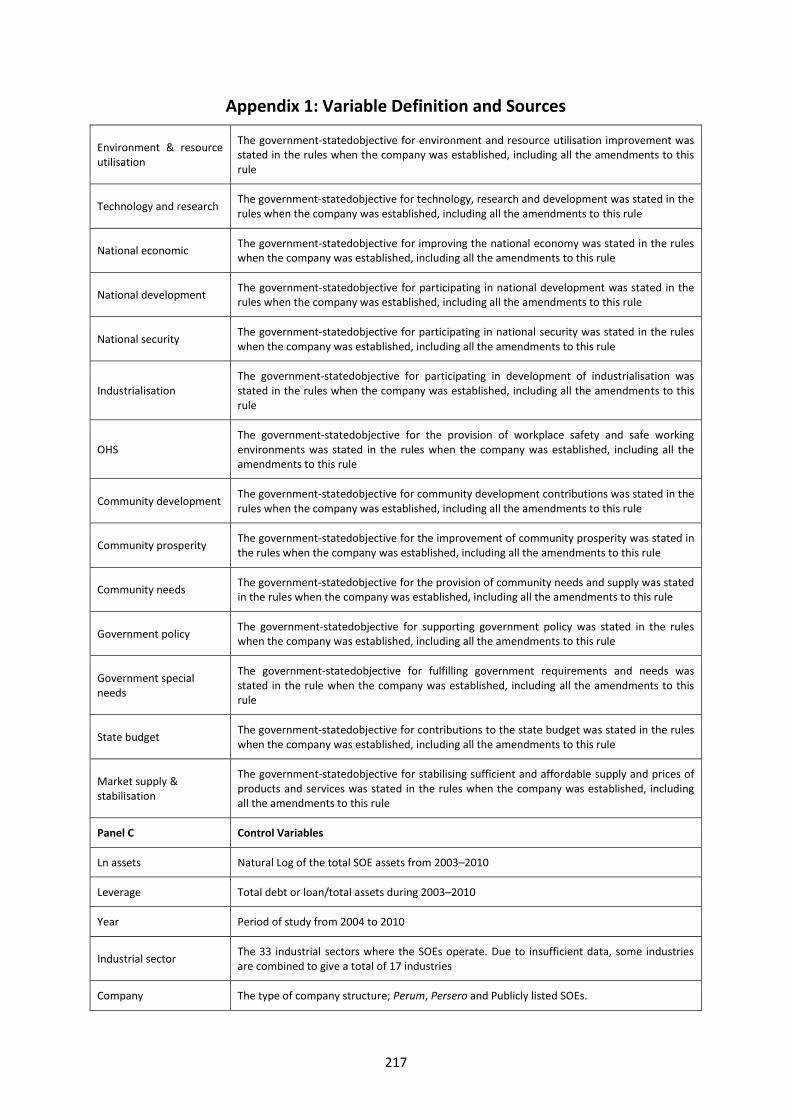
217
Appendix 1: Variable Definition and Sources
Environment & resource utilisation
The government-statedobjective for environment and resource utilisation improvement was stated in the rules when the company was established, including all the amendments to this rule
Technology and research The government-statedobjective for technology, research and development was stated in the rules when the company was established, including all the amendments to this rule
National economic The government-statedobjective for improving the national economy was stated in the rules when the company was established, including all the amendments to this rule
National development The government-statedobjective for participating in national development was stated in the rules when the company was established, including all the amendments to this rule
National security The government-statedobjective for participating in national security was stated in the rules when the company was established, including all the amendments to this rule
Industrialisation The government-statedobjective for participating in development of industrialisation was stated in the rules when the company was established, including all the amendments to this rule
OHS The government-statedobjective for the provision of workplace safety and safe working environments was stated in the rules when the company was established, including all the amendments to this rule
Community development The government-statedobjective for community development contributions was stated in the rules when the company was established, including all the amendments to this rule
Community prosperity The government-statedobjective for the improvement of community prosperity was stated in the rules when the company was established, including all the amendments to this rule
Community needs The government-statedobjective for the provision of community needs and supply was stated in the rules when the company was established, including all the amendments to this rule
Government policy The government-statedobjective for supporting government policy was stated in the rules when the company was established, including all the amendments to this rule
Government special needs
The government-statedobjective for fulfilling government requirements and needs was stated in the rule when the company was established, including all the amendments to this rule
State budget The government-statedobjective for contributions to the state budget was stated in the rules when the company was established, including all the amendments to this rule
Market supply & stabilisation
The government-statedobjective for stabilising sufficient and affordable supply and prices of products and services was stated in the rules when the company was established, including all the amendments to this rule
Panel C Control Variables
Ln assets Natural Log of the total SOE assets from 2003–2010
Leverage Total debt or loan/total assets during 2003–2010
Year Period of study from 2004 to 2010
Industrial sector The 33 industrial sectors where the SOEs operate. Due to insufficient data, some industries are combined to give a total of 17 industries
Company The type of company structure; Perum, Persero and Publicly listed SOEs.
218
References and Bibliographies
AARSET, B. & JAKOBSEN, S.-E. 2009. Political regulation and radical institutional change: The case of aquaculture in Norway. Marine Policy, 33, 280-287.
ABBOTT, P., ANDERSEN, T. B. & TARP, F. 2010. IMF and economic reform in developing countries. The Quarterly Review of Economics and Finance, 50, 17-26.
ABENG, T 2001, Indonesia Inc, Times Academic Press, Singapore. ABENG, T 2002, Professionalisme versus Politik: Tanri Abeng Menjawab, PT Elex Media Komputindo,
Jakarta. ADAMS, J 1996, ‘Principals and agents, colonialists and company men: The decay of colonial control
in the Dutch East Indies’, American Sociological Review, vol. 61, pp. 12–28. AGHION, P., BLANCHARD, O. & BURGESS, R. 1994. The behaviour of state firms in eastern Europe,
pre-privatisation. European Economic Review, 38, 1327-1349. AHARONI, Y 1981, ‘Performance evaluation of state-owned enterprises: A process perspective’,
Management Science, vol. 27, pp. 1340–1347. AHARONI, Y 1988, ‘Why do governments privatise?’, Technovation, vol. 8, pp. 7–23. AHMED, M. 1999. Privatization in Bangladesh. Privatization in South Asia Minimizing Negative Social
Effects through Restructuring; Joshi, G., Ed., International Labour Office: Geneva, 28-30. AIVAZIAN, VA, GE, Y & QIU, J 2005, ‘Can corporatisation improve the performance of state-owned
enterprises even without privatisation?’, Journal of Corporate Finance, vol. 11, pp. 791–808. ALIYA, A 2011, Kapitalisasi Pasar BUMN ditargetkan Rp. 960 Trilliun di 2011 (The SOEs market
capitalisation is targeted to reach Rp 960 trillion in 2011), Detik Finance. AMES, E. 1984. An evolutionary theory or economic change : , Cambridge, Mass.: Harvard Univ.
Press, 1982. xi + 437 pp., index; $25.00. Journal of Comparative Economics, 8, 217-221. ANASTASSOPOULOS, J.-P. 1985. State-owned Enterprises Between Autonomy and Dependency.
Journal of Public Policy, 5, 521-539. ANDERSON, BROG 1983, ‘Old state, new society: Indonesia’s new order in comparative historical
perspective’, The Journal of Asian Studies, vol. 42, pp. 477–496. ANDERSON, J. H., LEE, Y. & MURRELL, P. 1999. Do competition and ownership affect enterprise
efficiency in the absence of market institutions? Evidence after privatization in Mongolia. Evidence after Privatization in Mongolia (January 25, 1999).
ANDERSON, S. C. 1983. The effect of government ownership and subsidy on performance: Evidence from the bus transit industry. Transportation Research Part A: General, 17, 191-200.
ANG, JS & DING, DK 2006, ‘Government ownership and the performance of government-linked companies: The case of Singapore’, Journal of Multinational Financial Management, vol. 16, pp. 64–88.
ANORAGA, P 1995, BUMN, Swasta dan Koperasi: Tiga Pelaku Ekonomi (SOEs, private and cooperatives: Three business players), PT Dunia Pustaka Jaya, Jakarta.
ANSOFF, H. I. 1965. Corporate Strategy : An Analytic Approach to Business Policy for Growth and Expansion, New York, McGraw Hill Book Company.
AOKI, M 1996, ‘Introduction’, in M AOKI, H-K KIM & MO FUJIWARA (eds.) The role of government in East Asia Economic Development, Oxford University Press, Oxford.
ARENS, P. & BROUTHERS, K. D. 2001. Key Stakeholder Theory and State-Owned versus Privatized Firms. MIR: Management International Review, 41, 377-394.ARIFF, M, CABANDA, E & SATHYE, M 2009, ‘Privatisation and performance: Evidence from the telecommunications sector’, Journal of the Operational Research Society, vol. 60, pp. 1315–1321.
ARNDT, HW ‘Development and equality: The Indonesian case’, World Development, vol. 3, pp. 77–90.
ARNDT, HW 1981, ‘Development and equality: Themes in economic thought about Indonesia’, Journal of Southeast Asian Studies, vol. 12, pp. 464–475.
ASTAMI, EW, TOWER, G, RUSMIN, R & NEILSON, J 2010, ‘The effect of privatisation on performance of state-owned enterprises in Indonesia’, Asian Review of Accounting, vol. 18, pp. 5–19.
219
ATHANASSOPOULOS, AD & GIOKAS, D 1998, ‘Technical efficiency and economies of scale in state-owned enterprises: The Hellenic telecommunications organisation’, European Journal of Operational Research, vol. 107, pp. 62–75.
AULAKH, P. S. & KOTABE, M. 2008. Institutional changes and organizational transformation in developing economies. Journal of International Management, 14, 209-216.
AYUB, M. A. & HEGSTAD, S. O. 1987. Management of Public Industrial Enterprises. The World Bank Research Observer, 2, 79-101.
BAER, W. & BIRCH, M. 1992. Privatization and the changing role of the state in Latin America. NYUJ Int'l L. & Pol., 25, 1.
BAI, C-E, LI, DD, TAO, Z & WANG, Y 2000, ‘A multi-task theory of state enterprise reform’, Journal of Comparative Economics, vol. 28, pp. 716–738.
BAIRD, K. 2001. What is a community service obligation (CSO)? An analysis of the issues involved in identifying and accounting for CSOs within public sector organisations. Australian Journal of Public Administration, 60, 50-66.
BAJPAI, N. 1995. Economic Reforms in Developing Countries: Theory and Evidence. Economic and Political Weekly, 30, 113-118.
BAIJAL, P 2002, ‘Privatisation: Compulsions and options for economic reform’, Economic and Political Weekly, vol. 37, pp. 4189–4195.
BALASSA, B. 1988. The Lessons of East Asian Development: An Overview. Economic Development and Cultural Change, 36, S273-S290.
BAND, D. 1992. Corporate governance: Why agency theory is not enough. European Management Journal, 10, 453-459.
BARDHAN, P. 1989. The new institutional economics and development theory: A brief critical assessment. World Development, 17, 1389-1395.
BARDHAN, P. & ROEMER, J. E. 1992. Market Socialism: A Case for Rejuvenation. The Journal of Economic Perspectives, 6, 101-116.
BEARMAN, D. 1995. Archival Strategies. The American Archivist, 58, 380-413. BEBCHUK, L. A. & ROE, M. J. 1999. A theory of path dependence in corporate ownership and
governance. Stanford Law Review, 127-170. BENNETT, J. & MAW, J. 2003. Privatization, partial state ownership, and competition. Journal of
Comparative Economics, 31, 58-74. BALASSA, B. 1988. The Lessons of East Asian Development: An Overview. Economic Development
and Cultural Change, 36, S273-S290. BAND, D. 1992. Corporate governance: Why agency theory is not enough. European Management
Journal, 10, 453-459. BARDHAN, P. 1989. The new institutional economics and development theory: A brief critical
assessment. World Development, 17, 1389-1395. BARDHAN, P. & ROEMER, J. E. 1992. Market Socialism: A Case for Rejuvenation. The Journal of
Economic Perspectives, 6, 101-116. BEARMAN, D. 1995. Archival Strategies. The American Archivist, 58, 380-413. BEBCHUK, L. A. & ROE, M. J. 1999. A theory of path dependence in corporate ownership and
governance. Stanford Law Review, 127-170. BENNETT, J. & MAW, J. 2003. Privatization, partial state ownership, and competition. Journal of
Comparative Economics, 31, 58-74. BERK, J & DEMARZO, P 2009, Corporate finance: The core, Pearson Prentice Hall, Boston. BHATT, VV 1984, ‘Institutional framework and public enterprise performance’, World Development,
vol. 12, pp. 713–721. BLAIR, M. M. 1995. Ownership and control : rethinking corporate governance for the twenty first
century, Washington The brookings institutions. BIENEN, H & WATERBURY, J 1989, ‘The political economy of privatisation in developing countries’,
World Development, vol. 17, pp. 617–632.

220
BLANKART, CB 1987, ‘Limits to privatisation’, European Economic Review, vol. 31, pp. 346–351. BNI, P 2008a, Melayani Negeri, Kebanggaan Bangsa (Service the Country as The Pride to Nation), PT
BNI, Jakarta. BOARDMAN, A, FREEDMAN, R & ECKEL, C 1986, ‘The price of government ownership: A study of the
Domtar takeover’, Journal of Public Economics, vol. 31, pp. 269–285. BOARDMAN, AE & VINING, AR 1989, ‘Ownership and performance in competitive environments: A
comparison of the performance of private, mixed, and state-owned enterprises’, Journal of Law and Economics, vol. 32, pp. 1–33.
BOEHMER, E., NASH, R. C. & NETTER, J. M. 2005. Bank privatization in developing and developed countries: Cross-sectional evidence on the impact of economic and political factors. Journal of Banking & Finance, 29, 1981-2013.
BORTOLOTTI, B. & FACCIO, M. 2009. Government Control of Privatized Firms. The Review of Financial Studies, 22, 2907-2939.
BORTOLOTTI, B., FANTINI, M. & SINISCALCO, D. 2001. Privatisation: politics, institutions, and financial markets. Emerging Markets Review, 2, 109-137.
BORTOLOTTI, B., FANTINI, M. & SINISCALCO, D. 2004. Privatisation around the world: evidence from panel data. Journal of Public Economics, 88, 305-332.
BORTOLOTTI, B. & PINOTTI, P. 2008. Delayed Privatization. Public Choice, 136, 331-351. BORSUK, R 1993, ‘Jakarta's methods cloud satelite plan—Suharto son’s role in Palapa operator cast
shadow on privatisation’, Asian Wall Street Journal. BÖS, D 1987, ‘Privatisation of public enterprises’, European Economic Review, vol. 31, pp. 352–360. BÖS, D. 1993. Privatization in Europe: a comparison of approaches. Oxford Review of Economic
Policy, 95-111 BOUBAKRI, N., COSSET, J.-C., FISCHER, K. & GUEDHAMI, O. 2005a. Privatization and bank
performance in developing countries. Journal of Banking & Finance, 29, 2015-2041. BOUBAKRI, N., COSSET, J.-C. & GUEDHAMI, O. 2005b. Liberalization, corporate governance and the
performance of privatized firms in developing countries. Journal of Corporate Finance, 11, 767-790.
BOUBAKRI, N., COSSET, J.-C. & GUEDHAMI, O. 2005c. Postprivatization corporate governance: The role of ownership structure and investor protection. Journal of Financial Economics, 76, 369-399.
BOUBAKRI, N., COSSET, J.-C. & GUEDHAMI, O. 2009. From state to private ownership: Issues from strategic industries. Journal of Banking & Finance, 33, 367-379.
BOYCKO, M, SHLEIFER, A & VISHNY, RW 1996, ‘A theory of privatisation’, The Economic Journal, 106, 309–319.
BOYD, HW & LEVY, SJ 1966, ‘What kind of corporate objectives?’, Journal of Marketing, vol. 30, pp. 53–58.
BOZEC, R. & DIA, M. 2007. Board structure and firm technical efficiency: Evidence from Canadian state-owned enterprises. European Journal of Operational Research, 177, 1734-1750.
BRANCH, B. 1973. Corporate Objectives and Market Performance. Financial Management, 2, 24-29. BREALEY, RA & MYERS, SC 1991, Principles of corporate finance, McGraw-Hill Inc, New York. BREG, BL 1989, Qualitative research methods for the social sciences, Allyn and Bacon, Boston. BROADBERRY, S. & ENG, P. V. D. 2010. Historical perspectives on Asian economic growth and
development. Explorations in Economic History, 47, 260-263. BUCHHOLZ, R. A. & ROSENTHAL, S. B. 2004. Stakeholder Theory and Public Policy: How Governments
Matter. Journal of Business Ethics, 51, 143-153. BURHANI, R 2011, Mustafa: IPO langkah Strategius BUMN Memenuhi Modal (Mustafa: IPO the best
strategies for SOEs to get fresh capital), Antara. CAPORASO, JA 1982, ‘The state's role in third world economic growth’, Annals of the American
Academy of Political and Social Science, vol. 459, pp. 103–111.
221
CARLIN, W., MAYER, C., SINN, H.-W. & GRILLI, V. 1992. Restructuring Enterprises in Eastern Europe. Economic Policy, 7, 312-352.
CARNEY, M. & GEDAJLOVIC, E. 2002. The Co-evolution of Institutional Environments and Organizational Strategies: The Rise of Family Business Groups in the ASEAN Region. Organization Studies, 23, 1-29.
CARPENTER, V. L. & FEROZ, E. H. 2001. Institutional theory and accounting rule choice: an analysis of four US state governments' decisions to adopt generally accepted accounting principles. Accounting,Organizations and Society, 26, 565-596.
CASSING, JH 2000, ‘Economic policy and political culture in Indonesia’, European Journal of Political Economy, vol. 16, pp. 159–171.
CAVES, R. E. 1990. Lessons from privatization in Britain : State enterprise behavior, public choice, and corporate governance. Journal of Economic Behavior & Organization, 13, 145-169.
CELOZA, A. R. 1991. Privatization in Southeast Asia. The International Executive, 32, 34-36. CHANDOLA, H 1976, ‘State involvement in a free market economy’, Economic and Political Weekly,
vol. 11, pp. 357–359. CHANG, EC & WONG, SML 2009, ‘Governance with multiple objectives: Evidence from top executive
turnover in China’, Journal of Corporate Finance, vol. 15, pp. 230–244. CHANNON, D. F. 1980. Business Government Planning Agreements-Ideology Versus Practicality.
Strategic Management Journal, 1, 85-97. CHAY, JB & SUH, J 2009, ‘Payout policy and cash flow uncertainty’, Journal of Financial Economics,
vol. 93, pp. 88–107. CHEN, G, FIRTH, M & XU, L 2009, ‘Does the type of ownership control matter? Evidence from China's
listed companies’, Journal of Banking & Finance, vol. 33, pp. 171–181. CHEN, X., LEE, C.-W. J. & LI, J. 2008. Government assisted earnings management in China. Journal of
Accounting and Public Policy, 27, 262-274. CHILD, J 1974, ‘What determines organization: The universals vs. the it-all-depends’, Organizational
Dynamics, vol. 3, pp. 2–18. CLIFTON, J., COMIN, F. & FUENTES, D. D. 2003. Privatisation in the European Union: Public
Enterprises and Integration, Springer Science & Business Media. CLIFTON, J., COMIN, F. & FUENTES, D. D. 2003. Privatisation in the European Union: Public
Enterprises and Integration, Springer Science & Business Media. CHRISTENSEN, J. R. G. N. R. & PALLESEN, T. 2001. The Political Benefits of Corporatization and
Privatization. Journal of Public Policy, 21, 283-309. COLLIS, J & HUSSEY, R 2003, Business research: A practical guide for undergraduates and
postgraduate students, Palgrave Macmillan, New York. COVALESKI, MA, DIRSMITH, MW & SAMUEL, S 2003, ‘Changes in the institutional environment and
the institutions of governance: Extending the contributions of transaction cost economics within the management control literature’, Accounting, Organizations and Society, vol. 28, pp. 417–441.
CROUCH, H 1975, ‘Generals and business in Indonesia’, Pacific Affairs, vol. 48, 519–540. CURRIE, C. 2005. The need for a new theory of economic reform. Journal of Socio-Economics, 34,
425-443. CURRIE, G., LOCKETT, A. & SUHOMLINOVA, O. 2009. Leadership and institutional change in the
public sector: The case of secondary schools in England. The Leadership Quarterly, 20, 664-679.
DACIN, M. T., GOODSTEIN, J. & SCOTT, W. R. 2002. Institutional Theory and Institutional Change: Introduction to the Special Research Forum. The Academy of Management Journal, 45, 43-56.
DAILY, OA 1995, ‘Indonesia: Accelerated privatisation’, Oxford Analytical Daily Brief Service. DAVID, P. A. 1985. Clio and the Economics of QWERTY. The American Economic Review, 75, 332-337.
222
DE BORGER, B. 1995. The behavior of public enterprises offering a quasi-public good. European Journal of Political Economy, 11, 265-290.
DE CASTRO, JO, MEYER, GD, STRONG, KC & UHLENBRUCK, N 1996, ‘Government-stated objectives and organisational characteristics: A stakeholder view of privatisation effectiveness’, International Journal of Organizational Analysis, vol. 4, pp. 373–392.
DEMSETZ, H. & LEHN, K. 1985. The Structure of Corporate Ownership: Causes and Consequences. Journal of Political economy, 93, 1155-1177.
DENIZER, C. & GELB, A. 1992. Mongolia-privatization and system transformation in an isolated economy. The World Bank.
DESS, G. G. & ROBINSON, R. B., JR. 1984. Measuring Organizational Performance in the Absence of Objective Measures: The Case of the Privately-Held Firm and Conglomerate Business Unit. Strategic Management Journal, 5, 265-273.
DEVARAJAN, S., SWAROOP, V. & ZOU, H.-F. 1996. The composition of public expenditure and economic growth. Journal of Monetary Economics, 37, 313-344.
DEWATRIPONT, M, JEWITT, I & TIROLE, J 2000, ‘Multi-task agency problems: Focus and task clustering’, European Economic Review, vol. 44, pp. 869–877.
DIAH, M 2003, Restrukturisasi BUMN di Indonesia (Indonesian SOEs Restructuring), Literata Jendela Dunia Ilmu, Jakarta.
DIBIaSIO, J. (1998). "Indonesia's stalled privitization program moves forward." Emerging Markets Week 6(38): 1-1,11.
DICK, HW 1985, ‘The rise of a middle class and the changing concept of equity in Indonesia: An interpretation’, Indonesia, vol. 39, pp. 71–92.
DICK, HW 2002, ‘Formation of the nation state 1930–1966’, In HW DICK & T WIE (eds.) The emergence of a nation economic, Allen & Uwin and University of Hawai Press, Australia.
DIMAGGIO, PJ & POWELL, WW 1983, ‘The iron cage revisited: Institutional isomorphism and collective rationality in organisational field’,. American Sociological Review, vol. 48, pp. 147–160.
DJALIL, S 2008, ‘Peranan BUMN untuk Menggerakan Sektor Riil Dalam Situasi Krisis Global (SOEs role to develop the riil sector on the global crises)’, Capital Market Seminar, Ministry of SOEs, Jakarta.
DORNSTEIN, M 1976, ‘Managerial theories, social responsibility, and goal orientations of top-level management in state-owned enterprises’, Journal of Behavioral Economics, vol. 5, pp. 65–91.
DURIAU, R. K. Reger, et al. (2007). "A Content Analysis of the Content Analysis Literature in Organization Studies: Research Themes, Data Sources, and Methodological Refinements." Organizational Research Methods 10, 5-34.
EBBINGHAUS, B (2005) "Can path dependence explain institutional change?: Two approaches applied to welfare state reform."
EBBINGHAUS, B. (2005). "When Less is More: Selection Problems in Large- N and Small- N Cross-National Comparisons." International Sociology 20(2): 133-152.
EISENHARDT, K. M. 1989. Agency Theory: An Assessment and Review. The Academy of Management Review, 14, 57-74.
ERIC WILLIAMS, M. 2002. Market Reforms, Technocrats, and Institutional Innovation. World Development, 30, 395-412.
ERRUNZA, VR & MAZUMDAR, SC 2001, ‘Privatisation: A theoretical framework’, Journal of International Financial Markets,Institutions and Money, vol. 11, pp. 339–362.
ESTACHE, A. & TRUJILLO, L. 2008. Privatization in Latin America. Privatization: Successes and failures, 136.
ESTRIN, S, HANOUSEK, J, KOCENDA, E & SVEJNAR, J 2009, ‘The effects of privatisation and ownership in transition economies’, Journal of Economic Literature, vol. 47, pp. 699–728.

223
ESTRIN, S & PÉROTIN, V 1991, ‘Does ownership always matter?’, International Journal of Industrial Organization, vol. 9, pp. 55–72.
FANE, G 1999, ‘Indonesian economic policies and performance, 1960–98’, World Economy, vol. 22, pp. 651–668.
FREEMAN, JR 1982, ‘State entrepreneurship and dependent development’, American Journal of Political Science, vol. 26, pp. 90–112.
FREEMAN, R. E., WICKS, A. C. & PARMAR, B. 2004. Stakeholder Theory and "The Corporate Objective Revisited". Organization Science, 15, 364-369.
FRYDMAN, R., GRAY, C., HESSEL, M. & RAPACZYNSKI, A. 1999. When Does Privatization Work? The Impact of Private Ownership on Corporate Performance in the Transition Economies. The Quarterly Journal of Economics, 114, 1153-1191.
FURGESON, JR, BABCOCK, L & SHANE, PM 2008, ‘Behind the mask of method: Political orientation and constitutional interpretive preferences’, Law and Human Behavior, vol. 32, pp. 502–510.
FURUBOTN, E. G. 2001. The new institutional economics and the theory of the firm. Journal of Economic Behavior & Organization, 45, 133-153.
GERSCHENKRON, A. 1992. Economic backwardness in historical perspective. The sociology of economic life, 111-30.
GILLIS, M 1980, ‘The role of state enterprises in economic development’, Social Research, vol. 47, p. 248.
GLASSBURNER, B 1962, ‘Economic policy-making in Indonesia, 1950–57’, Economic Development and Cultural Change, vol. 10, pp. 113–133.
GOLDSTONE, J. A. 1998. Initial Conditions, General Laws, Path Dependence, and Explanation in Historical Sociology 1. American journal of sociology, 104, 829-845.
GRANGER, CH 1964, ‘The hierarchy of objetives’, Harvard Business Review GREEN, DJ 2004, ‘Investment behaviour and the economic crisis in Indonesia’, Journal of Asian
Economics, vol. 15, pp. 287–303. GROEBNER, DF, SHANNON, PW, FRY, PC & SMITH, KD 2005, Business statistics: A decision-making
approach, Pearson Prentice Hall, New Jersey. GUNARTO, H & ADITYA, E 2009, Direksi BUMN Harus Profesional Nasionalis, Pendapatan BUMN
Sumbang 24% PDB (SOE Executives have to be nationalised professionals, SOEs contribute 24 % of GDP). Investor Indonesia.
GUPTA, N. 2005. Partial Privatization and Firm Performance. The Journal of Finance, 60, 987-1015. GUPTA, S & NEWBERRY, K 1997, ‘Determinants of the variability in corporate effective tax rates:
Evidence from longitudinal data’, Journal of Accounting and Public Policy, vol. 16, pp. 1–34. GUTHRIE, J 1990, ‘The adoption of corporate form for government business undertakings—Critical
issues and implications’, in J GUTHRIE & SHAND-PARKER (eds.), The public sector, Harcourt Brace Jovenvich, New York.
GUTHRIE, J & ENGLISH, L 1997, ‘Performance information and programme evaluation in the Australian public sector’, International Journal of Public Sector Management, vol. 10, pp. 154–164.
GUTHRIE, J., PARKER, L. & ENGLISH, L. M. 2003. A review of new public financial management change in Australia. Australian Accounting Review, 13, 3.
GYLFASON, T, HERBERTSSON, TT & ZOEGA, G 2001, ‘Ownership and growth’, World Bank Economic Review, vol. 15, pp. 431–449.
HAFSI, T 1985, ‘The dynamics of government in business’, Interfaces, vol. 15, pp. 62–69. HALPER, M., LIU, L.-M., GELLER, J. & PERL, Y. 2007. Ownership as a conceptual modeling construct.
Data & Knowledge Engineering, 62, 248-273. HAMZAH, F. 2007. Negara, BUMN dan Kesejahteraan Rakyat (State, SOEs and people welfare),
Jakarta, Yayasan Faham Indonesia. HANSCHEN, PW & ERSPAMER, GP 2004, ‘A public utility’s obligation to serve: Saber or double-edged
sword?, Electricity Journal, vol. 17, pp. 32–49.
224
HAQUE, M. S. 2001. Recent transition in governance in South Asia: contexts, dimensions, and implications. International Journal of Public Administration, 24, 1405-1436.
HAQUE, M. S. 2003. Reinventing governance for performance in South Asia: impacts on citizenship rights. International Journal of Public Administration, 26, 941-964.
HARIRIAN, M 1989, State-owned enterprises in a mixed economy, Westview Press, London. HARTLEY, J. 2005. Case Study Research. In: CASSELL, C. & SYMON, G. (eds.) Essential Guide to
Qualitative Methods in Organizational Research. London: Thousand Oaks Sage Publication. HENSLEY, RJ 1964, ‘Development banks and economic development in Indonesia’, Economic
Development and Cultural Change, vol. 12, pp. 392–415. HIGGINS, B 1958, ‘Hatta and cooperatives: The middle way for Indonesia?’, Annals of the American
Academy of Political and Social Science, vol. 318, pp. 49–57. HILL, H. 1982. State enterprises in a competitive industry: An Indonesian case study. World
Development, 10, 1015-1023. HILL, H 2007, ‘The Indonesia economy : Growth, crisis and recovery’, The Singapore Economic
Review, vol. 52, pp. 137–166. HOLLANDER, JA & EINWOHNER, RL 2004, ‘Conceptualizing resistance’, Sociological Forum, vol. 19,
pp. 533–554. HOLLINGSWORTH, J. R. 2000. Doing Institutional Analysis: Implications for the Study of Innovations.
Review of International Political Economy, 7, 595-644. IMF 1997a, Indonesia Letter of Intent, October 31, 1997, IMF. IMF 1997b, Letter of Intent, International Monetary Fund. INDRAWATI, SM 2002, ‘Indonesian economic recovery process and the role of government’, Journal
of Asian Economics, vol. 13, pp. 577–596. JANET, L 2006, ‘Performance reporting by Australian government trading enterprises: An empirical
study 1998–2002’, Australian Accounting Review, vol. 16, p. 34. JANET, L. 2008. Preparing performance information in the public sector: an Australian perspective.
Financial Accountability & Management, 24, 117-149. JAMES, WE 1996, ‘International finance and domestic financial market’, Asian Development Review,
vol. 12, pp. 86–105. JAVIDAN, M & DASTMALCHIAN, A 1988, ‘Why planning in state enterprises doesn’t work’, Long
Range Planning, vol. 21, pp. 98–104. JENKINSON, T. & MAYER, C. 1988. The privatisation process in France and the U.K. European
Economic Review, 32, 482-490. JENSEN, M. C. & MECKLING, W. H. 1976. Theory of the firm: Managerial behavior, agency costs and
ownership structure. Journal of Financial Economics, 3, 305-360. JERMAKOWICZ, W. & KOZARZEWSKI, P. 1996. Privatization in Mongolia. CASE-Center for Social and
Economic Research. JIM BRUMBY, MH & SHEPHERD, S 1997, ‘State-owned enterprises governance’, in SERVICE PM (ed.),
OECD. JOHNSON, R. B., ONWUEGBUZIE, A. J. & TURNER, L. A. 2007. Toward a definition of mixed methods
research. Journal of mixed methods research, 1, 112-133. JOSHI, G. 2000. Overview of privatization in South Asia. Privatization in South Asia: Minimizing
Negative Social Effects through Restructuring. Geneva: International Labour Organization (ILO), pp1–8.
JUPE, GCAR 2003, ‘A lot of friction at the interfaces: The regulation of Britain’s privatised railway system’, Financial Accountability and Management, vol. 19, pp. 397–417.
KANUMOYOSO, B 2001, Nasionalisasi Perusahaan Belanda di Indonesia, Pustaka Sinar Harapan, Jakarta.
KAUR, S. 2004. Privatization and Public Enterprises Reforms: A Suggestive Action Plan. International Conference to mark 10 years of ASARC (Australia South Asia Research Centre). The Australian National University Canberra.
225
KEENEY, RL 1988, ‘Structuring objectives for problems of public interest’, Operations Research, vol. 36, 396–405.
KEMAL, A. 2000. Privatization in Pakistan. Privatization in South Asia: Minimizing Negative Social Effects through Restructuring, 143-73.
KILLICK, T. & COMMANDER, S. 1988. State divestiture as a policy instrument in developing countries. World Development, 16, 1465-1479.
KOLDERIE, T 1986, ‘The two different concepts of privatisation’, Public Administration Review, vol. 46, 285–291.
KOLE, SAR & MULHERIN, JAH 1997, ‘The government as a shareholder: A case from the United States’, Journal of Law and Economics, vol. 40, pp. 1–22.
KROEF, J. M. V. D. 1952. Structural Change in Indonesian Society. Economic Development and Cultural Change, 1, 216-228.
KROEF, JMVD 1954, ‘Entrepreneurs and middle class in Indonesia’, Economic Development and Cultural Change, vol. 2, pp. 297–325.
KROEF, JMVD 1955, ‘Social movements and economic development in Indonesia’, American Journal of Economics and Sociology, vol. 14, pp. 123–137.
LANDESMANN, MA & PAGANO, U 1994, ‘Institutions and economic change’, Structural Change and Economic Dynamics, vol. 5, pp. 199–203.
LAWSON, C 1994, ‘The theory of state-owned enterprises in market economies’, Journal of Economic Survey, vol. 8, pp. 284–309.
LEVY, B 1987, ‘A theory of public enterprise behaviour’, Journal of Economic Behaviour & Organization, vol. 8, 75–96.
LIEBOWITZ, S. J. and S. E. Margolis (1995). "Path Dependence, Lock-in, and History." Journal of Law, Economics, & Organization 11: 205-226.
LUCEY, W. L. 1984. History : Methods and Interpretation, New York, Garland Publishing. MACRAE, C. D. 1977. A Political Model of the Business Cycle. Journal of Political Economy, 85, 239-
263. MAHONEY, J 2004, ‘Comparative historical methodology’, Annual Review of Sociology, vol. 30, pp.
81–101. MAHONEY, J. (2000). "Path Dependence in Historical Sociology." Theory and Society 29: 507-548. MAHONEY, J. & THELEN, K. 2009. Explaining institutional change: ambiguity, agency, and power,
Cambridge University Press. MAITLAND-GHOLSON, J & ETTINGER, LF 1994, ‘Interpretive decision-making in research’, Studies in
Art Education, vol. 36, pp. 18-27. MANTZAVINOS, C., D. C. North, et al. (2004). "Learning, Institutions, and Economic Performance."
Perspectives on Politics 2(01): 75-84. MANZETTI, L 2003, ‘Political manipulations and market reforms failures’, World Politics, vol. 55, pp.
315–360. MARDJANA, I 1992, ‘Policy changes in Indonesian public enterprises during the old order and new
order governments’, ASEAN Economic Bulletin, vol. 9, p. 187. MARDJANA, I 1995, ‘Ownership or management problems? A case study of three Indonesian state
enterprises’, Bulletin of Indonesian Economic Studies, vol. 31, pp. 73–107. Marshall, C. and G. B. Rossman (2006). Designing Qualitative Research. London, Sage Publication. MARTIN, J 1996, ‘Corporation and community service obligation: Are they incompatible?’, Australian
Journal of Public Administration vol. 55, pp. 111–117. MARTIN, S. & PARKER, D. 1995. Privatization and Economic Performance Throughout the UK
Business Cycle. Managerial and Decision Economics, 16, 225-237. MASCARENHAS, B 1989, ‘Domains of state-owned, privately held, and publicly traded firms in
international competition’, Administrative Science Quarterly, vol. 34, pp. 582–597. MAZZOLINI, R. 1979. European Government-Controlled Enterprises: Explaining International
Strategic and Policy Decisions. Journal of International Business Studies, 10, 16-27.

226
MCCAWLEY, P 2011, ‘Widjojo Nitisastro and Indonesian development’, Bulletin of Indonesian Economic Studies, vol. 47, pp. 87–103.
MCLELLAN, JG 2005, All above board: Great governance for government sector, Australian Institute of Company Directors, Sydney.
MCLEOD, RH 2002a, ‘Privatisation failures in Indonesia’, Australian National University, Economics RSPAS, Trade and Development, 2002.
MCLEOD, RH 2002b, ‘Second and third thoughts on privatisation in Indonesia’, Agenda, vol. 9, pp. 151–164.
MEGGINSON, W. L. 2007. Introduction to the special issue on privatization. International Review of Financial Analysis, 16, 301-303.
MEGGINSON, WL & NETTER, JM 2001, ‘From state to market: A survey of empirical studies on privatisation’, Journal of Economic Literature, vol. 39, pp. 321–389.
MILLWARD, R. 2011. PUBLIC ENTERPRISE IN THE MODERN WESTERN WORLD: AN HISTORICAL ANALYSIS. Annals of Public and Cooperative Economics, 82, 375-398.
MILNE, R. 1991. The politics of privatization in the ASEAN states. ASEAN Economic Bulletin, 322-334. MILNE, R. S. 1992. Privatization in the ASEAN States: Who Gets What, Why, and With What Effect?
Pacific Affairs, 65, 7-29. MIZRUCHI, M. S. & FEIN, L. C. 1999. The Social Construction of Organizational Knowledge: A Study of
the Uses of Coercive, Mimetic, and Normative Isomorphism. Administrative Science Quarterly, 44, 653-683.
MoCOMMUNICATION 2010, Total Aset BUMN Mencapai Rp 2.258 Trilliun atay 40 % dari PDB (2009: SOEs total asset reached Rp. 2.258 Trilliun [Online], accessed 18 February 2013, Indonesina Ministry of Communication, Jakarta.
MONKS, R. A. & MINOW, N. 2008. Corporate Governance West Sussex, John Willey & Sons Ltd. MORGAN, DR & ENGLAND, RE 1988, ‘The two faces of privatisation’, Public Administration Review,
vol. 48, pp. 979–987. MORCK, R. K. & STANGELAND, D. A. 1996. On the Mercantilist Objective of Canadian State-Owned
Enterprises. The Canadian Journal of Economics / Revue canadienne d'Economique, 29, S249-S255.
MORLEY, S. A., MACHADO, R., PETTINATO, S. & AMERICA, U. N. E. C. F. L. 1999. Indexes of structural reform in Latin America, United Nations, Economic Comm. for Latin America and the Caribbean.
MSOES 2008, Laporan Kinerja BUMN Tahun 2003–2007 (SOEs Performance Report 2003–2007), Kementerian BUMN Republik Indonesia (MSOEs).
MSOES 2011, Kontribusi Kinerja Kementerian BUMN (MSOE Contribution Performance) [Online], accessed 6 Febrary 2013, MSOEs, Jakarta.
MSOES, I 2012, ‘Kinerja BUMN tahun 2011–2012 (Indonesian SOEs performance 2011–2012)’, in MOSO ENTERPRISES (ed.), Indonesian MSOEs, Jakarta.
MUELLER, D. C. 1992. The corporation and the economist. International Journal of Industrial Organization, 10, 147-170.
MYERS, MD 1994, ‘A disaster for everyone to see: An interpretive analysis of a failed IS project’, Accounting, Management and Information Technologies, vol. 4, pp. 185–201.
NELLIS, J & KIKERI, S 1989, ‘Public enterprise reform: Privatisation and the World Bank’, World Development, vol. 17, pp. 659–672.
NEUMANN, WL 2006, Social Research Methods, Pearson (Ally and Bacon), Boston. NEWBERY, DM 1996, Privatisation and liberalisation of network utilities, University of Cambridge,
London. NEWBERY, DM 1997, ‘Privatisation and liberalisation of network utilities’, European Economic
Review, vol. 41, pp. 357–383. NEWMAN, KL 2000, ‘Organisational transformation during institutional upheaval’, Academy of
Management Review, vol. 25, pp. 602–619.

227
NICHOLS, P. M. 1996. Creating a market along the silk road: a comparison of privatization techniques in Central Asia. NYUJ Int'l L. & Pol., 29, 299.
NORTH, D. C. (1978). "Structure and Performance: The Task of Economic History." Journal of Economic Literature 16(3): 963-978.
NORTH, D. C. 1989. Institutions and economic growth: An historical introduction. World Development, 17, 1319-1332.
NORTH, DC 1990, Institutions, institutional change, and economic performance, Cambridge University Press, Cambridge.
NORTH, D. C. (1991). "Institutions." The Journal of Economic Perspectives 5: 97-112. NORTH, D. C. 1992. Transaction Cost, Institutions, and Economic Performance International Centre
for Economic Growth. California: An International Center for Economic Publication NORTH, D. C. 1993. Institutional Change : A Framework of Analysis. In: SJOSTRAND, S.-E. (ed.)
Institutional change : theory and empirical findings New York: ME Sharpe Inc. NORTH, D. C. (1994). "Economic Performance Through Time." The American Economic Review 84(3):
359-368. NORTH, D. C. (1995). "Five propositions about institutional change." Explaining social institutions:
15- 26. NORTH, D. C. 2005. Understanding the process of economic change, Princeton, Princeton University
Press. NUGROHO R & WRIHATNOLO, R 2008, Manajemen Privatisasi BUMN (SOEs Privatisation
Management), PT Elex Media Komputindo, Jakarta. OECD 2005a. Corporate Governance of State-Owned Enterprises: A Survey of OECD Countries, Paris
and Washington, D.C.: Author. OECD 2005b. OECD Guidelines on Corporate Governance of State Owned Enterprises. OECD. OEI, HL 1968, ‘Indonesia’s economic stabilisation and rehabilitation program: An evaluation’,
Indonesia, vol. 5, pp. 135–174. OEI, HL 1969, ‘Implications of Indonesia’s new foreign investment policy for economic development’,
Indonesia, vol. 7, pp. 33–66. OGDEN, S. & WATSON, R. 1999. Corporate Performance and Stakeholder Management: Balancing
Shareholder and Customer Interests in the U.K. Privatized Water Industry. The Academy of Management Journal, 42, 526-538.
PANGESTU, M 1990, ‘The role of the private sector in Indonesia: Deregulation and privatisation’, in PECC Pacific Economic Outlook. Kyoto Center Strategic and International Studies, Kyoto.
PANGESTU, M & HABIR, AD 1989, ‘Trends and prospects in privatisation and deregulation in Indonesia’, ASEAN Economic Bulletin, vol. 5, pp. 224–241.
PANGLAYKIM, J & THOMAS, KD 1967, ‘The new order and the economy’, Indonesia, vol. 3, pp. 73–120.
PARKER, L. D. 1997. Informing Historical Research in Accounting and Management : Tradition, Philosophies and Opportunities. The Accounting Historian Journal, 24, 111-149
PARKER, LD 2004, ‘“Presenting” the past: Perspectives on time for accounting and management history’, Accounting, Business and Financial History, vol. 14, pp. 1–27.
PAUKER, GJ 1967, ‘Towards a new order in Indonesia’, Foreign Affairs, vol. 45, pp. 503–519. PEARCE, J. A., II 1982. The Company Mission As a Strategic Tool. Sloan Management Review (pre-
1986), 23, 15. PENG, MW 2003, ‘Institutional transitions and strategic choices’, Academy of Management Review,
vol. 28, pp. 275–296. PENG, M. W., BUCK, T. & FILATOTCHEV, I. 2003. Do outside directors and new managers help
improve firm performance? An exploratory study in Russian privatization. Journal of World Business, 38, 348-360.
PERKINS, DH 1993, ‘Summary: Why is reforming state-owned enterprises so difficult?’, China Economic Review, vol. 4, pp. 149–151.
228
PEROTTI, E. C. 1995. Credible Privatization. The American Economic Review, 85, 847-859. PERSSON, T. 2002. Do political institutions shape economic policy? Econometrica, 70, 883-905. PIERSON, P. 2000. Increasing Returns, Path Dependence, and the Study of Politics. The American
Political Science Review, 94, 251-267. POMFRET, R. W. 2006. The Central Asian economies since independence, Princeton University Press. PORTA, RL, LOPEZ-DE-SILANES, F, SHLEIFER, A & VISHNY, R 1999, ‘The quality of government’,
Journal of Law, Economics, & Organization, vol. 15, pp. 222–279. POSTAN, M. 1939. The Historical Method in Social Sciences London, Cambridge University Press. RAMAMURTI, R 1986, ‘Strategic planning in government-dependent businesses’, Long Range
Planning, vol. 19, pp. 62–71. RAMAMURTI, R 1987, ‘Performance evaluation of state-owned enterprises in theory and practice’,
Management Science, vol. 33, 876–893. RAMAMURTI, R 1999, ‘Why haven’t developing countries privatised deeper and faster?’, World
Development, vol. 27, pp. 137–155. REES, R. 1988. Inefficiency, public enterprise and privatisation. European Economic Review, 32, 422-
431. REEVES, E & RYAN, J 1998, ‘A benchmark analysis of the performance of state-owned enterprises in
Ireland’, International Journal of Public Administration, vol. 21, pp. 1577–1602. RESEARCH, RR 1998, Indonesian state-owned enterprises: Professionalism to go global, RBI Research,
Jakarta. ROUSSEAU, P. L. & XIAO, S. 2008. Change of control and the success of China's share-issue
privatization. China Economic Review, 19, 605-613. ROWLINSON, M. 2004. Historical analysis of company documents. Essential guide to qualitative
methods in organizational research, 301-11. RURU, B 2006, Pembinaan Badan Usaha Milik Negara. Rapat Kerja Kementerian BUMN. Kementerian
BUMN, Bandung, Indonesia. RUYS, P. H. M. 1988. Industries with private and public enterprises. European Economic Review, 32,
415-421. RYAN, N. 2012. Introducting Government-Business Relationships : History, Theories and Cases,
Sydney, Pearson Custom Text. SALIH, R. 2000. Privatization in Sri Lanka. Privatization in South Asia: Minimizing Social Effects
through Restructuring. New Delhi: International Labour Organization. SANCHEZ, M. & CORONA, R. 1993. Privatization in Latin America, Inter-American Development Bank. SCHWARZ, A 1990, ‘Retread for tyre maker’, Far Eastern Economic Review. SEPÚLVEDA, E., COLOMA, G., GÓMEZ, A. M., CORONA, R., TRUJILLO, J. P., JARAMILLO, L.,
GERCHUNOFF, P., ZULETA, L. A., RAMÍREZ, G. A. & HACHETTE, D. 1993. Privatization in Latin America.
SEXTY, R. W. 1980. Autonomy Strategies of Government Owned Business Corporations in Canada. Strategic Management Journal, 1, 371-384.
SHARMA, S. D. 2001. The Indonesian Financial Crisis: From Banking Crisis to Financial Sector Reforms, 1997-2000. Indonesia, 71, 79-110.
SHARON, L. O. & JAHERA, J. S., JR. 1991. The Influence of Ownership on Performance: An Empirical Study. Strategic Management Journal, 12, 321-326.
SHIRLEY, MM 1999, ‘Bureaucrats in business: The roles of privatisation versus corporatisation in state-owned enterprise reform’, World Development, vol. 27, pp. 115–136.
SHIRLEY, M. M. & XU, L. C. 1998. Information, Incentives, and Commitment: An Empirical Analysis of Contracts between Government and State Enterprises. Journal of Law, Economics, & Organization, 14, 358-378.
SHLEIFER, A 1998, ‘State versus private ownership’, Journal of Economic Perspectives, vol. 12, pp. 133–150.
229
SHLEIFER, A & VISHNY, RW 1994, ‘Politicians and firms’, Quarterly Journal of Economics, vol. 109, pp. 995–1025.
SHORT, H. 1994. Ownership, control, financial structure and the performance of firms. Journal of economic surveys, 8, 203-249.
SIAHAAN, B 1996, Industrialisasi di Indonesia (Industrialisation in Indonesia), Jakarta Pusaka Data, Jakarta.
SIAGIAN, H 2004, ‘Corporate governance surrounding privatization: The case of Indonesia’, PhD Thesis, University of Arkansas.
SINHA, R 1995, ‘Economic reform in developing countries: Some conceptual issues’, World Development, vol. 23, pp. 557–575.
SIQUEIRA, K., SANDLER, T. & CAULEY, J. 2009. Common agency and state-owned enterprise reform. China Economic Review, 20, 208-217.
SIRGY, M. J. 2002. Measuring corporate performance by building on the stakeholders model of business ethics. Journal of Business Ethics, 35, 143-162.
SJOSTRAND, S.-E. 1993. On Institutional Thought in the Social and Economic Science. In: SJOSTRAND, S.-E. (ed.). New York: MW Sharper Inc.
SKOTT, P. 1999. Economic divergence and institutional change: some observations on the convergence literature. Journal of Economic Behavior & Organization, 39, 235-247.
SMITH, R. A. & LUX, D. S. 1993. Historical Method in Consumer Research: Developing Causal Explanations of Change. The Journal of Consumer Research, 19, 595-610.
SOBHAN, R. 1979a. The Nature of the State and its Implications for the Development of Public Enterprises in Asia. Journal of Contemporary Asia, 9, 410-433.
SOBHAN, R. 1979b. Public Enterprises and the Nature of the State. Development and Change, 10, 23-40.
SOESASTRO, H 2000, ‘Governance and the crisis in Indonesia’, in P DRYSDALE (ed.) Reform and recovery in East Asia: The role of state and economic enterprises. Routledge, Canberra.
STERN, J. P. 1997. The British Gas market 10 years after privatisation: a model or a warning for the rest of Europe? Energy Policy, 25, 387-392.
STIGLITZ, J. E. 2000. Economic of Public Sectors, London. SUGIHARTO 2005, ‘Restrukturisasi, Profitisasi dan Privatisasi’, in R NUGROHO & R SIAHAAN (eds.),
BUMN Indonesia: isu, kebijakan, dan strategi. Elex Media Komputindo, Jakarta. SUKARDI, L 2002, BUMN : Martabat Bangsa, Korupsi dan Solusi, The Indonesian Ministry of State-
Owned Enterprises, Jakarta. SUN, Q. & TONG, W. H. S. 2003. China share issue privatization: the extent of its success. Journal of
Financial Economics, 70, 183-222. SUNDARAM, AK & INKPEN, AC 2004, ‘The corporate objective revisited’, Organization Science, vol.
15, pp. 350–363. SUPRANOWITZ, S. 1961. The Law of State-Owned Enterprises in A Socialist State Law and
Contemporary Problems, 26, 794-801. SUTOJO, H 1996, ‘State-owned enterprise privatisation in Indonesia’, in ROASO PRIVATISATION (ed.),
Privatising state-owned enterprises : Experiences of Asia-Pacific economies, Asian Productivity Organization, Tokyo.
SUTTER, JO 1959, Indonesianisasi: Politics in a changing economy, 1940–1955, Vol. I-IV, Cornell University, New York.
TANZI, V 2008, ‘The role of the state and public finance in the next generation’, OECD Journal on THOMPSON, A.-M. K. 2010. Golder's historical method in research in marketing. Journal of Business
Research, 63, 1269-1272. THOMPSON, J. 1995. Participatory approaches in government bureaucracies: Facilitating the process
of institutional change. World Development, 23, 1521-1554.
230
THE AMERICAN JOURNAL OF INTERNATIONAL LAW, 1960, ‘Netherlands-Indonesia: Netherlands Note of December 18, 1959, regarding nationalisation of Dutch-owned enterprises’, vol. 54, pp. 484–490.
TJAGER, IN 2000, Privatisation and restructuring OECD/APEC. MSOEs, Denpasar, Bali. TONINELLI, P. A. 2000a. The Rise and Fall of Public Enterprise. The rise and fall of State-Owned
Enterprise in the Western World, 1, 3. TONINELLI, P. M. 2000b. The rise and fall of state-owned enterprise in the Western world, Cambridge
University Press. TONY, S 1992, ‘Which Way Forward’, Euromoney, September. TOWNLEY, B 2005, ‘Critical views of performance measurement’, in K KEMPF-LEONARD (ed.),
Encyclopedia of social measurement, Elsevier, New York. TYNAN, N 2003, ‘The Rise and Fall of State-Owned Enterprise in the Western World: Pier Angelo
Toninelli (Ed.); Cambridge University Press, Cambridge, UK, 2000’, Journal of Economic Behavior & Organization, vol. 52, pp. 421–423.
VERNON, R 1984, ‘Linking managers with ministers: Dilemmas of the state-owned enterprise’, Journal of Policy Analysis and Management, vol. 4, pp. 39–55.
WANG, C. 2005. The political economy of privatization: A comparative study of Indonesia, the Philippines, and Taiwan. Northern Illinois University Ph.D.
WASHINGTON, M & VENTRESCA, MJ 2004, ‘How organisations change: The role of institutional support mechanisms in the incorporation of higher education visibility strategies’, 1874–1995. Organization Science, vol. 15, pp. 82–97.
WIBOWO, A. T. & NURLAILA, A. 2009. 2009, Laba BUMN diperkirakan turun (2009, SOEs' profit is predicted to decrease). Vivanews [Online].
WISE, L. R. 2002. Public Management Reform: Competing Drivers of Change. Public Administration Review, 62, 555-567.
WHITE, MD 2002, ‘Political manipulation of a public firm’s objective function’, Journal of Economic Behavior & Organization, vol. 49, pp. 487–499.
WICAKSONO, A 2008, ‘Indonesian state-owned enterprises: The challenge of reform’, Southeast Asian Affairs, 2008, 146–167.
WISE, LR 2002, ‘Public management reform: Competing drivers of change’, Public Administration Review, vol. 62, pp. 555–567.
WILLNER, J 1999, ‘Policy objectives and performance in a mixed market with bargaining’, International Journal of Industrial Organization, vol. 17, pp. 137–145.
WONG, S. C. 2004. Improving corporate governance in SOEs: An integrated approach. Corporate Governance International, 7, 19-29.
WOOTEN, M. & HOFFMAN, A. J. 2008. Organization Fields : Past, Present and Future. In: GREENWOOD, R., OLIVER, C., SHALIN, K. & SUDDABY, R. (eds.) Organizational Institutionalism. London: Sage Publications Ltd.
WIBOWO, A. T. & NURLAILA, A. 2009. 2009, Laba BUMN diperkirakan turun (2009, SOEs' profit is predicted to decrease). Vivanews [Online].
WILLNER, J 2001, ‘Ownership, efficiency, and political interference’, European Journal of Political Economy, vol. 17, pp. 723–748.
YARROW, G 1999, ‘A theory of privatisation, or why bureaucrats are still in business’, World Development, vol. 27, pp. 157–168.
YARROW, G, KING, M, MAIRESSE, J & MELITZ, J 1986, ‘Privatisation in theory and practice’, Economic Policy, vol. 1, pp. 324–377.
YONNEDI, E 2010, ‘Privatization, organisational change and performance: Evidence from Indonesia’, Journal of Organizational Change Management, vol. 23, p. 537.
YU, TF-L 2001, ‘Towards a theory of the entrepreneurial state’, International Journal of Social Economics, vol. 28, pp. 752–765.
231
YUEN, N. C. & WAGNER, N. 1989. Privatization and Deregulation: An Overview. ASEAN Economic Bulletin, 5, 209.
ZAHARIADIS, N 1999, ‘The rise and fall of British state ownership: Political pressure or economic reality?’, Comparative Politics, vol. 31, pp. 445–463.
ZENGXIAN, W. 1997. How Successful Has State-Owned Enterprise Reform Been in China? Europe-Asia Studies, 49, 1237-1262.
ZHONGHUA, C & YE, W 2012, ‘Research frontiers in public sector performance measurement’, Physics Procedia, vol. 25, pp. 793–799.
ZIF, J 1981, ‘Managerial strategic behaviour in state-owned enterprises—Business and political orientations’, Management Science, vol. 27, pp. 1326–1339.
232
Rules and Regulations
Undang-Undang Dasar 1945 (Constitution1945) Ammandement 2002 (The 1945 Constitution of Indonesia Fourth Amendment, 2002).
Undang-Undang no. 18/1958 tentang Nasionalisasi Perusahaan-Perusahaan Belanda (Act no. 18/1958 about Nationalisation of Dutch Companies).
Undang-Undang no. 1/1969 tentang Bentuk-bentuk Usaha Negara (Act no. 1/1969 about State Company Structures).
Undang-Undang no. 3/1989 tentang Telekomunikasi (Act no. 18/1958 about Telecommunications).
Undang-Undang no. 19/2003 tentang Badan Usaha Milik Negara (Act no. 19/2003 about State-Owned Enterprises).
Peraturan Pemerintah (PP) no. 19/1960 tentang Perusahaan Negara (Government Rule no. 19/1960 about Perusahaan Negara/State Company). Peraturan Pemerintah (PP) no. 19/1965 tentang Pembubaran Badan Pimpinan Umum Perusahaan Listrik Negara dan Pendirian Perusahaan Listrik Negara (PLN) dan Perusahaan Gas Negara (PGN) (Government Rule no. 19/1965 about Dissolution of Supervisory Boards and the Establisment of Four Electricity and Natural Gas Public Companies).
Peraturan Pemerintah (PP) no. 12/1969 tentang Perusahaan Perseroan (Government Rule no. 1/1969 about Limited Liability).
Peraturan Pemerintah (PP) no. 1/1969 tentang Pengganti Undang-Undang no. 1/1968 Tentang Bentuk-bentuk Usaha Negara (Government Rule no. 1/1969 about To Replace Act no. 1/1969 on State Company Structures).
Peraturan Pemerintah (PP) no. 36/1974 tentang Perusahaan Umum Telekomunikasi (Government Rule no. 36/1974 about Telecommunications Public Company).
Peraturan Pemerintah (PP) no.54/1980 tentang Perubahan Atas Peraturan Pemerintah no 36 tahun 1974 Tentang Perusahaan Umum Telekomunikasi (Government Rule no 54/1980 about to replace Government Rule no 36/1974 about Perum Telekomunikasi).
Peraturan Pemerintah no . 25/1981 tentang Pendirian Perusahaan Umum Indonesia Farma (Government Rule no 25/1991 about The establishment of General Company (Perum) Indonesia Farma)
Peraturan Pemerintah (PP) no. 3/1983 tentang Tatacara Pembinaan dan Pengawasan Perusahaan Jawatan (Perjan), Perusahaan Umum (Perum) dan Perusahaan Perseroan (Persero)(Government Rule no. 3/1983 about Supervisory and Governing Procedures and Guidance for Perusahaan Jawatan [Perjan] Perusahaan Umum [Perum] and Perusahaan Perseroan [Persero]).
Peraturan Pemerintah (PP) no. 5/1988 tentang Pedoman Penyehatan and Pengelolaan Badan Usaha Milik Negara (Government Rule no. 5/1988 about Procedure and Guidance for State-Owned Enterprise Performance Improvement).
Peraturan Pemerintah (PP) no. 25/1991 tentang Pengalihan Bentuk Perusahaan Umum Telekomunikasi Menjadi Perusahaan Perseroan (Government Rule no. 25/1991 about The Change of Telecommunication Company Structure from Public Company to Limited Liability).
Peraturan Pemerintah (PP) no. 75/1998 tentang Penyertaan Modal Negara Republik Indonesia Untuk Pendirian Perusahaan Perseroan (Persero) di Bidang Perbankan(Government Rule no. 75/1998 about State Ownership of the Establishment of Banking State-Owned Enterprise).
Peraturan Pemerintah (PP) no. 52/2002 tentang Telekomunikasi (Government Rule no. 52/2002 about Telecommunications).
Peraturan Pemerintah (PP) no. 19/2005 tentang Tata cara Privatisasi (Government Rule no. 19/2005 about Privatisation Procedure).
Peraturan Presiden (PerPRes) no. 76/2010 tentang Kriteria and Persyaratan Bidang Usaha Tertutup dan Bidang Usaha Terbuka dengan Persyaratan dibidang Penanaman Modal

233
(President’s Rule no. 36/2010 about The Criteria and Requirements for Negative Investment and Open Investment with Requirements).
Peraturan Presiden (PerPRes) no. 36/2010 tentang Daftar Negative Investasi Indonesia (President’s Rule no. 36/2010 about The Negative Investment List).
Instruksi Presiden (INPRES) no. 11/1973 tentang Pedoman Hubungan Tata Kerja Antara Menteri Bidang Teknis dan Menteri Keuangan Yang Mewakili Negara Selaku Pemegang Saham Perusahaan Perseroan (Persero) (President’s Instruction no. 16/1967 about Working and Relationship Procedures and Guidelines Between the Regulatory Ministry and the Ministry of Fiannce as the State Representative Shareholders for Perusahaan Perseroan [Persero]).
Instruksi Presiden (INPRES) no. 16/1967 tentang Pengarahan dan Penyederhanaan Perusahaan Negara dalam Tiga Bentuk Usaha Negara (President’s Instruction no. 16/1967 about Simplification of Perusahaan Negara into Three Business Structures).
Peraturan Menteri Keuangan (KMK) Republik Indonesia no. 740/KMK.00/1989 tentang Peningkatan Efiensi dan Produktivitas Badan Usaha Milik Negara (Ministry of Finance Rule no. 740/KMK.00/1989 about State-Owned Enterprise Productivity and Efficiency Improvement).
234
Financial Reports
ADHI KARYA, PT Adhi Karya: Annual Report 2004–2010. Jakarta: PT Adhi Karya Tbk.
AMARTA KARYA P 2004–2009, PT Amarta Karya: Laporan Keuangan Tahun 2004–2009 (PT Amarta Karya: Financial Report 2004–2009). Jakarta: PT Amarta Karya.
ANGKASA PURA I, 2004–2010, PT Angkasa Pura I: Laporan Keuangan Tahun 2004–2010 (PT Angkasa Pura I: Financial Report 2004–2010). Jakarta: PT Angkasa Pura I.
ANGKASA PURA II, 2004–2010, PT Angkasa Pura II: Laporan Keuangan Tahun 2004–2010 (PT Angkasa Pura II: Financial Report 2004–2010). Jakarta: PT Angkasa Pura II.
ANTAM, 2004–2010, (PT Aneka Tambang Tbk Annual Report 2004–2010). Jakarta: PT Aneka Tambang.
ANTARA, 2004–2009, Perum Lembaga Kantor Berita Negara Antara: Laporan Keuangan Tahun 2004–2009 (Perum Lembaga Kantor Berita Negara Antara: Financial Report 2004–2009). Jakarta: Perum Lembaga Kantor Berita Negara Antara.
ASABRI, 2004–2010, PT ASABRI Laporan Keuangan Tahun 2004–2010 (PT ASABRI Financial Report 2004–2010). Jakarta: PT ASABRI.
ASDP,2004–2009, PT Angkutan Sungai Danau dan Penyeberangan: Laporan Keuangan Tahun 2004–2009 (PT Angkutan Sungai Danau dan Penyeberangan: Financial Report 2004–2009). Jakarta: PT Angkutan Sungai Danau dan Penyeberangan.
ASEI, 2004–2009, PT ASEI Laporan Keuangan Tahun 2004–2009 (PT ASEI Financial Report 2004–2009). Jakarta: PT ASEI.
ASKES, 2004–2010, PT Asuransi Kesehatan: Laporan Keuangan Tahun 2004–2010 (PT Asuransi Kesehatan: Financial Report 2004–2010). Jakarta: PT Asuransi Kesehatan.
ASKRINDO,2007–2009, PT Asuransi Kredit Indonesia: Laporan Keuangan Tahun 2007–2009 (PT Asuransi Kredit Indonesia Financial Report 2007–2009). Jakarta: PT Asuransi Kredit Indonesia.
BAHTERA ADIGUNA PB 2004–2009, PT Bahtera Adiguna: Laporan Keuangan Tahun 2004–2009 (PT Bahtera Adiguna Financial Report 2004–2009). Jakarta: PT Bahtera Adiguna.
BALAI PUSTAKA, 2004–2009, PT Balai Pustaka: Laporan Keuangan Tahun 2004–2009 (PT Balai Pustaka: Financial Report 2004–2009). Jakarta: PT Balai Pustaka.
BANDA GHARA REKSA, 2004–2010, PT Banda Ghara Reksa: Laporan Keuangan Tahun 2004–2010 (PT Banda Ghara Reksa: Financial Report 2004–2010). Jakarta: PT Banda Ghara Reksa.
BANK EKSPOR INDONESIA, 2004–2010, PT Bank Eksport Indonesia: Laporan Keuangan Tahun 2004–2010 (PT Bank Eksport Indonesia: Financial Report 2004–2010). Jakarta: PT Bank Eksport Indonesia
BANK NEGARA INDONESIA, 2004–2010, (PT Bank Negara Indonesia Tbk Annual Report 2004–2010). Jakarta: PT Bank Negara Indonesia Tbk.
BANK RAKYAT INDONESIA, 2004–2010, (PT Bank Rakyat Indonesia Tbk Annual Report 2004–2010). Jakarta: PT Bank Rakyat Indonesia Tbk.
BANK TABUNGAN NEGARA, 2004–2010, PT Bank Tabungan Negara Tbk: Laporan Keuangan Tahun 2004–2010 (PT Bank Tabungan Negara Tbk: Financial Report 2004). Jakarta: PT Bank Tabungan Negara Tbk.
BARATA INDONESIA, 2004–2010, PT Barata Indonesia: Laporan Keuangan Tahun 2004–2010 (PT Barata Indonesia: Financial Report 2004–2010). Surabaya PT Barata Indonesia.
BRANTAS ABIPRAYA, 2004–2010, PT Brantas Abipraya: Laporan Keuangan Tahun 2004–2010 (PT Brantas Abipraya Financial Report 2004–2010). Jakarta: PT Brantas Abipraya.
BATAM 2004–2010, PT PDI Pulau Batam: Laporan Keuangan Tahun 2004–2010 (PT PDI Persero Batam: Financial Report 2004–2010). Batam: PT PDI Pulau Batam.
BATAN TEKNOLOGI P 2004–2009, PT Batan Teknologi: Laporan Keuangan Tahun 2004–2009 (PT BATAN Teknology Financial Report 2004–2009). Jakarta: PT Batan Teknologi.
BIO FARMA, 2004–2010, Laporan Keuangan Tahun 2004–2010 PT Bio Farma (PT Bio Farma Financial Report 2004–2010). Bandung: PT Bio Farma.

235
BINA KARYA, 2004–2009, PT Bina Karya: Laporan Keuangan Tahun 2004–2009 (PT Bina Karya: Financial Report 2004–2009). Jakarta: PT Bina Karya.
BIRO KLASIFIKASI INDONESIA, 2004–2009, PT Biro Klasifikasi Indonesia: Laporan Keuangan Tahun 2004–2009 (PT Biro Klasifikasi Indonesia: Financial Report 2004–2009). Jakarta: PT Biro Klasifikasi Indonesia.
BOMA BISMA INDRA 2004–2010, PT Boma Bisma Indra: Laporan Keuangan Tahun 2004–2010 (PT Boma Bisma Indra: Financial Report 2004–2010). Surabaya: PT Boma Bisma Indra.
BTDC, 2004–2010, PT Pengembangan Pariwisata Bali: Laporan Keuangan Tahun 2004–2010 (PT Pengembangan Pariwisata Bali: Financial Report 2004–2010). Denpasar: PT Pengembangan Pariwisata Bali.
BUKIT ASAM, 2004–2010, PT Tambang Batubara Bukit Asam Annual Report 2004–2010). Bukit Asam: PT Tambang Batubara Bukit Asam Tbk.
BULOG, 2004–2009, Perum BULOG: Laporan Keuangan Tahun 2004–2009 (Perum BULOG: Financial Report 2004–2009). Jakarta: Perum BULOG.
DAHANA, 2004–2010, PT Dahana: Laporan Keuangan Tahun 2004–2010 (PT Dahana: Financial Report 2004–2010). Tasikmalaya: PT Dahana.
DAMRI, 2004–2009, Perum Damri: Laporan Keuangan Tahun 2004–2009 (Perum Damri: Financial Report 2004–2009). Jakarta: Perum Damri.
DANAREKSA, 2004–2009, PT Danareksa: Laporan Keuangan Tahun 2004–2009 (PT Danareksa: Financial Report 2004–2009). Jakarta: PT Danareksa.
DIRGANTARA INDONESIA, 2004–2009, PT Dirgantara Indonesia: Laporan Keuangan Tahun 2004–2009 (PT Dirgantara Indonesia Financial Report 2004–2009). Bandung: PT Dirgantara Indonesia.
DJAKARTA LYOD, 2004–2009, PT Djakarta Lyod: Laporan Keuangan Tahun 2004–2009 (PT Djakarta Lyod: Financial Report 2004–2009). Jakarta: PT Djakarta Lyod.
DOK KODJA BAHARI, 2004–2009, PT Dok dan Perkapalan Kodja Bahari: Laporan Keuangan 2004–2009 (PT Dok and Perkapalan Kodja Bahari Financial Report 2004–2009). Jakarta: PT Dok dan Perkapalan Kodja Bahari.
DOK PERKAPALAN SURABAYA, 2004–2009, PT Dok dan Perkapalan Surabaya: Laporan Keuangan Tahun 2004–2009 (PT Dok dan Perkapalan Surabaya Financial Report 2004–2009). Surabaya: PT Dok dan Perkapalan Surabaya.
ENERGI MANAJEMEN INDONESIA, 2004–2009, PT Energi Manajemen Indonesia: Laporan Keuangan Tahun 2004–2009 (PT Energi Manajemen Indonesia: Financial Report 2004–2009). Jakarta: PT EMI.
GARAM, 2004–2009, PT Garam Laporan Keuangan Tahun 2004–2009 (PT Garam Financial Report 2004–2009). Madura: PT Garam.
GARUDA INDONESIA, 2004–2010, PT Garuda Indonesia: Laporan Keuangan Tahun 2004–2010 (PT Garuda Indonesia: Financial Report 2004–2010). Jakarta: PT Garuda Indonesia.
HOTEL INDONESIA NATOUR, 2004–2009, PT Hotel Indonesia Natour: Laporan Keuangan Tahun 2004–2009 (PT Hotel Indonesia Natour: Financial Report 2004–2009). Jakarta: PT Hotel Indonesia Natour.
HUTAMA KARYA, 2004–2010, PT Hutama Karya: Laporan Keuangan Tahun 2004–2010 (PT Hutama Karya: Financial Report 2004–2010). Jakarta: PT Hutama Karya.
IGLAS, 2004–2009, PT Industri Gelas Laporan Keuangan 2004–2009 (PT Industri Gelas Financial Report 2004–2009). Surabaya PT Industri Gelas.
IKI, 2004–2010, PT Industri Kapal Indonesia: Laporan Keuangan Tahun 2004–2010 (PT Industri Kapal Indonesia Financial Report 2004–2010). Makasar: PT IKI.
INDAH KARYA, 2004–2009, PT Indah Karya: Laporan Keuangan Tahun 2004–2009 (PT Indah Karya: Financial Report 2004–2009). Bandung: PT Indah Karya.
INDOFARMA, 2004–2010, (PT Indofarma Annual Report 2004–2010). Jakarta: PT Indofarma.
236
INDRA KARYA, 2004–2010, PT Indra Karya: Laporan Keuangan Tahun 2004–2010 (PT Indra Karya: Financial Report 2004–2010). Jakarta: PT Indra Karya.
INDUSTRI SANDANG, 2004–2009, PT Industri Sandang Laporan Keuangan Tahun 2004–2009 (PT Industri Sandang Financial Report 2004–2009). Jakarta: PT Industri Sandang.
INHUTANI I, 2004–2010, PT INHUTANI I: Laporan Keuangan Tahun 2004–2010 (PT INHUTANI I: Financial Report 2004–2010). Jakarta: PT INHUTANI I.
INHUTANI II, 2004–2009, PT INHUTANI II: Laporan Keuangan Tahun 2004–2009 (PT INHUTANI II: Financial Report 2004–2009). Jakarta: PT INHUTANI II.
INHUTANI III, 2004–2010, PT INHUTANI III: Laporan Keuangan Tahun 2004–2010 (PT INHUTANI III: Financial Report 2004–2010). Jakarta: PT INHUTANI III.
INHUTANI IV, 2004–2009, PT INHUTANI IV: Laporan Keuangan Tahun 2004–2009 (PT INHUTANI IV: Financial Report 2004–2009). Jakarta: PT INHUTANI IV.
INHUTANI V, 2004–2009, PT INHUTANI V: Laporan Keuangan Tahun 2004–2009 (PT INHUTANI V: Financial Report 2004–2009). Jakarta: PT INHUTANI V.
INKA, 2004–2010, PT Industri Kereta Api: Laporan Keuangan Tahun 2004–2010 (PT Industri Kereta Api: Financial Report 2004–2010). Madiun: PT Industri Kereta Api.
INTI, 2004–2010, PT Industri Telekomunikasi Indonesia: Laporan Keuangan Tahun 2004–2010 (PT Industri Telekomunikasi Indonesia : Financial Report 2004–2010). Bandung: PT Industri Telekomunikasi Indonesia.
ISTAKA KARYA, 2004–2009, PT Istaka Karya: Laporan Keuangan Tahun 2004–2009 (PT Istaka Karya: Financial Report 2004–2009). Jakarta: PT Istaka Karya.
JAMKRINDO, 2004–2009, Perum Jaminan Kredit Indonesia: Laporan Keuangan Tahun 2004–2009 (Perum Jaminan Kredit Indonesia: Financial Report 2004–2009). Jakarta: Perum Jaminan Kredit Indonesia.
JAMSOSTEK, 2004–2010, PT JAMSOSTEK: Laporan Keuangan Tahun 2004–2010 (PT JAMSOSTEK Financial Report 2004–2010). Jakarta: PT JAMSOSTEK.
JASA MARGA, 2004–2010, (PT Jasa Marga Tbk Annual Report 2004–2010). Jakarta: PT Jasa Marga Tbk.
JASA RAHARJA, 2004–2010, PT Asuransi Jasa Raharja Laporan Keuangan Tahun 2004–2010 (PT Asuransi Jasa Raharja Financial Report 2004–2010). Jakarta: PT Asuransi Jasa Raharha.
JASA TIRTA I, 2004–2009, Perum Jasa Tirta I: Laporan Keuangan Tahun 2004–2009 (Perum Jasa Tirta I: Financial Report 2004–2009). Malang Perum Jasa Tirta I.
JASA TIRTA II, 2004–2010, Perum Jasa Tirta II: Laporan Keuangan Tahun 2004–2010 (Perum Jasa Tirta II: Financial Report 2004–2010). Purwakarta: Perum Jasa Tirta II.
JASINDO, 2004–2010, PT Jasa Asuransi Indonesia Laporan Keuangan Tahun 2004–2010 (PT Jasa Asuransi Indonesia Financial Report 2004–2010). Jakarta: PT JASINDO.
JIWASRAYA, 2004–2010, PT Asuransi Jiwasraya Laporan Keuangan Tahun 2004–2010 (PT Asuransi Jiwasraya Financial Report 2004–2010). Jakarta: PT Asuransi Jiwasraya.
KERETA API INDONESIA, 2004–2010, PT Kereta Api Indonesia: Laporan Keuangan Tahun 2004–2010 (PT Kereta Api Indonesia: Financial Report 2004–2010). Bandung: PT Kereta Api Indonesia.
KLIRING BERJANGKA INDONESIA, 2004–2010, PT Kliring Berjangka Indonesia: Laporan Keuangan Tahun 2004–2010 (PT Kliring Berjangka Indonesia: Financial Report 2004–2010). Jakarta: PT Kliring Berjangka Indonesia.
KAWASAN BERIKAT NUSANTARA, 2004–2010, PT Kawasan Berikat Nusantara: Laporan Keuangan Tahun 2004–2010 (PT Kawasan Berikat Nusantara: Financial Report 2004–2010). Jakarta: PT Kawasan Berikat Nusantara.
KAWASAN INDUSTRI MEDAN, 2004–2009, PT Kawasan Industri Medan: Laporan Keuangan Tahun 2004–2009 (PT Kawasan Industri Medan: Financial Report 2004–2009). Medan: PT Kawasan Industri Medan.
237
KIMA, 2004–2009, PT Kawasan Industri Makasar: Laporan Keuangan Tahun 2004–2009 (PT Kawasan Industri Makasar: Financial Report 2004–2009). Makasar: PT Kawasan Industri Makasar.
KIMIA FARMA, 2004–2010, (PT Kimia Farma Tbk Annual Report 2004–2010). Jakarta: PT Kimia Farma Tbk.
KERTAS KRAFT ACEH, 2004–2009, PT Kertas Kraft Aceh: Laporan Keuangan Tahun 2004–2009 (PT Kertas Kraft Aceh: Financial Report 2004–2009). Banda Aceh PT Kertas Kraft Aceh.
KRAKATAU STEEL, 2004–2010, PT Krakatau Steel Tbk: Laporan Keuangan Tahun 2004–2010 (PT Krakatau Steel: Financial Report 2004–2010). Cilegon: PT Krakatau Steel Tbk.
KAWASAN INDUSTRI WIJAYA KUSUMA, 2004–2009, PT Kawasan Berikat Wijaya Kusuma: Laporan Keuangan Tahun 2004–2009 (PT Kawasan Berikat Wijaya Kusuma: Financial Report 2004–2009). Semarang: PT Kawasan Berikat Wijaya Kusuma.
KERTAS LECES, 2004–2009, PT Kertas Leces: Laporan Keuangan Tahun 2004–2009 (PT Kertas leces: Financial Report 2004–2009). Leces: PT Kertas Leces.
LEN, 2004–2010, PT LEN Industri: Laporan Keuangan Tahun 2004–2010 (PT LEN Industri: Financial Report 2004–2010). Bandung: PT LEN Industri.
MANDIRI, 2004–2010, (PT Bank Mandiri Tbk Annual Report 2004–2010). Jakarta: PT Bank Mandiri Tbk.
MERPATI NUSANTARA AIRLINES, 2004–2009, PT Merpati Nusantara Airlines: Laporan Keuangan Tahun 2004–2009 (PT Merpati Nusantara Airlines: Financial Report 2004–2009). Jakarta: PT Merpati Nusantara Airlines.
NINDYA KARYA, 2004–2010, PT Nindya Karya: Laporan Keuangan Tahun 2004–2010 (PT Nindya Karya: Financial Report 2004–2010). Jakarta: PT Nindya Karya.
PERIKANAN NUSANTARA, 2004–2009, PT Perikanan Nusantara: Laporan Keuangan Tahun 2004–2009 (PT Perikanan Nusantara: Financial Report 2004-2009). Jakarta: PT Perikanan Nusantara.
PAL INDONESIA, 2004–2010, PT PAL Indonesia: Laporan Keuangan Tahun 2004–2010 (PT PAL Indonesia Financial Report 2004–2010). Surabaya: PT PAL Indonesia.
PANN MULTI FINANCE, 2004–2009, PT PANN Multi-Finance: Laporan Keuangan Tahun 2004–2009 (PT PANN Multi-Finance: Financial Report 2004–2009). Jakarta: PT PANN Multi-Finance.
PARAMITA, 2004–2009, PT Pradnya Paramita: Laporan Keuangan Tahun 2004–2009 (PT Pradnya Paramita: Financial Report 2004–2009). Jakarta: PT Pradnya Paramita.
PEGADAIAN, 2004–2009, Perum Pegadaian: Laporan Keuangan Tahun 2004–2009 (Perum Pegadaian: Financial Report 2004–2009). Jakarta: Perum Pegadaian.
PELINDO I, 2004–2010, PT Pelabuhan Indonesia I: Laporan Keuangan Tahun 2004–2010 (PT Pelabuhan Indonesia I: Financial Report 2004–2010). Medan PT Pelabuhan Indonesia I.
PELINDO II, 2004–2010, PT Pelabuhan Indonesia II: Laporan Keuangan Tahun 2004–2010 (PT Pelabuhan Indonesia II: Financial Report 2004–2010). Jakarta: PT Pelabuhan Indonesia II.
PELINDO III, 2004–2010, PT Pelabuhan Indonesia III: Laporan Keuangan Tahun 2004–2010 (PT Pelabuhan Indonesia III: Financial Report 2004–2010). Surabaya PT Pelabuhan Indonesia III.
PELINDO IV, 2004–2009, PT Pelabuhan Indonesia IV: Laporan Keuangan Tahun 2004–2009 (PT Pelabuhan Indonesia IV: Financial Report 2004–2009). Makasar: PT Pelabuhan Indonesia IV.
PELNI, 2004–2010, PT Perlayaran Nasional Indonesia: Laporan Keuangan Tahun 2004–2010 (PT Pelayaran Nasional Indonesia: Financial Report 2004–2010). Jakarta PT Perlayaran Nasional Indonesia.
PERHUTANI, 2004–2010, Perum Perhutani: Laporan Keuangan Tahun 2004–2010 (Perum Perhutani Financial Report 2004–2010). Jakarta: Perum Perhutani.
PERTAMINA, 2004–2010, PT PERTAMINA: Laporan Keuangan Tahun 2004–2010 (PT PERTAMINA Financial Report 2004–2010). Jakarta: PT PERTAMINA.
PERTANI, 2004–2009, PT Pertani: Laporan Keuangan Tahun 2004–2009 (PT Pertani: Financial Report 2004–2009). Jakarta: PT Pertani.
238
PERUMNAS, 2004–2010, Perum Perumnas: Laporan Keuangan Tahun 2004–2010 (Perum Perumnas: Financial Report 2004–2010). Jakarta: Perum Perumnas.
PERURI, 2004–2009, Perum Percetakan Uang Republik Indonesia: Laporan Keuangan Tahun 2004–2009 (Perum Percetakan Uang Republik Indonesia: Financial Report 2004–2009). Jakarta: Perum Percetakan Uang Republik Indonesia.
PINDAD, 2004–2010, PT PINDAD: Laporan Keuangan Tahun 2004–2010 (PT PINDAD: Financial Report 2004–2010). Bandung: PT PINDAD.
PP BERDIKARI, 2004–2009, PT PP Berdikari: Laporan Keuangan Tahun 2004–2009 (PT PP Berdikari: Financial Report 2004–2009). Jakarta: PT PP Berdikari.
PEMBANGUNAN PERUMAHAN, 2004–2010, PT Pembangunan Perumahan Tbk: Laporan Keuangan Tahun 2004–2010 (PT Pembangunan Perumahan: Financial Report 2004–2010). Jakarta: PT Pembangunan Perumahan Tbk.
PERMODALAN NASIONAL MARDANI, 2004–2010, PT Permodalan Nasional Madani: Laporan Keuangan Tahun 2004–2010 (PT Permodalan Nasional Madani: Financial Report 2004–2010). Jakarta: PT Permodalan Nasional Madani.
PERUSAHAAN GAS NEGARA, 2004–2010, (PT PGN Tbk Annual Report 2004–2010). Jakarta: PT PGN Tbk.
PERUSAHAAN LISTRIK NEGARA, 2004–2010, PT Perusahan Listrik Negara: Laporan Keuangan Tahun 2004–2010 (PT Perusahaan Listrik Negara: Financial Report 2004–2010). Jakarta: PT PLN.
PENGANGKUTAN PENUMPANG DJAKARTA, 2004–2009, Perum Pengangkutan Penumpang Djakarta: Laporan Keuangan Tahun 2004–2009 (Perum Pengangkutan Penumpang Djakarta: Financial Report 2004–2009). Jakarta: Perum Pengangkutan Penumpang Djakarta.
PERCETAKAN NEGARA, 2004–2009, Perum Percetakan Negara Republik Indonesia: Laporan Keuangan Tahun 2004–2009 (Perum Percetakan Negara Republik Indonesia: Financial Report 2004–2009). Jakarta: Perum Percetakan Negara Republik Indonesia.
PERUSAHAAN PERDAGANGAN INDONESIA PI, 2004–2009, PT Perusahaan Perdagangan Indonesia: Laporan Keuangan Tahun 2004–2009 (PT Perusahan Perdagangan Indonesia: Financial Report 2004–2009). Jakarta: PT Perusahaan Perdagangan Indonesia.
PERUSAHAAN PENGELOALA ASET, 2004–2010, PT Perusahaan Pengelola Aset: Laporan Keuangan Tahun 2004–2010 (PT Perusahaan Pengelola Aset: Financial Report 2004–2010). Jakarta: PT Perusahaan Pengelola Aset.
POS INDONESIA 2004–2010, PT Pos Indonesia: Laporan Keuangan Tahun 2004–2010 (PT Pos Indonesia: Financial Report 2004–2010). Bandung PT Pos Indonesia.
PRASARANA PERIKANAN SAMUDERA, 2004–2010, Perum Prasarana Perikanan Samudera: Laporan Keuangan Tahun 2004–2010 (Perum Prasarana Perikanan Samudera: Financial Report 2004–2010). Jakarta: Perum Prasarana Perikanan Samudera.
PRIMISSIMA, 2004–2009, PT Primissima Laporan Keuangan Tahun 2004–2009 (PT Primissima Financial Report 2004–2009). Jakarta: PT Primissima.
PRODUKSI FILM NASIONAL, 2004–2009, Perum Produksi Film Negara: Laporan Keuangan Tahun 2004–2009 (Perum Produksi Film Negara: Financial Report 2004–2009). Jakarta: Perum Produksi Film Negara.
PTPN I, 2004–2010, PT Perkebunan Nusantara I: Laporan Keuangan Tahun 2004–2010 (PT Perkebunan Nusantara I: Financial Report 2004–2010). Langsa: PT Perkebunan Nusantara I.
PTPN II, 2004–2010, PT Perkebunan Nusantara II: Laporan Keuangan Tahun 2004–2010 (PT Perkebunan Nusantara II: Financial Report 2004–2010). Medan: PT Perkebunan Nusantara II.
PTPN III, 2004–2010, PT Perkebunan Nusantara III: Laporan Keuangan Tahun 2004–2010 (PT Perkebunan Nusantara III: Financial Report 2004–2010). Medan: PT Perkebunan Nusantara III.
PTPN IV, 2004–2010, PT Perkebunan Nusantara IV: Laporan Keuangan Tahun 2004–2010 (PT Perkebunan Nusantara IV: Financial Report 2004–2010). Medan: PT Perkebunan Nusantara IV.
PTPN V, 2004–2010, PT Perkebunan Nusantara V: Laporan Keuangan Tahun 2004–2010 (PT Perkebunan Nusantara V: Financial Report 2004–2010). Pekanbaru: PT Perkebunan Nusantara V.
239
PTPN VI, 2004–2010, PT Perkebunan Nusantara VI: Laporan Keuangan Tahun 2004–2010 (PT Perkebunan Nusantara VI : Financial Report 2004–2010). Jambi: PT Perkebunan Nusantara VI.
PTPN VII, 2004–2010, PT Perkebunan Nusantara VII: Laporan Keuangan Tahun 2004–2010 (PT Perkebunan Nusantara VII: Financial Report 2004–2010). Tanjung Karang: PT Perkebunan Nusantara VII.
PTPN VIII, 2004–2009, PT Perkebunan Nusantara VIII: Laporan Keuangan Tahun 2004–2009 (PT Perkebunan Nusantara VIII: Financial Report 2004–2009). Bandung: PT Perkebunan Nusantara VIII.
PTPN IX, 2004–2010, PT Perkebunan Nusantara IX: Laporan Keuangan Tahun 2004–2010 (PT Perkebunan Nusantara IX: Financial Report 2004–2010). Semarang: PT Perkebunan Nusantara IX.
PTPN X, 2004–2009, PT Perkebunan Nusantara X: Laporan Keuangan Tahun 2004–2009 (PT Perkebunan Nusantara X: Financial Report 2004–2009). Surabaya: PT Perkebunan Nusantara X.
PTPN XI, 2004–2009, PT Perkebunan Nusantara XI: Laporan Keuangan Tahun 2004–2009 (PT Perkebunan Nusantara XI: Financial Report 2004–2009). Surabaya: PT Perkebunan Nusantara XI.
PTPN XII, 2004–2010, PT Perkebunan Nusantara XII: Laporan Keuangan Tahun 2004–2010 (PT Perkebunan Nusantara XII: Financial Report 2004–2010). Surabaya: PT Perkebunan Nusantara XII.
PTPN XIII, 2004–2009, PT Perkebunan Nusantara XIII: Laporan Keuangan Tahun 2004–2009 (PT Perkebunan Nusantara XIII: Financial Report 2004–2009). Pontianak: PT Perkebunan Nusantara XIII.
PTPN XIV, 2004–2010, PT Perkebunan Nusantara XIV: Laporan Keuangan Tahun 2004–2010 (PT Perkebunan Nusantara XIV: Financial Report 2004–2010). Makasar: PT Perkebunan Nusantara XIV.
PUPUK SRIWIJAYA, 2004–2010, PT Pupuk Sriwijaya: Laporan Keuangan Tahun 2004–2010 (PT Pupuk Sriwijaya: Financial Report 2004–2010). Palembang: PT Pupuk Sriwijaya.
TWBPBK 2004–2009, PT Taman Wisata Candi Borobudur, Prambanan dan Ratu Boko: Laporan Keuangan Tahun 2004–2009 (PT Taman Wisata Candi Borobudur Prambanan dan Ratu Boko: Financial Report 2004–2009). Jogjakarta: PT Taman Wisata Candi Borobudur, Prambanan dan Ratu Boko.
RAJAWALI NUSANTARA INDONESIA, 2004–2010, PT Rajawali Nusantara Indonesia: Laporan Keuangan Tahun 2004–2010 (PT Rajawali Nusantara Indonesia: Financial Report 2004–2010). Jakarta: PT Rajawali Nusantara Indonesia.
RUKINDO, 2004–2010, PT Pengerukan Indonesia: Laporan Keuangan Tahun 2004–2010 (PT Pengerukan Indonesia: Financial Report 2004–2010). Jakarta: PT Pengerukan Indonesia.
SANG HYANG SERI, 2004–2009, PT Sang Hyang Seri: Laporan Keuangan Tahun 2004–2009 (PT Sang Hyang Seri: Financial Report 2004–2009). Jakarta: PT Sang Hyang Seri.
SARANA KARYA, 2004–2009, PT Sarana Karya: Laporan Tahunan 2004–2009 (PT Sarana Karya Financial Report 2004–2009). Jakarta: PT Sarana Karya.
SARINAH, 2004–2009, PT Sarinah: Laporan Keuangan Tahun 2004–2009 (PT Sarinah: Financial Report 2004–2009). Jakarta: PT Sarinah.
SEMEN BATURAJA, 2004–2010, PT Semen Baturaja: Laporan Tahunan 2004–2010 (PT Semen Baturaja Financial Report 2004–2010). Baturaja: PT Semen Baturaja.
SEMEN GRESIK, 2004–2010, (PT Semen Gresik Tbk Annual Report 2004–2010). Surabaya: PT Semen Gresik Tbk.
SUCOFINDO, 2004–2010, PT Sucofindo: Laporan Keuangan Tahun 2004–2010 (PT Sucofindo: Financial Report 2004–2010). Jakarta: PT Sucofindo.
SURVEYOR INDONESIA, 2004–2010, PT Surveyor Indonesia: Laporan Keuangan Tahun 2004–2010 (PT Surveryor Indonesia: Financial Report 2004–2010). Jakarta: PT Surveyor Indonesia.
SURVEY UDARA PENAS, 2004–2009, PT Survey Udara Penas: Laporan Keuangan Tahun 2004–2009 (PT Survey Udara Penas: Financial Report 2004–2009). Jakarta: PT Survey Udara Penas.

240
TASPEN, 2004–2010, PT TASPEN: Laporan Keuangan Tahun 2004–2010 (PT TASPEN: Financial Report 2004–2010). Jakarta: PT TASPEN.
TELKOM, 2004–2010, (PT Telekomunikasi Indonesia Tbk Annual Report 2004–2010). Bandung: PT Telekomunikasi Indonesia Tbk.
TIMAH, 2004–2010, PT Tambang Timah Tbk Annual Report 2004–2010. Jakarta: PT Timah Tbk.
VARUNA TIRTA PRAKASYA, 2004–2009, PT Varuna Tirta Prakasya: Laporan Keuangan Tahun 2004–2009 (PT Varuna Tirta Prakasya: Financial Report 2004–2009). Jakarta: PT Varuna Tirta Prakasya.
VIRAMA KARYA, 2004–2009, PT Virama Karya: Laporan Keuangan Tahun 2004–2009 (PT Virama Karya: Financial Report 2004–2009). Jakarta: PT Virama Karya.
WASKITA KARYA, 2004–2010, PT Waskita Karya: Laporan Keuangan Tahun 2004–2010 (PT Waskita Karya: Financial Report 2004–2010). Jakarta: PT Waskita Karya.
WIJAYA KARYA,2004–2010, PT Wijaya Karya : Laporan Tahunan 2004-2010 (PT Wijaya Karya Tbk Annual Report 2004–2010). Jakarta: PT Wijaya Karya Tbk.
YODYA KARYA, 2004–2010, PT Yodya Karya: Laporan Keuangan Tahun 2004–2010 (PT Yodya Karya: Financial Report 2004–2010). Jakarta: PT Yodya Karya