are patterns of bone loss in anorexic and postmenopausal women similar? preliminary results using...
TRANSCRIPT

1
2
3
4
5Q1
678910
11
121314151617181920212223242526272829
49
50
51
52
53
54
55
56
57
58
59
60
61
62
63
64
Bone xxx (2013) xxx–xxx
BON-10158; No. of pages: 5; 4C:
Contents lists available at ScienceDirect
Bone
j ourna l homepage: www.e lsev ie r .com/ locate /bone
Original Full Length Article
Are patterns of bone loss in anorexic and postmenopausal womensimilar? Preliminary results using high resolution peripheralcomputed tomography
OO
F
Gabriella Milos a,⁎, Hans-Jörg Häuselmann b, Marc-Antoine Krieg c, Peter Rüegsegger d, Luigi M. Gallo e
a Clinic for Psychiatry and Psychotherapy, University Hospital, Zurich, Switzerlandb Center for Rheumatology and Bone Disease, Klinik Im Park, Zurich, Switzerlandc Rheumatology Clinic, CHUV, Lausanne, Switzerlandd Institute of Biomedical Engineering, ETH, University of Zurich, Switzerlande Clinic for Masticatory Disorders, Removable Prosthodontics, Geriatric and Special Care Dentistry, Center of Dental Medicine, University of Zurich, Switzerland
⁎ Corresponding author at: Department of PsychiatryCulmannstr. 8, 8091 Zurich, Switzerland. Fax: +41 44 25
E-mail address: [email protected] (G. Milos).
8756-3282/$ – see front matter © 2013 Published by Elsehttp://dx.doi.org/10.1016/j.bone.2013.09.016
Please cite this article as: Milos G, et al, Are presolution peripheral computed tomography
PR
a b s t r a c t
a r t i c l e i n f o30
31
32
33
34
35
36
37
38
39
40
41
42
Article history:Received 19 November 2012Revised 4 September 2013Accepted 17 September 2013Available online xxxx
Edited by: Felicia Cosman
Keywords:3D-pQCTMicroarchitecture of boneBone lossAnorexia nervosaOsteoporosisPostmenopausal women
43
44
45
46
RECTED This study intended to compare bone density and architecture in three groups of women: youngwomenwith an-orexia nervosa (AN), an age-matched control group of young women, and healthy late postmenopausal women.Three-dimensional peripheral quantitative high resolution computed-tomography (HR-pQCT) at the ultradistalradius, a technology providing measures of cortical and trabecular bone density and microarchitecture, wasperformed in the three cohorts. Thirty-six women with AN aged 18–30 years (mean duration of AN: 5.8 years),83 healthy late postmenopausal women aged 70–81 as well as 30 age-matched healthy young women wereassessed. The overall cortical and trabecular bone density (D100), the absolute thickness of the cortical bone(CTh), and the absolute number of trabecules per area (TbN) were significantly lower in AN patients comparedwith healthy young women. The absolute number of trabecules per area (TbN) in AN and postmenopausalwomen was similar, but significantly lower than in healthy young women.The comparison between AN patients and post-menopausal women is of interest because the latter reach bonepeak mass around the middle of the fertile age span whereas the former usually lose bone before reaching opti-mal bone density and structure. This study shows that bonemineral density and bone compacta thickness in ANare lower than those in controls but still higher than those in postmenopause. Bone compacta density in AN issimilar as in controls. However, bone inner structure in AN is degraded to a similar extent as in postmenopause.This last finding is particularly troubling.
© 2013 Published by Elsevier Inc.
4748
R65
66
67
68
69
70
71
72
73
74
75
76
77
78
79
UNCOIntroduction
Whereas postmenopausal osteoporosis is a common disease charac-terized by a systemic deterioration of bonemass and structure, general-ly starting in the fifth decade of life, bone loss in anorexia nervosa (AN)frequently occurs also in young age. AN usually occurs at a critical timefor building up bonemass and, due to early bone loss, is often associatedwith severely decreased bone mineral density and impairment in boneaccrual [1]. Lifetime prevalence of AN in industrialized countries is esti-mated at 0.5–0.9% in women, and 3–8 times less in men [2,3]. About50% of adolescent girls suffering from AN have a bone mineral densityZ-score b−1 at one or more sites [4].
According to the Diagnostic Statistical Manual (DSM) of PsychiatricDisorders IV [5], AN is characterized, besides pathological eating behav-ior and underweight, by fear of gaining weight, distorted body size
80
81
82
83
, University Hospital of Zurich,5 45 30.
vier Inc.
atterns of bone loss in anorex, Bone (2013), http://dx.doi.o
perception, and amenorrhea in women. Low bone mass and density inAN are due to nutritional deficiencies and alterations in multiple neuro-endocrine axes, such as hypogonadism, low insulin-like growth factor-1and relative hypercortisolemia [1]. In women after menopause, sexualhormone deficiency is assumed to be a precipitating cause of increasedbone resorption resulting in osteopenia or osteoporosis. Bone loss in AN,as well as after menopause, often leads to increased bone fragility witha high risk of consequent fractures. Bone microarchitecture and itschanges are keys to understand the mechanisms and frequency of frac-tures. High-resolution peripheral computed tomography (HR-pQCT) isa novel radiologic method that permits high resolution three dimen-sional measurement of trabecular and cortical bone structure at severallocations, mostly at the distal radius and distal tibia [6].
In our previous studies, we could demonstrate – by means of HR-pQCT – that AN affected in young women both trabecular and corticalbone, and despite weight increase, improvement of bone density andmicroarchitecture showed heterogeneous courses at different locationsafter two years [7,8]. Postmenopausal womenwith no history of pathol-ogies affecting bone metabolism indeed undergo bone loss but have
ic and postmenopausal women similar? Preliminary results using highrg/10.1016/j.bone.2013.09.016
T
84
85
86
87
88
89
90
91
92
93
94
95
96
97
98
99
100
101
102
103
104
105
106
107
108
109
110
111
112
113Q4
114
115
116
117
118
119
120
121
122
123
124
125
126
127
128
129
130
131
132
133
134
135
136
137
138
139
140
141
142
143
144
145
146
147
148
149
150
151
152
153
154
155
156
157
158
159
160
161
162
163
164
165
166
167
168
169
170
171
172
173
174
175
176
177
178
179
180
181
182
183
184
185
186
187
188
189
190
191
192
193
194
195
196
197
198
199
200
201
202
203
204
2 G. Milos et al. / Bone xxx (2013) xxx–xxx
UNCO
RREC
reached a bone peak mass around the middle of the fertile age span.Young AN patients, however, usually lose bone before reaching optimalbone density and structure [9]. It is therefore of interest to compare howANand post-menopause affect bone architecture, given the different lifephases as well as endocrine shifts. A better insight into bone compart-ments can not only yield useful data to better understand bone loss eti-ology but also help in developing better targeted therapeutic strategies,in particular for AN patients. In the present work, we compare bonedensity and microarchitecture at the ultradistal radius with HR-pQCTtechnology in three different female cohorts: anorexic, healthy latepostmenopausal women, and healthy young women.
Material and methods
Subjects
AN patientswere recruited among subjects attending the Psychiatric/Psychotherapeutic Department of the University Hospital of Zurich(USZ). The diagnosis of ANwasmade according to DSM IV [5] at the Psy-chiatric Outpatient Department (section of eating disorders) of the USZ.The AN group consisted of 36 women aged between 18 and 30 years.Pregnant women were excluded from the study. All AN patients had aBMI below 17.5 (diagnostic criterion for AN) at recruitment time. How-ever, some weight changes occurred during the time period betweenthe initial recruitment and the physical examinations.
The postmenopausal control group was defined as women aged be-tween 70 and 80 years and was recruited consecutively in the Zurichmetropolitan area by the Osteoporosis Center of the Department ofRheumatology of the USZ. It consisted of 83 healthy women beingable to walk and being independent for daily activities. They took nei-ther medications for osteoporosis treatment nor supplements, such ascalcium or Vitamin D. This group had history of neither hip fracturesnor bilateral hip replacements nor metabolic conditions influencingbone density and structure.
The healthy young control group was composed of a total of 30women recruited among students of Medicine and Psychology at theUniversity of Zurich. Inclusion criteria were: ages 18–30, no current orlifetime eating disorder, not underweight (i.e. current BMI above 18)and no regular intake of medications (except oral contraceptives), nei-ther bone nor other general diseases. Less than 20% of controls reporteda history of fractures.
All participants completed questionnaires on socio-demographicdata, weight condition and anthropometric data and were examinedby a rheumatologist. Furthermore, AN patients and healthy young con-trols reported on eating disorders, (under)weight history, menstrua-tion, use of medication, hormonal substitution or contraceptives, aswell as the intake of vitamins (in particular vitamin D), minerals, or cal-cium products.
The study was approved by the Ethics Committee of the PsychiatricDepartment of theUniversityHospital Zurich. All participants gavewrit-ten informed consent.
Data acquisition
Bone mineral density and bone micro-architecture were measuredat the ultradistal radius of the non-dominant forearm by means ofhigh resolution multislice three-dimensional peripheral quantitativecomputer-tomography (HR-pQCT) (Scanco Medical AG, Bassersdorf,Switzerland) [10,11]. This is a valid methodology for the study of bonemicroarchitecture, since itmeasures true volumetric BMD, distinguishesbetween cortical and trabecular compartments and has adequate reso-lution to measure cortical and trabecular structure [12]. The measure-ment protocol included acquisition of a stack of 60 high-resolution CTslices. Slice thickness was 0.28 mm, pixel matrix of 512 × 512 andpixel size of 0.17 mm. The recordings were reformatted in order to ob-tain consecutive cross-sectional slices in 0.17 steps mm in the axial
Please cite this article as: Milos G, et al, Are patterns of bone loss in anorexresolution peripheral computed tomography, Bone (2013), http://dx.doi.o
ED P
RO
OF
direction thus yielding cubic voxels (0.17 × 0.17 × 0.17 mm3). Mea-surements were performed at the Institute for Biomedical Engineering,University of Zurich and Federal Institute of Technology (ETH).
Quantitative parameters were defined as follows:
D100 mean entire bone (cortical and trabecular) density of theultradistal part of the radius in grams hydroxyapatite equiva-lence per cm3 (grHA/cm3);
Dcomp bone density of the cortical part of the bone (grHA/cm3);C.Th absolute thickness of cortical bone (mm);Dtrab density of the trabecular area of the bone (grHA/cm3);Dmeta density of the sub cortical area of the trabecular bone
(grHA/cm3);BV/TV relative bone volume as part of the total volume (%);Tb.N absolute number of trabecules per area (1/mm);Tb.Th mean thickness of bone trabecules (mm);Tb.Sp mean separation distance between trabecules (mm).
The average short-term precision of the multislice high-resolution3D-pQCT after repositioning is 1.1% for Dtrab and 1.6% for structural pa-rameters such as TbN [10,11].
Statistical analysis
All parameterswere normally distributed according toKolmogorov–Smirnov and Shapiro–Wilk tests at a significance level of α = 0.05.Box-plots were produced for each parameter that was tested for groupdifferences bymeans of ANOVA (factor “group”, i.e. AN, postmenopaus-al and controls) with post-hoc tests with Bonferroni correction. Differ-ences were considered non-significant for p N 0.05, significant forp b 0.05, highly significant for p b 0.01 and very highly significant forp b 0.001. Statistical tests were performed bymeans of PASW statisticalsoftware package V. 18 for Windows (SPSS Inc. Chicago IL, USA).
Results
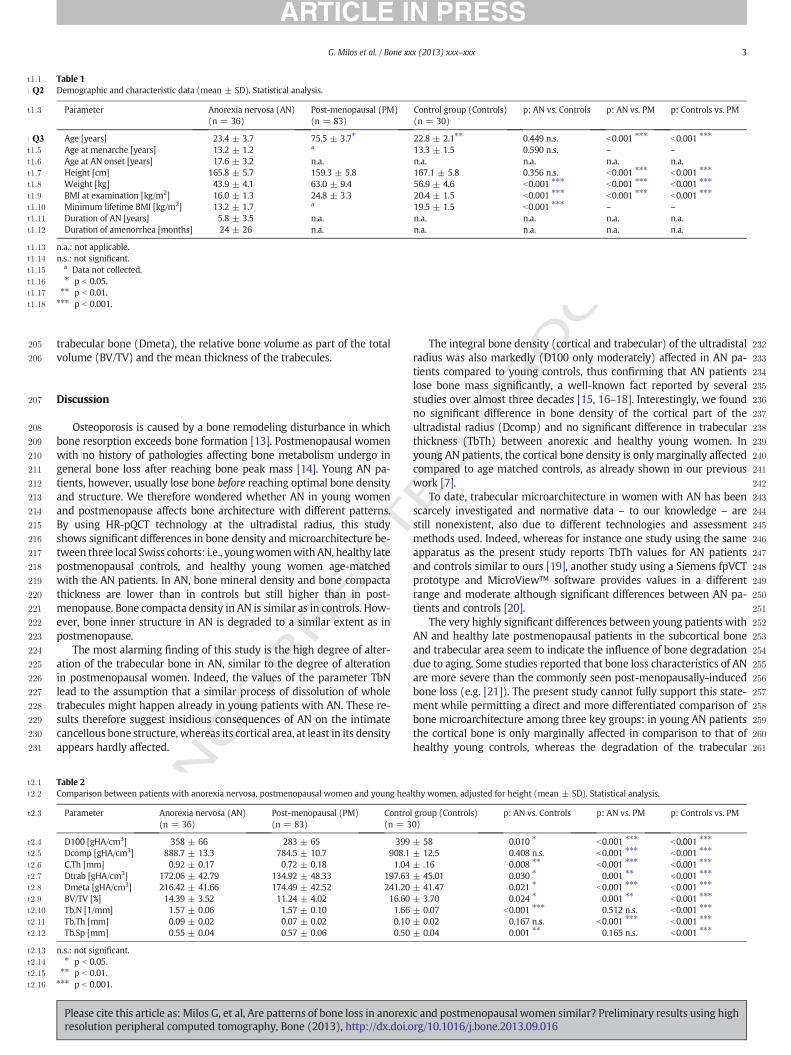
Table 1 shows the demographic data and other characteristic param-eters (age at menarche, age at AN onset, minimum lifetime BMI, dura-tion of AN, duration of amenorrhea) of the three groups (otherinformation on the subjects' history is reported in former work [6]). Inthe AN group the BMI at the time of examination ranged from 13.1 to17.9 kg/m2, there was no primary amenorrhea, and 64% used oral con-traceptives for amean duration of 41.5 months. Less than 20% of AN pa-tients reported a history of fractures. The mean current age and meanage at menarche did not differ between the AN group and controls(see Table 1).
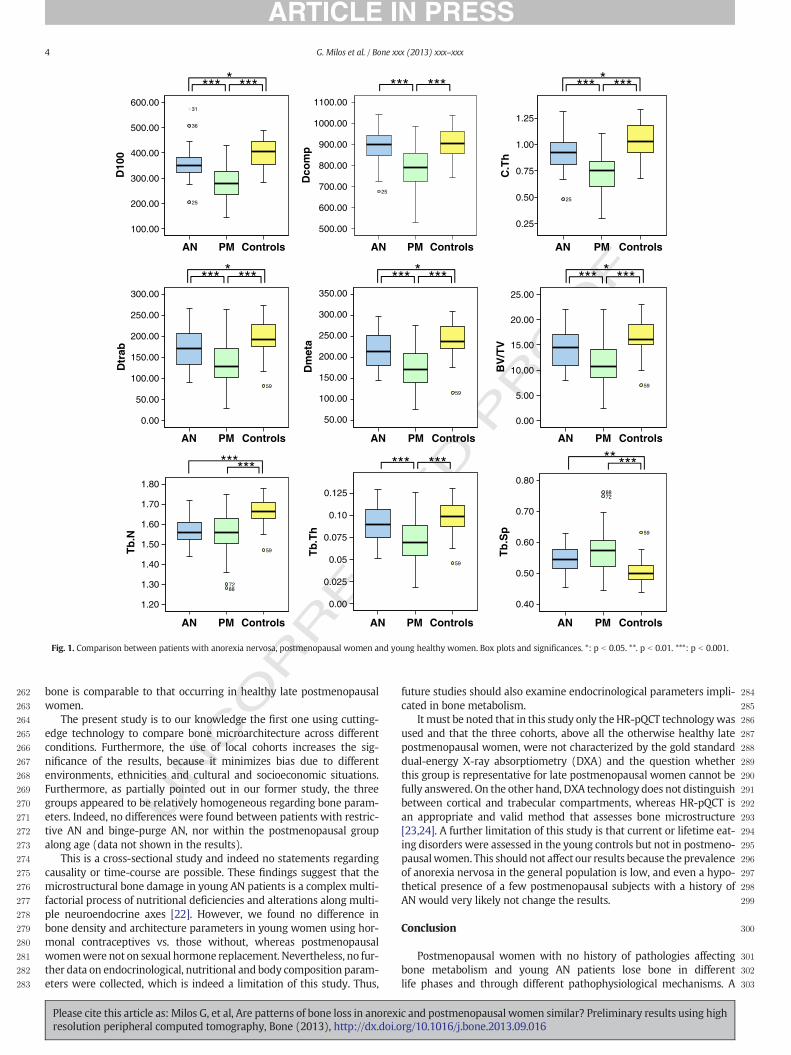
Table 2 lists the parameter values of bone density andmicroarchitecture. Both tables show the significances (p-values) of theparameters according to the post-hoc tests in the ANOVA. The parame-ter data and the significance of their differences are represented also inthe box-plots of Fig. 1.
The HR-pQCT technology at the ultradistal radius could clearly dem-onstrate that D100 and CTh are significantly lower in anorexic womencompared with in healthy young controls.
Compared to AN patients, in healthy young controls the number oftrabecules was very highly significantly higher (p b 0.001) and thetrabecular separation was highly significantly lower (p = 0.003), butnot in healthy late postmenopausal women (p = 1.00 and p = 0.112respectively) (s. Fig. 1). In addition, healthy late postmenopausalwomen showed significantly lower values of the following dens-itometrical and structural parameters at the ultradistal radius comparedto both anorexic women and healthy young controls: the integral bonedensity (D100), the bone density of the cortical compartment (Dcomp),the absolute thickness of the cortical zone (CTh), the density of the tra-becular compartment (Dtrab), the density of the sub-cortical area of the
ic and postmenopausal women similar? Preliminary results using highrg/10.1016/j.bone.2013.09.016
F
205
206
207
208
209
210
211
212
213
214
215
216
217
218
219
220
221
222
223
224
225
226
227
228
229
230
231
232
233
t2:1
t2:2
t2:3
t2:4
t2:5
t2:6
t2:7
t2:8
t2:9
t2:10
t2:11
t2:12
t2:13
t2:14
t2:15
t2:16
Table 1t1:1
t1:2Q2 Demographic and characteristic data (mean ± SD). Statistical analysis.
t1:3 Parameter Anorexia nervosa (AN)(n = 36)
Post-menopausal (PM)(n = 83)
Control group (Controls)(n = 30)
p: AN vs. Controls p: AN vs. PM p: Controls vs. PM
t1:4 Age [years] 23.4 ± 3.7 75.5 ± 3.7Q3 ⁎ 22.8 ± 2.1⁎⁎ 0.449 n.s. b0.001 ⁎⁎⁎ b0.001 ⁎⁎⁎
t1:5 Age at menarche [years] 13.2 ± 1.2 a 13.3 ± 1.5 0.590 n.s. – –
t1:6 Age at AN onset [years] 17.6 ± 3.2 n.a. n.a. n.a. n.a. n.a.t1:7 Height [cm] 165.8 ± 5.7 159.3 ± 5.8 167.1 ± 5.8 0.356 n.s. b0.001 ⁎⁎⁎ b0.001 ⁎⁎⁎
t1:8 Weight [kg] 43.9 ± 4.1 63.0 ± 9.4 56.9 ± 4.6 b0.001 ⁎⁎⁎ b0.001 ⁎⁎⁎ b0.001 ⁎⁎⁎
t1:9 BMI at examination [kg/m2] 16.0 ± 1.3 24.8 ± 3.3 20.4 ± 1.5 b0.001 ⁎⁎⁎ b0.001 ⁎⁎⁎ b0.001 ⁎⁎⁎
t1:10 Minimum lifetime BMI [kg/m2] 13.2 ± 1.7 a 19.5 ± 1.5 b0.001 ⁎⁎⁎ – –
t1:11 Duration of AN [years] 5.8 ± 3.5 n.a. n.a. n.a. n.a. n.a.t1:12 Duration of amenorrhea [months] 24 ± 26 n.a. n.a. n.a. n.a. n.a.
t1:13 n.a.: not applicable.t1:14 n.s.: not significant.
a Data not collected.t1:15⁎ p b 0.05.t1:16⁎⁎ p b 0.01.t1:17⁎⁎⁎ p b 0.001.t1:18
3G. Milos et al. / Bone xxx (2013) xxx–xxx
trabecular bone (Dmeta), the relative bone volume as part of the totalvolume (BV/TV) and the mean thickness of the trabecules.
T234
235
236
237
238
239
240
241
242
243
244
245
246
247
248
249
250
251
252
253
254
255
256
257
258
259
260
261
CORREC
Discussion
Osteoporosis is caused by a bone remodeling disturbance in whichbone resorption exceeds bone formation [13]. Postmenopausal womenwith no history of pathologies affecting bone metabolism undergo ingeneral bone loss after reaching bone peak mass [14]. Young AN pa-tients, however, usually lose bone before reaching optimal bone densityand structure. We therefore wondered whether AN in young womenand postmenopause affects bone architecture with different patterns.By using HR-pQCT technology at the ultradistal radius, this studyshows significant differences in bone density and microarchitecture be-tween three local Swiss cohorts: i.e., youngwomenwithAN, healthy latepostmenopausal controls, and healthy young women age-matchedwith the AN patients. In AN, bone mineral density and bone compactathickness are lower than in controls but still higher than in post-menopause. Bone compacta density in AN is similar as in controls. How-ever, bone inner structure in AN is degraded to a similar extent as inpostmenopause.
The most alarming finding of this study is the high degree of alter-ation of the trabecular bone in AN, similar to the degree of alterationin postmenopausal women. Indeed, the values of the parameter TbNlead to the assumption that a similar process of dissolution of wholetrabecules might happen already in young patients with AN. These re-sults therefore suggest insidious consequences of AN on the intimatecancellous bone structure, whereas its cortical area, at least in its densityappears hardly affected.
UNTable 2
Comparison between patients with anorexia nervosa, postmenopausal women and young hea
Parameter Anorexia nervosa (AN)(n = 36)
Post-menopausal (PM)(n = 83)
Contro(n = 3
D100 [gHA/cm3] 358 ± 66 283 ± 65 399Dcomp [gHA/cm3] 888.7 ± 13.3 784.5 ± 10.7 908.1C.Th [mm] 0.92 ± 0.17 0.72 ± 0.18 1.04Dtrab [gHA/cm3] 172.06 ± 42.79 134.92 ± 48.33 197.63Dmeta [gHA/cm3] 216.42 ± 41.66 174.49 ± 42.52 241.20BV/TV [%] 14.39 ± 3.52 11.24 ± 4.02 16.60Tb.N [1/mm] 1.57 ± 0.06 1.57 ± 0.10 1.66Tb.Th [mm] 0.09 ± 0.02 0.07 ± 0.02 0.10Tb.Sp [mm] 0.55 ± 0.04 0.57 ± 0.06 0.50
n.s.: not significant.⁎ p b 0.05.⁎⁎ p b 0.01.⁎⁎⁎ p b 0.001.
Please cite this article as: Milos G, et al, Are patterns of bone loss in anorexresolution peripheral computed tomography, Bone (2013), http://dx.doi.o
ED P
RO
O
The integral bone density (cortical and trabecular) of the ultradistalradius was also markedly (D100 only moderately) affected in AN pa-tients compared to young controls, thus confirming that AN patientslose bone mass significantly, a well-known fact reported by severalstudies over almost three decades [15, 16–18]. Interestingly, we foundno significant difference in bone density of the cortical part of theultradistal radius (Dcomp) and no significant difference in trabecularthickness (TbTh) between anorexic and healthy young women. Inyoung AN patients, the cortical bone density is only marginally affectedcompared to age matched controls, as already shown in our previouswork [7].
To date, trabecular microarchitecture in women with AN has beenscarcely investigated and normative data – to our knowledge – arestill nonexistent, also due to different technologies and assessmentmethods used. Indeed, whereas for instance one study using the sameapparatus as the present study reports TbTh values for AN patientsand controls similar to ours [19], another study using a Siemens fpVCTprototype and MicroView™ software provides values in a differentrange and moderate although significant differences between AN pa-tients and controls [20].
The very highly significant differences between young patients withAN and healthy late postmenopausal patients in the subcortical boneand trabecular area seem to indicate the influence of bone degradationdue to aging. Some studies reported that bone loss characteristics of ANare more severe than the commonly seen post-menopausally-inducedbone loss (e.g. [21]). The present study cannot fully support this state-ment while permitting a direct and more differentiated comparison ofbone microarchitecture among three key groups: in young AN patientsthe cortical bone is only marginally affected in comparison to that ofhealthy young controls, whereas the degradation of the trabecular
lthy women, adjusted for height (mean ± SD). Statistical analysis.
l group (Controls)0)
p: AN vs. Controls p: AN vs. PM p: Controls vs. PM
± 58 0.010 ⁎ b0.001 ⁎⁎⁎ b0.001 ⁎⁎⁎
± 12.5 0.408 n.s. b0.001 ⁎⁎⁎ b0.001 ⁎⁎⁎
± .16 0.008 ⁎⁎ b0.001 ⁎⁎⁎ b0.001 ⁎⁎⁎
± 45.01 0.030 ⁎ 0.001 ⁎⁎ b0.001 ⁎⁎⁎
± 41.47 0.021 ⁎ b0.001 ⁎⁎⁎ b0.001 ⁎⁎⁎
± 3.70 0.024 ⁎ 0.001 ⁎⁎ b0.001 ⁎⁎⁎
± 0.07 b0.001 ⁎⁎⁎ 0.512 n.s. b0.001 ⁎⁎⁎
± 0.02 0.167 n.s. b0.001 ⁎⁎⁎ b0.001 ⁎⁎⁎
± 0.04 0.001 ⁎⁎ 0.165 n.s. b0.001 ⁎⁎⁎
ic and postmenopausal women similar? Preliminary results using highrg/10.1016/j.bone.2013.09.016
RECTED P
RO
OF
262
263
264
265
266
267
268
269
270
271
272
273
274
275
276
277
278
279
280
281
282
283
284
285
286
287
288
289
290
291
292
293
294
295
296
297
298
299
300
301
302
303
D10
0
600.00
500.00
400.00
300.00
200.00
100.00
31
36
25
ControlsPMAN
**** ***
ControlsPMAN
Dtr
ab
300.00
250.00
200.00
150.00
100.00
50.00
0.00
59
*** ***
ControlsPMAN
Tb
.N
1.80
1.70
1.60
1.50
1.40
1.30
1.20
59
7288
******
ControlsPMAN
Dm
eta
350.00
300.00
250.00
200.00
150.00
100.00
50.00
59
*** ***
ControlsPMAN
Tb
.Th
0.125
0.10
0.075
0.05
0.025
0.00
59
*** ***
ControlsPMAN
Dco
mp
1100.00
1000.00
900.00
800.00
700.00
600.00
500.00
25
*** ***
ControlsPMAN
BV
/TV
25.00
20.00
15.00
10.00
5.00
0.00
59
*** ***
ControlsPMAN
C.T
h
1.25
1.00
0.75
0.50
0.25
25
*** ****
ControlsPMAN
Tb
.Sp
0.80
0.70
0.60
0.50
0.40
59
8872
*****
* * *
Fig. 1. Comparison between patients with anorexia nervosa, postmenopausal women and young healthy women. Box plots and significances. *: p b 0.05. **. p b 0.01. ***: p b 0.001.
4 G. Milos et al. / Bone xxx (2013) xxx–xxx
UNCO
R
bone is comparable to that occurring in healthy late postmenopausalwomen.
The present study is to our knowledge the first one using cutting-edge technology to compare bone microarchitecture across differentconditions. Furthermore, the use of local cohorts increases the sig-nificance of the results, because it minimizes bias due to differentenvironments, ethnicities and cultural and socioeconomic situations.Furthermore, as partially pointed out in our former study, the threegroups appeared to be relatively homogeneous regarding bone param-eters. Indeed, no differences were found between patients with restric-tive AN and binge-purge AN, nor within the postmenopausal groupalong age (data not shown in the results).
This is a cross-sectional study and indeed no statements regardingcausality or time-course are possible. These findings suggest that themicrostructural bone damage in young AN patients is a complex multi-factorial process of nutritional deficiencies and alterations along multi-ple neuroendocrine axes [22]. However, we found no difference inbone density and architecture parameters in young women using hor-monal contraceptives vs. those without, whereas postmenopausalwomenwere not on sexual hormone replacement. Nevertheless, no fur-ther data on endocrinological, nutritional and body composition param-eters were collected, which is indeed a limitation of this study. Thus,
Please cite this article as: Milos G, et al, Are patterns of bone loss in anorexresolution peripheral computed tomography, Bone (2013), http://dx.doi.o
future studies should also examine endocrinological parameters impli-cated in bone metabolism.
It must be noted that in this study only theHR-pQCT technologywasused and that the three cohorts, above all the otherwise healthy latepostmenopausal women, were not characterized by the gold standarddual-energy X-ray absorptiometry (DXA) and the question whetherthis group is representative for late postmenopausal women cannot befully answered. On the other hand, DXA technology does not distinguishbetween cortical and trabecular compartments, whereas HR-pQCT isan appropriate and valid method that assesses bone microstructure[23,24]. A further limitation of this study is that current or lifetime eat-ing disorders were assessed in the young controls but not in postmeno-pausalwomen. This should not affect our results because the prevalenceof anorexia nervosa in the general population is low, and even a hypo-thetical presence of a few postmenopausal subjects with a history ofAN would very likely not change the results.
Conclusion
Postmenopausal women with no history of pathologies affectingbone metabolism and young AN patients lose bone in differentlife phases and through different pathophysiological mechanisms. A
ic and postmenopausal women similar? Preliminary results using highrg/10.1016/j.bone.2013.09.016
304
305
306
307
308
309
310
311
312
313
314
315
316
317
318
319320321322323324325326Q5327328329330Q6331332333334335
336337338339340341342343344345346347348349
381
5G. Milos et al. / Bone xxx (2013) xxx–xxx
comparison of bone microarchitectures among controls, AN and post-menopausal subjects can yield new insights into bone loss etiology andseverity. By using HR-pQCT technology, it was possible to observe thatthe trabecular number is rapidly affected in AN, and that – alarmingly –
the degree of the alterations of this bone compartment is comparablewith the situation in postmenopausal women. On the contrary, thecortical and subcortical bones of patients with AN were less severelycompromised in comparison with healthy postmenopausal women.This data underlines the potentially insidious effects of AN on bone inyoung patients. Prospective studies should clarify the mechanism andthe reversibility of these processes on the bone intimate structure.
350351352353354355356357
Acknowledgments
This researchwas sponsored by an educational grant of Merck Sharp& Dohme-Chibret AG Switzerland.
358359360361362363364365366367368369370371372373374375376377378379
References
[1] Misra M, Klibanski A. The neuroendocrine basis of anorexia nervosa and its impacton bone metabolism. Neuroendocrinology 2011;93:65–73.
[2] Hudson JI, Hiripi E, Pope Jr HG, Kessler RC. The prevalence and correlates of eatingdisorders in the national comorbidity survey replication. Biol Psychiatry 2007;61:348–58.
[3] Preti A, Girolamo GD, Vilagut G, Alonso J, Graaf RD, Bruffaerts R, et al. The epidemi-ology of eating disorders in six European countries: results of the ESEMeD-WMHproject. J Psychiatr Res 2009.
[4] Misra M, Aggarwal A, Miller KK, Almazan C, Worley M, Soyka LA, et al. Effects of an-orexia nervosa on clinical, hematologic, biochemical, and bone density parametersin community-dwelling adolescent girls. Pediatrics 2004;114:1574–83.
[5] American, Psychiatric, Association. Diagnostic and Statistical Manual of Mental Dis-orders TR. 4th Text Revision ed. Washington, DC: American Psychiatric Association;2000.
[6] Boutroy S, Bouxsein ML, Munoz F, Delmas PD. In vivo assessment of trabecular bonemicroarchitecture by high-resolution peripheral quantitative computed tomogra-phy. J Clin Endocrinol Metab 2005;90:6508–15.
UNCO
RRECT 380
Please cite this article as: Milos G, et al, Are patterns of bone loss in anorexresolution peripheral computed tomography, Bone (2013), http://dx.doi.o
ED P
RO
OF
[7] Milos G, Spindler A, Ruegsegger P, Seifert B, Muhlebach S, Uebelhart D, et al. Corticaland trabecular bone density and structure in anorexia nervosa. Osteoporos Int2005;16:783–90.
[8] Milos G, Spindler A, Ruegsegger P, Hasler G, Schnyder U, Laib A, et al. Does weightgain induce cortical and trabecular bone regain in anorexia nervosa? A two-yearprospective study. Bone 2007;41:869–74.
[9] Misra M, Klibanski A. Bone metabolism in adolescents with anorexia nervosa.J Endocrinol Invest 2011;34:324–32.
[10] Laib A, Hildebrand T, Hauselmann HJ, Ruegsegger P. Ridge number density: a newparameter for in vivo bone structure analysis. Bone 1997;21:541–6.
[11] Laib A, Hauselmann HJ, Ruegsegger P. In vivo high resolution 3D-QCT of the humanforearm. Technol Health Care 1998;6:329–37.
[12] Sornay-Rendu E, Boutroy S, Munoz F, Delmas PD. Alterations of cortical and trabec-ular architecture are associated with fractures in postmenopausal women, partiallyindependent of decreased BMD measured by DXA: the OFELY study. J Bone MinerRes 2007;22:425–33.
[13] Harslof T, Husted LB, Nyegaard M, Carstens M, Stenkjaer L, Brixen K, et al. Polymor-phisms in the ALOX12 gene and osteoporosis. Osteoporos Int 2011;22:2249–59.
[14] Holroyd C, Harvey N, Dennison E, Cooper C. Epigenetic influences in the develop-mental origins of osteoporosis. Osteoporos Int 2012;23:401–10.
[15] Rigotti NA, Nussbaum SR, Herzog DB, Neer RM. Osteoporosis inwomenwith anorex-ia nervosa. N Engl J Med 1984;311:1601–6.
[16] Baker D, Roberts R, Towell T. Factors predictive of bone mineral density in eating-disordered women: a longitudinal study. Int J Eat Disord 2000;27:29–35.
[17] Grinspoon S, Thomas E, Pitts S, Gross E, Mickley D,Miller K, et al. Prevalence and pre-dictive factors for regional osteopenia in women with anorexia nervosa. Ann InternMed 2000;133:790–4.
[18] Mehler PS. Osteoporosis in anorexia nervosa: prevention and treatment. Int J EatDisord 2003;33:113–26.
[19] Galusca B, Zouch M, Germain N, Bossu C, Frere D, Lang F, et al. Constitutional thin-ness: unusual human phenotype of low bone quality. J Clin Endocrinol Metab2008;93:110–7.
[20] Lawson EA, Miller KK, Bredella MA, Phan C, Misra M, Meenaghan E, et al. Hormonepredictors of abnormal bone microarchitecture in women with anorexia nervosa.Bone 2010;46:458–63.
[21] Mehler PS, Cleary BS, Gaudiani JL. Osteoporosis in anorexia nervosa. Eat Disord2011;19:194–202.
[22] Misra M, Klibanski A. Bone health in anorexia nervosa. Curr Opin Endocrinol Diabe-tes Obes 2011;18:376–82.
[23] Seeman E. Bone quality: the material and structural basis of bone strength. J BoneMiner Metab 2008;26:1–8.
[24] Liu XS, Shane E, McMahon DJ, Guo XE. Individual trabecula segmentation (ITS)-based morphological analysis of microscale images of human tibial trabecularbone at limited spatial resolution. J Bone Miner Res 2011;26:2184–93.
ic and postmenopausal women similar? Preliminary results using highrg/10.1016/j.bone.2013.09.016