are long-term trends in bewick’s swan cygnus columbianus ... · size are currently unknown, and...
TRANSCRIPT

Bird Conservation International (2019) 29:479–496. © BirdLife International, 2018doi:10.1017/S0959270918000382
Are long-term trends in Bewick’s Swan Cygnus columbianus bewickii numbers driven by changes in winter food resources?KEVIN A. WOOD , JULIA L. NEWTH, KANE BRIDES, MIKE BURDEKIN, ANNE L. HARRISON, STEVE HEAVEN, CHARLIE KITCHIN, LEIGH MARSHALL, CARL MITCHELL, JESSICA PONTING, DAFILA K. SCOTT, JON SMITH, WIM TIJSEN, GEOFF M. HILTON and EILEEN C. REES
Summary
The north-west European population of Bewick’s Swan Cygnus columbianus bewickii declined by 38% between 1995 and 2010 and is listed as ‘Endangered’ on the European Red List of birds. Here, we combined information on food resources within the landscape with long-term data on swan numbers, habitat use, behaviour and two complementary measures of body condition, to examine whether changes in food type and availability have influenced the Bewick’s Swan’s use of their main wintering site in the UK, the Ouse Washes and surrounding fens. Maximum number of Bewick’s Swans rose from 620 in winter 1958/59 to a high of 7,491 in winter 2004/05, before fall-ing to 1,073 birds in winter 2013/14. Between winters 1958/59 and 2014/15 the Ouse Washes supported between 0.5 and 37.9 % of the total population wintering in north-west Europe (mean ± 95 % CI = 18.1 ± 2.4 %). Swans fed on agricultural crops, shifting from post-harvest remains of root crops (e.g. sugar beet and potatoes) in November and December to winter-sown cereals (e.g. wheat) in January and February. Inter-annual variation in the area cultivated for these crops did not result in changes in the peak numbers of swans occurring on the Ouse Washes. Behavioural and body condition data indicated that food supplies on the Ouse Washes and surrounding fens remain adequate to allow the birds to gain and maintain good body condition throughout winter with no increase in foraging effort. Our findings suggest that the recent decline in numbers of Bewick’s Swans at this internationally important site was not linked to inadequate food resources.
Introduction
Maintaining adequate food resources for bird species is a key aim of avian conservation globally (Newton 1980, Davis et al. 2014). Changes in land management can alter the availability of food within the landscape, which can have negative individual- and population-level effects on the birds that use these resources (Burton et al. 2006, Amat and Green 2010). The loss of food resources can reduce survival through poor body condition or starvation-induced mortality (Meek 1993, Sherry et al. 2005, Stillman et al. 2015). Additionally, where migratory birds rely on food resources on the winter grounds to build up adequate body condition to migrate and breed successfully, loss of winter body condition can result in reduced reproductive success (Inger et al. 2010). Where populations decline due to declining food resources, individuals ought to show measurable behavioural and bioenergetic responses, such as increased foraging effort or reduced body condition (Hoare et al. 2006). Similarly, where food resources decline in quantity, quality, or both, animals spend more time locating food and also forage more intensively to maintain their

K. A. Wood et al. 480
required intake of energy and nutrients, at the expense of other behavioural activities such as resting (Owen et al. 1992).
Mid-winter censuses of the north-west European wintering population of the Bewick’s Swan Cygnus columbianus bewickii revealed an increase from 16,283 individuals in 1984 to a peak of 29,277 in 1995, before a subsequent decline of 38% to 18,057 individuals in 2010 (Rees and Beekman 2010, Nagy et al. 2012). The population is listed in Annex I of the European Union Birds Directive (2009/147/EC) and was recently classified as ‘Endangered’ on the European Red List of bird species (BirdLife International 2015). An international action plan (the Bewick’s Swan Single Species Action Plan: BSSAP) was developed by the African-Eurasian Waterbird Agreement (Nagy et al. 2012). Wood et al. (2018a) showed that survival rates of both adults and first year individuals (hereafter ‘cygnets’) had varied in line with changes in population size. An earlier study of long-term trends in Bewick’s Swan breeding success found no significant change between the 1960s and 2010s, either in the percentage of juve-niles within the population each year or in the mean brood sizes recorded for swans winter-ing in the UK (Wood et al. 2016). Therefore, changes in survival rather than productivity are believed to have had the greatest influence on the observed changes in population size. However, the underlying reasons for the recent reductions in both survival and population size are currently unknown, and the BSSAP calls for researchers to assess whether subopti-mal feeding conditions at stop-over and wintering sites are influencing demographic rates, thus contributing to the decline (Nagy et al. 2012).
In this study, we examined whether changes in food resources have influenced the Bewick’s Swans’ use of the Ouse Washes in eastern England, an internationally important wintering site (Nagy et al. 2012). Cereal and root crops in fields around the Ouse Washes have been the main source of food for overwintering swans since the 1970s (Rees 2006); yet recent decades have seen changes in the relative abundance of key crop types and greater anthropogenic disturbance in such agricultural landscapes (Newton 2013). We analysed long-term monitoring data on swan numbers, habitat use, behaviour and two complementary measures of body condition, in relation to information on food resources within the landscape, to answer five questions related to swans and their food supply. If changes in food resources have driven changes in swan population size in north-west Europe and their use of key wintering sites, then we would expect to detect a decline in the peak numbers of swans supported by the Ouse Washes as food resources decline, as birds either died or moved elsewhere. We therefore first tested whether annual changes in peak Bewick’s Swan counts were related to changes in the area of the key agricultural crops. Second, we tested whether swan habitat use had changed over time. Third, if food supplies have become limiting we would expect to detect a decline in body condition, so we investigated whether the birds’ body condition changed before and after the period of population decline. Next, to determine whether the swans were able to gain and maintain body condition over winter, we also examined temporal patterns in the swans’ body condition within recent winters. Finally, if access to adequate winter food resources had been reduced, either through lower food supplies or increased disturbance, we would expect increases in the proportions of birds foraging or alert, with a lower proportion rest-ing. Behavioural data therefore were analysed to determine whether there had been significant changes in swan activity patterns.
Methods
Study system
The Ouse Washes (52°27′36″N, 0°11′24″E) is a strip of predominantly grazing pasture approxi-mately 32 km long and up to 1 km wide, situated within the English counties of Norfolk and Cambridgeshire, that is flooded by water from the River Great Ouse during winter. The site is surrounded by an area of fenlands, a mosaic of reclaimed agricultural land intersected by drainage ditches. The Ouse Washes and surrounding fens comprise a key wintering area for Bewick’s

Bewick’s Swans and food resources 481
Swans (Rees and Beekman 2010). The swans typically arrive in October/November and depart during February/March (Rees 2006). A range of crops are grown within the fens that are available to swans during winter: sugar beet Beta vulgaris, potatoes Solanum tuberosum, maize Zea mays, and some cereal crops (e.g. barley Hordeum vulgare) are sown in spring for harvest in autumn and early winter, and unharvested remnants are eaten by swans (Rees 2006). Many of these fields are subsequently re-sown with wheat Triticum aestivum or oilseed rape Brassica napus during early winter, which are both important food resources for swans (Rees 2006). Some pasture fields are also maintained, in particular on the Washes itself.
Swan counts
Co-ordinated dawn counts of Bewick’s Swans roosting on the Ouse Washes have been carried out by the Wildfowl & Wetlands Trust and the Royal Society for the Protection of Birds at least monthly during winter, from winter 1958/59 onwards, as part of the national Wetland Bird Survey (WeBS) programme and its predecessor schemes. WeBS methodology has been described extensively elsewhere (e.g. Frost et al. 2017), so only the most salient points are presented here. We selected the peak September–March count for each winter as our estimate of the peak number of swans wintering on the Ouse Washes and surrounding fens. The annual rate of change in peak numbers between years t and t+1 (δswan) was calculated as:
t+ tN /N ,swan
δ =1
where Nt+1 and Nt were the peak counts in years t+1 and t, respectively. As a minority of swans may roost on small waterbodies outside of the surveyed sites (van Gils and Tijsen 2007) we checked that the roost counts did not underestimate the numbers of birds using the study area by comparing roost counts with peak counts available from supplementary surveys of Bewick’s Swans feeding in fields within the study area between winters 1977/78 and 2016/17. Roost and field counts were significantly positively correlated (r = 0.892, df = 38, P < 0.001); the roost counts had a mean (± SE) difference of 374 (± 114) individuals greater than field counts, indicating close agreement.
Additionally, we determined the percentage of the total north-west European population pre-sent on the Ouse Washes each winter from co-ordinated international counts of the species made across its winter range, either through the International Waterbird Censuses (IWCs) coordinated by Wetlands International or through the International Swan Censuses (ISCs) undertaken at 5-year intervals by the Wetlands International/IUCN-SSC Swan Specialist Group from the mid-1980s onwards. These total population counts were available for January 1958, 1972, 1976, 1979, 1984, 1986, 1990, 1995, 2000, 2005, 2010, and 2015 (Rees and Beekman 2010, Nagy et al. 2012, Wetlands International/IUCN-SSC Swan Specialist Group unpubl. data), with linear interpola-tion used to estimate the population size in all other years.
Food resource use
In addition to the dawn counts undertaken for WeBS, co-ordinated surveys of the areas of Washes and surrounding fens used by swans were undertaken during daylight hours within the study area (Figure 1) at monthly intervals from October to March (inclusive) between winters 1976/77 and 2016/2017, to determine swan numbers and feeding habitat (Ponting 2014). On encountering swans during the surveys, their location, total number of individuals present, and crop type were recorded. Crops were grouped into the following categories: autumn/winter-sown cereals (e.g. wheat), cereal stubbles (e.g. the post-harvest remains of spring-sown cereals, e.g. barley), post-harvest remains of non-cereal crops (mostly root crops such as sugar beet and potatoes, but also some maize), Brassica crops (mainly oilseed rape, but also some kale Brassica oleracea), and pasture.
We obtained data on the total area under cultivation within the counties of Cambridgeshire and Norfolk (i.e. the counties in which the Ouse Washes and surrounding fens are located) for the six

K. A. Wood et al. 482
key crop types used by the swans: sugar beet, potatoes, wheat, oilseed rape, maize, and pasture (Department for Environment, Food & Rural Affairs 2017). Data were available for 1955, 1965, 1975, 1985, 1995, 2000, 2005, 2009, 2010, 2013, and 2016, with linear interpolation used to esti-mate total area in years between surveys. The annual rate of change in the area under cultivation for crop x between years t and t+1 (δx) was calculated as:
x t+ tC /C ,δ =1
where Ct+1 and Ct were the crop areas (ha) in years t+1 and t, respectively.
Swan biometrics
Biometrics were measured for 205 swans caught within the study area between 1980 and 2016 (182 unique individuals and 23 recaptures of previously caught individuals). On each capture, skull length was measured with a sliding calliper (± 1.0 mm) and body mass was measured (± 0.1 kg) on a spring balance, after Evans and Kear (1978). Sex was determined by cloacal examination, whilst the age class was determined by the presence or absence of grey plumage, indicative of cygnets or adults, respectively (Rees 2006).
Inter-annual trends in swan body condition
To estimate individual body condition we corrected body mass for skeletal size using the Scaled Mass Index (SMI; Peig and Green 2009). Ln-transformed skull length was regressed against
Figure 1. A map of the Ouse Washes and surrounding fens, indicating the main area of current and historic roosting between WWT Welney and RSPB Ouse Washes. Open circles within the black polygon indicate observations of flocks of feeding swans. Solid circles outside the polygon represent observations outside of the study area and so were excluded from the analyses.
Bewick’s Swans and food resources 483
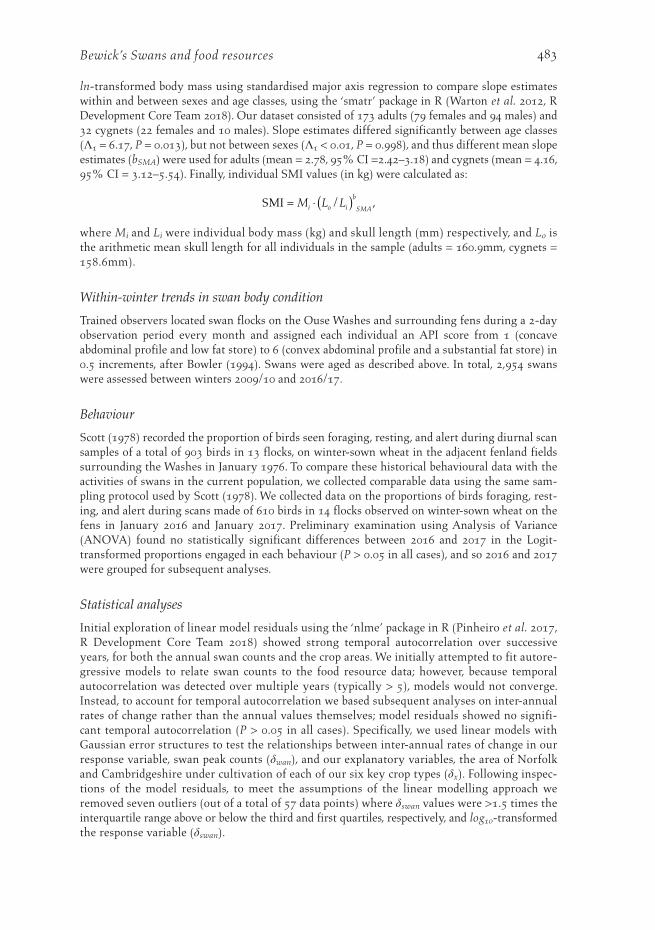
ln-transformed body mass using standardised major axis regression to compare slope estimates within and between sexes and age classes, using the ‘smatr’ package in R (Warton et al. 2012, R Development Core Team 2018). Our dataset consisted of 173 adults (79 females and 94 males) and 32 cygnets (22 females and 10 males). Slope estimates differed significantly between age classes (Λ1 = 6.17, P = 0.013), but not between sexes (Λ1 < 0.01, P = 0.998), and thus different mean slope estimates (bSMA) were used for adults (mean = 2.78, 95% CI =2.42–3.18) and cygnets (mean = 4.16, 95% CI = 3.12–5.54). Finally, individual SMI values (in kg) were calculated as:
( )⋅SMI = / ,b
i o i SMAM L L
where Mi and Li were individual body mass (kg) and skull length (mm) respectively, and Lo is the arithmetic mean skull length for all individuals in the sample (adults = 160.9mm, cygnets = 158.6mm).
Within-winter trends in swan body condition
Trained observers located swan flocks on the Ouse Washes and surrounding fens during a 2-day observation period every month and assigned each individual an API score from 1 (concave abdominal profile and low fat store) to 6 (convex abdominal profile and a substantial fat store) in 0.5 increments, after Bowler (1994). Swans were aged as described above. In total, 2,954 swans were assessed between winters 2009/10 and 2016/17.
Behaviour
Scott (1978) recorded the proportion of birds seen foraging, resting, and alert during diurnal scan samples of a total of 903 birds in 13 flocks, on winter-sown wheat in the adjacent fenland fields surrounding the Washes in January 1976. To compare these historical behavioural data with the activities of swans in the current population, we collected comparable data using the same sam-pling protocol used by Scott (1978). We collected data on the proportions of birds foraging, rest-ing, and alert during scans made of 610 birds in 14 flocks observed on winter-sown wheat on the fens in January 2016 and January 2017. Preliminary examination using Analysis of Variance (ANOVA) found no statistically significant differences between 2016 and 2017 in the Logit-transformed proportions engaged in each behaviour (P > 0.05 in all cases), and so 2016 and 2017 were grouped for subsequent analyses.
Statistical analyses
Initial exploration of linear model residuals using the ‘nlme’ package in R (Pinheiro et al. 2017, R Development Core Team 2018) showed strong temporal autocorrelation over successive years, for both the annual swan counts and the crop areas. We initially attempted to fit autore-gressive models to relate swan counts to the food resource data; however, because temporal autocorrelation was detected over multiple years (typically > 5), models would not converge. Instead, to account for temporal autocorrelation we based subsequent analyses on inter-annual rates of change rather than the annual values themselves; model residuals showed no signifi-cant temporal autocorrelation (P > 0.05 in all cases). Specifically, we used linear models with Gaussian error structures to test the relationships between inter-annual rates of change in our response variable, swan peak counts (δwan), and our explanatory variables, the area of Norfolk and Cambridgeshire under cultivation of each of our six key crop types (δx). Following inspec-tions of the model residuals, to meet the assumptions of the linear modelling approach we removed seven outliers (out of a total of 57 data points) where δswan values were >1.5 times the interquartile range above or below the third and first quartiles, respectively, and log10-transformed the response variable (δswan).

K. A. Wood et al. 484
To assess temporal trends in swan habitat use, both within and between winters, we used linear models with Gaussian error structures to test the relationships between the Logit-transformed proportions of swans observed on crop types and (i) linear effect of winter and (ii) ordinal month of observation. As the proportions of swans observed on pasture, Brassica, and cereal stubbles in most surveys was 0, we restricted this analysis to (i) winter-sown cereals and (ii) post-harvest waste crops, only.
We fitted linear mixed effects models with Gaussian error structures using the ‘MuMIn’ and ‘lme4’ packages in R (Barton 2012, Bates et al. 2015) to test the additive and two-way interac-tive effects of the following variables on log10-transformed SMI values: A = age class, S = sex, WL = linear effect of winter. Individual swan identity (based on unique rings fitted on capture) was included as a random categorical effect to account for non-independence of data points from the same individual swan. The candidate model with the lowest second-order Akaike’s Information Criteria (AICc) value was judged to be our best-supported model, while any model with an AICc value of within 6.0 of the lowest AICc was also considered to have received sub-stantial support in the data (Richards et al. 2011). However, models with one additional param-eter were judged to be competitive only if their AICc value was lower than the simpler model (Richards et al. 2011). The marginal R2 (R2
GLMM(m)) and the conditional R2 (R2GLMM(c)) indicated
the proportions of variance in SMI explained by the fixed factors alone, and by both the fixed and random factors, respectively (Nakagawa and Schielzeth 2013).
We fitted cumulative link models of our ordinal API scores using the ordinal package in R (Christensen et al. 2018) to test the additive effects of the following variables on API scores: A = age class, WL = linear effect of winter, WC = categorical effect of winter, MO = ordinal effect of month, MC = categorical effect of month, and IO = observer identity. Both winter and month were examined as linear and categorical variables to test for linear and non-linear trends in body condition over time. Given the potential for collinearity between the categorical and continuous winter variables, between the categorical and ordinal month variables, and between observer iden-tity and the winter variables, these collinear variables were not included within the same candi-date model. Model selection using AICc was conducted as above, while McFadden’s R2 was used to assess the proportion of the variance in API scores explained (McFadden 1973).
Finally, we used analysis of variance (ANOVA) to compare the Logit-transformed proportion of individuals in swan flocks that were (i) foraging, (ii) resting and (iii) alert, between 1976 and 2016/17.
Results
Changes in swan peak counts and food resources
Peak winter numbers of Bewick’s Swans on the Ouse Washes rose from 620 individuals in the first winter of observations (1958/59) to a maximum of 7,491 in winter 2004/05 (Figure 2a). Numbers dropped subsequently to reach a 41-year low of 1,073 birds in winter 2013/14 before partially recovering to 2,997 in winter 2016/17 (Figure 2a). The numbers recorded on the Ouse Washes represented a mean of 18.1% (± 95% CI = 2.4%) of the total population wintering in north-west Europe, ranging from 0.5% in winter 1960/61 to 37.9% in winter 1984/85 (Figure 2a).
Of the main food resources used by the swans, winter-sown wheat and pasture had the largest areas devoted to their cultivation within Norfolk and Cambridgeshire (Figure 2b). The total area put to all six crop types considered increased from 345,289 ha in winter 1958/59 to 432,763 ha in winter 2015/16. Crucially, we found no statistically significant relationships between the inter-annual rates of change in the area under cultivation of any of our six key crop types and the inter-annual changes in the peak counts of Bewick’s Swans between winters 1978/79 and 2015/16 (Table 1, Figure 3). Repeating these analyses with the outliers included did not alter our findings (P > 0.05 in all cases).

Bewick’s Swans and food resources 485
Swan habitat use
Winter-sown cereals and post-harvest waste crops were the main food resources used, accounting for mean (± 95% CI) proportions of 0.555 ± 0.085 and 0.424 ± 0.084 respectively of the observa-tions made from winters 1976/77 to 2015/16 (Figure 4a). The proportion of Bewick’s Swans recorded on Brassica crops (principally oilseed rape) was 0.009 ± 0.008 over the course of the study, whilst pasture and cereal stubbles were the least-used categories, comprising 0.007 ± 0.008 and 0.005 ± 0.009 of observed birds, respectively (Figure 4a).
We found significant between-month variation within winters, but not across years, in the proportion of swans using cereals (F2,105 = 21.22, P < 0.001, R2
adj = 27.4%) and post-harvest waste
Figure 2. The long-term trends in (a) the maximum number of Bewick’s Swans counted on the Ouse Washes (white circles), as well as the proportion of the total flyway wintering population found on the Ouse Washes (black circles); and (b) the area under cultivation in Norfolk and Cambridgeshire for each of six crops which may provide food resources for swans wintering in our study area.
K. A. Wood et al. 486
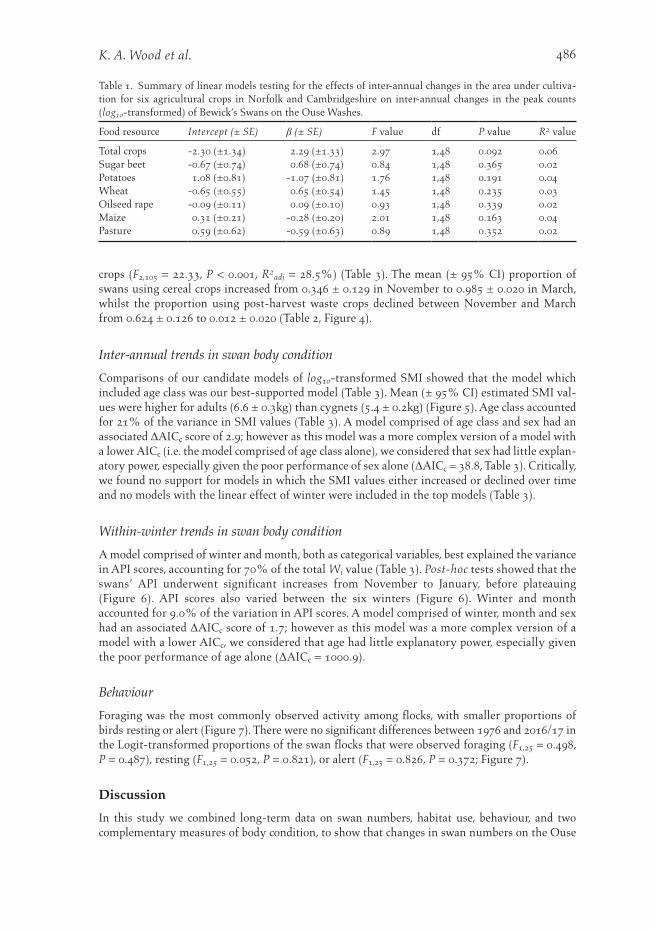
crops (F2,105 = 22.33, P < 0.001, R2adj = 28.5%) (Table 3). The mean (± 95% CI) proportion of
swans using cereal crops increased from 0.346 ± 0.129 in November to 0.985 ± 0.020 in March, whilst the proportion using post-harvest waste crops declined between November and March from 0.624 ± 0.126 to 0.012 ± 0.020 (Table 2, Figure 4).
Inter-annual trends in swan body condition
Comparisons of our candidate models of log10-transformed SMI showed that the model which included age class was our best-supported model (Table 3). Mean (± 95% CI) estimated SMI val-ues were higher for adults (6.6 ± 0.3kg) than cygnets (5.4 ± 0.2kg) (Figure 5). Age class accounted for 21% of the variance in SMI values (Table 3). A model comprised of age class and sex had an associated ΔAICc score of 2.9; however as this model was a more complex version of a model with a lower AICc (i.e. the model comprised of age class alone), we considered that sex had little explan-atory power, especially given the poor performance of sex alone (ΔAICc = 38.8, Table 3). Critically, we found no support for models in which the SMI values either increased or declined over time and no models with the linear effect of winter were included in the top models (Table 3).
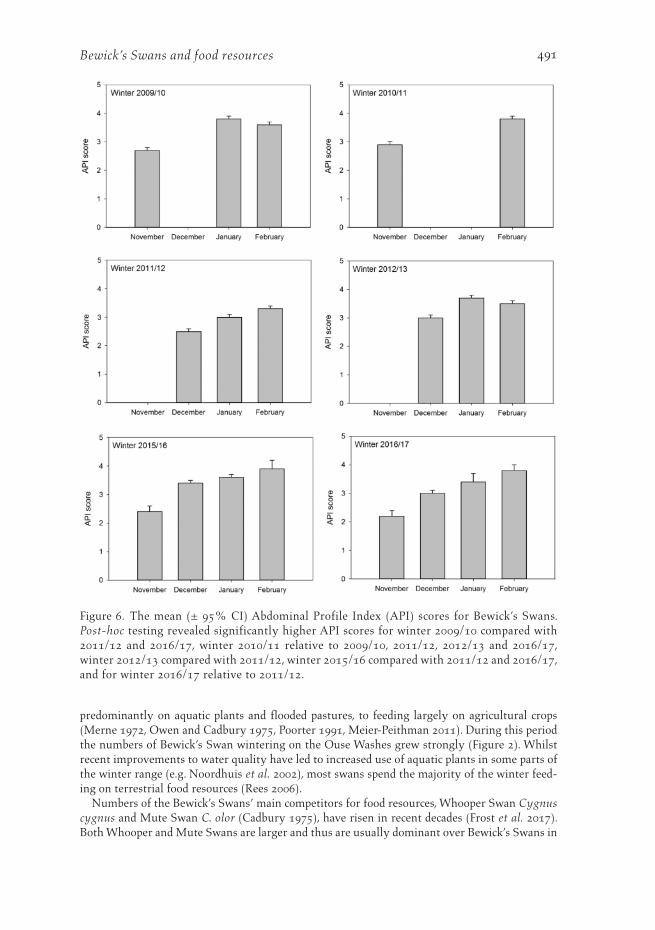
Within-winter trends in swan body condition
A model comprised of winter and month, both as categorical variables, best explained the variance in API scores, accounting for 70% of the total Wi value (Table 3). Post-hoc tests showed that the swans’ API underwent significant increases from November to January, before plateauing (Figure 6). API scores also varied between the six winters (Figure 6). Winter and month accounted for 9.0% of the variation in API scores. A model comprised of winter, month and sex had an associated ΔAICc score of 1.7; however as this model was a more complex version of a model with a lower AICc, we considered that age had little explanatory power, especially given the poor performance of age alone (ΔAICc = 1000.9).
Behaviour
Foraging was the most commonly observed activity among flocks, with smaller proportions of birds resting or alert (Figure 7). There were no significant differences between 1976 and 2016/17 in the Logit-transformed proportions of the swan flocks that were observed foraging (F1,25 = 0.498, P = 0.487), resting (F1,25 = 0.052, P = 0.821), or alert (F1,25 = 0.826, P = 0.372; Figure 7).
Discussion
In this study we combined long-term data on swan numbers, habitat use, behaviour, and two complementary measures of body condition, to show that changes in swan numbers on the Ouse
Table 1. Summary of linear models testing for the effects of inter-annual changes in the area under cultiva-tion for six agricultural crops in Norfolk and Cambridgeshire on inter-annual changes in the peak counts (log10-transformed) of Bewick’s Swans on the Ouse Washes.
Food resource Intercept (± SE) β (± SE) F value df P value R2 value
Total crops -2.30 (±1.34) 2.29 (±1.33) 2.97 1,48 0.092 0.06Sugar beet -0.67 (±0.74) 0.68 (±0.74) 0.84 1,48 0.365 0.02Potatoes 1.08 (±0.81) -1.07 (±0.81) 1.76 1,48 0.191 0.04Wheat -0.65 (±0.55) 0.65 (±0.54) 1.45 1,48 0.235 0.03Oilseed rape -0.09 (±0.11) 0.09 (±0.10) 0.93 1,48 0.339 0.02Maize 0.31 (±0.21) -0.28 (±0.20) 2.01 1,48 0.163 0.04Pasture 0.59 (±0.62) -0.59 (±0.63) 0.89 1,48 0.352 0.02

Bewick’s Swans and food resources 487
Figure 3. The relationships between the inter-annual rate of changes in (i) peak swan numbers on the Ouse Washes (δswan) and (ii) the total area in Norfolk and Cambridgeshire under cultivation for each of the key the crops (δx). Values of 1.0 represent no net change. None of the relationships were found to be statistically significant (Table 1).

K. A. Wood et al. 488
Washes and surrounding fens were not related to changes in food resources. Behavioural and body condition data indicated that food supplies on the Ouse Washes and surrounding fens remain adequate to allow the birds to gain and maintain good body condition throughout winter with no increase in foraging effort.
The onset of the decline in swan numbers at our study site after winter 2004/05 occurred a decade later than the observed decline after winter 1994/95 for the total overwintering population
Figure 4. The mean (± 95% CI) proportion of Bewick’s Swans observed in fields of each major food resource between winters 1976/77 and 2015/16.

Bewick’s Swans and food resources 489
in north-west Europe (Rees and Beekman 2010). Despite variation in the available amount of all key food resources in Norfolk and Cambridgeshire over the study period, there was no evidence that such trends were associated with changes in the numbers of swans observed. Thus we argue that, given the large area devoted to growing crops within the landscape and also the availability of different crop types across the winter, Bewick’s Swans wintering on the Ouse Washes and sur-rounding fens were not sensitive to observed fluctuations in food resources. Similarly, Tijsen and
Table 3. Summary of the 10 best-supported models (and null model) of log10-transformed Scaled Mass Index (SMI) and Abdominal Profile Index (API). Model support is indicated by a second-order Akaike’s information criterion (AICc), while ΔAICc represents the difference between the AICc values of that model and the model with the lowest AICc value. Model support was also indicated by the relative likelihood (RL, probability of that model being the best model compared with the model with the lowest AICc), Akaike weight (Wi, the ratio of ΔAICc values for each model relative to the whole set), and evidence ratio (ER, how many more times less likely to be the best-fitting model compared with the best-supported model shown by AICc). The best-supported model is indicated in bold. R2
GLMM(m), R2GLMM(c) and R2
McFadden indicate the marginal, conditional, and McFadden’s R2 values, respectively. k refers to the number of fitted fixed effect parameters: i = intercept, A = age class, S = sex, WL = linear effect of winter, WC = categorical effect of winter, MO = ordinal effect of month, MC = categorical effect of month, IO = observer identity.
Variable Model k AICc ΔAICc RL Wi ER R2GLMM(m) R2
GLMM(c) R2McFadden
SMI i+A 2 -602.3 0.0 1.00 0.81 1.0 0.208 0.699 -i+S+A 3 -599.4 2.9 0.23 0.19 4.3 0.239 0.707 -i+S·A 4 -591.6 10.7 0.00 0.00 214.4 0.238 0.709 -i+WL+A 3 -590.5 11.8 0.00 0.00 370.6 0.228 0.705 -i+WL+S·A 5 -578.7 23.6 0.00 0.00 1.3·105 0.253 0.714 -i+WL·A 4 -576.6 25.7 0.00 0.00 3.9·105 0.231 0.718 -i+WL·A+S 5 -572.2 30.1 0.00 0.00 3.4·106 0.255 0.721 -i+WL·S+A 5 -571.6 30.7 0.00 0.00 4.7·106 0.253 0.713 -i+S 2 -563.5 38.8 0.00 0.00 2.7·108 0.058 0.741 -i 1 -562.0 40.3 0.00 0.00 5.5·108 0.000 0.740 -i+WL 2 -551.5 50.8 0.00 0.00 1.1·1011 0.029 0.741 -
API i+WC+MC 11 10292.7 0.0 1.00 0.70 1.0 - - 0.090i+WC+MC+A 13 10294.4 1.7 0.43 0.30 2.3 - - 0.090i+IO+MC+A 13 10423.4 130.7 0.00 0.00 2.4·1028 - - 0.079i+IO+MC 12 10424.6 131.9 0.00 0.00 4.4·1028 - - 0.079i+WC+MO 8 10429.2 136.5 0.00 0.00 4.5·1029 - - 0.078i+WC+MO+A 9 10429.7 137.0 0.00 0.00 5.7·1029 - - 0.078i+IO+MO 8 10466.6 173.9 0.00 0.00 5.8·1037 - - 0.075i+MC+A 6 10656.9 364.3 0.00 0.00 1.3·1079 - - 0.057i+WL+MC+A 7 10658.8 366.1 0.00 0.00 3.2·1079 - - 0.057i+MC 5 10660.9 368.3 0.00 0.00 9.3·1079 - - 0.057i 1 11296.4 1003.7 0.00 0.00 9.0·10217 - - 0.000
Table 2. Summary of the effects of year and winter month on the proportion of swans counted (Logit-transformed) on each of the main food resources in the study area between winters 1976/77 and 2015/16. Statistically significant effects are indicated in bold.
Food resource Variable β SE t value P value
Cereals Intercept 45.27 30.45 1.49 0.140Year -0.02 0.02 -1.55 0.125Month 0.83 0.14 5.86 <0.001
Waste crops Intercept -46.04 29.38 -1.57 0.120Year 0.02 0.02 1.63 0.107Month -0.82 0.14 -5.99 <0.001

K. A. Wood et al. 490
Koffijberg (2015) found no evidence that declining Bewick’s Swan numbers at a key overwinter-ing site in the Netherlands were related to changes in food supplies. Our site-based study comple-ments earlier broader-scale findings that Bewick’s Swan survival rates were not influenced by the area or yield of sugar beet and winter-sown wheat in the Netherlands and the UK (Wood et al. 2018a).
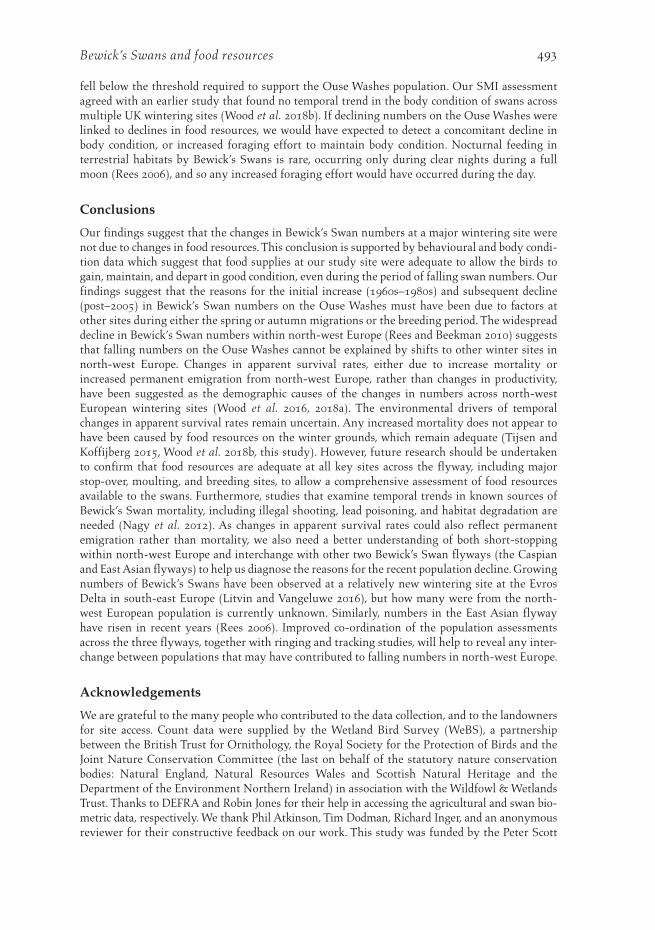
Bewick’s Swans are generalist herbivores that can feed on a wide range of terrestrial and aquatic plants (Owen and Kear 1972, Rees 2006), and our findings were in line with earlier studies which reported that the swans have fed primarily on winter-sown cereals (e.g. wheat) and unharvested remains of root crops (e.g. sugar beet and potatoes) at wintering sites in Europe since the 1970s (Dirksen et al. 1991, Laubek 1995, Rees et al. 1997, Wahl and Degen 2009). Between the late 1960s and early 1970s Bewick’s Swans wintering in north-west Europe switched from feeding
Figure 5. Individual scaled mass index (SMI) values for (a) adults and (b) cygnets caught on the Ouse Washes and surrounding fens between winters 1980/81 and 2014/15. The mean (± 95% CI) estimates from our best-supported model (Table 3) of adults and cygnets SMIs are represented by the solid and dashed lines, respectively.
Bewick’s Swans and food resources 491
predominantly on aquatic plants and flooded pastures, to feeding largely on agricultural crops (Merne 1972, Owen and Cadbury 1975, Poorter 1991, Meier-Peithman 2011). During this period the numbers of Bewick’s Swan wintering on the Ouse Washes grew strongly (Figure 2). Whilst recent improvements to water quality have led to increased use of aquatic plants in some parts of the winter range (e.g. Noordhuis et al. 2002), most swans spend the majority of the winter feed-ing on terrestrial food resources (Rees 2006).
Numbers of the Bewick’s Swans’ main competitors for food resources, Whooper Swan Cygnus cygnus and Mute Swan C. olor (Cadbury 1975), have risen in recent decades (Frost et al. 2017). Both Whooper and Mute Swans are larger and thus are usually dominant over Bewick’s Swans in
Figure 6. The mean (± 95% CI) Abdominal Profile Index (API) scores for Bewick’s Swans. Post-hoc testing revealed significantly higher API scores for winter 2009/10 compared with 2011/12 and 2016/17, winter 2010/11 relative to 2009/10, 2011/12, 2012/13 and 2016/17, winter 2012/13 compared with 2011/12, winter 2015/16 compared with 2011/12 and 2016/17, and for winter 2016/17 relative to 2011/12.

K. A. Wood et al. 492
behavioural interactions (Black and Rees 1984). Earlier analysis of temporal changes in distribu-tions found that Whooper Swans may be displacing Bewick’s Swans to feeding areas further from the central roost in our study system (Ponting 2014). However, our data showed that despite any such displacement, swans are still able to gain and maintain adequate body condition, with no observed increase in foraging effort. Further field study of the behavioural and energetic conse-quences of Bewick’s Swans feeding alone, and in mixed species flocks with Whooper and Mute Swans, would help us to understand the role that interference and depletion competition may have played in Bewick’s Swan overwinter ecology.
Our data on within-winter trends in API scores showed no evidence of a mid- or late-winter decline in body condition that could indicate food shortages, for example as has been demon-strated for some seed-eating farmland birds in north-west Europe (e.g. Siriwardena et al. 2008). As the stock of unharvested remains of root crops was depleted by foraging swans over the course of winter, the growth of wheat and oilseed rape presumably ensured that food abundance never
Figure 7. The mean (± 95% CI) proportion of Bewick’s Swan flocks observed (a) foraging, (b) resting, and (c) alert, in January 1976 and 2016/17.
Bewick’s Swans and food resources 493
fell below the threshold required to support the Ouse Washes population. Our SMI assessment agreed with an earlier study that found no temporal trend in the body condition of swans across multiple UK wintering sites (Wood et al. 2018b). If declining numbers on the Ouse Washes were linked to declines in food resources, we would have expected to detect a concomitant decline in body condition, or increased foraging effort to maintain body condition. Nocturnal feeding in terrestrial habitats by Bewick’s Swans is rare, occurring only during clear nights during a full moon (Rees 2006), and so any increased foraging effort would have occurred during the day.
Conclusions
Our findings suggest that the changes in Bewick’s Swan numbers at a major wintering site were not due to changes in food resources. This conclusion is supported by behavioural and body condi-tion data which suggest that food supplies at our study site were adequate to allow the birds to gain, maintain, and depart in good condition, even during the period of falling swan numbers. Our findings suggest that the reasons for the initial increase (1960s–1980s) and subsequent decline (post–2005) in Bewick’s Swan numbers on the Ouse Washes must have been due to factors at other sites during either the spring or autumn migrations or the breeding period. The widespread decline in Bewick’s Swan numbers within north-west Europe (Rees and Beekman 2010) suggests that falling numbers on the Ouse Washes cannot be explained by shifts to other winter sites in north-west Europe. Changes in apparent survival rates, either due to increase mortality or increased permanent emigration from north-west Europe, rather than changes in productivity, have been suggested as the demographic causes of the changes in numbers across north-west European wintering sites (Wood et al. 2016, 2018a). The environmental drivers of temporal changes in apparent survival rates remain uncertain. Any increased mortality does not appear to have been caused by food resources on the winter grounds, which remain adequate (Tijsen and Koffijberg 2015, Wood et al. 2018b, this study). However, future research should be undertaken to confirm that food resources are adequate at all key sites across the flyway, including major stop-over, moulting, and breeding sites, to allow a comprehensive assessment of food resources available to the swans. Furthermore, studies that examine temporal trends in known sources of Bewick’s Swan mortality, including illegal shooting, lead poisoning, and habitat degradation are needed (Nagy et al. 2012). As changes in apparent survival rates could also reflect permanent emigration rather than mortality, we also need a better understanding of both short-stopping within north-west Europe and interchange with other two Bewick’s Swan flyways (the Caspian and East Asian flyways) to help us diagnose the reasons for the recent population decline. Growing numbers of Bewick’s Swans have been observed at a relatively new wintering site at the Evros Delta in south-east Europe (Litvin and Vangeluwe 2016), but how many were from the north-west European population is currently unknown. Similarly, numbers in the East Asian flyway have risen in recent years (Rees 2006). Improved co-ordination of the population assessments across the three flyways, together with ringing and tracking studies, will help to reveal any inter-change between populations that may have contributed to falling numbers in north-west Europe.
Acknowledgements
We are grateful to the many people who contributed to the data collection, and to the landowners for site access. Count data were supplied by the Wetland Bird Survey (WeBS), a partnership between the British Trust for Ornithology, the Royal Society for the Protection of Birds and the Joint Nature Conservation Committee (the last on behalf of the statutory nature conservation bodies: Natural England, Natural Resources Wales and Scottish Natural Heritage and the Department of the Environment Northern Ireland) in association with the Wildfowl & Wetlands Trust. Thanks to DEFRA and Robin Jones for their help in accessing the agricultural and swan bio-metric data, respectively. We thank Phil Atkinson, Tim Dodman, Richard Inger, and an anonymous reviewer for their constructive feedback on our work. This study was funded by the Peter Scott
K. A. Wood et al. 494
Trust for Education and Research in Conservation, Peter Smith Charitable Trust for Nature, Olive Herbert Charitable Trust, D’Oyly Carte Charitable Trust, N. Smith Charitable Settlement, Robert Kiln Charitable Trust, the estate of the late Professor Geoffrey Matthews OBE, and all who sup-ported WWT’s “Hope for Swans” Appeal. Our co-author Jon Smith passed away before the com-pletion of this study; we would like to thank his wife Sarah for approving the final version on Jon’s behalf.
References
Amat, J. A. and Green, A. J. (2010) Waterbirds as bioindicators of environmental condi-tions. Pp. 45–52 in C. Hurford, M. Schneider and I. Cowx, eds. Conservation monitor-ing in freshwater habitats. Dordrecht, The Netherlands: Springer.
Barton, K. (2012) MuMIn: Model selection and model averaging based on informa-tion criteria. R package version 1.13.4. Accessible at https://CRAN.R-project.org/package=MuMIn.
Bates, D., Mächler, M., Bolker, B. M. and Walker, S. C. (2015) Fitting linear mixed-effects models using lme4. J. Stat. Software 67: 1–48. Accessible at https://CRAN.R-project.org/package=lme4.
BirdLife International (2015) European Red List of Birds. Luxembourg: Office for Official Publications of the European Communities.
Black, J. M. and Rees, E. C. (1984) The structure and behaviour of the Whooper Swan popu-lation wintering at Caerlaverock, Dumfries and Galloway, Scotland: an introductory study. Wildfowl 35: 21–36.
Bowler, J. M. (1994) The condition of Bewick’s Swans Cygnus columbianus bewickii in winter as assessed by their abdominal pro-files. Ardea 82: 241–248.
Burton, N. H., Rehfisch, M. M., Clark, N. A. and Dodd, S. G. (2006) Impacts of sudden winter habitat loss on the body condition and survival of redshank Tringa totanus. J. Appl. Ecol. 43: 464–473.
Cadbury, C. J. (1975) Populations of swans at the Ouse Washes, England. Wildfowl 26: 148–159.
Christensen, R. H. B. (2018) Package ‘ordi-nal’. R package version 2018.4-19. Accessible at https://CRAN.R-project.org/package= ordinal.
Davis, J. B., Guillemain, M., Kaminski, R. M., Arzel, C., Eadie, J. M. and Rees, E. C. (2014) Habitat and resource use by waterfowl in
the northern hemisphere in autumn and winter. Wildfowl Special Issue No. 4: 17–69.
Department for Environment, Food and Rural Affairs (2017) Statistical data set: Structure of the agricultural industry in England and the UK at June. London, UK: Department for Environment, Food and Rural Affairs. https://www.gov.uk/government/statistical- data-sets/structure-of-the-agricultural-industry-in-england-and-the-uk-at-june
Dirksen, S., Beekman, J. H. and Slagboom, T. H. (1991) Bewick’s Swans Cygnus columbi-anus bewickii in the Netherlands: numbers, distribution and food choice during the wintering season. Wildfowl Supplement No. 1: 228–237.
Evans, M. E. and Kear, J. (1978) Weights and measurements of Bewick’s Swans during winter. Wildfowl 29: 118–122.
Frost, T. M., Austin, G. E., Calbrade, N. A., Mellan, H. J., Hearn, R. D., Stroud, D. A., Wotton, S. R. and Balmer, D. E. (2017) Waterbirds in the UK 2015/16: The Wetland Bird Survey. Thetford, UK: British Trust for Ornithology, the Royal Society for the Protection of Birds and the Joint Nature Conservation Committee, in asso-ciation with the Wildfowl and Wetlands Trust. Accessible at http://www.bto.org/volunteer-surveys/webs/publications/webs-annual-report
Hoare, J. M., Pledger, S., Keall, S. N., Nelson, N. J., Mitchell, N. J. and Daugherty, C. H. (2006) Conservation implications of a long-term decline in body condition of the Brothers Island tuatara (Sphenodon guntheri). Anim. Conserv. 9: 456–462.
Inger, R., Harrison, X. A., Ruxton, G. D., Newton, J., Colhoun, K., Gudmundsson, G. A., McElwaine, G., Pickford, M., Hodgson, D. and Bearhop, S. (2010) Carry-over effects reveal reproductive costs in a long-distance migrant. J. Anim. Ecol. 79: 974–982.
Bewick’s Swans and food resources 495
Laubek, B. (1995) Habitat use by Whooper Swans Cygnus cygnus and Bewick’s Swans Cygnus columbianus bewickii wintering in Denmark: increasing agricultural conflicts. Wildfowl 46: 8–15.
Litvin, K. and Vangeluwe, D. (2016) The Bewick’s Swan is a paradox. Swan News 12: 12.
McFadden, D. (1973) Conditional logit analysis of qualitative choice behavior. Pp. 105–142 in P. Zarembka, ed. Frontiers in econometrics. New York, USA: Academic Press.
Meek, E. R. (1993) Population fluctuations and mortality of Mute Swans on an Orkney loch system in relation to a Canadian pondweed growth cycle. Scot. Birds 17: 85–92.
Meier-Peithmann, W. (2011) Change of feeding ecology of Whooper Swan, Bewick’s Swan and Mute Swan Cygnus cygnus, C. bewickii, C. olor during the period 1965-2010 at the Dannenberger Elbbogen (N Germany). Vogelwelt 132: 57–79.
Merne, O. J. (1972) Bewick’s Swans feeding on waste potatoes and other agricultural crops. Brit. Birds 65: 394–395.
Nakagawa, S. and Schielzeth, H. (2013) A gen-eral and simple method for obtaining R2 from generalized linear mixed-effects mod-els. Method. Ecol. Evol. 4: 133–142.
Nagy, S., Petkov, N., Rees, E. C., Solokha, A., Hilton, G., Beekman, J. and Nolet, B. (2012) International Single Species Action Plan for the Conservation of the Northwest European Population of Bewick’s Swan (Cygnus columbianus bewickii). AEWA Technical Series No. 44. Bonn, Germany: AEWA. Accessible at http://www.unep-aewa.org/sites/default/files/publication/ts44_ssap_bewicks_swan.pdf
Newton, I. (1980) The role of food in limiting bird numbers. Ardea 68: 11–30.
Newton, I. (2013) Bird populations. London, UK: Harper Collins.
Noordhuis, R., van der Molen, D. T. and van den Berg, M. S. (2002) Response of herbiv-orous water-birds to the return of Chara in Lake Veluwemeer, The Netherlands. Aquat. Bot. 72: 349–367.
Owen, M. and Cadbury, C. J. (1975) The ecol-ogy and mortality of swans at the Ouse Washes, England. Wildfowl 26: 31–42.
Owen, M. and Kear, J. (1972) Food and feed-ing habits of swans. Pp. 58–77 in P. Scott and The Wildfowl Trust, eds. The swans. London, UK: Michael Joseph.
Owen, M., Wells, R. L. and Black, J. M. (1992) Energy budgets of wintering barnacle geese: the effects of declining food resources. Ornis Scand. 23: 451–458.
Peig, J. and Green, A. J. (2009) New perspec-tives for estimating body condition from mass/length data: the scaled mass index as an alternative method. Oikos 118: 1863–1891.
Pinheiro, J., Bates, D., DebRoy, S., Sarkar, D. and R Core Team (2017) nlme: Linear and nonlinear mixed effects models. R pack-age version 3.1-131. Accessible at https://CRAN.R-project.org/package=nlme.
Ponting, J. (2014) Factors affecting the feeding distribution of Bewick’s (Cygnus columbi-anus bewickii) and Whooper (Cygnus cyg-nus) Swans wintering on the Ouse Washes, Norfolk. BSc. Thesis. Cardiff, UK: Cardiff University, School of Biosciences.
Poorter, E. P. R. (1991) Bewick’s Swans Cygnus columbianus bewickii, an analysis of breeding success and changing resources. Lelystad, the Netherlands: Ministerie van Verkeer en Waterstaat, Rijkswaterstaat, Directie Flevoland.
R Development Core Team (2018) R: a language and environment for statistical computing. [3.5.1]. Vienna, Austria: R Foundation for Statistical Computing. Accessible at http://www.R-project.org/
Rees, E. C. (2006) Bewick’s swan. London, UK: T. and A. D. Poyser.
Rees, E. C. and Beekman, J. H. (2010) Northwest European Bewick’s Swans: a population in decline. Br. Birds 103: 640–650.
Rees, E. C., Kirby, J. S. and Gilburn, A. (1997) Site selection by swans wintering in Britain and Ireland; the importance of habitat and geographic location. Ibis 139: 337–352.
Richards, S. A., Whittingham, M. J. and Stephens, P. A. (2011) Model selection and model averaging in behavioural ecology: the utility of the IT-AIC framework. Behav. Ecol. Sociobiol. 65: 77–89.
Scott, D. K. (1978) Social behaviour of winter-ing Bewick’s Swans. PhD thesis. Cambridge, UK: University of Cambridge.

K. A. Wood et al. 496
KEVIN A. WOOD*, JULIA L. NEWTH, KANE BRIDES, ANNE L. HARRISON, STEVE HEAVEN, CARL MITCHELL, JESSICA PONTING, DAFILA K. SCOTT, GEOFF M. HILTON, EILEEN C. REESWildfowl & Wetlands Trust, Slimbridge, Gloucestershire, GL2 7BT, UK.
MIKE BURDEKINRSPB Ouse Washes, Manea, Welches Dam, March, PE15 0NF, UK.
CHARLIE KITCHINRSPB Nene Washes, Whittlesey, Peterborough PE7 1RH, UK.
LEIGH MARSHALL, JON SMITHWildfowl & Wetlands Trust, Welney, Wisbech, PE14 9TN, UK.
WIM TIJSENPoelweg 12, 1778 KB Westerland, the Netherlands.
*Author for correspondence; e-mail: [email protected]
Received 14 March 2018; revision accepted 18 October 2018; Published online 6 November 2018
Sherry, T. W., Johnson, M. D. and Strong, A. M. (2005) Does winter food limit popula-tions of migratory birds. Pp. 414–425 in R. Greenberg and P. P. Marra, eds. Birds of two worlds: The ecology and evolution of migration. Baltimore, USA: Johns Hopkins University Press.
Siriwardena, G. M., Calbrade, N. A. and Vickery, J. A. (2008) Farmland birds and late winter food: does seed supply fail to meet demand? Ibis 150: 585–595.
Stillman, R. A., Wood, K. A., Gilkerson, W., Elkinton, E., Black, J. M., Ward, D. H. and Petrie, M. (2015) Predicting effects of envi-ronmental change on a migratory herbi-vore. Ecosphere 6: art. 114.
Tijsen, W. and Koffijberg, K. (2015) Thirty years of goose and swan counts in the north of the province of Noord-Holland. Limosa 88: 83–95.
van Gils, J. A. and Tijsen, W. (2007) Short-term foraging costs and long-term fueling rates in central-place foraging swans revealed by giving-up exploitation times. Am. Nat. 169: 609–620.
Wahl, J. and Degen, A. (2009) Rastbestand und Verbreitung von Singschwan Cygnus
cygnus und Zwergschwan C. bewickii im Winter 2004/05 in Deutschland. Vogelwelt 130: 1–24.
Warton, D. I., Duursma, R. A., Falster, D. S. and Taskinen, S. (2012) smatr 3 – an R pack-age for estimation and inference about allo-metric lines. Method. Ecol. Evol. 3: 257–259. Accessible at https://CRAN.R-project.org/package=smatr
Wood, K. A., Newth, J. L., Hilton, G. M., Nolet, B. A. and Rees, E. C. (2016) Inter-annual variability and long-term trends in breeding success in a declining population of migratory swans. J. Avian Biol. 47: 597–609.
Wood, K. A., Nuijten, R. J. M., Newth, J. L., Haitjema, T., Vangeluwe, D., Ioannidis, P., Harrison, A. L., Mackenzie, C., Hilton, G. M., Nolet, B. A. and Rees, E. C. (2018a) Apparent survival of an Arctic breeding migratory bird over 44 years of fluctuating population size. Ibis 160: 413–430.
Wood, K. A., Newth, J. L., Hilton, G. M. and Rees, E. C. (2018b) Has winter body condition varied with population size in a long-distance migrant, the Bewick’s Swan (Cygnus columbianus bewickii)? Eur. J. Wildlife Res. 64: 38.