are e-commerce fulfillment centers valued differently than
TRANSCRIPT

Jonathan A. Wiley, Ph.D.Bowers Professor of Real Estate Department of Real EstateJ. Mack Robinson College of BusinessGeorgia State University | Atlanta, Georgia
Are E-commerce Fulfillment Centers Valued Differently Than Warehouses
And Distribution Centers?

Calculating Economic Contributions — continued
© 2015 NAIOP Research Foundation
This report is protected by copyright and may not be reproduced or redistributed in whole or in part, in print or in any digital form, without the express written permission of the publisher. To obtain permissions, please contact Margarita Foster (see below).
There are many ways to give to the Foundation and support projects and initiatives that advance the commercial real estate industry. If you would like to contributed to the Foundation, please contact Bennett Gray, senior director, at 703-904-7100, ext. 168, or [email protected].
Requests for funding should be submitted to research@naiop. org. For additional information, please contact Margarita Foster, NAIOP Research Foundation, 2201 Cooperative Way, Herndon, VA 20171, at 703-904-7100, ext. 117, or [email protected].

Prepared for and Funded by the NAIOP Research Foundation
By
Jonathan A. Wiley, Ph.D.
Bowers Professor of Real Estate
Department of Real Estate
J. Mack Robinson College of Business
Georgia State University
Atlanta, Georgia
October 2015
Are E-commerce Fulfillment Centers Valued Differently Than Warehouses and Distribution Centers?

About NAIOPNAIOP, the Commercial Real Estate Development Association, is the leading organization for developers, owners, and related professionals in office, industrial, retail and mixed-use real estate. NAIOP comprises some 15,000 members in North America. NAIOP advances responsible commercial real estate development and advocates for effective public policy. For more information, visit www.naiop.org.
About the NAIOP Research Foundation
The NAIOP Research Foundation was established in 2000 as a 501(c)(3) organization to support the work of individuals and organizations engaged in real estate development, investment, and operations. The Foundation’s core purpose is to provide these individuals and organizations with the highest level of research information on how real properties, especially office, industrial, and mixed-use properties, impact and benefit communities throughout North America. The initial funding for the Research Foundation was underwritten by NAIOP and its Founding Governors with an endowment fund established to fund future research. For more information, visit www.naioprf.org.
About the Author Jonathan A. Wiley, Ph.D., teaches graduate and undergraduate courses on real estate development at Georgia State University. He has published a number of articles on commercial real estate, investment, valuation, development, brokerage and sustainable real estate, many of which appear in leading real estate journals such as Real Estate Economics, Journal of Real Estate Finance and Economics and Journal of Real Estate Research. His research has been presented at the annual meetings of premier industry organizations including the American Real Estate and Urban Economics Association, the American Real Estate Society, and the Financial Management Association. Prior to joining the faculty at Georgia State University, Wiley held faculty positions at Clemson University and the College of Charleston.
Contents
Introduction . . . . . . . . . . . . . . . . . . . . . . . . . . . . . . . . . . . . . . . . . . . . . . . 1
Executive Summary . . . . . . . . . . . . . . . . . . . . . . . . . . . . . . . . . . . . . . . . . . 3
Background . . . . . . . . . . . . . . . . . . . . . . . . . . . . . . . . . . . . . . . . . . . . . . . 5
Sample . . . . . . . . . . . . . . . . . . . . . . . . . . . . . . . . . . . . . . . . . . . . . . . . . . . 8
Results and Implications . . . . . . . . . . . . . . . . . . . . . . . . . . . . . . . . . . . . . 15
Appendix: Research Methodology . . . . . . . . . . . . . . . . . . . . . . . . . . . . . . 21

DisclaimerThe data collection measures included in this report should be regarded as guidelines rather than as absolute standards. The data may differ according to the geographic area in question, and results may vary accordingly. Local and regional economic performance is a key factor. Further study and evaluation are recommended before any investment decisions are made.
This project is intended to provide information and insight to industry practitioners and does not constitute advice or recommendations. NAIOP disclaims any liability for action taken as a result of this project and its findings.

NAIOP Research Foundation | 1
Introduction
Are fulfillment centers distinct real estate products? Some in the industry believe they are; others believe they are not. According to the results of this analysis, fulfillment centers are not significantly different from nor significantly more valuable than other types of warehouse and distribution facilities.
This study is among the first to explore this question. It uses a unique research design that lays the groundwork for practitioners, consultants, academics and others to build upon in future studies. It identifies a sample of 371 e-commerce fulfillment centers by combining information from Internet Retailer’s Top 500 Guide and CoStar databases.
Given the steady increase in online shopping that has occurred since 1994 — when Amazon launched its Internet bookselling business — purpose-built e-commerce fulfillment centers will continue to be constructed. Understanding the place of pure e-commerce fulfillment centers among all types of industrial structures is especially important to developers, tenants and investors as they assess development costs, lease terms and valuations.

2 | Are E-commerce Fulfillment Centers Valued Differently Than Warehouses and Distribution Centers?

NAIOP Research Foundation | 3
This research study identifies a sample of 371 structures that it defines as e-commerce fulfillment centers (FCs), combining information collected from Internet Retailer’s Top 500 Guide and CoStar databases in November 2014. (For detailes on sample selection and empirical methodology, see the Appendix to this report.) Throughout this study, FCs are defined as warehouses or distribution centers in which a current tenant is on Internet Retailer’s Top 500 Guide to leading e-commerce businesses. While this definition is useful to facilitate the data collection and analysis in this study, it differs from the concept of a “purpose-built FC,” which is a FC that has been designed and built to cater to e-commerce tenant needs.
The distinction between FCs and purpose-built FCs is important, as it guides the analysis and interpretation of the results. FCs include both new and existing industrial space occupied by e-commerce tenants, of which 371 observations were identified for this study. Purpose-built FCs, a more restrictive term, includes only the subsample of FCs in which the original tenant on the development completion date was an e-commerce tenant, of which 22 observations were identified for this study. The broader sample of FCs is the primary sample examined in this study. Much of this sample consists of existing industrial space that is occupied by e-commerce tenants; only 22 FCs in the sample have been confirmed to be purpose-built FCs.
The CoStar datasets used to construct the sample include CoStar Tenants, CoStar Property and CoStar COMPs. FCs are carefully matched with comparable assets to conduct the analysis. Comparables are either warehouses or distribution centers, collectively referred to as DCs, that are not identified as having e-commerce tenants. Comparison of the samples of FCs and DCs reveals that e-commerce tenants are more commonly located in newer, larger, Class A, higher-quality properties. Modern institutional-grade DCs are significantly larger than older centers; column spacing and ceiling clear heights have increased over time and in larger buildings. Yet these trends are not entirely different from those seen among Class A DCs that are occupied by national credit tenants in sectors other than e-commerce. In some cases, e-commerce tenants have incorporated specialized tenant improvements, such as mezzanine levels to accommodate picking and sorting stations as well as additional bathrooms and parking spaces for larger numbers of employees. In a few cases, the structure itself is designed distinctively, featuring a roof system that supports heavier loads or super-flat flooring. In many cases, however, the FC structure itself appears highly substitutable with competitive Class A DC space and could likely be utilized by a wide variety of tenants.
Executive Summary

4 | Are E-commerce Fulfillment Centers Valued Differently Than Warehouses and Distribution Centers?
To compare transaction prices between FCs and DCs, this study applies three different matched sampling procedures in order to make the comparison as accurate as possible. Regression methods are used to empirically control for differences in property values that respond to property class, structure age, building size, geographic submarket and sale timing. Similarly, rental rates are compared to current rates in the respective submarkets. In the evaluation of both sales prices and rental rates, FCs are found to have no significant difference in valuation relative to DCs, after statistically controlling for relevant factors and conditions.
Executive Summary — continued

NAIOP Research Foundation | 5
Online retail sales have encountered a period of tremendous growth in recent years, while in-store retail sales have stagnated. According to retail sales data from the U.S. Census Bureau, e-commerce revenues grew by a multiple of 18 between 2000 and 2014, an annualized rate of over 21 percent, while the multiple for in-store retailers during the same period was just 1.5, an annualized rate of less than 3 percent. Figure 1 contrasts revenue growth for these two types of retail sales from 2003 to 2014. Online platforms have already made several retail categories, including movie rental and music stores, virtually obsolete.
Functional obsolescence has also spread to an increasing segment of the existing industrial property market. The outlook for industrial development in many markets is much more favorable than that for most other property types, while the outlook for retail development is much less favorable. This shift in outlook has occurred as online retailers and manufacturers have made shortening the supply chain and executing next-day or same-day delivery for an increasing share of the population a top priority. This research identifies at least 30 new FCs as under construction or newly completed during 2013 and 2014. Twenty-two of these FCs are larger than 400,000 square feet; 11 have more than 1 million square feet of rentable building area.
Figure 1Retail Sales Growth, E-commerce Versus In-store
-15%
-10%
-5%
0%
5%
10%
15%
20%
25%
30%
35%
2003
Q4
2004
Q1
2004
Q2
2004
Q3
2004
Q4
2005
Q1
2005
Q2
2005
Q3
2005
Q4
2006
Q1
2006
Q2
2006
Q3
2006
Q4
2007
Q1
2007
Q2
2007
Q3
2007
Q4
2008
Q1
2008
Q2
2008
Q3
2008
Q4
2009
Q1
2009
Q2
2009
Q3
2009
Q4
2010
Q1
2010
Q2
2010
Q3
2010
Q4
2011
Q1
2011
Q2
2011
Q3
2011
Q4
2012
Q1
2012
Q2
2012
Q3
2012
Q4
2013
Q1
2013
Q2
2013
Q3
2013
Q4
2014
Q1
2014
Q2
2014
Q3
2014
Q4
14.6%
2.8%
E-commerce In-store
Source: U.S. Census Bureau
Note: This figure displays retail sales growth using quarterly data from the U.S. Census Bureau for U.S e-commerce sales and total retail sales from Q4 2003 through Q4 2014. In-store retail sales are calculated as total retail sales minus e-commerce sales. Sales growth is calculated as the percentage change from the same quarter one year earlier.
Background

6 | Are E-commerce Fulfillment Centers Valued Differently Than Warehouses and Distribution Centers?
Background — continued
Logistical efficiency is critical for FCs. Whereas the conventional DC facilitates products arriving on pallets and leaving the center on the same pallets, via tractor trailer in both transfers, the modern FC is more likely to see inventory exit the facility in smaller units via a shipping carrier such as UPS, FedEx, DHL or the U.S. Postal Service (USPS). Some new FCs have been built to suit to accommodate detailed tenant specifications. These purpose-built FCs may have over 1,000 employees on-site at a given time, which may require more employee parking, bathrooms and breakrooms than are found at most DCs, as well as proximity to nearby restaurants or other amenities. Some new FCs feature mezzanine levels supporting picking and sorting stations that facilitate more efficient processing of online orders.
Proximity to major cargo hubs in Rust Belt markets such as Cincinnati; Columbus, Ohio; Indianapolis; Louisville, Kentucky; and Memphis, Tennessee, appears important for firms seeking to centralize their FC operations. Yet there is no such a thing as a “one-size-fits-all” model for FCs, because of product heterogeneity and industry life cycles. For instance, Netflix, which began as a DVD-by-mail company and is now primarily a provider of online on-demand streaming media, still mails DVDs to some U.S. subscribers and has 58 FCs dispersed throughout the country, according to Internet Retailer’s Top 500 Guide. Yet each of these centers is relatively small, typically less than 50,000 square feet, and Netflix typically occupies existing warehouse space rather than purpose-built FC space. For firms distributing small and homogenous products, decentralization of FCs can cut down tremendously on the costs and times associated with the supply chain.
Geographically broadening one’s industrial footprint may not be feasible until a critical mass in sales volume has been reached. Curiously, in the e-commerce sector, some firms are actively seeking to centralize FC operations in order to cut down on costs, while others are moving aggressively to decentralize FCs, in order to minimize delivery times. Demand for same-day delivery of certain product types, such as
perishable items like groceries and flowers, is much higher than that for others, such as durable goods like furniture and appliances.
Consider, for example, a comparison of two Ohio facilities, 3051 Creekside Parkway in Lockbourne and 6766 Pontius Road in Groveport. The Lockbourne facility serves as a FC for Zulily.com, a rapidly growing Internet retailer. The Groveport one serves as a DC for Honeywell International Inc., which does not sell its products online directly to consumers. The properties are located within 3.3 miles — a seven-minute drive — of each other. They are positioned in Columbus, Ohio’s Southeast industrial submarket, a strategic locale for both companies. The Columbus region boasts access to the nation’s largest cargo- dedicated airport and nearly half of the U.S. population is within reach of a 10-hour drive. For these same reasons, a number of large retailers — including Abercrombie & Fitch, Big Lots, DSW, Eddie Bauer, L Brands, Restoration Hardware, Target and Wal-Mart — have based logistics operations there. Additionally, UPS and FedEx have massive air and ground operations in Columbus.
The Lockbourne FC has 737,471 square feet of rentable building area; the Groveport DC has 754,000 square feet. Both are Class A, rated as “four-star” by CoStar, constructed of reinforced concrete, have 32-foot clear heights with about 50 feet of depth between columns and were built in 2006. The differences between the two properties are subtle. The FC has 75 docks, six 12-by-14-foot drive-in doors, 48-foot column spacing, 506 surface parking spaces for cars and 116 industrial trailer spaces. The DC has 86 docks, four 10-by-14-foot drive-in doors, 50-foot column spacing, 550 surface parking spaces for cars and 178 industrial trailer spaces. The parking and trailer constraints at the FC are the result of a smaller site, 37 acres versus the DC’s 41.6 acres, which increases the floor-to-area ratio (FAR), 0.46 versus 0.42. Property taxes and operating expenses for the FC in 2012 were $0.12 and $0.28 per square foot, respectively, compared to $0.14 and $0.40 per square foot for the DC in 2013.

NAIOP Research Foundation | 7
Overall, the two assets are highly substitutable. Either structure is well-suited to the needs of either tenant. Both properties attract the same institutional clientele as investors and have been purchased and sold in the same portfolio on several recent occasions, as ownership has changed hands from an insurance company (which bought the portfolio in 2006) to an equity fund (in 2011) to a real estate investment trust (in 2013).
Comparing these two projects illustrates the central result in this study: that FCs are highly substitutable with DCs (after all relevant factors are carefully controlled). The result relies heavily on the sample identification strategy, which includes a large number of existing industrial properties that happen to have e-commerce tenants and thus are identified as FCs, rather than focusing exclusively on purpose-built FCs. (An analysis of purpose-built FCs may produce
very different results.) Anecdotally, it would not be surprising to find individual purpose-built FCs that have sold at higher prices per square foot or lower cap rates than comparable DCs. Data availability is the limiting factor in this research study’s ability to provide rigorous analysis of purpose-built FCs, since few of these facilities have been sold.
To avoid drawing conclusions from anecdotal evidence, this study explores whether statistically significant valuation differences exist for the more-inclusive sample of FCs relative to carefully constructed matched samples of highly similar DCs. The null hypothesis is that values for FCs are no different than values for similar DCs (industrial properties that are not occupied by e-commerce tenants). Any evidence of a significant value premium or discount, when measured relative to comparable assets, would reject the null hypothesis.

8 | Are E-commerce Fulfillment Centers Valued Differently Than Warehouses and Distribution Centers?
Sample
The Appendix to this report outlines the procedure used to identify the sample of FCs. For each of the 371 FCs identified, property data was collected from the CoStar Property: All Properties database for all industrial properties serving as warehouses or distribution centers that are of the same property class as the FC and located in the same market (for Class A properties) or submarket cluster (for Class B and C properties). The list of markets and number of observations from each market appears in Appendix Table A-1.The full sample from the All Properties database includes 371 FCs and 74,792 DCs, using data available in November 2014. Figure 2 displays the geographic distribution of the 371 FCs, delineated by property size categories.
Figure 2Geographic Distribution of FC Sample
Note: This figure presents the geographic distribution for the sample of 371 FCs identified in this study. The green circles, in increasing size and darkness, designate properties with less than 50,000 square feet, between 50,001 and 100,000 square feet, between 100,001 and 500,000 square feet, between 500,001 and 1 million square feet, and greater than 1 million square feet of rentable building area, respectively.
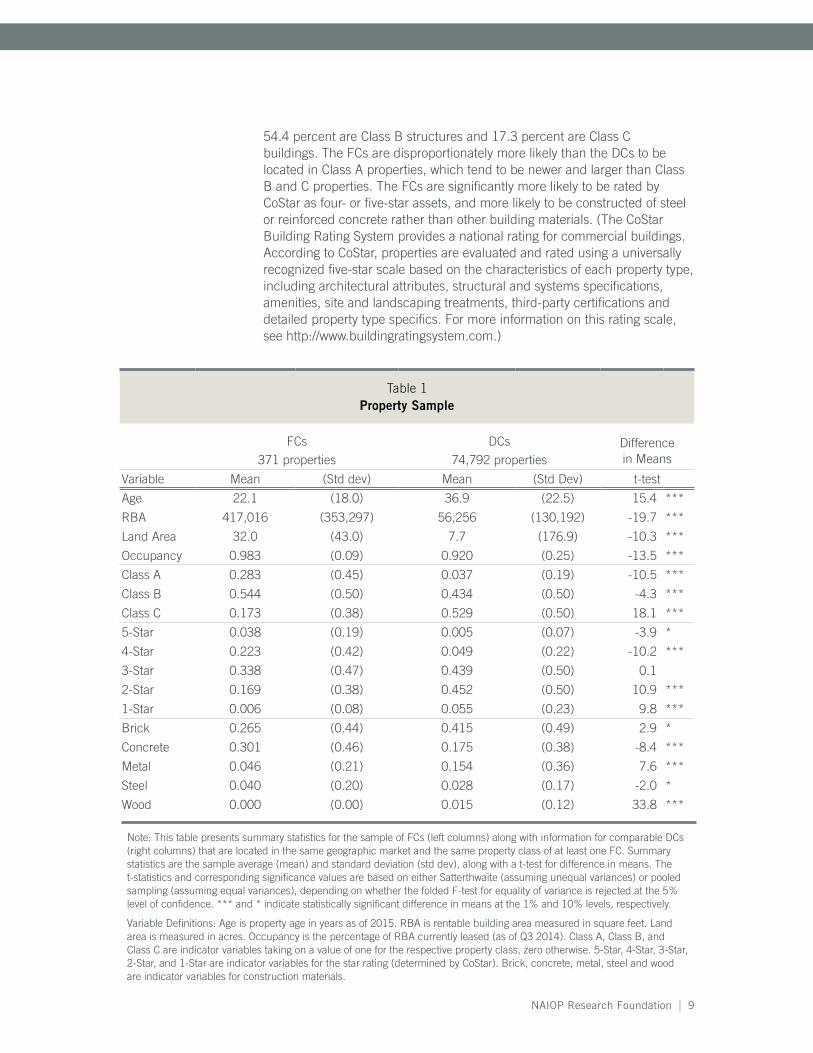
Table 1 displays summary statistics for the entire sample of industrial properties, including the FCs and their comparable DCs. The FCs are differentiated from the set of comparable DCs in that they are significantly newer (22 versus 37 years old), larger (417,000 versus 56,000 square feet), set on larger sites (32 versus 7.7 acres) and have higher occupancy levels (98.3 versus 92 percent). Of the 371 FCs, 28.3 percent are Class A properties,
NAIOP Research Foundation | 9
54.4 percent are Class B structures and 17.3 percent are Class C buildings. The FCs are disproportionately more likely than the DCs to be located in Class A properties, which tend to be newer and larger than Class B and C properties. The FCs are significantly more likely to be rated by CoStar as four- or five-star assets, and more likely to be constructed of steel or reinforced concrete rather than other building materials. (The CoStar Building Rating System provides a national rating for commercial buildings. According to CoStar, properties are evaluated and rated using a universally recognized five-star scale based on the characteristics of each property type, including architectural attributes, structural and systems specifications, amenities, site and landscaping treatments, third-party certifications and detailed property type specifics. For more information on this rating scale, see http://www.buildingratingsystem.com.)
Table 1Property Sample
FCs DCs Difference in Means371 properties 74,792 properties
Variable Mean (Std dev) Mean (Std Dev) t-test
Age 22.1 (18.0) 36.9 (22.5) 15.4 ***
RBA 417,016 (353,297) 56,256 (130,192) -19.7 ***
Land Area 32.0 (43.0) 7.7 (176.9) -10.3 ***
Occupancy 0.983 (0.09) 0.920 (0.25) -13.5 ***
Class A 0.283 (0.45) 0.037 (0.19) -10.5 ***
Class B 0.544 (0.50) 0.434 (0.50) -4.3 ***
Class C 0.173 (0.38) 0.529 (0.50) 18.1 ***
5-Star 0.038 (0.19) 0.005 (0.07) -3.9 *
4-Star 0.223 (0.42) 0.049 (0.22) -10.2 ***
3-Star 0.338 (0.47) 0.439 (0.50) 0.1
2-Star 0.169 (0.38) 0.452 (0.50) 10.9 ***
1-Star 0.006 (0.08) 0.055 (0.23) 9.8 ***
Brick 0.265 (0.44) 0.415 (0.49) 2.9 *
Concrete 0.301 (0.46) 0.175 (0.38) -8.4 ***
Metal 0.046 (0.21) 0.154 (0.36) 7.6 ***
Steel 0.040 (0.20) 0.028 (0.17) -2.0 *
Wood 0.000 (0.00) 0.015 (0.12) 33.8 ***
Note: This table presents summary statistics for the sample of FCs (left columns) along with information for comparable DCs (right columns) that are located in the same geographic market and the same property class of at least one FC. Summary statistics are the sample average (mean) and standard deviation (std dev), along with a t-test for difference in means. The t-statistics and corresponding significance values are based on either Satterthwaite (assuming unequal variances) or pooled sampling (assuming equal variances), depending on whether the folded F-test for equality of variance is rejected at the 5% level of confidence. *** and * indicate statistically significant difference in means at the 1% and 10% levels, respectively.
Variable Definitions: Age is property age in years as of 2015. RBA is rentable building area measured in square feet. Land area is measured in acres. Occupancy is the percentage of RBA currently leased (as of Q3 2014). Class A, Class B, and Class C are indicator variables taking on a value of one for the respective property class, zero otherwise. 5-Star, 4-Star, 3-Star, 2-Star, and 1-Star are indicator variables for the star rating (determined by CoStar). Brick, concrete, metal, steel and wood are indicator variables for construction materials.

10 | Are E-commerce Fulfillment Centers Valued Differently Than Warehouses and Distribution Centers?
Table 2 provides intraclass comparisons between FCs and their DC counterparts. Within each property class, FCs have significantly greater rentable building area (RBA), greater land area, more parking spaces, lower parking ratios, higher ceilings, more loading docks and higher occupancy. Occupancy rates are higher for FCs as a direct consequence of the sample identification process: in order to be counted as an FC, a property was required to have been occupied by a national retail tenant. For Class A and B properties, FCs have significantly greater column spacing. For Class B and C properties, FCs are significantly newer structures. Thus, property class alone does not fully explain differences in physical attributes between FCs and DCs within the same market or submarket cluster.
Sample — continued

NAIOP Research Foundation | 11
Table 2Property Sample, by Class
Class A FCs DCst-test
Variable N Mean (Std Dev) N Mean (Std Dev)
Age 104 10.8 (12.4) 2,358 11.5 (9.4) 0.6
RBA 105 603,499 (339,174) 2,774 339,305 (336,999) -7.9 ***
Land Area 101 45.1 (43.8) 2,570 30.2 (69.4) -3.3 *
Coverage 97 0.359 (0.1) 2,506 0.344 (0.2) -1.1
Mezzanine 105 0.114 (0.3) 2,774 0.066 (0.2) -1.5
Parking Spaces 83 377.6 (463.1) 2,185 209.2 (210.5) -3.3 *
Parking Ratio 45 0.858 (0.7) 1,398 1.338 (1.0) 4.4 ***Column Spacing
(Depth) 55 47.7' (6.0') 1,325 48.8' (18.3') 1.1Column Spacing
(Width) 59 48.4' (5.4') 1,376 46.9' (6.5') -2.1 *
Ceiling Height 87 30.5' (4.5') 2,308 28.7' (5.0') -3.3 *
Loading Docks 88 79.3 (58.0) 2,238 50.6 (54.7) -4.8 ***
Occupancy (%) 105 97.7 (11.8) 2,774 74.1 (41.8) -16.9 ***
Energy Star 105 0.029 (0.2) 2,774 0.009 (0.1) -1.2
LEED 105 0.029 (0.2) 2,774 0.034 (0.2) 0.3
Class B FCs DCst-test
Variable N Mean (Std Dev) N Mean (Std Dev)
Age 182 23.6 (16.9) 29,219 29.1 (19.5) 4.4 ***
RBA 202 381,650 (335,014) 32,434 68,220 (130,016) -13.3 ***
Land Area 196 30.8 (45.9) 31,316 9.1 (169.3) -6.4 ***
Coverage 192 0.348 (0.2) 30,262 0.316 (0.2) -2.7 *
Mezzanine 202 0.045 (0.2) 32,434 0.032 (0.2) -0.9
Parking Spaces 167 261.0 (333.9) 24,974 68.4 (126.2) -7.5 ***
Parking Ratio 100 1.355 (1.2) 21,361 1.973 (1.3) 4.9 ***
Column Spacing (Depth) 68 46.7' (6.6') 4,967 43.1' (14.7') -4.3 ***
Column Spacing (Width) 71 43.5' (8.7') 5,177 40.2' (13.8') -3.1 *
Ceiling Height 124 25.8' (6.3') 22,108 20.0' (5.5') -10.2 ***
Loading Docks 155 39.0 (35.0) 17,514 12.7 (21.3) -9.4 ***
Occupancy (%) 202 98.7 (7.7) 32,434 91.3 (25.7) -13.2 ***
Energy Star 202 0.000 (0.0) 32,434 0.000 (0.0) 2.7 *
LEED 202 0.005 (0.1) 32,434 0.000 (0.0) -1.0
Continued on next page

12 | Are E-commerce Fulfillment Centers Valued Differently Than Warehouses and Distribution Centers?
Table 2 – continuedProperty Sample, by Class
Class C FCs DCst-test
Variable N Mean (Std Dev) N Mean (Std Dev)
Age 63 36.4 (17.1) 35,266 45.1 (21.8) 4.0 *
RBA 64 222,691 (291,111) 39,584 26,617 (60,078) -5.4 ***
Land Area 63 14.7 (20.4) 38,293 5.0 (187.5) -3.5 *
Coverage 60 0.368 (0.2) 36,779 0.336 (0.2) -1.4
Mezzanine 64 0.016 (0.1) 39,584 0.018 (0.1) 0.1
Parking Spaces 54 180.0 (274.2) 29,386 34.8 (190.4) -3.9 *
Parking Ratio 36 1.795 (1.2) 24,170 2.280 (1.5) 2.4 *
Column Spacing (Depth) 16 41.3' (11.0') 1,946 40.7' (21.3') -0.2
Column Spacing (Width) 19 38.4' (11.0') 2,064 35.2' (12.2') -1.1
Ceiling Height 48 21.0' (5.5') 19,144 16.8' (4.5') -5.3 ***
Loading Docks 55 30.8 (71.5) 13,849 5.7 (11.4) -2.6 *
Occupancy (%) 64 98.2 (6.0) 39,584 93.9 (22.3) -5.7 ***
Energy Star 64 0.000 (0.0) 39,584 0.000 (0.0) 1.0
LEED 64 0.000 (0.0) 39,584 0.000 (0.0) 0.0
Note: This table presents summary statistics for the sample of FCs (left columns) along with information for comparable DCs (right columns) that are located in the same geographic market and the same property class of at least one FC. The top section summarizes the Class A subsample; the middle section summarizes the Class B subsample and the bottom section summarizes the Class C subsample. Summary statistics are the number of observations where the data field is available (N), the sample average (mean) and standard deviation (std dev), along with a t-test for difference in means. The t-statistics and corresponding significance values are based on either Satterthwaite (assuming unequal variances) or pooled sampling (assuming equal variances), depending on whether the folded F-test for equality of variance is rejected at the 5% level of confidence. *** and * indicate statistically significant difference in means at the 1% and 10% levels, respectively.
Variable Definitions: Coverage is the ground-floor RBA divided by the lot size. Mezzanine is an indicator variable for mezzanine levels and for properties indicating in the listing that “partial stories exist.” Parking spaces is the total number of automobile parking spaces available on the site. Parking ratio is the number of parking spaces per 1,000 square feet of RBA. Column spacing is the minimum spacing between structural support columns, measured in feet. Ceiling height is the minimum clear height, measured in feet. Loading docks is the number of tractor trailer-accessible loading docks along the building walls. Energy Star is an indicator variable for a building that is currently Energy Star-rated in the top quartile for the lowest energy-related operating expenses, based on data submitted to the U.S. Environmental Protection Agency. LEED is an indicator variable for any level of LEED (Leadership in Energy & Environmental Design) certification, which is awarded by the U.S. Green Building Council. All other variables are defined in the note to Table 1.
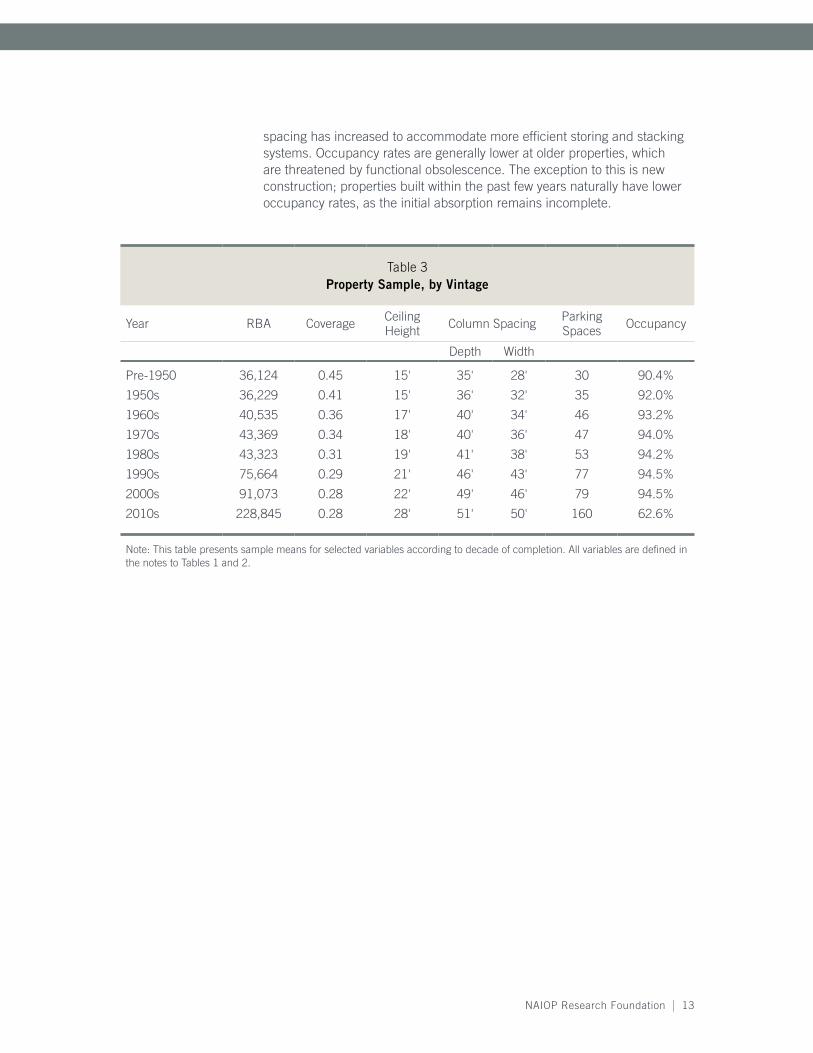
Table 3 depicts the evolution of the modern industrial structure. Warehouse and distribution center building sizes have sharply increased every decade following consolidation in the logistics and distribution industry. Coverage ratios have fallen to accommodate more trailer parking, which became important after regulatory changes in hours of service definitions limited the ability of commercial vehicle drivers to count loading and unloading time as off-duty hours. Ceiling clear heights have risen and minimum column
Sample — continued
NAIOP Research Foundation | 13
spacing has increased to accommodate more efficient storing and stacking systems. Occupancy rates are generally lower at older properties, which are threatened by functional obsolescence. The exception to this is new construction; properties built within the past few years naturally have lower occupancy rates, as the initial absorption remains incomplete.
Table 3Property Sample, by Vintage
Year RBA Coverage Ceiling Height Column Spacing Parking
Spaces Occupancy
Depth Width
Pre-1950 36,124 0.45 15' 35' 28' 30 90.4%
1950s 36,229 0.41 15' 36' 32' 35 92.0%
1960s 40,535 0.36 17' 40' 34' 46 93.2%
1970s 43,369 0.34 18' 40' 36' 47 94.0%
1980s 43,323 0.31 19' 41' 38' 53 94.2%
1990s 75,664 0.29 21' 46' 43' 77 94.5%
2000s 91,073 0.28 22' 49' 46' 79 94.5%
2010s 228,845 0.28 28' 51' 50' 160 62.6%
Note: This table presents sample means for selected variables according to decade of completion. All variables are defined in the notes to Tables 1 and 2.

14 | Are E-commerce Fulfillment Centers Valued Differently Than Warehouses and Distribution Centers?
Table 4 reveals property characteristics corresponding to building size. Consistent with the information displayed in Table 3, larger buildings are newer, make more efficient use of their sites via higher coverage ratios and feature higher ceilings and increased spacing between columns. Larger buildings also have more parking spaces. Smaller buildings are more commonly single-tenant assets and have higher occupancy rates as a consequence.
Table 4Property Sample, by Size
Year RBA Coverage Ceiling Height Column Spacing Parking
Spaces Occupancy
Depth Width
Under 25,000 SF 39 0.31 16' 38' 34' 22 94.1%
25-50,000 SF 37 0.34 19' 41' 36' 50 91.8%
50-100,000 SF 35 0.35 21' 42' 39' 90 90.7%
100-250,000 SF 32 0.37 24' 45' 42' 132 86.9%
250-500,000 SF 25 0.39 27' 48' 45' 225 83.6%
Greater than 500,000 SF 18 0.38 30' 49' 47' 401 74.5%
Note: This table presents sample means for selected variables according to property size. All variables are defined in the notes to Tables 1 and 2.
Sample — continued

NAIOP Research Foundation | 15
Table 5 provides summary statistics for the three matched samples. The first matched sample (PSM, All Markets) selects a match for each FC based on DC observations in all markets. The second matched sample (PSM, Individual Markets) restricts the estimation and match for each FC to be drawn from the same market. The third matched sample (Characteristic Matched Samples) matches each FC with one or more DCs based on specific selection criteria. The details of the matching procedures and empirical trade-offs involved with the alternative approaches are discussed in the Appendix. In short, the differences in physical characteristics between the sample of FCs and the matched samples of DCs are minimal. Tests for difference in means shown in Table 5 are insignificant from zero for each variable and in all three matched samples.
Table 5Summary Statistics: Matched Samples
PSM, All Markets Difference in MeansFCs DCs
Variable N Mean (Std Dev) N Mean (Std Dev) t-test
Price per SF 120 $47.2 ($28.6) 120 $48.3 ($28.5) 0.3
Age 120 22.2 (16.2) 120 22.2 (16.8) 0.0
RBA 120 363,066 (337,828) 120 423,636 (502,996) 1.1
Class A 120 0.225 (0.42) 120 0.225 (0.42) 0.0
Class B 120 0.583 (0.50) 120 0.592 (0.49) 0.1
Class C 120 0.192 (0.40) 120 0.183 (0.39) -0.2
PSM, Individual Markets Difference in MeansFCs DCs
Variable N Mean (Std Dev) N Mean (Std Dev) t-test
Price per SF 116 $48.1 ($28.5) 116 $53.7 ($41.0) 1.2
Age 116 22.4 (16.3) 116 24.6 (22.9) 0.8
RBA 116 356,673 (336,434) 116 306,751 (252,801) -1.3
Class A 116 0.207 (0.41) 116 0.233 (0.42) 0.5
Class B 116 0.595 (0.49) 116 0.569 (0.50) -0.4
Class C 116 0.198 (0.40) 116 0.198 (0.40) 0.0
Results and Implications
Continued on next page

16 | Are E-commerce Fulfillment Centers Valued Differently Than Warehouses and Distribution Centers?
Results and Implications — continued
Table 5 – continuedSummary Statistics: Matched Samples
PSM, Individual Markets Difference in MeansFCs DCs
Variable N Mean (Std Dev) N Mean (Std Dev) t-test
Price per SF 116 $48.1 ($28.5) 116 $53.7 ($41.0) 1.2
Age 116 22.4 (16.3) 116 24.6 (22.9) 0.8
RBA 116 356,673 (336,434) 116 306,751 (252,801) -1.3
Class A 116 0.207 (0.41) 116 0.233 (0.42) 0.5
Class B 116 0.595 (0.49) 116 0.569 (0.50) -0.4
Class C 116 0.198 (0.40) 116 0.198 (0.40) 0.0
Note: This table presents summary statistics for the three matched samples of transactions data. The top section (PSM, All Markets) details the propensity-score matched (PSM) sample from the probit estimation that includes all markets. The middle section details the propensity-score matched sample generated from 36 separate probit estimations for the individual markets. The bottom section details the characteristic matched samples, wherein the control group is constructed from the sample of DC observations that are located in the same industrial submarket cluster, of the same property class, sold in the same calendar year, have property age within 20 years of the subject property, and property size no less than 75 percent and no greater than double the subject property size. Summary statistics include the number of observations for which the data field is available (N), the sample average (mean) and standard deviation (std dev), along with a t-test for difference in means. The t-statistics and correspond significance values are based on either Satterthwaite (assuming unequal variances) or pooled sampling (assuming equal variances), depending on whether the folded F-test for equality of variance test is rejected at the 5% level of confidence. All t-tests reported above are insignificant from zero at the 10% level of confidence. Price per SF is the transaction price divided by RBA. All other variables are defined in the note to Table 1.
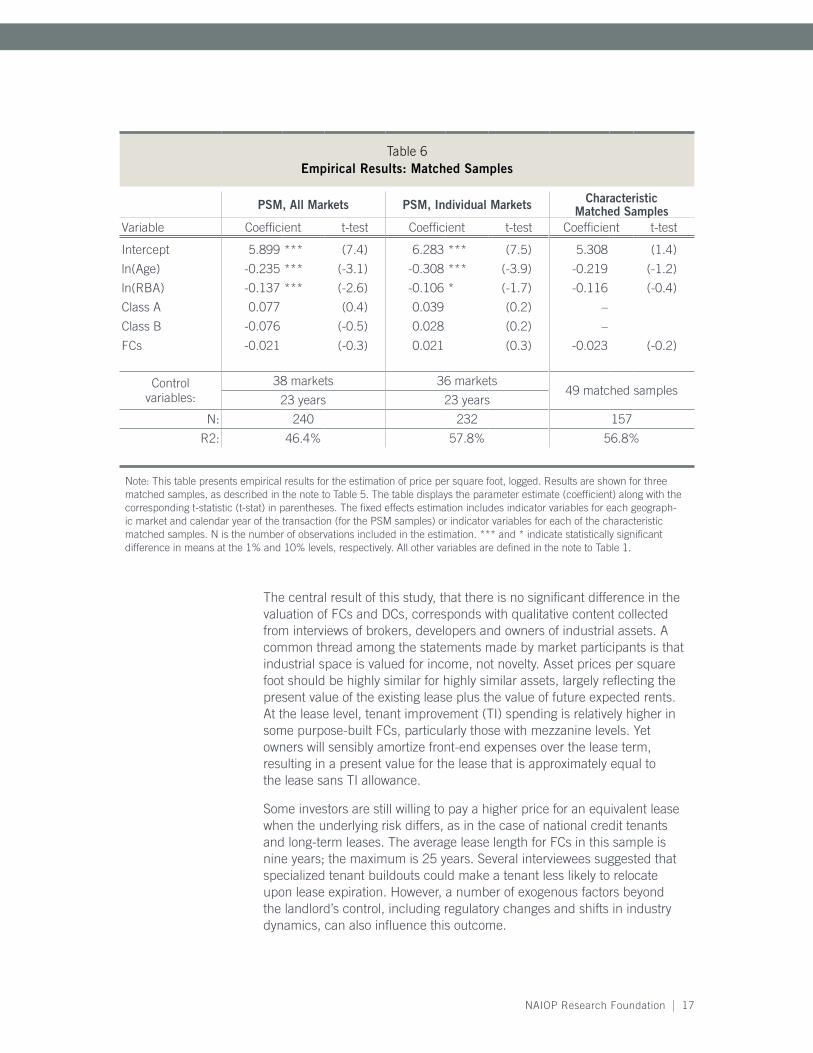
Table 6 displays results from the hedonic estimation of sale price per square foot. In three estimations (one for each matched sample), the estimated coefficient for FC valuation differences ranges from -2.3 percent to +2.1 percent, but is statistically insignificant from zero in all cases. After matched sampling is carefully applied to the data set, there is no evidence for a significant difference in the valuation of FCs relative to transaction prices paid for highly similar DCs. The findings suggest that FCs, as defined in this study, are valued no differently than similar DCs. Any perceived valuation differences are explained by the fundamental underlying attributes of FCs: that they tend to be Class A, newer, much larger and higher-quality industrial assets.
NAIOP Research Foundation | 17
Table 6Empirical Results: Matched Samples
PSM, All Markets PSM, Individual Markets Characteristic Matched Samples
Variable Coefficient t-test Coefficient t-test Coefficient t-test
Intercept 5.899 *** (7.4) 6.283 *** (7.5) 5.308 (1.4)
ln(Age) -0.235 *** (-3.1) -0.308 *** (-3.9) -0.219 (-1.2)
ln(RBA) -0.137 *** (-2.6) -0.106 * (-1.7) -0.116 (-0.4)
Class A 0.077 (0.4) 0.039 (0.2) –
Class B -0.076 (-0.5) 0.028 (0.2) –
FCs -0.021 (-0.3) 0.021 (0.3) -0.023 (-0.2)
Controlvariables:
38 markets 36 markets49 matched samples
23 years 23 years
N: 240 232 157
R2: 46.4% 57.8% 56.8%
Note: This table presents empirical results for the estimation of price per square foot, logged. Results are shown for three matched samples, as described in the note to Table 5. The table displays the parameter estimate (coefficient) along with the corresponding t-statistic (t-stat) in parentheses. The fixed effects estimation includes indicator variables for each geograph-ic market and calendar year of the transaction (for the PSM samples) or indicator variables for each of the characteristic matched samples. N is the number of observations included in the estimation. *** and * indicate statistically significant difference in means at the 1% and 10% levels, respectively. All other variables are defined in the note to Table 1.
The central result of this study, that there is no significant difference in the valuation of FCs and DCs, corresponds with qualitative content collected from interviews of brokers, developers and owners of industrial assets. A common thread among the statements made by market participants is that industrial space is valued for income, not novelty. Asset prices per square foot should be highly similar for highly similar assets, largely reflecting the present value of the existing lease plus the value of future expected rents. At the lease level, tenant improvement (TI) spending is relatively higher in some purpose-built FCs, particularly those with mezzanine levels. Yet owners will sensibly amortize front-end expenses over the lease term, resulting in a present value for the lease that is approximately equal to the lease sans TI allowance.
Some investors are still willing to pay a higher price for an equivalent lease when the underlying risk differs, as in the case of national credit tenants and long-term leases. The average lease length for FCs in this sample is nine years; the maximum is 25 years. Several interviewees suggested that specialized tenant buildouts could make a tenant less likely to relocate upon lease expiration. However, a number of exogenous factors beyond the landlord’s control, including regulatory changes and shifts in industry dynamics, can also influence this outcome.

18 | Are E-commerce Fulfillment Centers Valued Differently Than Warehouses and Distribution Centers?
For a closer examination of leasing differences, data for rental rates was hand-collected from the CoStar Tenants database. This data was available for 144 of the 371 FCs. For each rent observation, the submarket cluster average rental rate for warehouse space was collected from the CoStar Market Reports for the third quarter of 2014. In some cases, the FC rent per square foot is much higher; the maximum difference is $6.96 more. In others, it is much lower; the minimum difference is $3.81 less. Table 7 displays summary statistics for the leasing data. Rents for FCs are highly similar to the submarket average in all size categories and across each property class. In each category, average FC rents are not significantly different from the matched submarket averages. Thus, even though FCs may attract national credit tenants, so do other types of Class A, institutional-grade DCs.
Table 7Rent Sample
FCs SubmarketSize Category N Mean (Std Dev) Mean (Std Dev)
6 (largest) 24 $3.49 ($0.8) $3.80 ($0.6)
5 24 $4.13 ($1.9) $4.29 ($1.4)
4 24 $4.08 ($1.4) $4.72 ($1.5)
3 24 $5.78 ($2.6) $6.09 ($2.4)
2 24 $6.20 ($2.9) $5.99 ($1.9)
1 (smallest) 24 $6.15 ($1.8) $5.59 ($1.4)
Class A 54 $4.28 ($2.1) $4.35 ($1.3)
Class B 73 $5.23 ($2.1) $5.33 ($1.7)
Class C 17 $6.05 ($3.1) $6.34 ($2.7)
Note: This table presents rental rate summary statistics (in dollars per square foot per year) for the sample of FCs (left columns) along with matching observations (right columns) for average rents on warehouse properties in the same submarket during Q3 2014 (collected from CoStar Market Reports). In the first six rows, the comparison is provided based on size categories. The final three rows provide the comparison according to property class. The size categories are as follow: 1 = less than 24,000 SF; 2 = 24,000 to 75,000 SF; 3 = 75,001 to 176,000 SF; 4 = 176,001 to 348,000 SF; 5 = 348,001 to 526,400; 6 = greater than 526,400. Summary statistics are the sample average (mean) and standard deviation (std dev).
One issue with the sample identification in this study is that a number of the properties classified as FCs are, in fact, pre-existing warehouse and distribution buildings occupied by retailers listed in the Internet Retailer’s Top 500 Guide. Another issue with the sample is that it includes many retailers with both online and in-store sales, so isolating just the fulfillment activities of those retailers is difficult. Perhaps the modern e-commerce tenant seeks a purpose-built FC that is sufficiently different from existing warehouse and distribution facilities to warrant further investigation. To
Results and Implications — continued

NAIOP Research Foundation | 19
consider this, the subsample of 117 observations for which the lease start dates are available is evaluated. In order to be classified as a purpose-built FC, the property must have been completed no earlier than two years prior to the lease start date. Only 22 properties satisfy the purpose-built FC criteria. Figure 3 presents the geographic distribution of these purpose-built FCs, by year of completion. When compared to FCs that utilize pre-existing distribution space, purpose-built FCs are significantly younger (by definition), larger (496,000 square feet) and have significantly higher ceiling clearance (31 feet). Yet the rent differential between the two groups is insignificant from zero.
Figure 3Geographic Distribution of Purpose-built FCs
Note: This figure presents the geographic distribution for the sample of 22 purpose-built FCs. In order to be classified as purpose built, the property must have been completed no earlier than two years prior to a single e-commerce tenant’s lease start date. The triangles designate purpose-built FCs by year of completion.
In conclusion, this study finds no evidence that FCs, as defined here, are valued differently than DCs, after controlling for appropriate differences in property characteristics and geographic markets.

20 | Are E-commerce Fulfillment Centers Valued Differently Than Warehouses and Distribution Centers?
Appendix: Research Methodology

NAIOP Research Foundation | 21
Appendix: Research Methodology
Sample identification for e-commerce tenants began with the 2014 edition of Internet Retailer’s Top 500 Guide, which ranks firms according to online retail sales. The publication includes a listing of “Top 500 merchants’ fulfillment hubs” (pages 52-53), including brick-and-mortar retail chains, manufacturers, catalog companies or call centers, and web-only firms. The list of Top 500 fulfillment hubs is cross-referenced with the Top 500 Parent Company Index (pages 432-439), which includes a more expansive list of business names for each parent company listing. For instance, Amazon, the No. 1-ranked online retailer in web sales revenue, also owns Zappos.com, Woot.com, Soap.com, Diapers.com, Wag.com, YoYo.com, Casa.com, Vine.com, Bookworm.com, BeautyBar.com and MyHabit.com. Each individual company name was submitted to the CoStar Tenants database.
Selecting the Fulfillment Center Sample

22 | Are E-commerce Fulfillment Centers Valued Differently Than Warehouses and Distribution Centers?
Appendix: Research Methodology – continued
Appendix Table A-1 Market Coverage
MarketNumber of
ObservationsMarket
Number of Observations
Asheville 26 Los Angeles 6,852
Atlanta 4,025 Louisville 130
Augusta/Richmond County 4 Lubbock 20
Austin 507 Memphis 720
Bakersfield 71 Milwaukee/Madison 602
Baltimore 367 Minneapolis/St Paul 147
Boise City/Nampa 56 Nashville 348
Boston 2,395 Northern New Jersey 2,859
Charlotte 1,743 Oklahoma City 610
Chicago 3,974 Omaha/Council Bluffs 244
Cincinnati/Dayton 2,112 Orange County, CA 1,873
Cleveland 780 Orlando 1,454
Columbia, SC 45 Philadelphia 5,192
Columbus, GA 16 Phoenix 934
Columbus, OH 950 Pittsburgh 207
Dallas/Fort Worth 1,343 Portland 1,930
Denver 140 Reno/Sparks 187
Des Moines 78 Richmond, VA 124
Detroit 1,659 Roanoke 37
East Bay/Oakland 1,050 Sacramento 367
Evansville 49 Salinas 77
Greensboro/Winston-Salem 452 Salt Lake City 955
Greenville/Spartanburg 112 San Antonio 287
Hampton Roads 1,312 San Diego 470
Hartford 173 San Francisco 354
Hawaii 1,278 Santa Cruz/Watsonville 8
Houston 2,442 Seattle/Puget Sound 1,250
Indianapolis 341 South Bay/San Jose 115
Inland Empire, CA 6,358 South Florida 2,008
Jackson, MS 23 Southwest Florida 490
Jacksonville, FL 574 Springfield 87
Kansas City 1,452 Stockton/Modesto 229
Kingsport/Bristol 29 Tampa/St Petersburg 2,692
Knoxville 13 Washington DC 348
Las Vegas 868 West Michigan 366
Lexington/Fayetteville 334 Westchester/South Connecticut 46
Little Rock/North Little Rock 64 Youngstown/Warren 137
Long Island, NY 3,219
Total 75,190

NAIOP Research Foundation | 23
The company name search process registered 251 successful hits in the CoStar Property database, although each success produced a number of additional tenants that are not necessarily in FCs. For instance, the search for “Amazon” under company name yields 89 tenant spaces — this is just one of the 251 successful hits. In several cases, CoStar lists the company name as Amazon, the building name is Amazon Distribution Center, the square footage occupied is greater than 1 million and the web address data field lists www.amazon.com. Such observations are readily counted among those confirmed as fulfillment centers (FCs). Yet the same query also includes observations for firms like Amazonas Coffee Company LLC, occupying 500 square feet with two employees, which is clearly not an FC, and thus is eliminated from the sample.
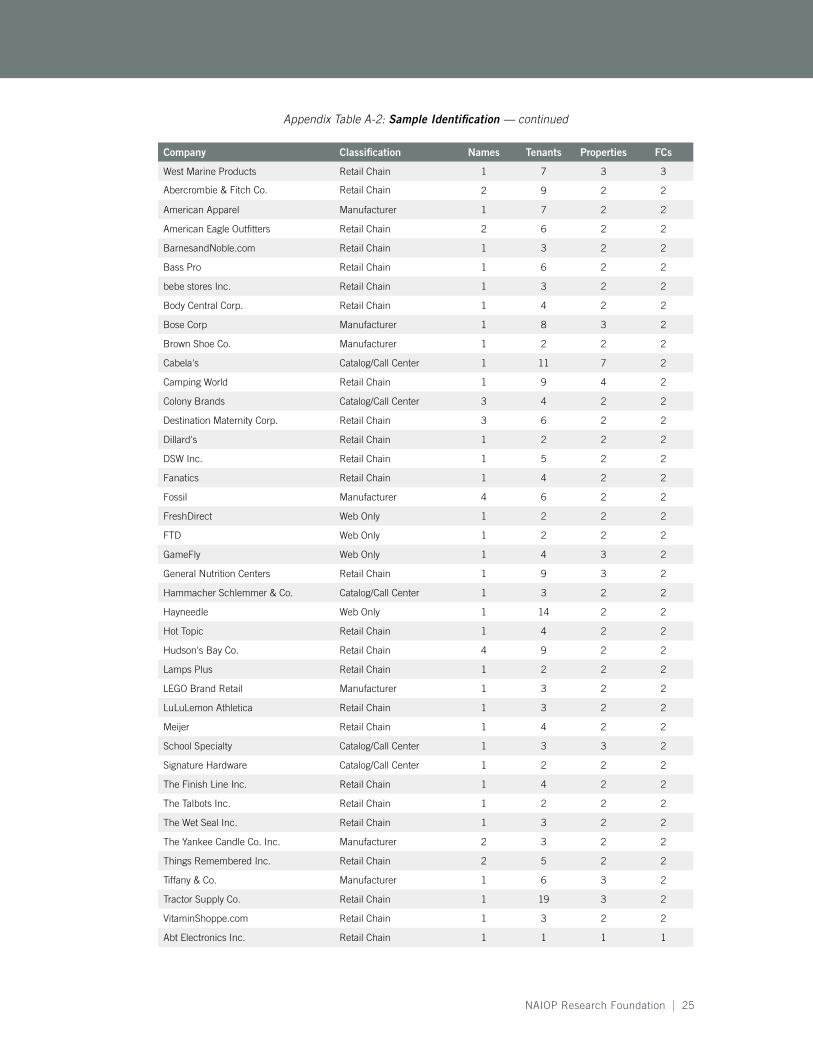
The 251 successful hits for company names produce a total of 1,545 observations for tenants in the CoStar Tenants database, of which 473 are not eliminated and 371 are confirmed in the CoStar Property database. Appendix Table A-2 displays the data selection process. The parent company name is in the first column. Internet Retailer’s classification for the parent company is in the second column. The “Names” column lists the number of successful hits that resulted from searching the parent company and all listed subsidiaries. For instance, Amazon.com has a total of 12 different company names that were searched in the CoStar Tenants database, but successful hits occur for only three of these names. Each successful hit of the 251 in the “Names” column associates with at least — but typically more than — one “Tenants” observation. The “Tenants” column reports 1,545 observations affiliated with the raw company names; however, only 473 tenant observations remain after each individual observation is carefully qualified.

24 | Are E-commerce Fulfillment Centers Valued Differently Than Warehouses and Distribution Centers?
Appendix: Research Methodology – continued
Appendix Table A-2 Sample Identification
Company Classification Names Tenants Properties FCs
Amazon.com Web Only 3 93 68 48
NBTY Manufacturer 1 26 14 12
Kohl's Corp. Retail Chain 1 45 11 9
PetSmart Retail Chain 1 9 9 8
1-800-Flowers.com Catalog/Call Center 3 11 9 7
Rooms To Go Retail Chain 1 12 8 7
Netflix Web Only 1 12 11 6
Nordstrom Retail Chain 1 23 9 6
Ralph Lauren Media Manufacturer 1 11 6 6
TJX Cos. Retail Chain 1 11 10 6
Columbia Sportswear Co. Manufacturer 3 9 5 5
HSN Catalog/Call Center 1 8 6 5
Levi Strauss & Co. Manufacturer 1 5 5 5
BJ's Wholesale Club Retail Chain 1 6 4 4
Carter's Inc. Manufacturer 2 26 4 4
Keurig Green Mountain Catalog/Call Center 1 12 6 4
Lakeshore Learning Retail Chain 1 4 4 4
Newegg Web Only 1 4 4 4
The Sports Authority Retail Chain 2 11 4 4
U.S. Auto Parts Network Web Only 2 11 4 4
Under Armour Manufacturer 1 5 4 4
AutoZone Retail Chain 1 13 7 3
Belk Ecommerce Retail Chain 1 11 3 3
Coach Manufacturer 1 33 3 3
Dick's Sporting Goods Retail Chain 2 8 5 3
Door to Door Organics Web Only 1 3 3 3
Follett Higher Education Group Retail Chain 1 8 3 3
Gander Direct Marketing Catalog/Call Center 1 22 4 3
Golfsmith International Holdings Retail Chain 1 3 3 3
Guess? Manufacturer 1 10 3 3
Hallmark Cards Manufacturer 2 6 3 3
iHerb Web Only 1 3 3 3
JJBuckley.com Web Only 2 3 3 3
LumberLiquidators.com Retail Chain 1 51 3 3
New Balance Manufacturer 2 3 3 3
Tilly's Inc. Retail Chain 1 6 3 3
Tory Burch Manufacturer 1 3 3 3
ULTA Beauty Retail Chain 2 8 4 3
Urban Outfitters Retail Chain 1 7 6 3
NAIOP Research Foundation | 25
Appendix Table A-2: Sample Identification — continued
Company Classification Names Tenants Properties FCs
West Marine Products Retail Chain 1 7 3 3
Abercrombie & Fitch Co. Retail Chain 2 9 2 2
American Apparel Manufacturer 1 7 2 2
American Eagle Outfitters Retail Chain 2 6 2 2
BarnesandNoble.com Retail Chain 1 3 2 2
Bass Pro Retail Chain 1 6 2 2
bebe stores Inc. Retail Chain 1 3 2 2
Body Central Corp. Retail Chain 1 4 2 2
Bose Corp Manufacturer 1 8 3 2
Brown Shoe Co. Manufacturer 1 2 2 2
Cabela's Catalog/Call Center 1 11 7 2
Camping World Retail Chain 1 9 4 2
Colony Brands Catalog/Call Center 3 4 2 2
Destination Maternity Corp. Retail Chain 3 6 2 2
Dillard's Retail Chain 1 2 2 2
DSW Inc. Retail Chain 1 5 2 2
Fanatics Retail Chain 1 4 2 2
Fossil Manufacturer 4 6 2 2
FreshDirect Web Only 1 2 2 2
FTD Web Only 1 2 2 2
GameFly Web Only 1 4 3 2
General Nutrition Centers Retail Chain 1 9 3 2
Hammacher Schlemmer & Co. Catalog/Call Center 1 3 2 2
Hayneedle Web Only 1 14 2 2
Hot Topic Retail Chain 1 4 2 2
Hudson's Bay Co. Retail Chain 4 9 2 2
Lamps Plus Retail Chain 1 2 2 2
LEGO Brand Retail Manufacturer 1 3 2 2
LuLuLemon Athletica Retail Chain 1 3 2 2
Meijer Retail Chain 1 4 2 2
School Specialty Catalog/Call Center 1 3 3 2
Signature Hardware Catalog/Call Center 1 2 2 2
The Finish Line Inc. Retail Chain 1 4 2 2
The Talbots Inc. Retail Chain 1 2 2 2
The Wet Seal Inc. Retail Chain 1 3 2 2
The Yankee Candle Co. Inc. Manufacturer 2 3 2 2
Things Remembered Inc. Retail Chain 2 5 2 2
Tiffany & Co. Manufacturer 1 6 3 2
Tractor Supply Co. Retail Chain 1 19 3 2
VitaminShoppe.com Retail Chain 1 3 2 2
Abt Electronics Inc. Retail Chain 1 1 1 1

26 | Are E-commerce Fulfillment Centers Valued Differently Than Warehouses and Distribution Centers?
Appendix: Research Methodology – continued
Appendix Table A-2: Sample Identification — continued
Company Classification Names Tenants Properties FCs
Aeropostale Retail Chain 1 4 2 1
American Girl Catalog/Call Center 1 2 1 1
AmeriMark Direct LLC Catalog/Call Center 2 2 1 1
Ann Inc. Retail Chain 1 1 1 1
Ascena Retail Group Retail Chain 1 1 1 1
Benchmark Brands Inc. Catalog/Call Center 1 1 1 1
Beyond the Rack Web Only 1 1 1 1
Bluestem Brands Catalog/Call Center 1 2 1 1
Boscov's Department Store LLC Retail Chain 1 2 2 1
BuyAutoParts.com Web Only 2 4 1 1
CafePress.com Web Only 1 1 1 1
Callaway Golf Interactive Manufacturer 1 5 1 1
CD Listening Bar Inc. Web Only 1 1 1 1
Chegg Web Only 1 1 1 1
Chico's FAS Retail Chain 1 35 1 1
Christopher & Banks Retail Chain 1 5 1 1
CPO Commerce Inc. Web Only 2 7 1 1
Crocs Manufacturer 1 2 1 1
David's Bridal Inc. Retail Chain 1 1 1 1
DoMyOwnPestControl.com Web Only 1 1 1 1
Dover Saddlery Inc. Retail Chain 1 5 1 1
DrJays.com Web Only 2 1 1 1
Eddie Bauer Retail Chain 1 1 1 1
eForCity Corp. Web Only 1 1 1 1
Eileen Fisher Inc. Manufacturer 1 1 1 1
Foot Locker Retail Chain 1 24 2 1
FrangranceNet.com Web Only 1 1 1 1
Gaiam Inc. Catalog/Call Center 1 1 1 1
Gilt Groupe Web Only 2 1 1 1
Groupon Goods Web Only 1 1 1 1
hhgregg Appliances Retail Chain 3 8 1 1
Hickory Farms Retail Chain 1 1 1 1
Instawares Holding Co. Web Only 1 2 1 1
InterWorld Highway LLC Web Only 1 3 2 1
J. Crew Retail Chain 1 4 2 1
JustFab Inc. Web Only 1 1 1 1
LD Products Web Only 1 2 1 1
Levenger Co. Catalog/Call Center 1 1 1 1
LinenTablecloth.com Web Only 1 1 1 1
ModCloth Inc. Web Only 1 1 1 1
Monoprice Inc. Web Only 1 1 1 1

NAIOP Research Foundation | 27
Appendix Table A-2: Sample Identification — continued
Company Classification Names Tenants Properties FCs
Musician's Friend Catalog/Call Center 1 1 1 1
National Trade Supply Web Only 1 3 1 1
dELia*s Retail Chain 1 3 0 0
Deluxe Corp. Manufacturer 1 4 1 0
DVF.com Manufacturer 1 1 0 0
Garmin Ltd. Manufacturer 2 4 2 0
Godiva Chocolatier Inc. Manufacturer 1 2 0 0
Harry and David Holdings Catalog/Call Center 1 1 0 0
HRM USA Inc. Web Only 1 1 1 0
ID Wholesaler Web Only 3 1 0 0
L.L. Bean Catalog/Call Center 1 1 1 0
Living Direct Inc. Web Only 1 4 0 0
MLB Advanced Media Web Only 1 4 0 0
MovieMars.com Web Only 1 1 1 0
New York & Co. Inc. Retail Chain 1 8 0 0
Northern Tool Catalog/Call Center 1 5 0 0
OmahaSteaks.com Catalog/Call Center 2 1 1 0
OpticsPlanet Inc. Web Only 1 1 0 0
Overstock.com Web Only 1 2 0 0
Party City Corp. Retail Chain 1 4 0 0
PCM Retail Chain 1 8 0 0
Power Equipment Direct Inc. Web Only 1 79 0 0
Rugs Direct Retail Chain 1 1 0 0
Saks Direct Retail Chain 1 7 0 0
Sheplers Inc. Retail Chain 1 1 1 0
ShopHQ Catalog/Call Center 1 1 1 0
Sweetwater Catalog/Call Center 1 9 0 0
The Buckle Retail Chain 1 39 1 0
The Children's Place Retail Chain 1 2 1 0
The Discovery Channel Store Retail Chain 1 1 0 0
The Gymboree Corp. Retail Chain 1 4 1 0
Tool King LLC Web Only 3 2 0 0
Tumi Manufacturer 1 1 1 0
Turn5 Inc. Retail Chain 1 4 0 0
UnbeatableSale.com Web Only 1 1 0 0
Vera Bradley Retail Stores LLC Manufacturer 2 5 2 0
YOOX Group Web Only 5 21 0 0
Totals: 251 1,545 473 371
Note: Classifications provided by Internet Retailer’s Top 500 Guide.

28 | Are E-commerce Fulfillment Centers Valued Differently Than Warehouses and Distribution Centers?
Appendix: Research Methodology – continued
Of the 1,545 tenant observations in Appendix Table A-2, 778 spaces are deleted from the sample because the company name is noticeably different from and inconsistent with that of the e-commerce retailer (e.g., Amazonas Coffee Company LLC). For the remaining 767 observations (where the company name appears to match), the property address for the tenant is individually searched in the CoStar Tenants database. A careful inspection reveals that 294 of these observations should be removed from the sample, either because of duplication (95 observations) or because the space utilization is inconsistent with FCs (199 observations). For instance, 71 observations are retail spaces, 54 are manufacturing facilities, five are office spaces, five are inside shopping malls, two are light manufacturing facilities, two are industrial showrooms and one is a telecom/data hosting facility. The remaining 59 of the 199 inconsistent space utilizations are determined to be unlikely to function as FCs, either because the tenant’s occupied space is too small (e.g., 500 square feet) or because a substantially larger distribution facility has already been identified for that company. Property addresses for the remaining 473 tenant observations are then submitted to the CoStar Property database, which is searched specifically for industrial space purposed as either warehouse or distribution centers (DCs). Alternative industrial uses include food processing, manufacturing, refrigeration/cold storage, service, showroom, telecom hotel/data hosting, and truck terminal, none of which are considered in this study. CoStar Property database matches were identified for 371 observations, comprising this study’s sample of FCs.

NAIOP Research Foundation | 29
Fulfillment Center Matching Methodology
Transactions data is available for a subset of the CoStar Property dataset after merging with the CoStar COMPs database. Transactions include 120 FCs and 35,563 comparable DCs that have sale records available. Based on the summary of data considered in Tables 1, 2 and 3, it is apparent that FCs are sufficiently distinct from the general population of industrial DCs. Because of sample heterogeneity in commercial real estate transactions data, three matched sampling procedures are applied in an effort to reduce measurement issues that are created in the presence of sample selection bias. The first approach is a propensity score matching methodology. A probit estimation is performed on the physical and location characteristics that influence the selection of assets used as FCs. While physical characteristics are not consistently reported for all observations, many measures are highly correlated with two basic attributes: property age and building size. The probit model includes variables for property age and building size, indicators for Class A and Class B (Class C is suppressed, so that valuation effects for Class A and Class B are measured relative to Class C), categorical variables for the sample period and 43 control variables identifying the individual geographic markets. The categorical periods (average transaction price per square foot) are classified based on the following structural breakpoints in transaction prices for industrial warehouse and distribution centers: pre-1997, $47 per square foot; 1997-2002, $54; 2003-2009, $80; 2009-2013, $59; and 2014, $70 (suppressed). The outcome from the probit estimation produces the probability that an asset will be selected. Each FC observation is then matched one-to-one with the most similar DC property transaction, based on the nearest-neighbor propensity score, in order to generate the matched sample.
The probit estimation for the first propensity score matching is shown in Appendix Table A-3. Prior to matching, FCs are significantly younger and larger assets. Post-match, the sample is equally balanced, with 120 FC observations and 120 DC comparables. Relative success in the matching procedure is confirmed as the pseudo-R2 drops from 31.8 percent to 8.2 percent, and none of the explanatory variables remain significant following the matching.

30 | Are E-commerce Fulfillment Centers Valued Differently Than Warehouses and Distribution Centers?
Appendix: Research Methodology – continued
Appendix Table A-3 Propensity Score Matching: Probit Model
Pre-match Post-match
Variable Coefficient (Wald 2) Coefficient (Wald
2)
Intercept -8.704 (0.0) 1.690 (0.0)
Yr: pre-1997 -0.198 (0.6) -0.587 (1.2)
Yr: 1997-2002 0.119 (0.4) -0.302 (0.6)
Yr: 2003-2008 -0.210 (1.5) -0.200 (0.2)
Yr: 2009-2013 0.013 (0.0) -0.227 (0.4)
ln(Age) -0.234 *** (13.5) 0.074 (0.2)
ln(RBA) 0.629 *** (217.8) -0.035 (0.1)
Class A -0.843 *** (17.9) 0.023 (0.0)
Class B -0.688 *** (25.6) 0.081 (0.1)
Controls: 43 markets 43 markets
N: 35,683 240
pseudo-R2: 31.8% 8.2%
Note: This table presents results from the probit estimation for FC selection. The dependent variable is FC, taking on a value of one for FC and zero otherwise. Results are presented for the full sample of transactions data (Pre-match) and for the matched sample (Post-match). The matched sample is produced from the nearest-neighbor, one-to-one propensity score matching. The table displays the parameter estimate (Coefficient) along with the Wald 2 test statistic in parentheses. Yr: pre-1997, 1997-2002, 2003-2008 and 2009-2013 are indicator variables for the respective period in which the transaction dates occur. Data for transactions in 2014 are included, but the indicator variable for 2014 transactions is suppressed to prevent multicollinearity. Forty-three indicator variables are included as control variables for the geographic markets. N is the number of observations included in the estimation. All variables are defined in the note to Table 1. *** indicates statistically significant difference in means at the 1% level.
The second approach is a propensity score matched sampling where the probit estimations are conducted for each individual market to ensure that the subject property is matched with the most similar observation in the same market. The probit model is the same as that used under the first method, with the exception that sample period categorical variables are not included. This adjustment avoids linear combinations that would prevent convergence for each market model. The relative advantage of 43 individual market probit estimations is that a different set of factors may be influencing selection within each market. The disadvantage is a loss in statistical power of the estimated probabilities due to smaller sample sizes.

NAIOP Research Foundation | 31
The third approach applies a characteristic matched sampling methodology. For each FC observation, a control group is constructed from the sample of DC observations. In order to be included in the control group, an observation must be located in the same industrial submarket cluster (as defined by CoStar), be of the same property class, have transacted in the same calendar year, be within 20 years in age of the subject property age, and be no less than 75 percent and no greater than double the subject property size. The characteristic matched samples allow more than one comparable observation per subject property, in contrast to the lottery applied under the propensity score matching, which selects only one comparable observation.
The advantage in the characteristic matched sample approach (relative to the propensity score matching) is that it allows more than one comparable DC per FC, creating a larger set of market information. The disadvantages in the characteristic matched sample approach are that FCs are excluded when there are no matched samples — which disproportionately eliminates Class A properties from the analysis — and that the matched samples are no longer equally comprised of FC and DC observations; that is, the sample is unbalanced. Valuation estimates will be biased by results from submarkets containing more DCs per control group; this bias tends to favor smaller and Class C properties. In the characteristic matched sample (see summary statistics in Table 5), only 52 FCs are found to have comparable DCs that match all criteria, yet there are 105 DCs in the matched sample. While there are fewer FCs considered overall (52, versus 120 in the propensity score matched sample for all markets) and Class A represents a lower portion of the sample (11.5 versus 22.5 percent), each FC has an average of two comparable DC transactions and all the differences between FCs and DCs are minimal.
Once the three matched sampling procedures are applied, the next step in the empirical analysis is to estimate a hedonic regression model with transaction price per square foot (Price per SF), logged, as the dependent variable. The model is written as:
ln(Price per SF) = ß0 + ß1∙ln(Age) + ß2∙ln(RBA) + ß3∙Class A + ß4∙Class B + ß5∙FCs + ∙X + .
Property age (Age) and building size (RBA) are logged. Class A and Class B are indicator variables for property class. FCs is an indicator variable for FCs, used to measure the baseline valuation difference between FCs and DCs. X is a matrix of control variables. is a vector of parameters. For the estimations using propensity score matched samples, X includes indicator variables for 38 markets and 23 calendar years. For the characteristic matched samples, X is a set of indicator variables for each matched sample, controlling fixed effects of the characteristic sets.

32 | Are E-commerce Fulfillment Centers Valued Differently Than Warehouses and Distribution Centers?

NAIOP RESEARCH FOUNDATION-FUNDED RESEARCH
Available at www.naioprf.org
Industrial Demand Forecast, Third Quarter 2015 Report
Economic Impacts of Commercial Real Estate, 2015 Edition
Exploring the New Sharing Economy (2015)
The Promise of E-commerce: Impacts on Retail and Industrial Real Estate (2015)
Select U.S. Ports Prepare for Panama Canal Expansion (2015)
Preferred Office Locations: Comparing Location Preferences and Performance of Office Space in CBDs, Suburban Vibrant Centers and Suburban Areas (2014)
Workplace Innovation Today: The Coworking Center (2013)
Performance and Timing of Secondary Market Investment Activity (2013) Stabilization of the U.S. Manufacturing Sector and Its Impact on Industrial Space (2013)
The Complexity of Urban Waterfront Redevelopment (2012)
The New Borderless Marketplace: Repositioning Retail and Warehouse Properties for Tomorrow (2012)
A Development Model for the Middle Ring Suburbs (2012)
How Fuel Costs Affect Logistics Strategies (2011)
Solar Technology Reference Guide (2011)
“The work of the Foundation is absolutely essential to anyone involved in industrial, office, retail and mixed-use development. The Foundation’s
projects are a blueprint for shaping the future and a road map that helps to ensure the success of the developments where we live, work and play.”
Ronald L. Rayevich, Founding Chairman NAIOP Research Foundation

We’re Shaping the Future
2201 Cooperative Way, Suite 300 Herndon, VA 20171-3034
703-904-7100 www.naioprf.org