arctic temperature response to changes in … · arctic temperature response to changes in ......
TRANSCRIPT

Arctic temperature response to changes in emissions of short-lived climate forcers
Maria Sand, Terje K. Berntsen, Knut von Salzen,Mark G. Flanner, Joakim Langner, and David G. Victor

AMAP organization and charge
• Report (published in late 2015) motivated to understand Arctic climate impacts and mitigation opportunities associated with emissions of short-lived climate forcers (including aerosols, ozone, methane) from different regions and sectors
• Report focuses on temperature impacts. Key modeling results from the report are described by Sand et al (2015, Nature Climate Change)
• In no way do these studies undercut the importance of CO2 as the main anthropogenic driver of Arctic climate change

Forcing agents considered• Black carbon (BC)• Organic carbon (OC)• Sulfate (via SO2 emission precursor)• Ozone (via NOx, CO, VOC emission precursors)

Models applied in the assessment• CESM 1.1.1 (CAM5.2 with MAM7 aerosols)
– Aerosol direct+snow/ice RF• CanAM 4.2
– Aerosol direct+indirect+snow/ice RF• NorESM (Cam-Oslo aerosol module)
– Aerosol direct+indirect RF• Oslo-CTM2
– O3 direct RF• SMHI-MATCH
– Aerosol direct + O3 direct RF

∆T > 0
∆T < 0 ∆T > 0 ∆T > 0∆T > 0
dzdθ
The direct effectIndirect effect
The ‘semi-direct’ effect
The snow/ice darkening effect
SWLW
Small perturbations, large variability
http://www.doctordisruption.com/
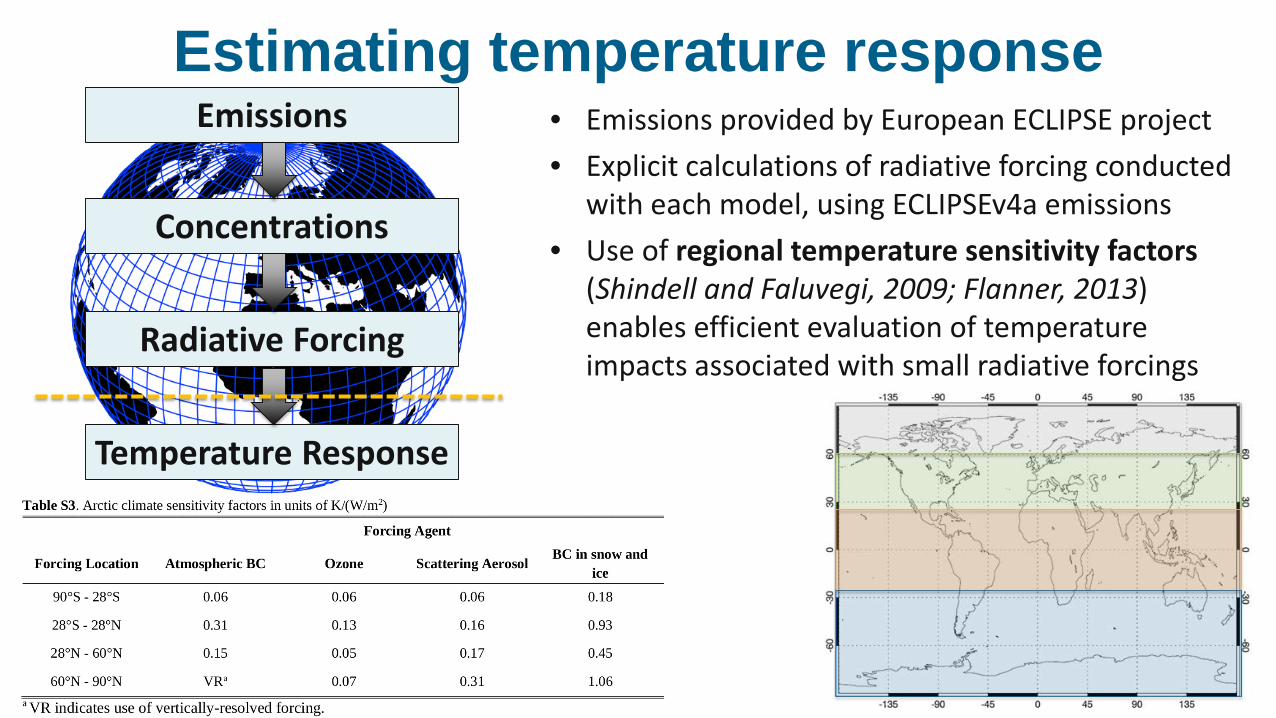
• Emissions provided by European ECLIPSE project• Explicit calculations of radiative forcing conducted
with each model, using ECLIPSEv4a emissions• Use of regional temperature sensitivity factors
(Shindell and Faluvegi, 2009; Flanner, 2013) enables efficient evaluation of temperature impacts associated with small radiative forcings
Emissions
Concentrations
Radiative Forcing
Temperature Response
Estimating temperature response
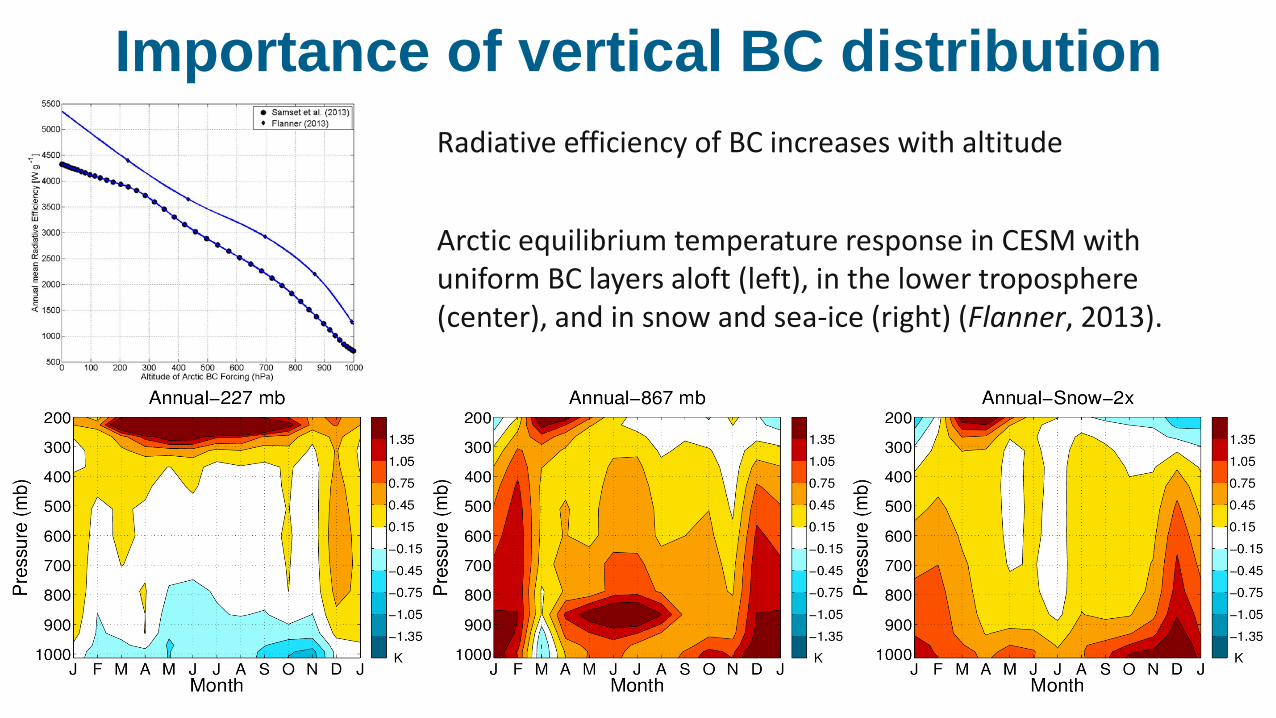
Importance of vertical BC distribution
Arctic equilibrium temperature response in CESM with uniform BC layers aloft (left), in the lower troposphere (center), and in snow and sea-ice (right) (Flanner, 2013).
Radiative efficiency of BC increases with altitude
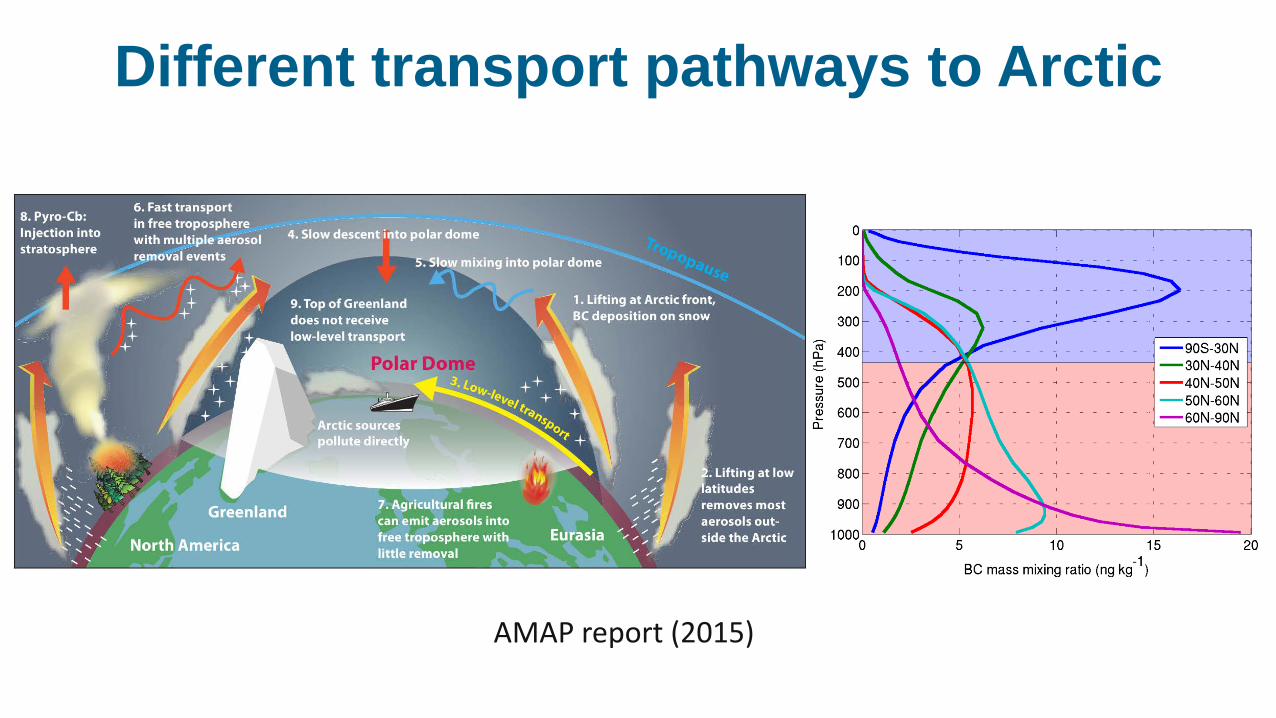
Different transport pathways to Arctic
AMAP report (2015)
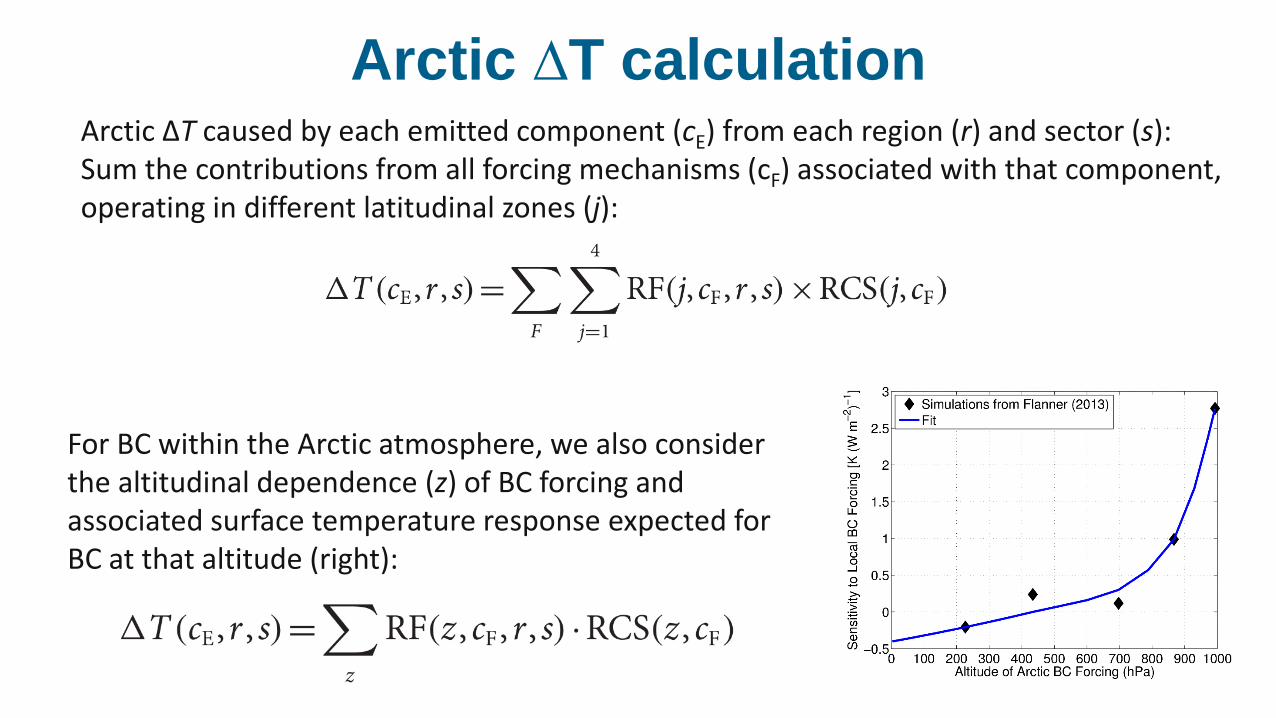
Arctic ∆T calculationArctic ∆T caused by each emitted component (cE) from each region (r) and sector (s): Sum the contributions from all forcing mechanisms (cF) associated with that component, operating in different latitudinal zones (j):
For BC within the Arctic atmosphere, we also consider the altitudinal dependence (z) of BC forcing and associated surface temperature response expected for BC at that altitude (right):
Black Carbon emissions
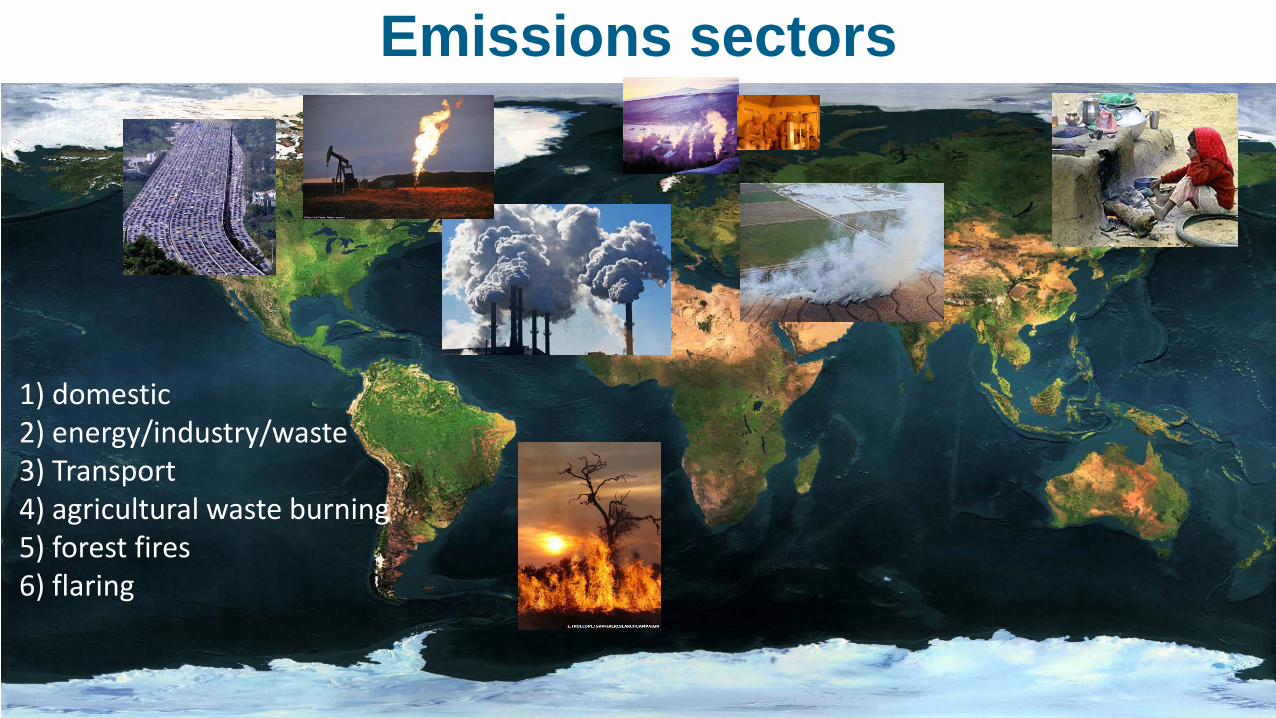
1) domestic2) energy/industry/waste 3) Transport4) agricultural waste burning5) forest fires6) flaring
Emissions sectors
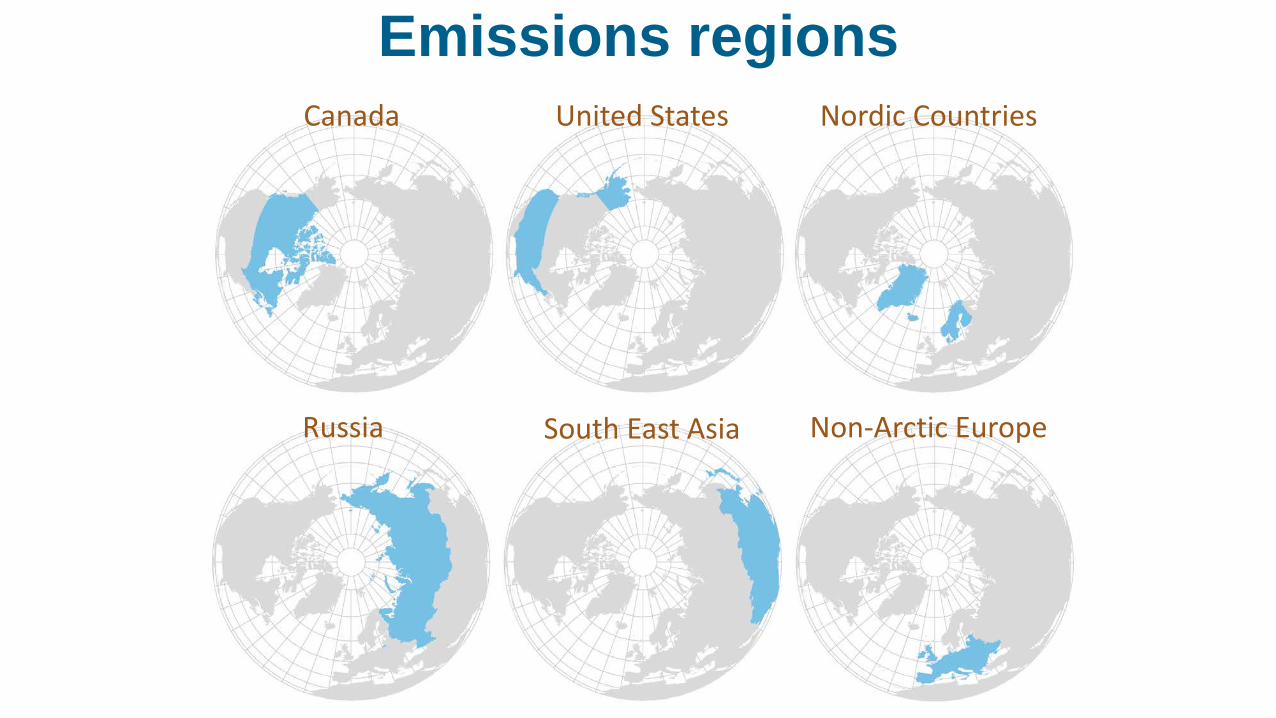
Canada United States Nordic Countries
South East AsiaRussia Non-Arctic Europe
Emissions regions
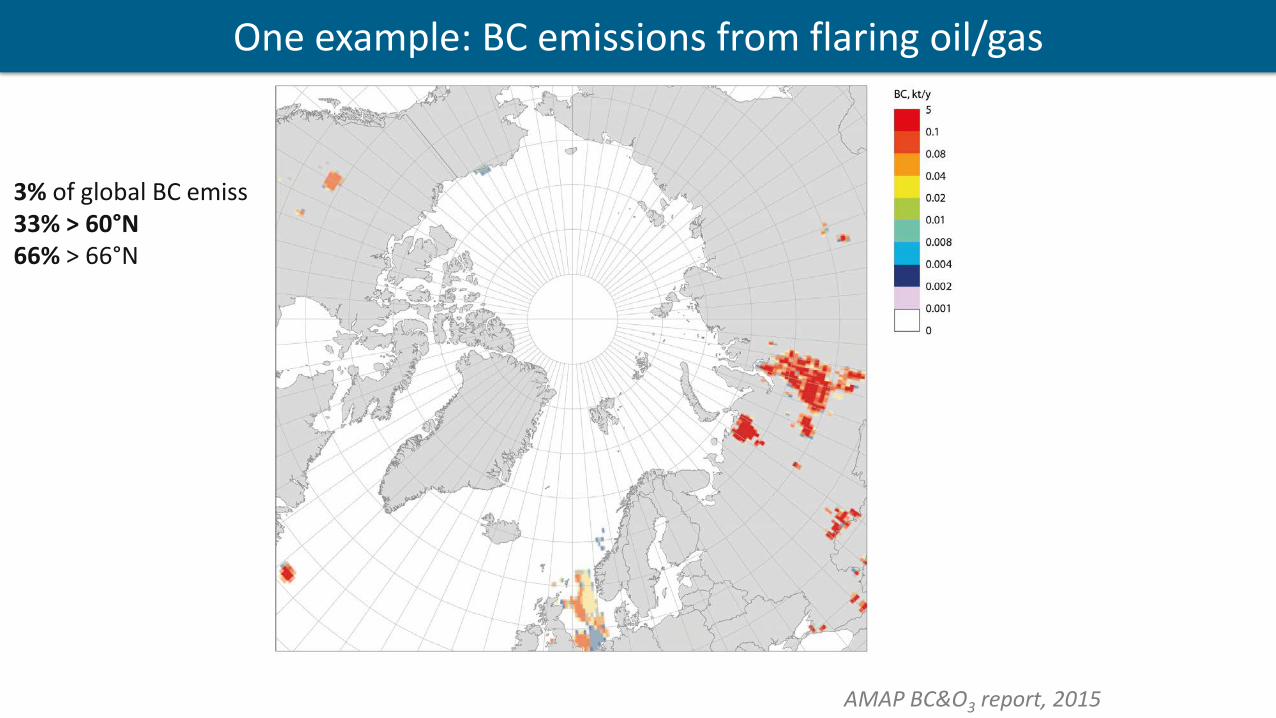
One example: BC emissions from flaring oil/gas
AMAP BC&O3 report, 2015
3% of global BC emiss 33% > 60°N 66% > 66°N

JANUARY
One example: BC emissions from flaring in Russia

FEBUARY
One example: BC emissions from flaring in Russia

MARCH
One example: BC emissions from flaring in Russia

APRIL
One example: BC emissions from flaring in Russia

MAY
One example: BC emissions from flaring in Russia

JUNE
One example: BC emissions from flaring in Russia

JULY
One example: BC emissions from flaring in Russia

AUGUST
One example: BC emissions from flaring in Russia
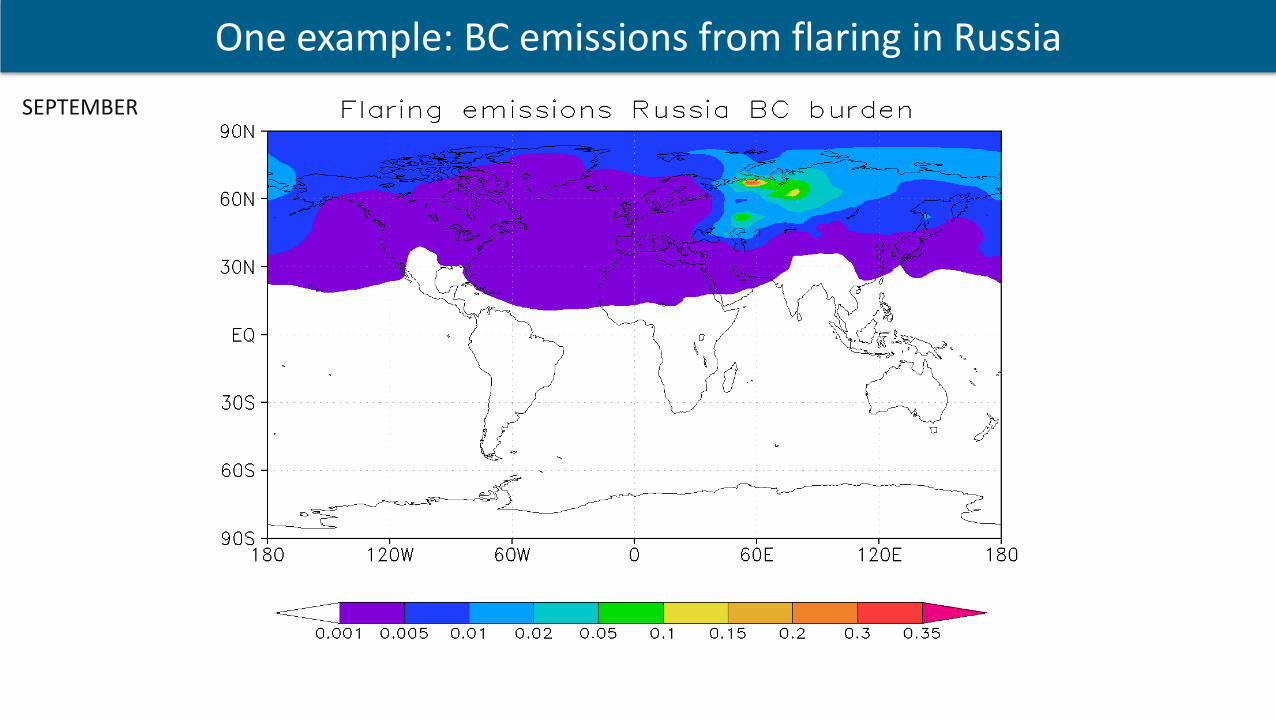
SEPTEMBER
One example: BC emissions from flaring in Russia

OCTOBER
One example: BC emissions from flaring in Russia
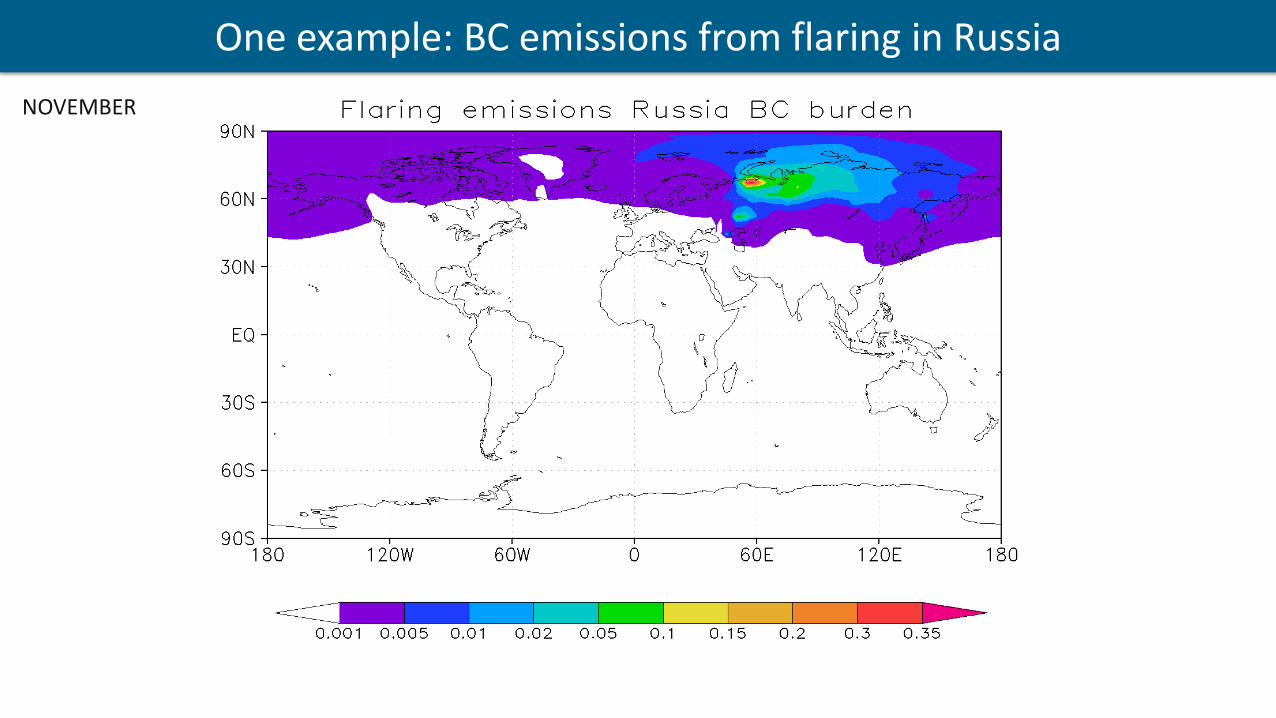
NOVEMBER
One example: BC emissions from flaring in Russia

DECEMBER
One example: BC emissions from flaring in Russia

Arctic surface temperature change
1) domestic2) energy/industry/waste 3) Transport4) agricultural waste burning5) forest fires6) flaring
1 234 5 6
Sand et al. (2015)
4
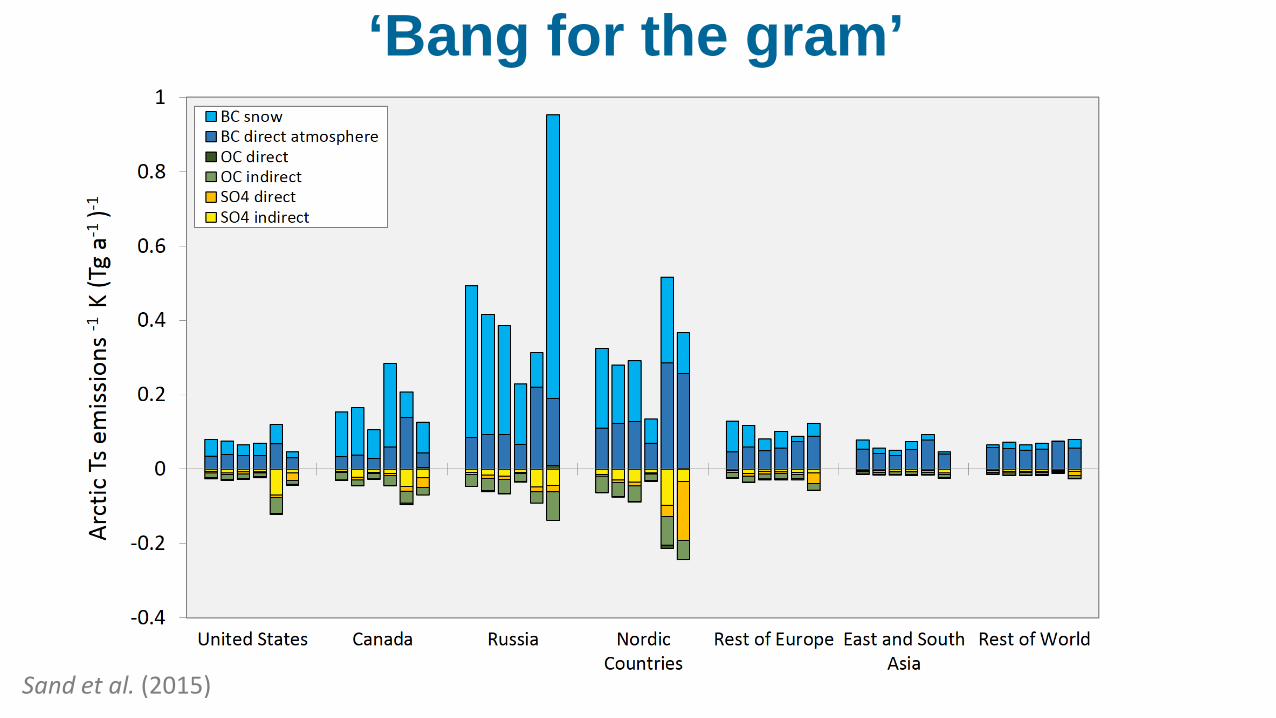
‘Bang for the gram’
Sand et al. (2015)

Total Arctic ∆Teq from all global emissions
• All SLCFs considered: −0.44 (−1.02 to −0.04) K• BC in atmosphere and snow: +0.48 (0.33 to 0.66) K• OC: −0.18 (−0.30 to +0.03) K• SO4: −0.85 (−1.29 to −0.57) K• O3: +0.05 (+0.04 to +0.05) K• Arctic 1900–2015 ∆T: about 2.0 K • Arctic 1900–2005 ∆T due to all non-GHG forcing agents:
about −1.0 K (Fyfe et al, 2013)

Future mitigation potential• A global emissions scenario was designed that is beneficial for
both air quality and short-term climate impacts (and thus most likely to be politically feasible)– Scenario includes large reductions in BC-rich sources– Mitigation actions begin in 2015, completed by 2030
• Climate impacts assessed out to 2050, using model-mean ∆Teq’s and impulse response functions (Boucher and Reddy, 2008):
• Transient climate response compared with that of a baseline (“current legislation”) emissions scenario, both with RCP6.0 CO2
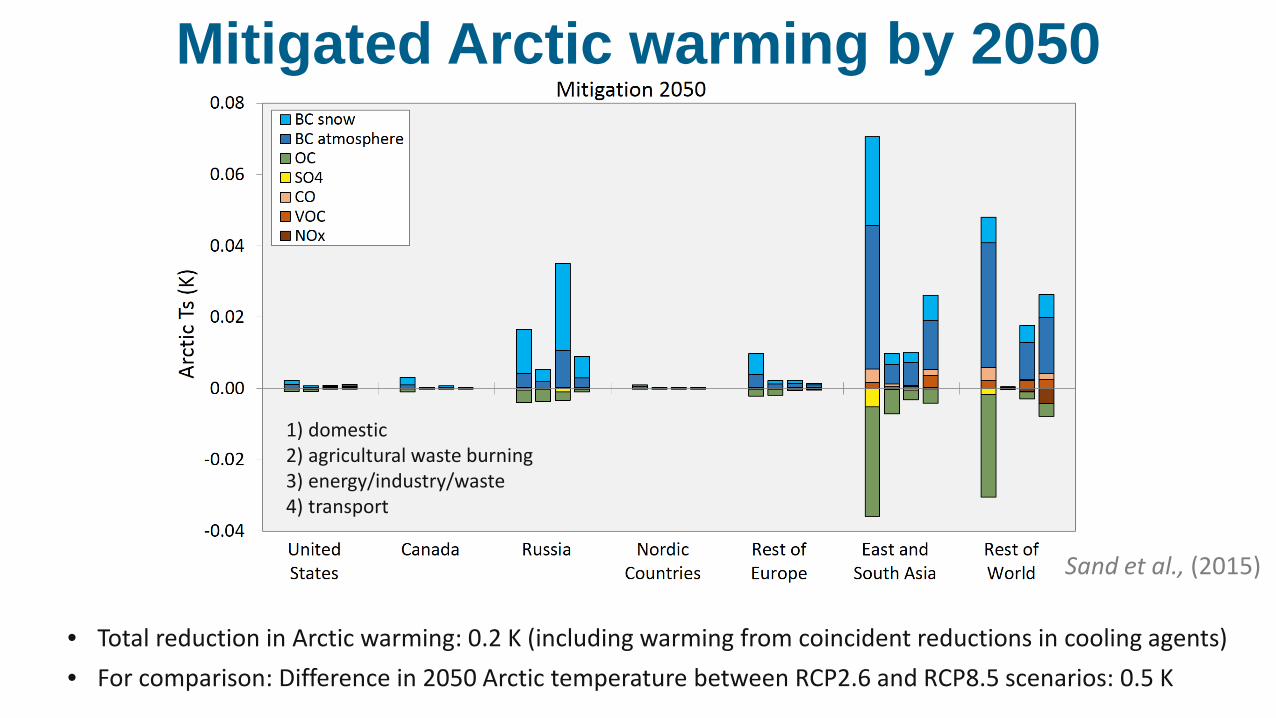
1) domestic2) agricultural waste burning3) energy/industry/waste 4) transport
Sand et al., (2015)
Mitigated Arctic warming by 2050
• Total reduction in Arctic warming: 0.2 K (including warming from coincident reductions in cooling agents)• For comparison: Difference in 2050 Arctic temperature between RCP2.6 and RCP8.5 scenarios: 0.5 K

Transient sea ice changes
• Mitigation measures produce a small, but statistically significant reduction in 2050 Arctic sea ice loss in all 4 participating models
• Explicitly simulated temperature changes agree to within ∼20% of those calculated with the RCS technique

Model Evaluation• Simulated Arctic aerosol distributions
from ECLIPSE models evaluated extensively by Eckhardt et al (ACP, 2015)
• Decent model-mean, annual-mean agreement, but many models (including CESM) simulate too little surface BC during winter/spring and too much during summer
• All models simulate too little BC at Tiksi

Using global transport models with advanced aerosol-radiation-cloud and aerosol-radiation-snow schemes and climate sensitivity factors we find:1. Domestic emissions from Asia warm the Arctic, mostly via remote forcing
Russian gas flaring also warms, mostly via local BC deposition on snow2. The Energy+Industry+Waste sector cools the Arctic via high SO2 emissions3. Russian and Nordic emissions are low, but could be cost-effective targets
because the Arctic is most sensitive to emissions from these regions4. All current BC emissions warm the Arctic by about 0.5 K
All SO2 emissions cool the Arctic by about −0.85 K5. A feasible, but aggressive emission mitigation scenario could reduce 2050
surface temperatures in the Arctic by 0.2 K (± 0.17)6. Substantial uncertainties originate from RCS factors and cloud-indirect effects
Conclusions: SLCF impacts on the Arctic
Thanks!