arcgis explorer: creating a watershed boundary map 2013... · purdue extension: indiana watershed...
TRANSCRIPT

Purdue Extension: Indiana Watershed Leadership Academy Local Watershed User Guides: Andrea Bolks
2013
ArcGIS Explorer: Creating a Watershed Boundary Map
To add a watershed boundary for your watershed to ArcGIS Online you will either need to have your watershed as a shapefile, be willing to draw the approximate boundary, or it must be part of a map service such as the National Watershed Boundary Dataset (goes down to a HUC12).
What is a map service: http://webhelp.esri.com/arcgisserver/9.3.1/java/index.htm#what_is_a_map_service.htm
You will need an ArcGIS Online account. To get an ArcGIS Online account (free Public Account) go to: https://www.arcgis.com/home/signin.html
To watch the video Tutorial of this Guide: Part 1: http://youtu.be/T2de78B24O8
Part 2: http://youtu.be/XgkuUFjubw8
This guide is meant to help create a map of watershed boundaries for local watershed groups to use as a graphic (that can be used for input into the Data2Maps tool) and as a map that can be shared online. With ArcGIS Online you can
create maps to view, share, and present GIS data.

1. Log into ArcGIS Online
Once you have created an account, sign into ArcGIS Online: https://www.arcgis.com/home/signin.html?
2. Open map
You can either open a map you have already created (such as the map in guide #1 with monitoring locations) or create a new map. The important part is that the map is opened in ArcGIS Explorer Online (which has more functionally than the general map viewer.
New Map:
To open a new map, go to: http://www.arcgis.com/explorer/ log in and click “New Map” in the upper right hand corner of the screen.
Existing Map:
To open an existing map, log into your ArcGIS Online account https://www.arcgis.com/home/signin.html and click on “My Content.”
Click on the map title you want to open and then click the arrow on the right side of “open” and select “Open in ArcGIS Explore Online.”
3. Adding Watershed Boundaries
Add Watershed Boundary by either:
A) Adding a shapefile
B) Querying a map service such as the National Watershed Boundary Dataset (WBD)
C) Drawing the approximate boundary with the “note” tool

A) Adding a watershed boundary shapefile (can be a line or polygon)
A shapefile is made up of 6 separate files. In order to upload a shapefile to ArcGIS Online you need to create a zip file with all of these files. To do this, highlight the 6 files and right click on the highlighted area. Click “Add to Zip File.”
At the end of the “Add to archive” line of text, add the name of the zip file you want to create and click “Add.”
In ArcGIS Explorer Online click the add content button and choose “Import” and “shapefile.”
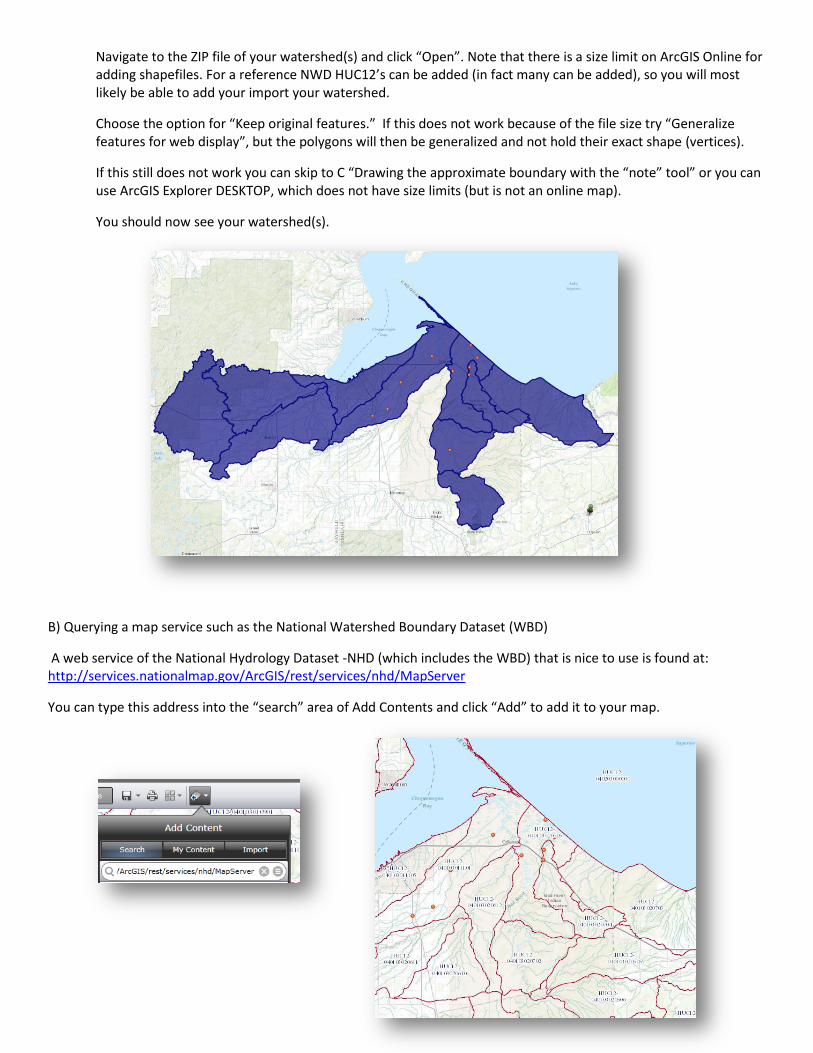
Navigate to the ZIP file of your watershed(s) and click “Open”. Note that there is a size limit on ArcGIS Online for adding shapefiles. For a reference NWD HUC12’s can be added (in fact many can be added), so you will most likely be able to add your import your watershed.
Choose the option for “Keep original features.” If this does not work because of the file size try “Generalize features for web display”, but the polygons will then be generalized and not hold their exact shape (vertices).
If this still does not work you can skip to C “Drawing the approximate boundary with the “note” tool” or you can use ArcGIS Explorer DESKTOP, which does not have size limits (but is not an online map).
You should now see your watershed(s).
B) Querying a map service such as the National Watershed Boundary Dataset (WBD)
A web service of the National Hydrology Dataset -NHD (which includes the WBD) that is nice to use is found at: http://services.nationalmap.gov/ArcGIS/rest/services/nhd/MapServer
You can type this address into the “search” area of Add Contents and click “Add” to add it to your map.

This service is particularly nice to use because it includes labels of the HUCs within the service.
Zoom in and out of the map and note that the HUC level changes based on how far in/out you are zoomed.
If you zoom in far enough you will see stream flowlines. This is because the service also includes the High
Resolution NHD.
Click on the arrow of the control bar on the left side of the screen. The 3 tabs include layers, add features (which
means adding map notes) and a map legend. Click on the “layers” tab (top). Inside the layers tab you will see the
nhd. Click the arrow to the right of the nhd.
These are all of the layers within the feature. You can turn on/off layers here if you with. Note that If you turn off a HUC level nothing with appear when you are zoomed to that extent (so I would not recommend it).
At the top of the service you will see a “Configure Pop-ups” button. Click it.
For each of the HIC levels and any of the others that you wish, click “Add .” This enables pop’ups when the
features on the map are clicked on. When finished, click the back arrow at the top left of the control.

Now try clicking on a watershed, a pop-up should appear. This is a good way to get to know the watersheds in
your area and investigate the HUC #’s if needed. Write down the HUC #’s that you wish to show as a separate
layer on your map if the general service does not meet your needs 9and note which level HUC- such as HUC12.
Click on the Queries button above the map and in the control click the “New Query” button.
Select the layer you wish to Query (the HUC # that you have chosen) and click “OK.”
Write a Query name at the top of the display (this will be the layer name).
Click on the “Data” tab to investigate the data. Note that the HUC12 #’s are within a field named “HUC_12.” Not
all data is shown here, just some example data so you can get a feel for what’s inside. Click back to the “Query”
tab.
Now we need to write an expression for what HUC’s we want to query. Select something like “HUC_12” and
“Equal” and type in a HUC12 that you with to show (such as” 040103020705”) and click “add.” You will need a
new query for each watershed you want to show, unless you want to some something like all the HUC12’s
within a HUC10, in which case you could write an expression to say “HUC_12” “contains” and type in the HUC10
(because these will be the 1st 10 numbers if the HUC12, so the HUC12’s will contains this HUC10 string.

The query will start to execute and it might take some time. If your query didn’t work and you need to make
some edits click on the queries tab (which is not added to your control). Click the “organize” button on the
bottom right and the “properties” button to the right of the Query Name. Click “done” on the control when you
have finished editing the query.
Once you have the watershed (s) you queried, click the small light blue “more” button on the bottom of the
Query Results. Click “create layer.”
You can click the “x” to close the “query Results” window.
In the control, click on the “layers” tab (top tab). Notice that your layer (from the query) has been added to the
map. Don’t’ worry of it isn’t visible, however. The layer keeps the properties of the service it came from and will
only be visible is you are zoomed in/ out to the correct range. To change this so that the layer is visible at all
scales click the arrow next to the layer name. Click “configure” under “Scale Range.”
For both the Minimum and Maximum Scales choose “None.” Click “Done” and click the back arrow in the upper left. You can also change the pop-up for the watershed here.

C) Drawing the approximate boundary with the “note” tool
In Online you can make what are called “notes.” In ArcGIS Explorer online they are also referred to as “features.”
Click the tab on the control “Add Features.” If you get the message “Click here to turn on layer visibility” click it and click the check box next to the “Map Notes” and then click back to the “Add Features” tab.
If you have deleted “Map Notes” from the contents you will need to open the map in the normal online viewer by going to your ArcGIS Online Accent, clicking on the “Content” button, clicking on your map, clicking the arrow next to “open” and choose “Open in ArcGIS.com Map Viewer.” Click the “Add button” select “Add Map Notes.” Save the map and open in ArcGIS Explorer Online.
Click on the “freehand Area” to draw a watershed boundary. Draw the boundary by left clicking and holding
down until you have completed the watershed.
To edit the shape click on the watershed and click
“Edit” in the pop-up. Choose “edit shape.”
Click outside the shape to un-select it, and then
double click on the shape to edit the vertices (or
click the “edit Vertices” button at the top of the
map.
Zoom in to the vertices and move around to do
more detailed editing of the shape.

When satisfied, click “Done” in the upper left hand side of the screen.
4. Changing the Symbology:
How the points are shown in your map (color, size and style) is called the Symbology. This can easily be changed
to better suite what you would like.
A & B) Change the Symbology of Shapefiles or Tables that were added
In the ArcGIS Explorer Online control m click the “layer” tab and click the arrow next to the layer that you wish to change the symbology of.
Click “Configure” under “display” and click the arrow next to “Current Symbol.”
Choose the symbol you wish and change the specifics as such as
opacity and the outline width at the bottom of the Symbol Style
display.
Click the back arrow in the display when finished and click “done.”

C) Change the Symbology of Map Notes
To change the symbology of a map note (also called “features” in ArcGIS Explorer Online) click on the map note
in the map. Click “edit” in the pop-up and choose “Change Symbol.”
Choose the style and color of the watershed and click the “x” when finished.
To change the opacity of a map note click the “layers” tab in the control and click the arrow next to the map
notes . Change the opacity with the “Opacity” bar.”
5. Bookmarking a View
Find the best view of the map includes all of your sampling
locations by zooming in and out and banning to a location
in which all of your sampling points are visible.
Click on the button “bookmarks” above you map and click
“+” to add a new bookmark and click “OK.” Now any time
you click on this bookmark the map will go back to this
location.

6. Changing the Basemap
Click the basemaps button on the top of the map. There are many options to choose from and you can switch
between different basemaps for different purposes.
7. Save your Map.
Now, if you have not done so already, is a good time to save your map. Click on the button “Save” and save the
map to your account. You need to add at least on “tag” which are words that you would use to search for the
map. Such as “__Watershed”
8. Creating a Map Image and Sharing the Online Map
Map Image:
If you would like to use this map as a mage image (to add to a website, document or to use in a program such as
Data2Maps) you will need to take a screenshot. There are different programs that will do this as well as
keyboard commands that you can use (which vary by computer type). Try goggling something like “screenshot
Windows 7” to get instructions on how to take a screenshot. You probably want to choose just the area of the
map and not the entire computer screen. Windows 7 has a built in capturing program under Start > All Programs
> Accessories > Snipping Tool.
Online Map Sharing
To share the online map click the “Share” button on the top of the map. You can choose to make the map
Everyone (public) or to share with a group (you would need to create a group and have members create
accounts and add to your group). To add the map to something like a Facebook page or website the map will
need to be shared to Everyone (public).

Once you have clicked “Everyone (public) you can then copy and paste the link and send to others to open via
email, click the Facebook or Twitter options to add to your social media pages, click “Embed in Website” to add
to your website or even “Make a Web Application” for advanced options on sharing your map (such as
comparing different maps side by side).
9. Accessing your Map
You can click the “home” tab in the upper left hand corner to see/open your other maps in ArcGIS Explorer
Online.
The map you saved will always be available under My Content in your ArcGIS Online Account (where you can
choose to open in Viewer or Explorer Online).
This research was supported in part by an appointment to the Postgraduate Research Participation Program to the U.S. Environmental Protection
Agency, administered by the Oak Ridge Institute for Science and Education through an interagency agreement between the U.S. Department of Energy
and EPA.