arabidopsis transcript and metabolite profiles: ecotype
TRANSCRIPT

Arabidopsis transcript and metabolite profiles:ecotype-specific responses to open-air elevated [CO2]
PINGHUA LI1*, ELIZABETH A. AINSWORTH1,4, ANDREW D. B. LEAKEY1,3, ALEXANDER ULANOV2,VERA LOZOVAYA2, DONALD R. ORT1,3,4 & HANS J. BOHNERT1,2,3
1Department of Plant Biology, 2Department of Crop Sciences, 3Institute for Genomic Biology, University of Illinois atUrbana-Champaign, Urbana, IL 61801, USA and 4Photosynthesis Research Unit, USDA-ARS, Urbana, IL 61801, USA
ABSTRACT
A Free-Air CO2 Enrichment (FACE) experiment comparedthe physiological parameters, transcript and metaboliteprofiles of Arabidopsis thaliana Columbia-0 (Col-0) andCape Verde Island (Cvi-0) at ambient (~0.375 mg g-1) andelevated (~0.550 mg g-1) CO2 ([CO2]). Photoassimilate poolsizes were enhanced in high [CO2] in an ecotype-specificmanner. Short-term growth at elevated [CO2] stimulatedcarbon gain irrespective of down-regulation of plastidfunctions and altered expression of genes involved in nitro-gen metabolism resembling patterns observed underN-deficiency. The study confirmed well-known characteris-tics,but the use of a time course,ecotypic genetic differences,metabolite analysis and the focus on clusters of functionalcategories provided new aspects about responses to elevated[CO2]. Longer-term Cvi-0 responded by down-regulatingfunctions favouring carbon accumulation, and both ecotypesshowed altered expression of genes for defence, redoxcontrol, transport, signalling, transcription and chromatinremodelling. Overall, carbon fixation with a smaller commit-ment of resources in elevated [CO2] appeared beneficial,with the extra C only partially utilized possibly due to dis-turbance of the C : N ratio. To different degrees, bothecotypes perceived elevated [CO2] as a metabolic perturba-tion that necessitated increased functions consuming orstoring photoassimilate, with Cvi-0 emerging as morecapable of acclimating. Elevated [CO2] in Arabidopsisfavoured adjustments in reactive oxygen species (ROS)homeostasis and signalling that defined genotypic markers.
Key-words: Arabidopsis ecotypes; elevated CO2; FACE;metabolite profiling; transcript profiling.
INTRODUCTION
Projections about global atmospheric [CO2] assume anincrease to ~0.550 mg g-1 by 2050 (Prentice et al. 2001),which may be expected to lead to significant beneficial
impact on plants in managed and natural ecosystems. C3
plants can respond to elevated [CO2] with increased photo-synthesis, growth and productivity as well as reducedstomatal conductance (gs), promoting not only lower tran-spiration but also possibly less evaporative cooling (seeAinsworth & Rogers 2007 for a review). While photosyn-thesis (A) is generally increased in C3 plants at elevated[CO2], the down-regulation of photosynthesis in elevated[CO2], including reduced ribulose 1·5-bisphosphatecarboxylase/oxygenase (Rubisco) content and maximumapparent carboxylation capacity (Vc,max), may affect meta-bolic homeostasis, which could then constrain the overallstimulation of carbon fixation (Cheng, Moore & Seemann1998; Ainsworth et al. 2007). At elevated [CO2], decreasesin Rubisco and overall N-content are associated withincreases in sugars and starch, and increased concentrationsof secondary metabolites and structural components(Ludewig et al. 1998; Peñuelas & Estiarte 1998; Castellset al. 2002). However, significant variation exists at the levelof physiological responsiveness and the magnitude ofincreases in productivity to elevated [CO2] across speciesand ecotypes (Bazzaz et al. 1995; Long et al. 2004;Ainsworth et al. 2007). How such intra- and interspecificphysiological plasticity is grounded in genetic organizationand molecular regulation is largely unknown.
Molecular bases for responses to elevated [CO2] havebeen measured in poplar trees grown in the field (Guptaet al. 2005; Taylor et al. 2005). After long-term exposureto elevated [CO2], transcript abundance differences weredependent on leaf developmental age. Transcripts thatshowed differences in the comparison of ambient versuselevated [CO2] included many chloroplast-related functionsas down-regulated, while functions associated with develop-ment, defence and signalling showed increased expression(Gupta et al. 2005; Taylor et al. 2005). Effects of elevated[CO2] on gene expression in FACE-grown soybeans con-trasted growing and mature leaves (Ainsworth et al. 2006).Apart from differences that revealed developmental stagedifferences, such as the machineries required to promotethe growth of cells, the analysis identified ([CO2] ¥development) interactions. Elevated [CO2] stimulated cellgrowth and differentiation in young leaves compared withleaves in ambient air. The [CO2]-specific portion of thetranscript profile indicated increased conduits directing
Correspondence: H. J. Bohnert. Fax: +1 217 333 5574; e-mail:[email protected]
*Present address: Department of Molecular Biology and Genetics,Cornell University, 317 Biotechnology Building, Ithaca, NY 14853,USA
Plant, Cell and Environment (2008) 31, 1673–1687 doi: 10.1111/j.1365-3040.2008.01874.x
© 2008 The AuthorsJournal compilation © 2008 Blackwell Publishing Ltd 1673

carbohydrates into respiratory pathways for energy-producing and anabolic reactions. A recent study thatfocused on amino acids (Ainsworth et al. 2007) reported[CO2]-dependent disturbances in amino acids, with the dis-turbance of the Glu/Gln ratio persisting independent of leafage and time.
To harness the evolutionary diversity of Arabidopsisthaliana (Duarte et al. 2006) and make use of the toolsavailable for this species, mature, pre-flowering Arabidopsisecotypes were exposed to ambient and elevated [CO2] todetermine how fast and to what extent the lines acclimatedto the rapid change in carbon availability. We used field-grown plants (http://www.soyface.uiuc.edu), where therapid growth of the plants, high rates of photosynthesis andenhanced carbohydrate metabolism were measured in thebackground of normal abiotic and biotic stress conditions(Miyazaki et al. 2004).
From a collection of Arabidopsis ecotypes, Columbia-0(Col-0) and Cape Verde Island (Cvi-0) were selectedbased on their performance and evolutionary history.Adapted to different environments, they showed differentphysiological responses in elevated [CO2] in the field (Liet al. 2006). Expanding on earlier observations, transcriptand metabolite profiles were recorded at two time pointsof growth in FACE. The two ecotypes responded differ-ently to elevated [CO2], with Cvi-0 experiencing less meta-bolic perturbation, apparently adapting to changes fasterthan Col-0. The transcript and metabolite profiles alikeindicated a disturbance of nitrogen metabolism in thebackground of high carbon gains, which might haveaffected the C : N sensing early during the growth of theplants in the field.
MATERIALS AND METHODS
Plant material and CO2 exposure
Arabidopsis thaliana ecotypes Col-0 and Cvi-0 plants weregerminated and grown in fertilized soil in 0.5 ¥ 0.2 ¥ 0.3 mtrays in a growth room (150 mmol m-2 s-1, 24 °C) until theyreached the early rosette stage (3 weeks). After 5 d in agreenhouse, the plants were transferred to the SoyFACEfacility (http://www.soyface.uiuc.edu; Miyazaki et al. 2004;Li et al. 2006). The plants in three plots (ambient air)experienced current [CO2] of 0.375 mg g-1, while theplants in three CO2 plots (elevated CO2) were treatedwith [CO2] of 0.550 mg g-1, simulating the expected envi-ronment in 2050. Weather reports accompanying theentire experiment can be found at http://www.soyface.uiuc.edu/weather.htm.
Plants of a comparable developmental stage used formicroarray and metabolite analyses were harvested in 21and 27 June at 9:00–10:00 am. Aboveground material wascollected from 10 plants (as a pool) in each ring, immedi-ately frozen in N2, and stored at -80 °C for both RNAextraction and metabolites assay. The climatic conditionsfor the 24 h time period before harvest and during harvestare provided in Supporting Information Table S1.
Physiological parameters
Pre-dawn 14 June, immediately prior to transfer from theglasshouse to the field, the maximum, dark-adaptedquantum yield of photosystem II (PSII) (Fv/Fm) of fullyexpanded leaves was measured using a pulse-modulatedchlorophyll fluorescence system (FMS2; Hansatech Instru-ments, King’s Lynn, Norfolk, UK). Measurements wererepeated in the field pre-dawn in 15, 17 and 19 June. Netphotosynthetic CO2 assimilation (A), stomatal conduc-tance (gs) and intercellular leaf [CO2] (ci) were measuredwith a standard gas exchange system with 1 cm2 leafchamber (LI-6400 and LI-6400-40; Li-Cor, Inc., Lincoln,NE, USA) on 19 June between 11:00 and 14:00 h withambient conditions of photosynthetic photon flux density(PPFD) (1250 mmol m-2 s-1), air temperature (27 °C),relative humidity (RH) (�65%) and treatment [CO2][375 mmol m-2 s-1 (ambient), 550 mmol m-2 s-1 (elevated)].External halogen light was used for constant illuminationduring gas exchange measurements.
In 21 and 27 June, leaves were sampled for chlorophyll,protein and starch determination with standard methods(Porra, Thompson & Kriedemann 1989; Stitt et al. 1989).Five replicates were taken from each experimental plot(n = 3). Dried leaf material was powdered and analysed forN content using an elemental combustion system (Model4010; Costech Analytical, Inc., Valencia, CA, USA).
RNA extraction, microarray hybridizations andmicroarray data analysis
Total RNA from two ambient plots and two elevated [CO2]plots (as two biological repeats) was isolated (CTABmethod; Jaakola et al. 2001) from the pooled plants. PurifiedRNAs (60 mg each, Qiagen RNeasy kit; Qiagen, Carlsbad,CA, USA) from ambient and elevated [CO2] were reversetranscribed (SuperScript III; Invitrogen, Carlsbad, CA,USA), and cDNAs were labelled with Cy3 or Cy5 byindirect labelling (Miyazaki et al. 2004; Li et al. 2006).Microarray slides with >26 000 DNA elements (70-mergene-specific oligonucleotides; Qiagen/Operon, Valencia,CA, USA) were used (http://www.ag.arizona.edu/microarray) (Miyazaki et al. 2004; Gong et al. 2005; Li et al.2006). To avoid bias in microarrays as a consequence ofdye-related differences in labelling efficiency, dye labellingfor each paired sample (elevated CO2/ambient CO2) wasswapped (for details, see the Supporting Information text).
After hybridization, the slides were scanned (GenePix4000B; Axon Instruments, Union City, CA, USA), and spotintensities were extracted (GenePix PRO 6.0). Spots withintensities lower than the background or with an aberrantspot shape were flagged by GenePix software and werechecked manually.
Filtered raw intensity data sets were then analysedusing the R/maanova microarray analysis program(http://research.jax.org/faculty/churchill/software/Rmaanovav.1.8.1). We smoothed the data with the spatial-intensityjoint lowess, and then fitted the data into a mixed-model
1674 P. Li et al.
© 2008 The AuthorsJournal compilation © 2008 Blackwell Publishing Ltd, Plant, Cell and Environment, 31, 1673–1687

analysis of variance (anova) in two stages (normalizationmodelling followed by gene-specific effect modelling) with[CO2] treatment, ecotype and dye as fixed effects, and arrayand sample as random effects. Analyses were based on Fsstatistics, a modified F statistics incorporating James–Steinshrinkage estimates of variance components (Cui et al.2005). Significant changes in expression between elevated[CO2] and ambient [CO2] were determined by calculatingthe P-values for the Fs statistics using 100 random permu-tations with fold changes of at least of 1.3. The P-valueswere adjusted to correct for type I error with the FDRcorrection implemented in R/maanova. Cut-off adjustedP-values were 0.05. Because there were no direct hybrid-ization experiments performed between ecotypes, ecotype-specific genes were picked up by maanova at a morestringent level, with an FDR-adjusted P < 0.05 and a foldchange cut-off of 3.
MapMan visualization
Microarray data (log2 fold change of elevated [CO2] versusambient air) were imported into MapMan (http://gabi.rzpd.de/projects/MapMan/ v. 1.5.0, Thimm et al. 2004),converted to a false colour scale, and used for pathwayand/or functional category analysis.Wilcoxon rank-sum testwas used to predict categories that exhibited a differentbehaviour in terms of their expression profile comparedwith all other remaining categories. Benjamini and Hoch-berg false discovery rate control procedure was used tocorrect the P-values.
Real-time PCR
To verify hybridization results, real-time PCR using SYBR-green (Applied Biosystems, Forster City, CA, USA) andABI PRISM/Taqman 7900 Sequence Detection System(Applied Biosystems) was conducted as described (Li et al.2006). One microgram of RNA from each condition wasused for first-strand cDNA synthesis, and the internalcontrol was actin-3 (Supporting Information Table S2 forprimer sequences). Four repeats were carried out for eachgene, and averaged threshold cycle numbers were used tocalculate changes (log2).
Metabolite profiling
Same pools of plant material used for RNA extraction weredried under N2. Methanol extracts were obtained andderived according to Roessner et al. (2000). Samples of1–2 mL were injected with a split ratio of 8:1. The gaschromatography-mass spectrometry (GC-MS) system con-sisted of an HP5890 gas chromatograph and an HP5970mass selective detector (Agilent, Inc., Palo Alto, CA, USA)and an Rtx-1701 (30 m ¥ 0.25 mm i.d., 0.25 mm film thick-ness) capillary column (Restek, Bellefonte, PA, USA). Datafrom three independent replicates were normalized tothe internal standard (hentriacontanoic acid; 10 mg mL-1).Chromatograms were evaluated as described (Lozovayaet al. 2006).
Methanol : water extracts were dried and extracted with0.1 m HCl (3 ¥ 1 mL) at room temperature, and were cen-trifuged for 10 min at 20 000 g. Supernatants were col-lected, filtered, purified and derived according to Silvaet al. (2003). Samples were dried under N2 and were storedat -20 °C prior to derivation. For GC-MS analysis, bothinjector and detector were at 250 °C. Helium carrier gasflow rate was 1 mL min-1 with a temperature programmefrom 100 (1 min isothermal heating; solvent delay = 3 min)to 280 °C at 20 °C min-1 and 280 °C for 5 min, and massspectra were recorded in the m/z 50–300 range. Peaks werecompared with an electron impact mass spectrum librarycontaining standard spectra of ethylchloroformate (ECF)derivatives and normalized to the internal standard (L-p-chlorophenylalanine; mg mL-1) for comparison amongsamples. The chromatograms and mass spectra were evalu-ated using HP Chemstation (Agilent, Palo Alto, CA, USA)and AMDIS (NIST, Gaithersburg, MD, USA) programs.
Statistical analysis of metabolites
All data from three biological replicates per sample werestatistically analysed by t-test and one-way anova usingthe algorithm incorporated into Microsoft Excel 2002(Microsoft Corporation, Seattle, WA, USA). Multivariatestatistical analysis was performed using principal compo-nent analysis (PCA) (Jobson 1992; Jolliffe 2002) imple-mented in XLSTAT-2007 (Addinsoft, New York, NY,USA). Significance is defined for changes statistically sig-nificant at P < 0.05.
RESULTS
Environmental conditions
After transplanting greenhouse-grown, pre-floweringrosettes (14 June), the plants were sampled on 21 and 27June 2005. The climatic conditions differed on days preced-ing the harvest dates (Supporting Information Table S1A)with average temperatures of 26.4 (21 June) and 30.4 °C(27 June), 52–53% RH on both days, and 1650+/- 10 mmolphotons m-2 s-1, respectively, at both harvest times (0900–1000 h). By 27 June, both ecotypes had begun to flowerirrespective of their location either in elevated [CO2] or inambient conditions.
Leaf gas exchange, chlorophyll fluorescence,soluble protein, chlorophyll and starchcontents during exposure to elevated [CO2]
The maximum quantum yield of PSII (Fv/Fm), measuredpre-dawn immediately before the plants were taken to thefield (14 June), was ~0.80 for both ecotypes (Fig. 1a). Fv/Fm
decreased upon exposure to field conditions (15 June), butrecovered to pre-transfer levels within 3–4 d in the field,suggesting that the plants overcame the initial stressimposed by exposure to the field. Growth at ambient versuselevated [CO2] had no effect on the Fv/Fm response. Under
Arabidopsis responses to elevated [CO2] 1675
© 2008 The AuthorsJournal compilation © 2008 Blackwell Publishing Ltd, Plant, Cell and Environment, 31, 1673–1687

ambient conditions, Cvi-0 exhibited higher rates of photo-synthesis (A) and stomatal conductance (gs) than Col-0.Significant stimulation of A was observed in elevated [CO2]with rates for both ecotypes roughly double than those inambient air (Table 1). Under elevated [CO2], gs changedonly in Col-0, and Ci increased in both ecotypes (Table 1).There was no effect of elevated [CO2] on chlorophyll ortotal soluble protein in 21 June, but decreases were signifi-cant in 27 June in both ecotypes (Supporting InformationFig. S1), and no effect was observed by elevated [CO2] orecotype on the fresh weight to dry weight ratio (data notshown). The effect of elevated [CO2] on starch contentvaried between ecotypes (Fig. 1b). Cvi-0 accumulatedapproximately twice the amount of starch compared with
Col-0 in ambient air. In 21 June, starch content increasedunder elevated [CO2] in Col-0 (130%) and Cvi-0 (25%), butby 27 June, starch increases were less pronounced (Col-0)or barely detectable (Cvi-0). Figure 1c shows the N content(% dry weight) of the plant material used for microarrayanalyses. There was no effect of elevated [CO2] on N inCvi-0, but Col-0 showed a slightly reduced N after exposureto elevated [CO2] at both time points.
Transcript profiles
Gene expression was affected by [CO2] treatment, ecotypeand sampling date. Hierarchical clustering revealed a cor-relation between harvest date and the behaviour of thetranscriptome at the two time points, which clustered sepa-rately (Supporting Information Fig. S2). Furthermore,when calculating the Pearson correlation coefficients of thetranscriptome for the 21 and 27 June harvest dates in bothecotypes, no significant relationship emerged within eachecotype harvested at different dates, but high correlationexisted between ecotypes harvested at the same time (Sup-porting Information Table S1B). The high degree of corre-spondence between harvest date and transcript profiles ofCol-0 and Cvi-0 in response to elevated [CO2] reflects astrong dependence on daily fluctuations in temperature orother climatic factors, and presumably also on the develop-mental state. Indeed, the plants experienced different con-ditions at the two harvest dates (Supporting InformationTable S1A). Further, we first describe transcripts with sig-nificant responses to elevated [CO2] determined by mixed-model anova for both ecotypes, on the first and secondharvest dates, respectively. We then describe changes ingene expression, which differ between ecotypes. Genes forvalidation of microarray hybridizations by qRT-PCR in theecotypes were also selected. The results are represented asthe difference in threshold numbers between ambient andelevated [CO2] after primers had been tested for amplifica-tion in a linear range (Supporting Information Table S2;Supporting Information Fig. S3). Correlation was highoverall, while absolute fold changes diverged between thetwo methods.
The first harvest date
Ecotypes harvested at the same date showed high correla-tion in their gene expression profiles. Mixed-model anova
m–1
Fv /F
m
(a)
(b)
(c)
Figure 1. Physiological parameters of Arabidopsis ecotypes inelevated [CO2]. The data represent the mean (�SD) from threerings (5 repeats per ring, and 10 plants pooled in each ring).(a) Maximum quantum yield of photosystem II (Fv/Fm) measuredbefore and after transfer into the field; (b) starch content;(c) nitrogen content.
Table 1. Photosynthetic gas exchange parameters
Ecotype CO2 A gs Ci
Col-0 Ambient 6.6 � 0.9 0.20 � 0.02 0.320 � 0.013Elevated 11.7 � 0.7 0.14 � 0.02 0.393 � 0.027
Cvi-0 Ambient 11.1 � 2.2 0.26 � 0.10 0.297 � 0.013Elevated 20.7 � 2.2 0.31 � 0.07 0.394 � 0.052
A, light-saturated CO2 assimilation; gs, stomatal CO2 conductance;Ci, intercellular [CO2] (mg g-1) (recorded 19 June 2005).
1676 P. Li et al.
© 2008 The AuthorsJournal compilation © 2008 Blackwell Publishing Ltd, Plant, Cell and Environment, 31, 1673–1687

was applied to investigate similar regulatory trends in tran-script complexity in response to [CO2] across the ecotypes.In 21 June, the [CO2] response indicated 215 transcriptsdown-regulated and 296 up-regulated in both ecotypes ata fold change of at least 1.3 (FDR-adjusted P < 0.05)(Supporting Information Table S3A,B). A significantdown-regulation was observed in both ecotypes ingenes related to photosynthesis including light reactionfunctions, the Calvin cycle and photorespiration (Table 2,Supporting Information Table S3A). Transcripts for thephotosystem (PSI and II) subunits, PsaK, PsaN, PsbQ,PsbW, PsbX and PsbO2, encoding proteins of the PSI/IIcore, assembly and stability, were reduced most sig-nificantly. Decreased expression of transcripts for light-harvesting and electron transport-related proteins wasalso evident. Glyceraldehyde-3-phosphate dehydrogenase(GAPA), whose products are known to interact with CP12proteins in vivo in the Calvin cycle, was coordinately down-regulated along with CP12-1 and CP12-2. Chlororespira-tory reduction 7 (CRR7), encoding a protein of the plastidNAD(P)H dehydrogenase complex involved in chlorores-piration, photosystem I (PSI) cyclic electron transportand [CO2] uptake, and glycine decarboxylase complex H(GDCH) transcript involved in photorespiration were alsosignificantly down-regulated. Chloroplast development andlipid composition were affected, with ACP4 (biosynthesis offatty acids for chloroplast membrane structure) and FAD5(related to thylakoid lipid composition) significantly down-regulated. Overall, genes that centred on chloroplast func-tions were down-regulated irrespective of the physiologicaldata that showed increased carbon assimilation and starchaccumulation in elevated [CO2] (Fig. 1b).
Up-regulated genes emphasized functions in transcriptsrelated to C metabolism and utilization (Table 2, Sup-porting Information Table S3B). Highly expressed genesencoded precursors for functions related to cell walls(UGD, UXS and RHM1), cellulose synthesis enzymes(CESA and CSLC) and cell wall proteins (arabinogalactan-protein and proline-rich extensin), indicating an activeallocation of C to cell walls and also consistent withstarch accumulation by both ecotypes (21 June). Equallyup-regulated were transcripts for a number of genes witha function in glycolysis and organic acid [tricarboxylicacid cycle (TCA) cycle] metabolism including cytosolicphosphoenolpyruvate (PEP)-carboxylase, oxoglutaratedecarboxylase and two ATP-citrate synthases (ACLB1,2). Trehalose phosphate synthase (TPS) and trehalose-6-phosphate phosphatase (TPP), involved in trehalosemetabolism, ATGSL12 involved in callose biosynthesis, andfructokinase involved in starch/sucrose degradation wereinduced by elevated [CO2].
Up-regulated transcripts in the category secondarymetabolism identified functions in the synthesis of anthocya-nins, lignin and flavonoids, exemplified by PAP1, LDOX,PAL1 and DER. Transport-associated transcripts thatincreased included sugar-phosphate transporters (glucose-6-phosphate/phosphate translocator) and amino acid trans-porter (AAP2). Interestingly,many members in the category
vesicle transport were also highly induced in elevated [CO2].The increase of transcripts encoding disease resistance pro-teins, HSPs and dehydration-responsive proteins also indi-cated an active plant response to the environment,which wasslightly enhanced in elevated [CO2]. For the regulated tran-scripts, protein localization was determined as predicted byTargetP (>0.7) and Gene Ontology (GO). In 21 June, mostdown-regulated genes identified plastid-localized proteins,while up-regulated genes specified transcripts for compo-nents of the endomembrane system (Table 2, SupportingInformation Table S3).
The second harvest date
Eighty down-regulated and 232 up-regulated trans-cripts responded to elevated [CO2] in both ecotypes on thesecond harvest date (27 June; Supporting InformationTable S3C,D). At this time point, most transcripts forproteins associated with endomembranes were down-regulated, while the number of functions related to mito-chondria increased slightly (TargetP [>0.7] and GO;Table 2,Supporting Information Table S3).
Many genes involved in carbon utilization showed down-regulation at the second harvest date in plants grown inelevated [CO2], for example, ATCSLC08, possibly a signthat the plants entered senescence. Genes in the categorysecondary metabolism, especially in the flavonoids biosyn-thetic pathway, were also down-regulated in elevated [CO2].Unexpectedly, many histone gene transcripts were down-regulated in both ecotypes, possibly indicating changesin chromatin structure (Table 2, Supporting InformationTable S3C).
A preponderance of transcripts in categories of stress/defence was up-regulated in 27 June (Table 2, SupportingInformation Table S3D). A number of heat-shock proteinswere outstanding, as well as glutathione S-transferases(GSTs), peroxidases, involved in redox scavenging, heat anddrought tolerance. Galactinol synthases (GOLS1&2) alsowas greatly up-regulated in elevated CO2, indicating anactive metabolism related to raffinose biosynthesis andmetabolism.
Ecotype-specific genes
Mixed-model anova based on Fs statistics was applied toidentify differentially expressed genes that distinguishedecotypes. Considering that the plants at the two harvestdates represented different developmental stages and expe-rienced different temperature conditions, the two timepoints were analysed separately. In the absence of directhybridizations between ecotypes, statistical analysis (FDRadjusted to P < 0.05) with a fold-change cut-off of 3 wastaken. In total, 77 genes (21 June) and 215 genes (27 June)showed at least a threefold higher expression in Cvi-0 thanin Col-0 (Table 3, Supporting Information Table S4). In con-trast, 66 (21) and 156 (27 June) transcripts showed a higherexpression in Col-0 compared with Cvi-0 (Table 3, Support-ing Information Table S4).
Arabidopsis responses to elevated [CO2] 1677
© 2008 The AuthorsJournal compilation © 2008 Blackwell Publishing Ltd, Plant, Cell and Environment, 31, 1673–1687

Table 2. Selected genes that differentially expressed between ambient CO2 and elevated CO2 (adjusted P < 0.05)
AGI Short descriptionCol-0log2(E/A)
Cvi-0log2(E/A) Localization
21 June downPhotosynthesisAt1g12900 GAPA-2 (glyceraldehyde-3-phosphate dehydrogenase) -0.46 -0.50 ChloroplastAt1g19150 LHCA6 (photosystem I light harvesting complex gene 6) -0.73 -0.70 ChloroplastAt1g30380 PSAK (photosystem I subunit K) -0.57 -0.51 ChloroplastAt1g60950 FED A (ferredoxin 2) -0.41 -0.42 ChloroplastAt2g06520 PSBX (photosystem II subunit X) -0.50 -0.54 ChloroplastAt2g26500 Cytochrome b6f complex subunit (petM) -0.55 -0.46 ChloroplastAt2g34430 LHB1B1 (photosystem II light-harvesting complex gene 1.4 -0.79 -0.56 ChloroplastAt2g35370 GDCH (glycine decarboxylase complex H) -0.51 -0.66 MitochondrionAt2g47400 CP12-1 (CP12 domain-containing protein 1) -0.56 -0.41 ChloroplastAt3g27690 LHCB2:4 (photosystem II light-harvesting complex gene 2.3) -0.50 -0.54 ChloroplastAt3g50820 PSBO-2 -0.57 -0.59 ChloroplastAt3g62410 CP12-2 -0.55 -0.58 ChloroplastAt4g21280 PSBQ -0.59 -0.61 ChloroplastAt4g28660 PSB28 (photosystem II reaction centre W family protein) -0.91 -0.56 ChloroplastDefence/redoxAt2g25080 ATGPX1 (glutathione peroxidase) -0.64 -0.56 ChloroplastAt4g25100 FSD1 (iron superoxide dismutase) -0.79 -0.63 Chloroplast21 June upAmino acid metabolismAt2g36880 ATBCAT-2 (branched-chain-amino-acid transaminase) 0.75 0.68 ChloroplastAt3g03780 ATMS2 (methionine synthase 2) 0.55 0.69 CytosolAt3g16150 L-asparaginase, putative 0.75 0.43 –At5g49810 MMT (methionine S-methyltransferase) 0.49 0.59 –Carbon metabolismAt1g53310 Phosphoenolpyruvate carboxylase 0.42 0.46 CytosolAt3g06650 ACLB-1 (ATP-citrate lyase B-1) 0.39 0.46 CytosolAt3g55410 2-Oxoglutarate dehydrogenase E1 component, putative 0.41 0.47 MitochondrionAt4g17770 ATTPS5 (trehalose phosphatase/synthase 5) 0.53 0.47 –At4g22590 Trehalose-6-phosphate phosphatase 0.75 0.40 ChloroplastAt5g49460 ACLB-2 (ATP-citrate lyase B-2) 0.68 0.52 CytosolAt5g65690 PEPCK 0.48 0.42 –Cell wallAt1g76930 ATEXT4 (extensin 4) 0.75 0.87 SecretoryAt2g37090 IRX9 (irregular xylem 9) 1.04 0.68 SecretoryAt3g29360 UDP-glucose 6-dehydrogenase, putative 0.61 0.47 SecretoryAt3g46440 UXS5 (UDP-Xyl synthase 5) 0.54 0.61 ChloroplastAt3g54590 ATHRGP1 (hydroxyproline-rich glycoprotein) 0.79 1.26 SecretoryAt4g18780 CESA8 (cellulose synthase) 1.10 0.72 SecretoryAt4g39350 CESA2 (cellulose synthase) 0.66 0.51 SecretoryAt5g05170 CESA3 (cellulose synthase) 0.50 0.45 SecretoryAt5g64740 CESA6 (cellulose synthase) 0.47 0.46 SecretoryDefence/redoxAt1g32230 RCD1 (radical-induced death 1) 0.42 0.51 NucleusAt4g10250 HSP22.0 0.79 0.76 SecretoryAt4g27670 HSP21 1.36 0.65 ChloroplastAt5g17220 ATGSTF12 (glutathione transferase) 0.61 0.82 CytoplasmSecondary metabolismAt2g37040 PAL1 (phenylalanine ammonia-lyase) 0.57 0.57 cytoplasmAt2g38080 IRX12/LAC4 (laccase 4) 0.87 0.62 SecretoryAt4g22870 Anthocyanidin synthase 0.81 1.49 –At4g22880 LDOX (tannin-deficient seed 4) 0.75 1.21 –At5g07990 TT7 (flavonoid 3′-monooxygenase) 0.41 0.54 MitochondrionTransportAt2g21390 Coatomer subunit alpha, putative 0.69 0.63 MitochondrionAt2g34660 ATMRP2 (ATPase) 0.49 0.53 SecretoryAt3g16340 ATPDR1/PDR1 (ATPase) 0.52 0.53 ChloroplastAt4g03950 Glucose-6-phosphate/phosphate translocator 0.83 1.09 SecretoryAt4g31480 Coatomer beta subunit, putative 0.42 0.58 SecretoryAt4g31490 Coatomer beta subunit, putative 0.41 0.47 SecretoryAt4g32640 sec23/sec24 transport protein 0.47 0.55 SecretoryAt5g09220 AAP2 (amino acid permease) 0.53 0.40 Secretory27 June down
1678 P. Li et al.
© 2008 The AuthorsJournal compilation © 2008 Blackwell Publishing Ltd, Plant, Cell and Environment, 31, 1673–1687
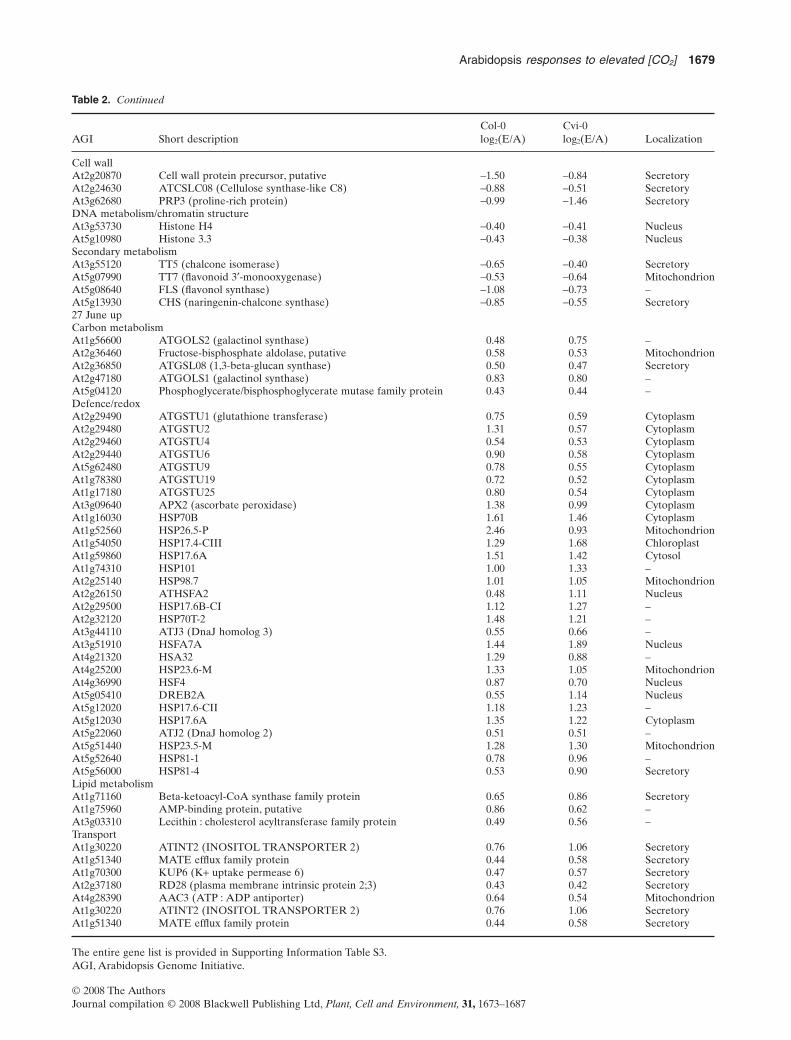
Table 2. Continued
AGI Short descriptionCol-0log2(E/A)
Cvi-0log2(E/A) Localization
Cell wallAt2g20870 Cell wall protein precursor, putative -1.50 -0.84 SecretoryAt2g24630 ATCSLC08 (Cellulose synthase-like C8) -0.88 -0.51 SecretoryAt3g62680 PRP3 (proline-rich protein) -0.99 -1.46 SecretoryDNA metabolism/chromatin structureAt3g53730 Histone H4 -0.40 -0.41 NucleusAt5g10980 Histone 3.3 -0.43 -0.38 NucleusSecondary metabolismAt3g55120 TT5 (chalcone isomerase) -0.65 -0.40 SecretoryAt5g07990 TT7 (flavonoid 3′-monooxygenase) -0.53 -0.64 MitochondrionAt5g08640 FLS (flavonol synthase) -1.08 -0.73 –At5g13930 CHS (naringenin-chalcone synthase) -0.85 -0.55 Secretory27 June upCarbon metabolismAt1g56600 ATGOLS2 (galactinol synthase) 0.48 0.75 –At2g36460 Fructose-bisphosphate aldolase, putative 0.58 0.53 MitochondrionAt2g36850 ATGSL08 (1,3-beta-glucan synthase) 0.50 0.47 SecretoryAt2g47180 ATGOLS1 (galactinol synthase) 0.83 0.80 –At5g04120 Phosphoglycerate/bisphosphoglycerate mutase family protein 0.43 0.44 –Defence/redoxAt2g29490 ATGSTU1 (glutathione transferase) 0.75 0.59 CytoplasmAt2g29480 ATGSTU2 1.31 0.57 CytoplasmAt2g29460 ATGSTU4 0.54 0.53 CytoplasmAt2g29440 ATGSTU6 0.90 0.58 CytoplasmAt5g62480 ATGSTU9 0.78 0.55 CytoplasmAt1g78380 ATGSTU19 0.72 0.52 CytoplasmAt1g17180 ATGSTU25 0.80 0.54 CytoplasmAt3g09640 APX2 (ascorbate peroxidase) 1.38 0.99 CytoplasmAt1g16030 HSP70B 1.61 1.46 CytoplasmAt1g52560 HSP26.5-P 2.46 0.93 MitochondrionAt1g54050 HSP17.4-CIII 1.29 1.68 ChloroplastAt1g59860 HSP17.6A 1.51 1.42 CytosolAt1g74310 HSP101 1.00 1.33 –At2g25140 HSP98.7 1.01 1.05 MitochondrionAt2g26150 ATHSFA2 0.48 1.11 NucleusAt2g29500 HSP17.6B-CI 1.12 1.27 –At2g32120 HSP70T-2 1.48 1.21 –At3g44110 ATJ3 (DnaJ homolog 3) 0.55 0.66 –At3g51910 HSFA7A 1.44 1.89 NucleusAt4g21320 HSA32 1.29 0.88 –At4g25200 HSP23.6-M 1.33 1.05 MitochondrionAt4g36990 HSF4 0.87 0.70 NucleusAt5g05410 DREB2A 0.55 1.14 NucleusAt5g12020 HSP17.6-CII 1.18 1.23 –At5g12030 HSP17.6A 1.35 1.22 CytoplasmAt5g22060 ATJ2 (DnaJ homolog 2) 0.51 0.51 –At5g51440 HSP23.5-M 1.28 1.30 MitochondrionAt5g52640 HSP81-1 0.78 0.96 –At5g56000 HSP81-4 0.53 0.90 SecretoryLipid metabolismAt1g71160 Beta-ketoacyl-CoA synthase family protein 0.65 0.86 SecretoryAt1g75960 AMP-binding protein, putative 0.86 0.62 –At3g03310 Lecithin : cholesterol acyltransferase family protein 0.49 0.56 –TransportAt1g30220 ATINT2 (INOSITOL TRANSPORTER 2) 0.76 1.06 SecretoryAt1g51340 MATE efflux family protein 0.44 0.58 SecretoryAt1g70300 KUP6 (K+ uptake permease 6) 0.47 0.57 SecretoryAt2g37180 RD28 (plasma membrane intrinsic protein 2;3) 0.43 0.42 SecretoryAt4g28390 AAC3 (ATP : ADP antiporter) 0.64 0.54 MitochondrionAt1g30220 ATINT2 (INOSITOL TRANSPORTER 2) 0.76 1.06 SecretoryAt1g51340 MATE efflux family protein 0.44 0.58 Secretory
The entire gene list is provided in Supporting Information Table S3.AGI, Arabidopsis Genome Initiative.
Arabidopsis responses to elevated [CO2] 1679
© 2008 The AuthorsJournal compilation © 2008 Blackwell Publishing Ltd, Plant, Cell and Environment, 31, 1673–1687

Table 3. Selected genes that differentially expressed between Col-0 and Cvi-0 (adjusted P < 0.05)
AGI Category Short description21 June(Cvi/Col)
27 June(Cvi/Col)
At4g15260 Carbon metabolism UDP-glucosyl transferase 6.34 4.22At1g74590 Defence/redox ATGSTU10 5.03 7.33At1g59670 Defence/redox ATGSTU15 9.47 7.59At4g02520 Defence/redox ATGSTF2 3.89 9.25At2g02930 Defence/redox ATGSTF3 3.81 7.69At2g14610 Defence/redox PR1 39.30 191.65At2g43590 Defence/redox Chitinase, putative 3.36 11.97At2g43620 Defence/redox Chitinase, putative 4.23 15.88At2g44490 Defence/redox PEN2 (penetration 2) 3.31 5.56At4g14400 Defence/redox ACD6 (accelerated cell death 6) 8.45 39.62At5g23020 Glucosinolate metabolism MAM-L (methylthioalkymalate synthase-like) 6.23 4.86At1g54040 Glucosinolate metabolism ESP (epithiospecifier protein) 15.04 11.18At3g06910 Protein metabolism Ulp1 protease family protein 4.90 9.20At5g24240 Protein metabolism Phosphatidylinositol 3, 4-kinase family protein 3.16 3.09At1g13200 Protein metabolism F-box family protein 3.66 5.71At3g58880 Protein metabolism F-box family protein 27.96 16.68At1g28060 RNA metabolism/transcription snRNP family protein 3.36 3.93At1g58025 RNA metabolism/transcription DNA binding 67.59 50.11At4g24420 RNA metabolism/transcription RNA recognition motif (RRM) 14.71 16.01At2g41100 Signalling TCH3 (Touch3) – 4.73At3g03950 Signalling ECT1, protein binding – 3.10At3g04110 Signalling GLR1 (glutamate receptor 1) – 3.42At4g23130 Signalling CRK5 (cysteine-rich PLK5) – 7.03At4g23180 Signalling CRK10 (cysteine-rich PLK10) – 3.06At2g19190 Signalling FRK1 (FLG22-induced receptor-like kinase) 4.11 4.37At1g51850 Signalling leucine-rich repeat protein kinase 3.15 8.13At1g21250 Signalling WAK1 (wall-associated kinase 1) – 5.83At1g21270 Signalling WAK2 (wall-associated kinase 2) – 4.87At5g38260 Signalling Serine/threonine protein kinase 6.47 16.28At4g15210 Carbon metabolism Beta-amylase 3.69 7.23At1g59124 Defence/redox Disease resistance 4.43 3.03At4g16950 Defence/redox RPP5 (recognition of peronospora parasitica 5) 4.12 3.43At3g46530 Defence/redox RPP13 3.14 –At3g50480 Defence/redox HR4 (homolog of RPW8 4) 9.66 3.99At1g62540 Defence/redox Flavin-containing monooxygenase 8.38 6.81At1g35310 Defence/redox Bet v I allergen family protein 4.67 7.86At5g39130 Defence/redox Germin-like protein, putative 12.01 27.82At4g27140 Development 2S seed storage protein 1 – 19.54At4g27150 Development 2S seed storage protein 2 – 30.96At4g27160 Development 2S seed storage protein 3 – 37.81At5g44120 Development CRA1 (Cruciferin 1) – 49.17At4g28520 Development CRU3 (Cruciferin 3) – 49.52At5g23010 Glucosinolate metabolism MAM1 (2-isopropylmalate synthase 3) 7.50 13.00At2g30840 Glucosinolate metabolism 2-Oxoglutarate-dependent dioxygenase 14.00 18.44At2g25450 Glucosinolate metabolism 2-Oxoglutarate-dependent dioxygenase 107.30 69.99At5g25980 Glucosinolate metabolism TGG2 (glucoside glucohydrolase 2) 40.32 38.56At2g03710 RNA metabolism/transcription SEP4 (Sepallata4) 5.86 7.42At1g75290 Secondary metabolism Isoflavone reductase, putative – 4.40At3g25830 Secondary metabolism TPS-CIN (terpene synthase-like) – 3.64At5g44630 Secondary metabolism Terpene synthase/cyclase family protein – 8.65At3g10340 Secondary metabolism Phenylalanine ammonia-lyase, putative – 4.29At2g38080 Secondary metabolism IRX12/LAC4 (laccase 4) – 4.24At2g34840 Transport Coatomer protein epsilon subunit family protein 3.50 3.20At4g13800 Transport Permease related 3.02 3.22At4g25950 Transport VATG3 (vacuolar ATP synthase G3) 5.10 5.50
The entire gene list is provided in Supporting Information Table S4.AGI, Arabidopsis Genome Initiative.
1680 P. Li et al.
© 2008 The AuthorsJournal compilation © 2008 Blackwell Publishing Ltd, Plant, Cell and Environment, 31, 1673–1687

From the transcript profiles, we detected no evidencefor a developmental difference between two ecotypes in21 June. Any differences between ecotypes were mainlyrestricted to the categories that may be summarized asstress specific and stress defence specific (Table 3, Support-ing Information Table S4). Cvi-0 highly expressed GSTs, forexample, GSTU10 and GSTU15, and biotic stress-relatedgenes such as PR1 and PEN2 (Supporting InformationTable S4A). However, Col-0 highly expressed TIR-NBS-LRR class and CC-NBS-LRR class disease resistance pro-teins including RPP5 and RPP13 (Supporting InformationTable S4B). Not surprisingly, transcripts known to accountfor natural variation in glucosinolate biosynthesis (methyl-sulfinylalkyl, alkenyl and hydroxyalkyl glucosinolates) indifferent Arabidopsis ecotypes were also picked up by thiscomparison (Kroymann et al. 2003): ESP and AOP3 hadhigher expression in Cvi-0, but MAM1 had higher expres-sion in Col-0. TGG2, related to glucosinolate catabolism,and three 2-oxoglutarate-dependent dioxygenases werehighly expressed only in Col-0, which may provide addi-tional candidates for studying the natural variation in glu-cosinolate metabolism.
By 27 June, SEP4 and STK, preferentially expressed inovules, and transcripts for 2S and 12S seed storage pro-teins were more highly expressed in Col-0 compared withCvi-0 (Table 3, Supporting Information Table S4D), indi-cating that development had progressed further, or faster,in Col-0 than in Cvi-0. This is consistent with known dif-ferences in flowering time between these two ecotypes.The expression of GSTs, biotic stress and genes related toglucosinolate metabolism distinguishing the two ecotypeswas still evident in functions different from development.Interestingly, 7 ankyrin repeat family proteins, includingACD6, involved in resistance to Pseudomonas syringae,and ANK, responding to salicylic acid, and 15 receptorkinases were highly expressed in Cvi-0 alone (SupportingInformation Table S4C), while genes related to secondarymetabolism-related genes were more highly expressed inCol-0 in 27 June (Supporting Information Table S4D).
Gene family analysis and display by MapMan
Members of gene families [according to The ArabidopsisInformation Resource (TAIR)] related to defence/redox,transport, signalling and transcription factors are displayedas heatmaps (Fig. 2; genes are identified in SupportingInformation Table S5). Both ecotypes up-regulated GSTs,peroxidases and HSPs in elevated [CO2], especially at thesecond harvest date. Particularly interesting, ER-typeCa-ATPases (At4g00900, ECA2; At1g10130, ECA3),PM-type Ca-ATPases (At1g27770, ACA1; At4g29900,ACA10) and a Ca2+/H+ exchanger (At5g17860, CAX7)increased at the first harvest date only in both ecotypes.Acidic amino acid permease (AAAP)-type amino acidtransporters and functionally unknown endosome-locatedproteins were also significantly up-regulated at an earliertime in both ecotypes. This first harvest date also indicatedan increased participation of MAPK signalling pathways
with coordinated up-regulation of MAPKs, MAPKKs andMAPKKKs. Elevated [CO2] repressed family members ofWhirly transcription factors at the first harvest date,however, increased the expression of, for example, ARFsthat later declined. Consistent with HSPs, heat stress tran-scription factors (HSFs) were also increased in elevated[CO2].
MapMan software was used to investigate pathways influ-enced by elevated [CO2] in each ecotype and time point(Supporting Information Fig. S4A–C). The Wilcoxon testwas used to identify categories whose member genes showeda statistically significant coordinated response comparedwith the response of other genes included on the array. TheP-values were calculated for elevated [CO2] versus ambient[CO2], and are included in the Supporting InformationTable S5-2. Consistent with the anova results, growth atelevated [CO2] repressed the expression of photosyntheticgenes and stimulated the expression of genes in pathwaysconsuming carbon, exemplified by enhanced cell wall bio-synthesis (21 June). However, transcripts for cytosolic ribo-somal proteins displayed a different response to elevated[CO2], being consistently down-regulated in Col-0, whilethey were only minimally regulated in Cvi-0. In contrast, by27 June, Cvi-0 appeared to have adjusted, while Col-0 beganto show signs of senescence, exemplified by further down-regulation of photosynthesis functions and chloroplast
GS
TP
ER
HS
P
Ca
2+
PIP
AA
AP
EM
P70
HS
FW
HY
MA
PK
At1g73670
At3g14720
At3g21220
At3g58640
At1g14000
At1g16270
At1g79570
At2g35050
At2g43850
At5g41990
At1g02930At1g02920At2g29490At2g29460At2g29440At1g78360At1g17170At1g17180At1g17190
At5g17220
At1g68850At3g28200At4g37520At5g05340At5g64120
At1g07400At1g59860At1g54050At4g27670At4g25200At5g51440At2g19310At1g52560At5g02490At1g16030At2g32120At5g09590At1g56410At4g37910At1g79930At1g79920At5g56000At1g74310At2g25140At5g51070At5g57710
At4g00900At1g10130At1g27770At4g29900At5g17860
At4g00430At2g37180At2g16850At4g01470At3g04090At3g56950
At5g09220At1g44100At5g49630At2g38120At3g30390At4g38250At5g65990At5g40780At2g39890
At1g10950At1g14670At2g01970At4g12650At5g25100At5g35160
At2g26150At4g36990At4g11660
At1g14410At1g71260At2g02740
At5g60450At5g37020At2g28350
At1g09770At1g56650At1g79180At5g16600At2g37630
At1g62360At2g35940At4g08150At2g22430At1g69780At3g61890At1g79840
At1g26800At5g38895At4g13100At3g15740At4g33940At1g53820At4g00335At4g33565At3g19910At2g23780At1g63840At5g47610At1g73950At5g41440At1g18470At1g62370At1g63900
–0.6 0 0.6
Log 2
fold change
AR
FM
YB
HB
C3H
C4
1 2 3 4 1 2 3 4 1 2 3 4
Figure 2. Heat map of transcripts in selected gene families.Significant log2 expression changes in elevated [CO2] versusambient air were used. Up-regulation (blue colour),down-regulation (red) and no change (white) are indicated.(1) Col-0 (June 21), (2) Cvi-0 (June 21), (3) Col-0 (June 27) and(4) Cvi-0 (June 27).
Arabidopsis responses to elevated [CO2] 1681
© 2008 The AuthorsJournal compilation © 2008 Blackwell Publishing Ltd, Plant, Cell and Environment, 31, 1673–1687

ribosomal proteins. It is noteworthy to realize that Cvi-0,showing much less of a phenotype that appears to indicate adisturbance of the C : N ratio (Fig. 5) at this time, had onlystarted to enter flowering, while Col-0 had largely termi-nated flowering but still showed the disturbance (Fig. 5).
Integration of metabolite and transcript profiles
The analysis of metabolites in both ecotypes collected atboth time points focused on abundant metabolites (Sup-porting Information Table S6). Obvious changes identifiedsugars in general; glucose, galactose and maltose increasedsignificantly in elevated [CO2] at all times in both ecotypes,while increases in fructose and raffinose were less pro-nounced or restricted to Col-0. No significant changes wereobserved for sucrose (Fig. 3). Most amino acid showeddecreases in elevated CO2 except for histidine, tryptophanand phenylanine, the increases likely indicating flux into
pathways of secondary metabolism. There was an obviousdifference between ecotypes in glutamic acid and glutamineat the second harvest day: both declined precipitously inCol-0, but increased (glutamic acid) or maintained the levelobserved in ambient air (glutamine) in Cvi-0. However,among organic acids, isocitrate and malic acid were excep-tionally high, and malic acid increased in elevated [CO2] atall times in both ecotypes. At the second harvest date, suc-cinic acid also had increased in both ecotypes (Fig. 3).
The high levels of hexoses could provide substrates forglycolysis, and the large increases in TCA cycle intermedi-ates indeed supported a view of increased C-partitioningto respiration or for anabolic pathways originating fromthe mitochondrial and cytosolic compartments. Figure 3(Supporting Information Table S7) integrates these majormetabolites with transcript profiles. Placed next to enzymei.d.s in pathways of primary metabolism symbols for up- ordown-regulation, no change or missing data are included
Figure 3. Overview of transcript and metabolite changes in pathways of primary carbohydrate and amino acid metabolism. Changes intranscript expression and metabolites in Col-0 and Cvi-0 (21 and 27 June 2005). Blue or red blocks indicate increases or decreases ofmetabolites, respectively. Regulation of transcripts is indicated by the direction of the arrows. Blue or red arrows indicate a significant up-or down-regulation (adjusted P < 0.05); black arrows indicate an insignificant trend, and no change (bar) or no data (stippled bar) areincluded. Values for Col-0 (21 June), Cvi-0 (21 June), Col-0 (27 June) and Cvi-0 (27 June) are compared from left to right.
1682 P. Li et al.
© 2008 The AuthorsJournal compilation © 2008 Blackwell Publishing Ltd, Plant, Cell and Environment, 31, 1673–1687

for all isoforms that could be scored at both harvest dates.The transcript profiles indicated active engagement of gly-colysis and the TCA cycle at the first harvest date only.However, the increase of C skeletons did not result in theaccumulation of most amino acids. Furthermore, transcriptsrelated to amino acid biosynthesis were down-regulated ordid not change, with the exception of those involved intryptophan and phenylalanine biosynthesis.
Figure 4 presents statistical data in the form of the PCAof the metabolite profiling experiments. When all metabo-lites, times of harvest, treatment and ecotypes wereincluded, the major component identified the CO2 effect,followed by the time of harvest and ecotypic differentbehaviour (not shown). When focusing on sugars andpolyols (Fig. 4a), sucrose content distinguished the ecotypes(F1), while harvest date and [CO2] effect contributed less.
Amino acid composition (Fig. 4b) revealed the importanceof the [CO2] effect (F1 and F2), while ecotype differenceswere less important (F3).
The accumulation of organic acids, decline in amino acidamounts and disparate regulation of genes in glycolysis/TCA and amino acid metabolism suggested a metabolicperturbation at the interface of C and N utilization. Anexperiment that monitored Arabidopsis (Col-0) transcriptprofiles in nitrogen deficiency (Usadel et al. 2005) had iden-tified a number of genes that showed an up- or down-regulation. Many of these N deficiency-related genes werealso regulated in this FACE experiment (Fig. 5; genes areidentified in Supporting Information Table S8). In fact, atthe first harvest date, most transcripts that down-regulatedduring an experimentally induced N deficiency were alsodown-regulated in Col-0 and Cvi-0 after exposed to theelevated CO2, and many up-regulated genes were also regu-lated in common.The correlation in gene expression changesbetween N deficiency and elevated [CO2] persisted for Col-0at the second harvest date, while Cvi-0 did not exhibit thesame pattern. The contrast between Col-0 and Cvi-0 exem-plifies differences in how both ecotypes adjusted to changesin the C : N ratio,which appear to accompany their growth inelevated [CO2], equally indicating the existence of geneticdiversity to changes in the composition of the atmosphere.
DISCUSSION
In a comparison of transcript profiles in three Arabidopsisecotypes, many chloroplast functions decreased in elevated
Figure 4. Principal component analysis of metabolites. Sugarsand sugar alcohols (a) and amino acids (b) at the second harvestdate are shown. Components in (a) are F1 (ecotype-specificdifferences): sucrose; F2 (time of harvest): raffinose, glucose,sucrose, maltose and fructose; and F3 ([CO2] versus ambient):glucose, myo-inositol, mannitol, raffinose and galactose.Components in (b) are F1 ([CO2] versus ambient): glutamine andglutamic acid; F2 ([CO2] versus ambient): ornithine, glutamicacid, lysine, histidine and phenylalanine; F3 (ecotype-specific):glutamine, glutamic acid, proline, ornithine and aspartic acid.
Figure 5. Comparison of N-deficiency responses with responsesby Arabidopsis ecotypes in elevated [CO2]. Regulated transcriptsin Free-Air CO2 Enrichment (FACE) are compared withtranscript changes observed during nitrogen starvation (Usadelet al. 2005). Up-regulation is indicated by shades of blue,down-regulation by red. In cases where a similar response isencountered, the individual spots in an area show the samecolour as the guide bars. Up- and down-regulated transcripts(log2 scale, +0.5 to -0.5) are identified by Arabidopsis i.d. andannotation in Supporting Information Table S8. The analysisindicated Col-0 showing a stronger N-deficiency response thanCvi-0.
Arabidopsis responses to elevated [CO2] 1683
© 2008 The AuthorsJournal compilation © 2008 Blackwell Publishing Ltd, Plant, Cell and Environment, 31, 1673–1687

[CO2], in particular transcripts in photosynthesis and CO2
fixation (Li et al. 2006). In comparison with ambient air,increased transcriptional activity characterized hexoseutilization, starch turnover, cell wall biosynthesis and, toa smaller degree, secondary metabolism. Similar resultsobtained in FACE experiments and in growth chambershave been reported, and our results in this earlier studyshowed an overall correlation. Furthermore, this study con-ducted in 2003 revealed a subset of transcripts that behavedidentically in all ecotypes, identifying genes that also regu-lated under nitrogen-deficiency conditions (Li et al. 2006).The majority of these genes has also been identified in thepresent study at the first harvest day (21 June 2005), whichregulated the same way.At the second harvest date (27 June2005), at much higher temperatures, the correlation was lesspronounced, indicating how local weather was reflected inthese profiles. The overlapping transcripts between the twoharvest dates also indicated a strong influence of weatherand development. In the comparison of ambient versusCO2-enriched air, Arabidopsis ecotypes nonetheless re-sponded to local weather conditions with differences intheir capacity to acclimate.
Focusing on ecotypes Col-0 and Cvi-0, their adaptation todistinctly different habitats, time of analysis,weather and thecomparison of elevated [CO2] with ambient air providedinsights that identified the likely obstacles for C3 plants tomake an optimal use of elevated CO2. Both ecotypes grewwell in SoyFACE, while growth, flowering time and seed setshowed ecotype-specific variation, which was, however, notinfluenced by CO2, but rather by field conditions that accel-erated growth and development as reported before(Miyazaki et al. 2004; Li et al. 2006).The selection of the twoArabidopsis ecotypes was based on a divergent response tothe [CO2] environment. Natural genetic variation that con-trols phenotypic differences are well documented in Arabi-dopsis, with examples such as flowering time (Chen et al.2005), ecotype-specific expression of duplicated genes(Clauss & Mitchell-Olds 2004), glucosinolate biosynthesis(Kliebenstein et al. 2001), pathogen susceptibility (Bidart-Bouzat, Mithen & Berenbaum 2005) or oxidative stresstolerance (Tamaoki et al. 2003).We further reasoned that theplant’s short life span, growing in multiple FACE plots insufficient number for repeat samplings, would provide snap-shots about how the plants responded to elevated [CO2] andhow this would be reflected by changes in gene expressionand metabolites. Our physiological analyses correlated wellwith those of other FACE experiments (Davey et al. 2004;Horz et al. 2004; Long et al. 2004, 2005; Morgan et al. 2004;Ainsworth & Long 2005; Tricker et al. 2005; Reich et al.2006). The ecotypic differences in transcript behaviour thensuggested mechanisms that begin to explain the less-than-expected use of elevated [CO2] by C3 plants, clearly indicat-ing that genetic diversity exists, which might not be obviousor exploited in extant crops.
Expression profiles and metabolites grouped in a waythat first separated the two harvest dates and reflected themicroclimate difference between the time points. A surpris-ingly strong change was revealed in the transcription
profiles, ambient versus elevated [CO2], with respect to cel-lular compartments and functional categories affected(Table 2, Supporting Information Table S3). Chloroplast-localized transcripts unrelated to light capture and fixationfunctions declined strongly and mostly remained repressed.Many transcripts in secretory pathways were up-regulatedearly, and many remained high throughout the experiment.Transcripts located in mitochondria increased especially atlater times. This reflected the increased importance ofinvestment in the metabolic machinery utilizing increasedcarbon versus prioritization of carbon fixation as a limitingfactor in ambient [CO2]. Declines were always more pro-nounced in Col-0, while Cvi-0 recovered over time to beginto resemble plants growing in ambient air. In terms of func-tional categories, apart from the well-known up-regulatedcategories (carbon, cell wall and secondary metabolism),lipid metabolism, signalling and transport functionsincreased early during the plants’ growth in elevated [CO2],but functions in protein metabolism and defence dominatedamong the up-regulated transcripts later.
The behaviour of the Arabidopsis transcriptome undernutrient deficit modelled into the MapMan program(Usadel et al. 2005) provided what might be the most coher-ent insight. Figure 5 compares data from SoyFACE withpreviously recorded gene expression changes by plants inlow N (Usadel et al. 2005). We inserted the regulatorychanges observed in our experiments for the genes alteredby nitrogen deficiency to generate response-similarity maps(Supporting Information Table S8 for gene i.d.s). Col-0 atboth harvest dates showed up- and down-regulations thatwere largely identical to those observed under N-deficiencyconditions (and to some degree, also P deficit; data notshown). Cvi-0 showed this pattern very clearly at the earlyharvest date, but not at the second. Genes in categoriesreactive oxygen species (ROS), secondary metabolism,chaperone activities, as well as genes that down-regulatecarbon fixation in the absence of nitrogen, were expressedsimilarly in both N deficiency and elevated [CO2] (Support-ing Information Table S8). Increased photosynthetic [CO2]fixation altered the apparent C/N balance to which the twoecotypes responded differently.
The imbalance seemed to constrain the benefits arisingfrom the growth in elevated [CO2], also indicated by thedramatic increases of transcripts for HSPs and GSTs(Fig. 2). The imbalance in C : N metabolism, signalling anapparent decline in nitrogen, seems to be one main driverfor changes in gene expression and metabolism. However,these changes are not to be confused with what is typicallyviewed as plant biotic or abiotic stress responses. This viewis supported by a comparison of Col-0 plants grown in thegreenhouse, with plants grown in ambient air in FACE(Miyazaki et al. 2004). A large number among the geneswith significant changes in transcript amount identifiedstress-associated functions in ambient air in the field.Elevated [CO2] further increased transcripts in defence,ROS and chaperone categories. Among the ecotypes here,significant differences identified the categories defenceand redox homeostasis, exemplified by PR1 and RPP5, and
1684 P. Li et al.
© 2008 The AuthorsJournal compilation © 2008 Blackwell Publishing Ltd, Plant, Cell and Environment, 31, 1673–1687

proteins related to ROS scavenging such as GST. Metabo-lite analyses provided similar trends in as far as pathwaysthat consume or store carbon were most significantlyincreased, including several organic acids in the TCA cycle,mirroring the behaviour of transcripts for glycolysis andTCA cycle enzymes. Paradoxically, the increase in sub-strates for transaminations did not result in increasedamino acid accumulation with the exception of increasedlevels of aromatic amino acids.
The Arabidopsis ecotypes were not able to capitalizefrom the benefits of elevated [CO2] as much as might beexpected. Perception of increased concentrations of some Ccompounds could be at the basis of this molecular response,with sugar sensing then resulting in the down-regulation ofmetabolism, unless, as in N-fixing species, additional N com-pounds could be provided, or unless, as in trees, a large sinkwas available to accommodate excess C. This view mightexplain the discrepancy between expected and real gains inelevated [CO2] (Ainsworth & Long 2005). The correspon-dence between our results and the physiological observa-tions in other species supports the use of the Arabidopsismodel as a tool for uncovering the molecular geneticmechanisms that prevent plants from realizing the advan-tages that could potentially be provided by elevated [CO2].Based on the resources and databases in this model, unpar-alleled among plants, it should be possible to analyse theveracity of the information gained in species of economicsignificance.
ACKNOWLEDGMENTS
We thank Jinke Shao for the help with the plants, Dong-haOh for the help with the figures, Steve Long and Tim Mies,UIUC, for advice, and Oliver Fiehn, UC Davis, for ametabolite library. This work has been supported by NSFDBI-0223905, US-DOE, programme for EcosystemsResearch (DE-FG02-04ER63849), and UIUC institutionalgrants.
REFERENCES
Ainsworth E.A. & Long S.P. (2005) What have we learned from 15years of free-air CO2 enrichment (FACE)? A meta-analyticreview of the responses of photosynthesis, canopy properties andplant production to rising CO2. New Phytologist 165, 351–371.
Ainsworth E.A. & Rogers A. (2007) The response of photosynthe-sis and stomatal conductance to rising [CO2]: mechanisms andenvironmental interactions. Plant, Cell & Environment 30, 258–270.
Ainsworth E.A., Rogers A., Vodkin L.O., Walter A. & Schurr U.(2006) The effects of elevated CO2 concentration on soybeangene expression.An analysis of growing and mature leaves. PlantPhysiology 142, 135–147.
Ainsworth E.A., Rogers A., Leakey A.D., Heady L.E., Gibon Y.,Stitt M. & Schurr U. (2007) Does elevated atmospheric [CO2]alter diurnal C uptake and the balance of C and N metabolites ingrowing and fully expanded soybean leaves? Journal of Experi-mental Botany 58, 579–591.
Bazzaz F.A., Jasienski M., Thomas S.C. & Wayne P. (1995) Micro-evolutionary responses in experimental populations of plants to
CO2-enriched environments: parallel results from two modelsystems. Proceedings of the National Academy of Sciences of theUnited States of America 92, 8161–8165.
Bidart-Bouzat M.G., Mithen R. & Berenbaum M.R. (2005)Elevated CO2 influences herbivory-induced defense responsesof Arabidopsis thaliana. Oecologia 145, 415–424.
Castells E., Roumet C., Peñuelas J. & Roy J. (2002) Intraspecificvariability of phenolic compounds and their responses toelevated CO2 in two Mediterranean perennial grasses. Environ-mental and Experimental Botany 47, 205–216.
Chen W., Chang S., Hudson M., Kwan W., Li J., Estes B., Knoll D.,Shi L. & Zhu T. (2005) Contribution of transcriptional regula-tion to natural variations in Arabidopsis. Genome Biology 6,R32.
Cheng S.H., Moore B.D. & Seemann J.R. (1998) Effects of short-and long-term elevated CO2 on the expression of ribulose-1,5-bisphosphate carboxylase/oxygenase genes and carbohydrateaccumulation in leaves of Arabidopsis thaliana (L.) Heynh.1.Plant Physiology 116, 715–723.
Clauss M.J. & Mitchell-Olds T. (2004) Functional divergence intandemly duplicated Arabidopsis thaliana trypsin inhibitorgenes. Genetics 166, 1419–1436.
Cui X., Hwang J.T., Qiu J., Blades N.J. & Churchill G.A. (2005)Improved statistical tests for differential gene expression byshrinking variance components estimates. Biostatistics 6, 59–75.
Davey P.A., Hunt S., Hymus G.J., DeLucia E.H., Drake B.G., Kar-nosky D.F. & Long S.P. (2004) Respiratory oxygen uptake is notdecreased by an instantaneous elevation of [CO2], but isincreased with long-term growth in the field at elevated [CO2].Plant Physiology 134, 520–527.
Duarte J.M., Cui L., Wall P.K., Zhang Q., Zhang X., Leebens-MackJ., Ma H., Altman N. & Depamphilis C.W. (2006) Expressionpattern shifts following duplication indicative of subfunctional-ization and neofunctionalization in regulatory genes of Arabi-dopsis. Molecular Biology and Evolution 23, 469–478.
Gong Q., Li P., Ma S., Rupassara S.I. & Bohnert H.J. (2005) Stressadaptation competence in Arabidopsis thaliana and its extremo-phile relative Thellungiella halophila. The Plant Journal 44, 826–839.
Gupta P., Duplessis S., White H., Karnosky D.F., Martin F. & PodilaG.K. (2005) Gene expression patterns of trembling aspen treesfollowing long-term exposure to interacting elevated CO2 andtropospheric O3. New Phytologist 167, 129–142.
Horz H.P., Barbrook A., Field C.B. & Bohannan B.J. (2004)Ammonia-oxidizing bacteria respond to multifactorial globalchange. Proceedings of the National Academy of Sciences of theUnited States of America 101, 15136–15141.
Jaakola L., Pirttila A.M., Halonen M. & Hohtola A. (2001) Isola-tion of high quality RNA from bilberry (Vaccinium myrtillus L.)fruit. Molecular Biotechnology 19, 210–203.
Jobson J.D. (1992) Applied Multivariate Data Analysis. Volume: II:Categorical and Multivariate Methods, pp. 483–568. Springer-Verlag, New York, NY, USA.
Jolliffe I.T. (2002) Principal Component Analysis, 2nd edn.Springer, New York, NY, USA.
Kliebenstein D.J., Kroymann J., Brown P., Figuth A., Pedersen D.,Gershenzon J. & Mitchell-Olds T. (2001) Genetic control ofnatural variation in Arabidopsis glucosinolate accumulation.Plant Physiology 126, 811–825.
Kroymann J., Donnerhacke S., Schnabelrauch D. & Mitchell-OldsT. (2003) Evolutionary dynamics of an Arabidopsis insect resis-tance quantitative trait locus. Proceedings of the NationalAcademy of Sciences of the United States of America 100, 14587–14592.
Li P., Sioson A.A., Mane S.P., Ulanov A., Grothaus G., Heath L.S.,Murali T.M., Bohnert H.J. & Grene R. (2006) Response diversity
Arabidopsis responses to elevated [CO2] 1685
© 2008 The AuthorsJournal compilation © 2008 Blackwell Publishing Ltd, Plant, Cell and Environment, 31, 1673–1687

of Arabidopsis thaliana ecotypes in elevated CO2 in the field.Plant Molecular Biology 62, 593–609.
Long S.P., Ainsworth E.A., Rogers A. & Ort D.R. (2004) Risingatmospheric carbon dioxide: plants FACE the future. AnnualReview of Plant Biology 55, 591–628.
Long S.P., Ainsworth E.A., Leakey A.D.B. & Morgan P.B. (2005)Global food insecurity. Treatment of major food crops withelevated carbon dioxide or ozone under large-scale fully open-air conditions suggests recent models may have overestimatedfuture yield. Transactions of the Royal Society of London 360,2011–2020.
Lozovaya V., Ulanov A., Lygin A., Duncan D. & Widholm J. (2006)Biochemical features of maize tissues with different capacities toregenerate plants. Planta 224, 1385–1399.
Ludewig F., Sonnewald U., Kauder F., Heineke D., Geiger M., StittM., Muller-Röber B.T., Gillissen B., Kuhn C. & Frommer W.B.(1998) The role of transient starch in acclimation to elevatedatmospheric CO2. FEBS Letters 429, 147–151.
Miyazaki S., Fredricksen M., Hollis K.C., Poroyko V., Shepley D.,Galbraith D.W., Long S.P. & Bohnert H.J. (2004) Expressionprofiles for Arabidopsis thaliana grown at UIUC SoyFACE.Field Crops Research 90, 47–59.
Morgan P.B., Bernacchi C.J., Ort D.R. & Long S.P. (2004) An invivo analysis of the effect of season-long open-air elevation ofozone to anticipated 2050 levels on photosynthesis in soybean.Plant Physiology 135, 2348–2357.
Peñuelas J. & Estiarte M. (1998) Can elevated CO2 affect second-ary metabolism and ecosystem function? Trends in Ecology andEvolution 13, 20–24.
Porra R.J., Thompson W.A. & Kriedemann P.E. (1989) Determina-tion of accurate extinction coefficients and simultaneous-equations for assaying chlorophyll-a and chlorophyll-b extractedwith 4 different solvents – verification of the concentration ofchlorophyll standards by atomic-absorption spectroscopy. Bio-chimica et Biophysica Acta 975, 384–394.
Prentice I.C., Farquhar G.D., Fasham M., Goulden M., Jaramillo V.,Kheshgi H., Quere C., Scholes R. & Wallace D. (2001) Thecarbon cycle and atmospheric CO2. In Climate Change 2001:TheScientific Basis. Contribution of Working Group 1 to the ThirdAssessment Report of the Intergovernmental Panel on ClimateChange (eds J.T. Houghton, Y.D. Ding, J. Griggs, M. Noguer, P.J.van der Linden, X. Dai, K. Maskell & C.A. Johnson), pp. 183–237. Cambridge University Press, Cambridge, UK.
Reich P.B., Tjoelker M.G., Machado J.L. & Oleksyn J. (2006) Uni-versal scaling of respiratory metabolism, size and nitrogen inplants. Nature 439, 457–461.
Roessner U., Wagner C., Kopka J., Trethewey R.N. & Willmitzer L.(2000) Simultaneous analysis of metabolites in potato tuber bygas chromatography-mass spectrometry. The Plant Journal 23,131–142.
Silva B.M., Casal S., Andrade P.B., Seabra R.M., Oliveira M.B. &Ferreira M.A. (2003) Development and evaluation of a GC/FIDmethod for the analysis of free amino acids in quince fruit andjam. Analytical Science 19, 1285–1290.
Stitt M., Lilley R.M., Gerhardt R. & Heldt H.W. (1989) Metabolitelevels in specific cells and subcellular compartments of plantleaves. Method in Enzymol 174, 518–552.
Tamaoki M., Matsuyama T., Kanna M., Nakajima N., Kubo A.,Aono M. & Saji H. (2003) Differential ozone sensitivity amongArabidopsis accessions and its relevance to ethylene synthesis.Planta 216, 552–560.
Taylor G., Street N.R., Tricker P.J., Sjödin A., Graham L.,Skogström O., Calfapietra C., Scarascia-Mugnozza G. & JanssonS. (2005) The transcriptome of Populus in elevated CO2. NewPhytologist 167, 143–154.
Thimm O., Blasing O., Gibon Y., Nagel A., Meyer S., Kruger P.,
Selbig J., Muller L.A., Rhee S.Y. & Stitt M. (2004) MAPMAN: auser-driven tool to display genomics data sets onto diagrams ofmetabolic pathways and other biological processes. The PlantJournal 37, 914–939.
Tricker P.J., Trewin H., Kull O., Clarkson G.J., Eensalu E., TallisM.J., Colella A., Doncaster C.P., Sabatti M. & Taylor G. (2005)Stomatal conductance and not stomatal density determines thelong-term reduction in leaf transpiration of poplar in elevatedCO2. Oecologia 143, 652–660.
Usadel B., Nagel A., Thimm O., et al. (2005) Extension of the visu-alization tool MapMan to allow statistical analysis of arrays,display of corresponding genes, and comparison with knownresponses. Plant Physiology 138, 1195–1204.
Received 16 June 2008; revised in revised form 3 August 2008;accepted for publication 4 August 2008
SUPPORTING INFORMATION
Additional Supporting Information may be found in theonline version of this article:
Figure S1. Chlorophyll (A) and protein (B) content ofleaves of Col-0 and Cvi-0 harvested on June 21 and June 27,2005, respectively. Data represent the mean (�SD) fromthree rings (5 repeats per ring, and 10 plants pooled in eachring repeat).Figure S2. Hierarchical clustering over all experimentalconditions. Genes (11 758) that passed normalization andlow-intensity filtering in all slides were clustered using hier-archical clustering (UPGMA, unweighted average with thesimilarity measure based on Euclidean distance). Orderingfunction was based on average value. The dendrogram isbased on similarity between profiles. Down-regulation(red), up-regulation (blue) and no change (white).Figure S3. Verification of microarray results by real-time PCR. Log2 (elevated CO2/ambient) values for genes(a–n) in the four experimental conditions. Genes: (a)At3g51240, (b) At1g61800, (c) At2g31390, (d) At1g02930, (e)At2g37040, (f) At3g09640, (g) At3g59700, (h) At4g09010, (i)At4g16150, (j) At4g25080, (k) At4g31870, (l) At4g34190, (m)At5g15490 and (n) At5g63310. The primers were listed inthe Supporting Information Table S2.Figure S4. MapMan images for categories photosynthesis(A), cell wall precursors (B) and ribosomal proteins andtranslation (C). (SF4A-1) Photosynthesis of Col-0 at June21; (SF4A-2) photosynthesis of Cvi-0 at June 21; (SF4A-3)photosynthesis of Col-0 at June 27; (SF4A-4) photosynthe-sis of Cvi-0 at June 27. (SF4B-1) Cell wall precursor of Col-0at June 21; (SF4B-2) cell wall precursor of Cvi-0 at June 21;(SF4B-3) cell wall precursor of Col-0 at June 27; (SF4B-4)cell wall precursor of Cvi-0 at June 27. (SF4C-1) RNAmetabolism/protein synthesis of Col-0 at June 21; (SF4C-2)RNA metabolism/protein synthesis of Cvi-0 at June 21;(SF4C-3) RNA metabolism/protein synthesis of Col-0 atJune 27; (SF4C-4) RNA metabolism/protein synthesis ofCvi-0 at June 27.Table S1. Weather condition and Pearson correlation. (A)Weather conditions during sampling and the 24 h prior to
1686 P. Li et al.
© 2008 The AuthorsJournal compilation © 2008 Blackwell Publishing Ltd, Plant, Cell and Environment, 31, 1673–1687

sampling. (B) Person correlation coefficient of the tran-scriptome among experiments.Table S2. List of primer sequences used in RT-PCR analy-sis and the RT-PCR data.Table S3. Mixed-model anova identified transcripts regu-lated in the same direction in Arabidopsis ecotypes Col-0and Cvi-0 in elevated [CO2] (FDR-adjusted P < 0.05). Func-tional distribution and protein localization prediction of thetranscripts are included. (A) Down-regulated genes in June21 in both Col-0 and Cvi-0; (B) up-regulated genes in June21 in both Col-0 and Cvi-0; (C) down-regulated genes inJune 27 in both Col-0 and Cvi-0; (D) up-regulated genes inJune 27 in both Col-0 and Cvi-0.Table S4. Mixed-model anova identified genes with varia-tion between Col-0 and Cvi-0 (FDR-adjusted P < 0.05).
Table S5. (1) Gene family analysis under the elevated CO2;(2) Wilcoxon rank-sum test of MapMan categories.Table S6. List of metabolite data.Table S7. List of transcriptome and metabolome changesin major carbohydrate and amino acid metabolism pre-sented in Fig. 4.Table S8. List of all transcripts in Fig. 3 (nutrient-deficitsimilarity comparison).Supporting Information text – MIAME compliance.
Please note: Wiley-Blackwell are not responsible for thecontent or functionality of any supporting materials sup-plied by the authors. Any queries (other than missing mate-rial) should be directed to the corresponding author for thearticle.
Arabidopsis responses to elevated [CO2] 1687
© 2008 The AuthorsJournal compilation © 2008 Blackwell Publishing Ltd, Plant, Cell and Environment, 31, 1673–1687