ar1.komaxgroup.comar1.komaxgroup.com/uploads/tx_dlcenter/komax-annual-report-2012.… · the komax...
TRANSCRIPT

annual Report 12
Th
e w
ay
To
ma
ke
iT
k
om
ax
an
nu
al R
ep
ort
201
2
The way To make iT

The Komax Group is a globally active technology company that focuses on markets in the automation sector. As a leading manufacturer of innovative and high-quality solutions for the wire-processing industry, for the production of modules for the photovoltaics market and for systems for the manufacture of self-medication solutions, Komax helps its customers to implement economical and safe manufacturing processes, especially in the automotive supply, solar panel and pharma-ceutical sectors.
Brief profile
Wire business unitWith its comprehensive product range, Komax Wire offers automated, intelligent solutions for all wire-processing applications. In addition to both standard and customer-specific systems, we offer an extensive range of quality assurance modules and test equipment as well as networking solutions for safe and efficient production. Moreover, with our sophisticated service offering, we continue to support our customers after their systems have been commissioned, thereby ensuring high availability and low impairment for their investment.
Solar business unitKomax Solar focuses on process automation systems for the production of solar modules. These include stringers, which link individual solar cells together and solder them into what are known as strings, lay-up systems, which form individual strings into a matrix, and laminators, which take care of the final stage of sealing the fragile matrices.
Medtech business unitKomax Medtech develops sophisticated, customer-specific machine systems for the automatic assembly of mass-produced medical devices, such as inhalers or insulin delivery and injection systems. Komax Medtech also provides systems for the efficient mass production of cartridges for inkjet printers.
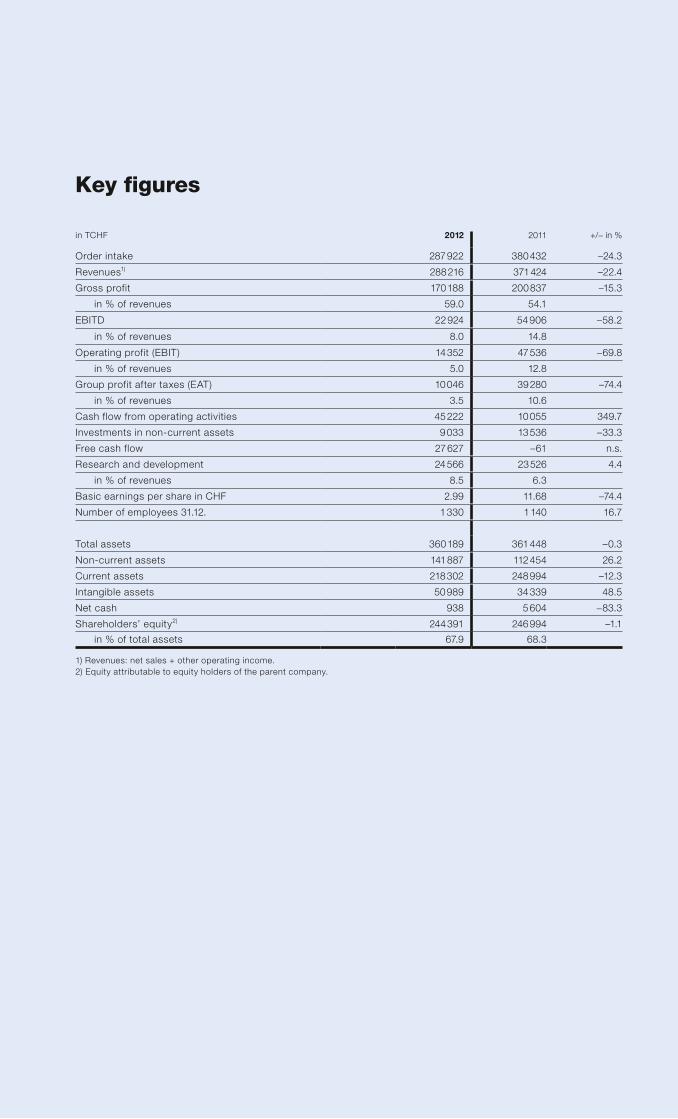
key figures
in TCHF 2012 2011 +/− in %
Order intake 287 922 380 432 –24.3
Revenues1) 288 216 371 424 –22.4
Gross profit 170 188 200 837 –15.3
in % of revenues 59.0 54.1
EBITD 22 924 54 906 –58.2
in % of revenues 8.0 14.8
Operating profit (EBIT) 14 352 47 536 –69.8
in % of revenues 5.0 12.8
Group profit after taxes (EAT) 10 046 39 280 –74.4
in % of revenues 3.5 10.6
Cash flow from operating activities 45 222 10 055 349.7
Investments in non-current assets 9 033 13 536 –33.3
Free cash flow 27 627 –61 n.s.
Research and development 24 566 23 526 4.4
in % of revenues 8.5 6.3
Basic earnings per share in CHF 2.99 11.68 –74.4
Number of employees 31.12. 1 330 1 140 16.7
Total assets 360 189 361 448 –0.3
Non-current assets 141 887 112 454 26.2
Current assets 218 302 248 994 –12.3
Intangible assets 50 989 34 339 48.5
Net cash 938 5 604 −83.3
Shareholders’ equity2) 244 391 246 994 –1.1
in % of total assets 67.9 68.3
1) Revenues: net sales + other operating income. 2) Equity attributable to equity holders of the parent company.

operating profit/loss (eBiT)in TCHF
1) Revenues: net sales + other operating income.
2) Equity attributable to equity holders of the parent company.
3) Net working capital: receivables + inventories . /. current liabilities.
Shareholders’ equity and equity ratioin TCHF
Shareholders’ equity2)
Equity in % of total assets
Net working capital (NwC)in TCHF
NWC3)
NWC in % of revenues1)
Group profit/loss after taxes (eaT)in TCHF
EAT
EAT in % of revenues1)
EBIT
EBIT in % of revenues1)
2008 2009 2010 2011 2012
150 000 60.0%
40.0%
20.0%
0%
100 000
50 000
0
2008 2009 2010 2011 2012
300 000 90.0%
60.0%
30.0%
0%
200 000
100 000
0
2008 2009 2010 2011 2012
40 000 16.0%
8.0%
0%
−8.0%
20 000
0
−20 000
2008 2009 2010 2011 2012
40 000 16.0%
8.0%
0%
−8.0%
20 000
0
−20 000

annual Report 2 Shareholders’ Letter 4 Locations 6 Business Model and Strategy 10 Board of Directors 12 Executive Committee
Business Units 14 Wire 20 Solar 26 Medtech
32 Sustainability and Social Responsibility
35 Corporate Governance
44 Information for Investors
47 Financial Report 48 Consolidated Financial Statements 97 Financial Statements of Komax Holding AG 106 Corporate Structure
Further Information 110 Glossary 112 Addresses 116 Five-Year Overview

all in all well performed in 2012
Dear Shareholders,
2012 was a year of many challenges. On the one hand, it was characterized by the extremely pleasing mo-
mentum enjoyed by Komax Wire. Here, we further strengthened an already good market position by making
two acquisitions. On the other hand, market conditions meant that both Komax Solar and Komax Medtech
posted declining sales, and far-reaching measures had to be taken in response. All in all, however, Komax
performed well last year.
Consolidated revenues by the Komax Group amounted to CHF 288.2 million in 2012 (2011:
CHF 371.4 million). Of the overall change of –22.4%, the above-mentioned acquisitions contributed +4.5%
and currency influences +1.8%, which means that internal growth amounted to –28.7% in a year-on-year
comparison. The operating profit (EBIT) declined by 69.8% to CHF 14.4 million (2011: CHF 47.5 million).
However, this figure includes restructuring costs of CHF 1.7 million. In addition, provisions and allowances
were increased by CHF 4.8 million as a result of existing risks. The EBIT margin amounted to 5.0% (2011:
12.8%). The currency influence here was equivalent to +0.6 percentage points. Despite the challenging
envir onment and negative currency developments affecting the financial result, Group profit after taxes
(EAT) came in at CHF 10.0 million (2011: CHF 39.3 million). Accordingly, basic earnings per share
amounted to CHF 2.99 (2011: CHF 11.68).
The Komax Group is still on a very solid financial footing. On the balance sheet date, shareholders’
equity amounted to CHF 244.4 million (2011: CHF 247.0 million) while the equity ratio stood at 67.9%
(2011: 68.3%). Free cash flow increased to CHF 27.6 million (2011: CHF –0.1 million). Net cash stood at
CHF 0.9 million (2011: CHF 5.6 million).
Market position strengthened
Komax Wire was able to build on the good results of the previous year to a significant extent, and once again
posted an excellent result in 2012. The key end consumer markets such as the automotive, household
goods, electronics, and telecommunication products industries proved stable. A global presence combined
with an outstanding profile in local markets to smooth out the often different demand trends in the indi-
vidual regions. Order intake amounted to CHF 231.1 million (2011: CHF 232.3 million), or CHF 214.1 million
when adjusted for acquisitions. Net sales amounted to CHF 228.3 million (2011: CHF 217.8 million), or
CHF 211.5 million when adjusted for acquisitions. EBIT came in at a high CHF 52.7 million (2011: CHF 57.1
million). As part of our growth strategy, we expanded the market position of Komax Wire strongly in the
year under review. This was achieved on the one hand through the acquisitions of TSK Group and MCM
Cosmic KK, which will enable us to grow along the value chain and perfectly complement our existing
product portfolio. On the other hand, several innovative solutions became ready for market last year. Moreover,
we further increased the efficiency and responsiveness of our organization through numerous initiatives.
2

Measures to improve profitability implemented
At Komax Solar and Komax Medtech, by contrast, we pursued defensive strategies aimed at preserving
value and steering the two business units out of the loss zone. It is widely known that the solar industry
has been in crisis for a considerable period of time. As a result of significant surplus capacity among module
producers, order intake of equipment manufacturers recorded a year-on-year decline of around 90%
in 2012. Komax Solar could not escape the consequences of this collapse. Overall, net sales amounted to
CHF 9.9 million (2011: CHF 70.8 million), while EBIT came in at CHF –21.2 million (2011: CHF –3.4 million).
This figure includes restructuring costs of CHF 1.7 million. However, cash flow from operating activities was
even slightly positive. We responded with far-reaching measures, namely reducing headcount by more than
50% in a year-on-year comparison, closing certain sites, and streamlining the product range. This has laid
the basis for improving the income situation and safeguarding our competitive position when the anticipated
market recovery arrives.
Komax Medtech suffered as a result of reticent investment activity on the part of numerous custom-ers who postponed projects. As a result, net sales declined to CHF 49.8 million (2011: CHF 83.8 million). In addition, the proportion of business with repeat character, which typically generates more attractive margins, declined in the year under review. This development, together with low capacity utilization, a negative currency situation, and unexpected additional expenses incurred on individual projects, ultimately led to a disappointing EBIT of CHF –8.6 million (2011: CHF 3.8 million). The measures to improve profitability in-itiated the previous year were therefore pursued vigorously and expanded. In addition, Komax Medtech has embarked on a cooperation with a partner company, and this will provide further impulses to strengthen its market position.
A word of thanks
We would like to thank our customers and business partners for their confidence and constructive partner-
ship. A special thank goes to our employees for their excellent work. Last but not least, we also thank you,
our valued shareholders, for your trust and unwavering loyalty to our company.
Payout ratio increased
The Board of Directors would like to adhere to its attractive dividend policy and is therefore proposing to the
Annual General Meeting a distribution of CHF 2.00 per share from the capital contribution reserves. The pay-
out ratio will therefore rise in a year-on-year comparison. The dividend yield on the date of the Board reso-
lution stood at an attractive 2.5%.
Outlook
The macroeconomic outlook remains uncertain, and visibility is still poor. Making predictions for the future
is therefore anything but easy. That notwithstanding, Komax has laid the foundations for the continued
growth of profitability at Komax Wire and a sustainable improvement in the income situation of the other
two business units. As things stand, the Group is set to deliver a significantly improved year-on-year result
in 2013.
Leo Steiner Beat Kälin
Chairman of the Board of Directors Chief Executive Officer
3 Annual Report 6 Business Model 14 Wire 20 Solar 26 Medtech 35 Corporate Governance 44 Investors 47 Financial Report 106 Corporate Structure

komax is where its customers areKomax has production plants in Europe, North and South America, Asia, and Africa, and provides sales and service support in some 60 countries through its subsidiaries and independent agents.
This carefully cultivated proximity to its markets and customers allows Komax to identify needs and trends at an early stage. Fur-thermore, with its many years of experience in the development of automation solutions, Komax is in a position to transform these insights rapidly into needs-oriented and efficient solutions for its customers all around the world. At the same time, its global distri-bution and service network guaran-tees fast response times.
4

komax production site
komax sales and service
komax participation
Sales representative
headquartersKomax Holding AGDierikon, Switzerland
5 Annual Report 6 Business Model 14 Wire 20 Solar 26 Medtech 35 Corporate Governance 44 Investors 47 Financial Report 106 Corporate Structure

The komax Group is a global technology company that focuses on automation solutions for selected processes in the automotive, solar, and pharma - ceutical industries. The Group’s core competency is mechatronics, i.e. the interdisciplinary interaction of precision engineering, electronics and informa- tion technology.
Business model and strategy
In operational terms, the business is split into three segments (business units). These operate as autono mous brands in a number of different mar-kets and fields of application:− Komax Wire offers a comprehensive range of
automated, intelligent solutions for all wire-pro-cessing applications as well as the testing of har-nesses and installation-ready vehicle modules.
− Komax Solar focuses on the core processes that make up the back end of solar module production.
− Komax Medtech develops sophisticated, cus-tomer-specific machine systems primarily for the automatic assembly of mass-produced medical devices, such as insulin pens and syringes.
Komax Wire is the Group’s strongest business unit in terms of revenues. The wire-processing industry is where Komax has its roots. This business has been built up and continuously developed over the last 35 years. The origins of Komax Solar and Komax Medtech go back to acquisitions made around a de c-ade ago. The range of products and services offered in the area of automated assembly at the time were then gradually concentrated into today’s activities.
Growth-oriented strategyKomax pursues a strategy based on internal growth that is profitable in the long term, supplemented by selective acquisitions. Within this framework, the company is keen to create value for all its stakehold-ers and endeavours to combine successful long-term business activity and commercial growth with envir-onmentally aware and socially responsible conduct.Group strategy is implemented by way of individu-ally defined strategic measures at business unit level. The individual business units’ main strategic areas of focus are outlined on pages 18, 19, 24 and 30 of the Annual Report.
Selective acquisitionsKomax’s main focus is on internal growth. In add-ition, potential acquisition candidates and any take-over opportunities that arise are carefully examined as part of a clearly defined acquisition strategy. Komax is generally interested in companies with the poten-tial to help the Group achieve its strategic goals. In the year under review, Komax acquired two compan-ies whose businesses ideally complement that of the Wire business unit and strengthen its market posi-tioning further, namely TSK Group and MCM Cosmic KK, Tokyo.
6

Global production, local distribution, and service networkKomax has 15 production sites worldwide, namely in Switzerland, Germany, France, the US, Brazil, Tunisia, Turkey, China, Malaysia and Japan. Fur-thermore, the Group provides sales and service support in around 60 countries through subsidiaries and independent agents. It can therefore provide an efficient and competent service to its customers, most of whom operate globally, at all times. Komax is steadily expanding its presence in the emerging economies in line with the steep rise in demand from these markets. This carefully cultivated prox-imity to its markets and customers allows Komax to identify needs and trends at an early stage. Further-more, with its many years of experience in the de-velopment of automation solutions, Komax is in a position to transform these insights rapidly into needs-oriented and efficient solutions for its cus-tomers all around the world. At the same time, its global distribution and service network guarantees fast response times.
Sales growth and EBIT margin targetsKomax has further increased its transparency vis-à-vis its stakeholder groups, publishing comprehen-sible medium-term sales growth and EBIT margin targets for the individual business units. The diver-gent business models used by the three business units call for different degrees of capital commit-ment. The EBIT margins required to generate value for the Group thus differ from one business unit to another.
Komax Wire managed to exceed its targets for EBIT. In 2012, the business unit generated growth of 4.8% and an EBIT margin of around 23%, being within the sales target range of 3–5% and surpass-ing the 20% margin target respectively. This high-lights the strong competitiveness of the customer solutions offered and the business unit’s excellent efficiency, which has been achieved through continu ous improvements to operating processes and pronounced cost awareness. However, it would be very ambitious to maintain the EBIT margin at this level in the long run. Komax expects planned product and market developments coupled with the seizing of additional growth opportunities to further push up the business unit’s absolute sales and EBIT figures so that the EBIT margin levels off at around its target level of 20% in the medium term.
Komax Solar was unable to achieve its target of +20% for sales and around 8% for EBIT margin. In-deed, sales declined sharply at –86.1% and only reached CHF 9.9 million. EBIT came in at CHF –21.2 million, which resulted in a negative operating
Net salesby segment
Net sales by region
in TCHF 2012 2011 +/– in %
Switzerland 5 624 16 267 –65.4
Europe (incl. Africa) 141 736 172 653 –17.9
North/South America 81 626 74 583 9.4
Asia 57 739 106 526 –45.8
Total 286 725 370 029 –22.5
Revenue growth target
in % Target 2012 2011
Komax Wire ~3–5% 5% 12%
Komax Solar ~20% –86% 12%
Komax Medtech –1) –41% 1%
1) The Medtech business unit is in the systems business, i.e. it mainly manu-factures complex, customer-specific systems. In this business, targeted selection of the projects to be acquired is more important than sales growth per se. For that reason, no sales growth target has been defined for this unit for the time being.
eBiT margin target
in % Target 2012 2011
Komax Wire ~20% 23.1% 26.2%
Komax Solar ~8% n.s. –4.9%
Komax Medtech ~5% n.s. 4.6%
3%Solar
79%Wire
18%Medtech
7 Annual Report 6 Business Model 14 Wire 20 Solar 26 Medtech 35 Corporate Governance 44 Investors 47 Financial Report 106 Corporate Structure

profit margin. Significant surplus capacity and a downward trend in solar module prices triggered a crisis for the solar industry in mid-2011 from which it has yet to recover. An indication of the extent of this slump can be gleaned from investment in new equipment, which posted another year-on-year de-cline of around 90%. Komax Solar was unable to utilize sufficient capacity to generate a positive re-sult. Measures to rapidly adjust structures to the prevailing demand situation were unavoidable. Moreover, the business unit’s range was even more rigorously aligned with its core products (stringers, lay-up systems, and laminators). Komax Solar has thereby fulfilled a number of key prerequisites to re-main competitive in key segments and participate actively in future market developments.
Komax Medtech was unable to build on the pre-vious year’s good results in 2012, falling well short of its EBIT margin target of around 5%. With EBIT coming in at CHF –8.6 million, the operating profit margin proved negative. The strategy of focusing increasingly on projects offering repeat business in specific market segments may have reduced indi-vidual project risk, but it also increased the depend-ency of this business unit on a potentially smaller number of customers and orders. In the year under review, a number of customers postponed their planned investments as a result of the continued economic uncertainty. Due to the tighter business focus described above, it proved impossible to compensate for these unimplemented projects. The resulting underutilization of capacity, together with additional expenses incurred on individual projects and primarily currency-related pressure on margins, ultimately resulted in the above-mentioned negative operating result for 2012. Komax is working inten-sively on solutions to improve the unsatisfactory income situation.
Innovative strengthFor many years now, Komax has been continuously investing in innovations that optimize its existing product range and in new developments with the aim of increasing the efficiency and safety of its cus-tomers’ processes.
But Komax is determined to do more than just develop improved machinery and software plat-forms. It intends to develop holistic and innovative machine and production concepts that will create value for customers which goes beyond the costs savings achieved by improving the performance of individual machines. Over the last few years, the Group has invested more than 5% of its sales in
doing so, and in 2012 employed no less than 140 staff in research and development. Furthermore, some 200 engineers make a substantial contribution to innovation thanks to the experience they have gained in developing customer-specific applications.
Markets and customersKomax Wire generates around 80% of its sales through customers in the automotive industry. This is attributable to the fact that this industry is the most advanced in terms of automation. The high volume of wires it needs to process in large batches and the stringent requirements in place with regard to finish quality make automated solutions the favoured option for this sector.
The automotive industry is experiencing struc-tural growth. IHS Global Insight anticipates that the quantity of vehicles produced and sold worldwide will grow by an average of 4% a year between 2012 and 2019. However, the demand for automation so-lutions for processing the wires and wire harnesses installed in vehicles is not determined solely by the number of cars produced and sold, but also by technical innovations such as increasingly complex functionalities and safety equipment, as well as op-timized and new drive systems. This is resulting in a higher level of electronic systems in vehicles and an increasing number of wire connectors. At the same time, the ongoing process of miniaturization is lead-ing to demand for ever thinner wires and smaller housings, which remain difficult to process and in-sert by hand. Developments of this kind are leading automotive industry suppliers to invest in automa-tion solutions that go beyond the level of investment required by vehicle volume growth alone.
The other markets serviced by Komax Wire, such as control cabinet manufacturing, household appliances, electronic devices and components, and solar cables, account for around 20% of the unit’s sales today. However, in view of the an-nounced intention to increase penetration in these markets, they have the potential for higher than pro-portional growth in the longer term. Komax Wire is very well positioned in the market for wire-process-ing machines, with a global market share of around 40%. Komax Wire’s customer base includes all the globally active wire-processing companies and is well represented in the fragmented market for small-business customers. Thanks to the acquisition of TSK Group and MCM Cosmic KK, Tokyo, the busi-ness unit has been able to significantly strengthen its market position once more. The products of these two companies perfectly complement Komax Wire’s product range.
8

Komax Solar operates in the field of renewable energies. Today renewables, and in particular solar energy, have attained worldwide recognition as safe and reliable energy sources. Although the solar in-dustry has been in crisis since mid-2011, it is still reasonable to assume that the medium- and long-term prospects for robust growth remain intact. Re-cently, falling prices have brought the costs of solar energy closer to grid parity, thus further increasing its attractiveness. However, the industry is currently confronted with massive surplus capacity world-wide, and this will first have to be eliminated before the industry can invest in new equipment.
In the last few years, solar module production has shifted to Asia, and especially China. Today, China’s share of global manufacturing volumes stands at around 80%, making it the key market for equipment suppliers. Komax Solar is very well repre-sented in China and is focusing its market cultivation efforts on the so-called tier 1 manufacturers. The business unit is one of the top suppliers of stringer systems worldwide.
The majority of Komax Medtech’s customers operate in the pharmaceuticals industry. Final de-mand for medical devices is enjoying a long-term growth trend. This is due partly to general demo-graphic developments, and partly to the increasing trend towards self-medication. Demand for automa-tion solutions for the production of self-medication devices is linked to the investment behaviour of the pharmaceuticals industry. As a rule, new projects are awarded as part of invitations to tender. In the major-ity of cases, these are for solutions that are custom-developed for a specific customer or product. Suc-cess in this business is very heavily dependent on the careful selection of projects and the establishment of a balanced project portfolio. A well-structured pro-ject portfolio is founded upon a substantial pro por - t ion of projects providing repeat business, plus some new projects with the potential for repeat business.
Net salesby industry
market sharesKomax Wire
Komax Wire
Competitor 1
Competitor 2
Competitor 4
Others
Competitor 3
Komax Medtech
Competitor 1
Competitor 2Competitor 3
Others
Competitor 4
market sharesKomax Medtech
17%Others
63%Automotive
3%Solar
17%Medtech
9 Annual Report 6 Business Model 14 Wire 20 Solar 26 Medtech 35 Corporate Governance 44 Investors 47 Financial Report 106 Corporate Structure

Board of Directors
Leo Steiner (1943)
Non-executive, independent mem-ber of the Board of Directors since 1997, Chairman of the Board of Directors since 2007, elected until 2015, Swiss national, resident in Steinhausen.
Leo Steiner holds a degree in engin-eering from ETH Zurich. Before join-ing Komax, he worked at Hayek En-gineering & Management Consulting, Zurich, Landis & Gyr, Zug, and Sulzer Escher-Wyss, Zurich. From 1992 to 2007, he was CEO of the Komax Group. In the last three years, Leo Steiner has not been a member of Group Manage-ment or had any material business relationships with the Komax Group.
Max Koch (1949)
Non-executive, independent member of the Board of Directors since 1997, elected until 2014, Swiss national, resident in Meggen.
Max Koch holds a degree in elec-trical engineering from ETH Zurich. After founding Komax in 1975, he headed the company until 1991 as CEO, and was Chairman of the Board of Directors until 1997. In the last three years, Max Koch has not been a member of Group Management or had any material business relationships with the Komax Group.
Melk M. Lehner (1947)
Non-executive, independent member of the Board of Directors since 1997, elected until 2013, Swiss national, resident in Zumikon, Chairman of the Board of Directors of Sihl Manegg Immobilien AG, Zurich, member of the Board of Directors of Landert Motoren AG, Bülach.
Melk M. Lehner holds a degree in mechanical engineering from ETH Zurich. He has held various management positions at Mettler-Toledo AG in Greifensee and Saurer AG in Arbon. In the last three years, Melk M. Lehner has not been a member of Group Management or had any material business relationships with the Komax Group.
10

Daniel Hirschi (1956)
Non-executive, independent member of the Board of Directors since 2005, elected until 2014, Swiss national, resident in Biel, Chairman of the Board of Directors of listed company Schaffner Holding AG, Luterbach, member of the Board of Directors of listed company Gavazzi Holding AG, Steinhausen, and of the privately owned company Benninger AG, Uzwil.
Daniel Hirschi holds a degree in en-gineering. From 1983 to 2005, among others he was Head of the Switches business area at Saia-Burgess in Murten, and later Head of the Automotive Division. From 2001, he was CEO, and from 2003 member of the Board of Directors. From 2006 to 2009, Daniel Hirschi was CEO and member of the Board of Directors of Benninger AG in Uzwil, he has been a member of the Board of Directors since March 2009. In the last three years, Daniel Hirschi has not been a member of Group Management or had any ma-terial business relationships with the Komax Group.
Hans Caspar von der Crone (1957)
Non-executive, independent mem-ber of the Board of Directors since 1997, elected until 2015, Swiss national, resident in Zurich, mem-ber of the Board of Directors of Heineken Beverages Switzerland AG, Chur, and Heineken Re AG, Zug, a Swiss subsidiary of the Heineken Group.
Hans Caspar von der Crone is an attorney at law. Following his studies, he lectured at the University of Zurich and was an employee and later a partner at law firm Hom-burger Rechtsanwälte, Zurich. Since 1997, he has been a Professor of Private, Commercial and Corporate Law at the University of Zurich. He is also a partner at law firm von der Crone Rechtsanwälte AG, Zurich. In the last three years, Hans Caspar von der Crone has not been a mem-ber of Group Management or had any material business relationships with the Komax Group.
Kurt Haerri (1962)
Non-executive, independent mem-ber of the Board of Directors since 2012, elected until 2015, Swiss national, resident in Birrwil.
Kurt Haerri holds a degree as a Mech anical Engineer of the Lucerne University of Applied Sciences and graduated at the University of St.Gallen as an Executive MBA HSG. Kurt Haerri has been working at Schindler since 1987, from 1996 to 2003 in China. Today, he leads the Top Range Division, a world-wide competence and profit center for high-rise elevators of Schindler Elevators Ltd. Since 2006, Kurt Haerri has been the President of the Swiss-Chinese Chamber of Com-merce. In addition, he is a lecturer at the Swiss Federal Technical Insti-tute Zurich. In the last three years, Kurt Haerri has not been a member of Group Management or had any material business relationships with the Komax Group.
11 Annual Report 6 Business Model 14 Wire 20 Solar 26 Medtech 35 Corporate Governance 44 Investors 47 Financial Report 106 Corporate Structure

executive Committee
Beat Kälin (1957)
Chief Executive Officer since 2007, at Komax since 2006, Swiss na-tional, resident in Birmensdorf, member of the Board of Directors of listed company Huber + Suhner AG, Pfäffikon (ZH).
Beat Kälin holds a doctorate in engineering from ETH Zurich and an MBA from INSEAD. Until 1999, he held various management positions in the Elektrowatt Group, from 1999 to 2004, he was a member of the Group Executive Board of SIG Schweizerische Industrie- Gesellschaft Holding AG, Neuhausen, and from 2004 to 2006 a member of the Board of Management respon-sible for the Packaging Technology Division at Robert Bosch GmbH, Stuttgart.
Matijas Meyer (1970)
Head Business Unit Wire since 2010, at Komax since 2007, Swiss national, resident in Ebikon.
Matijas Meyer holds a degree in engineering from ETH Zurich and an MBA from Cranfield University (UK). Prior to his current position, he was Head of the site in Rousset (France). Before joining Komax, he worked at Tornos SA in Moutier and Unaxis/ESEC in Cham.
Andreas Wolfisberg (1958)
Chief Financial Officer since 1996, at Komax since 1991, Swiss national, resident in Adligenswil.
Andreas Wolfisberg is a Swiss Cer-tified Expert in Accounting and Controlling. Before joining Komax, he worked at Moos Stahl AG in Lucerne.
12

Serge Peguiron (1961)
Head Business Unit Medtech and at Komax from 2005 until end of August 2012, Swiss national, resi-dent in Neuchâtel.
Serge Peguiron holds a degree in engineering from ETH Zurich. Before joining Komax, he worked at Ismeca in La Chaux-de-Fonds, Valtronic in Les Charbonnières and Kudelski in Cheseaux.
René Ronchetti (1968)
Head Business Unit Medtech since September 2012, at Komax since September 2012, Swiss national, resident in Murten.
René Ronchetti holds a degree in engineering (computer science) from Berne University of Applied Sciences. He is also an industrial engineer and holds an MBA from Strathclyde University (UK). The most important positions before joining Komax were at RUAG in Berne and Geneva, Oerlikon Balzers in Paris and Ascom Autelca in Berne and Paris.
Walter Nehls (1957)
Head Business Unit Solar and at Komax since 2008, German national, resident in Udligenswil.
Walter Nehls holds a bachelor degree from the University of Applied Sciences and Arts North-western Switzerland and an MBA from Lucerne University of Applied Sciences and Arts. Before joining Komax, he worked at ESEC SA in Cham, Schindler AG in Ebikon, Forbo/Siegling in Hannover (Germany) and Mania Technologie AG in Weilrod (Germany).
13 Annual Report 6 Business Model 14 Wire 20 Solar 26 Medtech 35 Corporate Governance 44 Investors 47 Financial Report 106 Corporate Structure

wire business unit
Long live the cable!The global demand for the kind of ready- assembled cables manufactured by komax systems knows neither geographical nor technical boundaries. Buoyed by demand from new markets, global automotive sales are growing relentlessly. at the same time, environmental and safety considerations together with the ever more complex equip- ment installed in vehicles are increasing the demand for thin cables. anyone who be- lieves the future is completely wireless is very wrong.
Alpha 355
14


Komax Wire specializes in automated intelligent so-lutions for all wire processing applications. The em-phasis is on processes such as measuring, cutting, stripping, and fitting contacts and connector hous-ings to cables. In addition to both standard and cus-tomer-specific systems, it offers an extensive range of quality assurance modules and networking solu-tions for reliable and efficient production.
In August 2012, Komax Wire acquired TSK Group, thereby expanding its competencies in the area of quality testing. TSK operates in the same markets and has an identical customer base. Its products are complementary. TSK’s test systems measure and compare electrical and other physical properties of harnesses and assemblies such as doors, seats, cockpits, and bumpers, and test their functionality.
Komax Wire produces solutions for wire pro-cessing at two production sites in Switzerland as well as in China and Japan. TSK’s test systems are manufactured in Germany, Turkey, the US, Brazil, China, and Tunisia. Very short lead times for the de-livery of test adapters demand geographical prox-imity to customers.
Once systems and equipment have been com-missioned, both Komax Wire and TSK provide a full range of services to guarantee installations’ per-form ance and preserve their value.
Komax Wire’s wire processing and test systems are primarily used in the automotive supply indus-try. The large volume of wiring used by this industry, coupled with its traditionally high quality demands, favours automated and systematic production pro-cesses and methods.
Komax Wire’s systems are also used in manu-facturing household appliances and consumer elec-tronics, producing solar panel cabling and building control cabinets.
With market shares estimated to be in the re-gion of 40%, both Komax Wire and TSK are global leaders in the niche markets they cover.
Market trends and business performanceThe global automotive market was stable in 2012 and generated a sales volume of 68 million units (+4%). With the exception of Western Europe, all key markets enjoyed growth: the US with a good 13%, China with around 8%, and India and Russia with about 10% each. State support programs and the need to catch up after the nuclear catastrophe of Fukushima saw demand in Japan rise by 30%. Against a backdrop of continuous economic growth, vehicle sales in Brazil rose by 6%. In West-ern Europe, by contrast, the situation remained dif-ficult. France, Italy, and Spain suffered significant falls in demand, while Germany experienced a de-cline of 3%. The only exception was the United Kingdom, which generated growth of 5%.
Thanks to its worldwide presence and global access to clients, Komax Wire was able to balance out the varying rates of development in individual geographic markets, benefiting in particular from the healthy state of the North American automotive market. Moreover, the business unit also enjoyed stable sales development outside the automotive
market position strengthenedKomax Wire followed on from 2011’s good results with an excellent year. The business unit benefited from its leading technology, global presence, and strong profile in local markets, as well as from the continued robust health of large parts of the automotive industry. In addition, Komax Wire further strengthened its position in the year under review through its ac-quisitions of TSK Group and MCM Cosmic KK. Net sales amounted to CHF 228.3 million (+4.8%), while EBIT came in at CHF 52.7 million.
16

industry, such as in the areas of household goods, electronics, control cabinet construction, and tele-communications.
Following the record result of the previous year, Komax Wire once again performed very successfully in the year under review. Order intake amounted to CHF 231.1 million (2011: CHF 232.3 million), while net sales came in at CHF 228.3 million (2011: CHF 217.8 million). When adjusted for acquisitions, these figures work out at CHF 214.1 million and CHF 211.5 million respectively. The book-to-bill ratio at the end of the year was 1.01. There was a broad-based spread of business with respect to both the product and the customer mix. In addition to the traditionally strong-selling products, the Gamma 253 and 263, which had been launched the previous year, lived up to their high sales expectations. Another pleasing development was the demand for fully automated cable processing and twisting solutions. Komax Wire offers the market a unique solution in the form of the Alpha 488.
In 2012, Komax Wire generated around a third of its net sales with its ten largest customers. The rela-tionships with these key accounts have been built up over many years and are characterized by a very open, partnership-based dialogue. This motivates clients to provide prompt and direct feedback, which Komax Wire in turn uses to optimize its products and services on an ongoing basis.
EBIT in the year under review came in at CHF 52.7 million (2011: CHF 57.1 million). The dilu-tion of margins is essentially attributable to the gen-erally lower margins of the acquired businesses, integration costs, and investments in business de-velopment.
OperationsThe process of focusing production at the Dierikon and Rotkreuz sites in Central Switzerland was suc-cessfully completed in the middle of the year. This involved the reorganization and optimization of both operating processes and internal logistics. Capacity utilization remained high in the year under review. Flexible working time models and access to a large pool of external staff enabled the organization to respond flexibly to periods of peak demand.
Thanks to the acquisition of TSK Group, which was consolidated as of 1 August 2012, Komax Wire now has six further production sites. The integration of these locations into the organization of Komax Wire is proceeding according to plan.
Marketing and distributionThis year’s three-day in-house show in Dierikon at-tracted no less than 900 visitors. In addition to the established product range, the visitors were shown 20 new developments, primarily intended for quality monitoring in the manufacturing process. Moreover, the products of the new acquisitions TSK Group and MCM Cosmic KK were premiered, as were those of partner company SLE quality engineering. In other words, visitors were given an impressive demonstra-tion of Komax Wire’s wide range of competencies in wire processing and quality testing. In addition, Komax Wire participated in 20 trade fairs around the world. Furthermore, efforts to develop business out-side the automotive industry were intensified.
In order to ensure client proximity, Komax Wire further expanded its distribution and service organ-ization and embarked on the integration of the TSK lo-cations.
key figures
in TCHF 2012 2011 +/– in %
Order intake 231 107 232 319 –0.5
Net sales 228 255 217 792 4.8
Operating profit (EBIT) 52 729 57 073 –7.6
in %
EBIT margin 23.1% 26.2 %
As at 31 Dec.
Headcount 921 541 70.2
Net salesby region
30%North/SouthAmerica
38%Europe
11%Africa
19%Asia
2%Switzerland
17 Annual Report 6 Business Model 14 Wire 20 Solar 26 Medtech 35 Corporate Governance 44 Investors 47 Financial Report 106 Corporate Structure

InnovationIn 2012, research and development expenditure amounted to some 8% of net sales. Komax Wire and TSK employed some 120 staff in this area world-wide, and they duly came up with a number of pi-oneering innovations. These innovations are also the result of extensive client feedback and regular ex-perience-sharing with training centers and profes-sional communities within the industry. Furthermore,
some 80 engineers make a substantial contribution to innovation within the business unit thanks to the experience they have gained in developing cus-tomer-specific applications.
TrendsThe development trends that have been observed over the last few years are set to accelerate and in-tensify. The automotive industry is increasingly call-ing for subsystems and components that deliver more, weigh less, take up less space, and operate extremely reliably, while being cheap to procure. These demands are not only confronting direct sup-pliers to the automotive industry but also upstream suppliers and business partners. For a group like Komax, which continually operates at the forefront of technological development, these increasing de-mands first and foremost represent opportunities and potential growth drivers.
The electrical systems in today’s premium pas-senger cars are made up of as many as 1200 cables, with a good 2000 crimp contacts and a total length of three kilometres. Developments in vehicle construction, new functionalities, and an ever-rising
fit-out level in all vehicle classes will push these fig-ures up further in the future. Moreover, the individ-ual subsystems and assemblies, particularly har-nesses, are becoming ever more complex. In addition, given the growing trend towards miniatur-ization with a view to reducing manufacturing costs, weight and fuel consumption, the individual compo-nents to be processed are becoming ever smaller and more challenging to handle.
A large part of the cable harness manufacturing process today may still be done by hand, but inex-orably rising wage costs are making it worthwhile to invest in automation solutions. Moreover, growing complexity is increasing potential sources of error in manual wire processing and assembly. Manual pro-cesses are becoming less capable of meeting these demands. Intelligent automated solutions, quality assurance tools, and systems for testing harnesses before they are installed in assemblies and vehicles, are solutions that can guarantee and increase the efficiency and reliability of the production process.
Furthermore, wire processing is required in nu-merous other sectors of industry too. Particularly in sectors that use largely standardized, high-volume processes, the challenges are similar to those faced by the automotive industry. With its expertise and current product range as a basis, Komax Wire is ideally placed to establish a foothold in such mar-kets in the course of existing marketing activities and further innovations.
StrategyKomax Wire pursues four strategic priorities: First, it pursues further development of existing business along the value chain. This includes semi-auto-mated and fully automated solutions with integrated quality assurance. Solutions for increasing availabil-ity and testing the productivity of installed systems are as much part of this priority as new intelligent software interfaces and expanded quality testing capabilities. In the development of innovations, the second strategic priority, Komax Wire focuses on developing new solutions for the demands of the automotive industry and further optimizing its prod-uct portfolio with a clear product platform strategy. Under the third and fourth strategic priorities, Komax Wire will further strengthen its position in the Asian markets and break into new application areas outside the automotive industry.
Good prospects for growthGrowing trend towards further automation of produc-tion processes and higher quality requirements are all contributing to industrial investment in the solutions manufactured by Komax Wire.
18

The acquisition of TSK supports several of these strategic priorities at the same time, areas offering attractive synergies for good measure. The ex-panded offering covers the most capital-intensive and critical processes of the value chain. This will make it possible to offer customers single-source solutions for the most important wire processing ap-plications. The amalgamation of distribution func-tions is strengthening the market positions of both organizations. In addition, collaboration between Komax Wire und TSK will result in unique production concepts that will further simplify wire harness manu facturer’s processes.
MCM Cosmic KK enhances the product portfolio by adding machines that are used above all for wire processing in the telecommunications sector. In ad-dition, Komax Wire now has a presence in Japan in the form of a local company.
OutlookThe dynamic growth of the automotive industry, further increases in production volumes, and the growing trend towards further automation of pro-duction processes and higher quality requirements are all contributing to industrial investment in the solutions manufactured by Komax Wire. However, visibility in this area still does not extend more than two to three months into the future. On the basis of all the information currently available, we are ex-pecting Komax Wire’s net sales in the first half of 2013 to be in the area with those of the very good first semester of the previous year when adjusted for acquisitions.
Groundbreaking competencies in the value chain
Komax Wire systems
Measuring/cuttingStrippingCrimping Twisting Connector insertion
Harness sub-assembly
Wire harness test systems
Function test systems
Cables Contacts Housings
Cutting Preprocessing
Final assembly Testing WarehouseShipping
Installation Assembly
Componentmanufacturer
Wire harness manufacturer Original equipment manufacturer (OEM)
Wires, contact parts, and housings (connectors) are vendor parts for wire harness manufacturers. Finished wire har-nesses are used in vehicle electrical systems, household appliances, and other electronic devices. Komax Wire supplies wire harness manufacturers with solutions for automated and efficient wire processing. De pending on complexity and safety standards, which are especially
stringent in the automotive industry, wire harnesses cannot always be produced by machine. In final assembly, finished harnesses are assembled and tested by hand before being delivered to the OEM, who installs it in the final product.
19 Annual Report 6 Business Model 14 Wire 20 Solar 26 Medtech 35 Corporate Governance 44 Investors 47 Financial Report 106 Corporate Structure

Solar business unit
energy-laden pointsThe energy produced by the sun is as reliable as are systems built by komax for the automated manufac- ture of solar modules. with the sun as its partner, komax is paving the way for solutions which can provide people around the world with low-cost electricity. The fact that solar energy is also environmentally friendly is a truly warming thought.
XCELL X2 plus
20

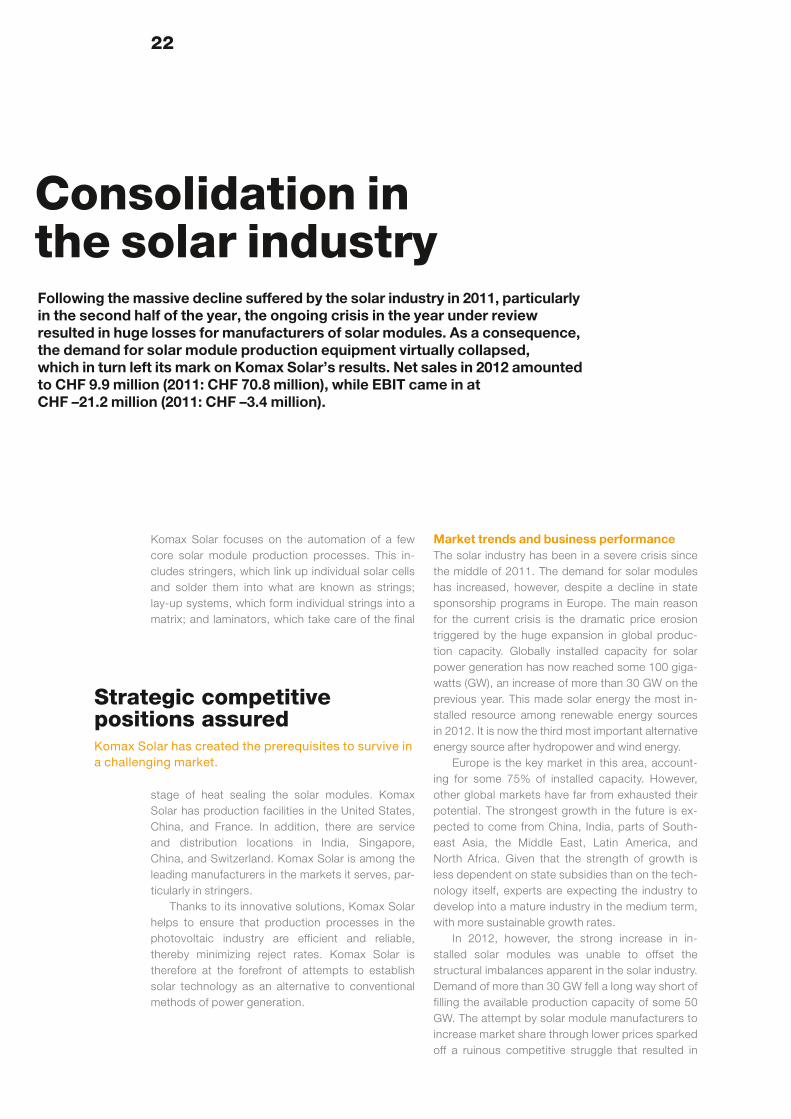
Strategic competitive positions assuredKomax Solar has created the prerequisites to survive in a challenging market.
Komax Solar focuses on the automation of a few core solar module production processes. This in-cludes stringers, which link up individual solar cells and solder them into what are known as strings; lay-up systems, which form individual strings into a matrix; and laminators, which take care of the final
stage of heat sealing the solar modules. Komax Solar has production facilities in the United States, China, and France. In addition, there are service and distribution locations in India, Singapore, China, and Switzerland. Komax Solar is among the leading manufacturers in the markets it serves, par-ticularly in stringers.
Thanks to its innovative solutions, Komax Solar helps to ensure that production processes in the photovoltaic industry are efficient and reliable, thereby minimizing reject rates. Komax Solar is therefore at the forefront of attempts to establish solar technology as an alternative to conventional methods of power generation.
Market trends and business performanceThe solar industry has been in a severe crisis since the middle of 2011. The demand for solar modules has increased, however, despite a decline in state sponsorship programs in Europe. The main reason for the current crisis is the dramatic price erosion triggered by the huge expansion in global produc-tion capacity. Globally installed capacity for solar power generation has now reached some 100 giga-watts (GW), an increase of more than 30 GW on the previous year. This made solar energy the most in-stalled resource among renewable energy sources in 2012. It is now the third most important alternative energy source after hydropower and wind energy.
Europe is the key market in this area, account-ing for some 75% of installed capacity. However, other global markets have far from exhausted their potential. The strongest growth in the future is ex-pected to come from China, India, parts of South-east Asia, the Middle East, Latin America, and North Africa. Given that the strength of growth is less dependent on state subsidies than on the tech-nology itself, experts are expecting the industry to develop into a mature industry in the medium term, with more sustainable growth rates.
In 2012, however, the strong increase in in-stalled solar modules was unable to offset the structural imbalances apparent in the solar industry. Demand of more than 30 GW fell a long way short of filling the available production capacity of some 50 GW. The attempt by solar module manufacturers to increase market share through lower prices sparked off a ruinous competitive struggle that resulted in
Consolidation in the solar industryFollowing the massive decline suffered by the solar industry in 2011, particularly in the second half of the year, the ongoing crisis in the year under review resulted in huge losses for manufacturers of solar modules. As a consequence, the demand for solar module production equipment virtually collapsed, which in turn left its mark on Komax Solar’s results. Net sales in 2012 amounted to CHF 9.9 million (2011: CHF 70.8 million), while EBIT came in at CHF –21.2 million (2011: CHF –3.4 million).
22

Net salesby region
huge losses for all producers. At the same time, solar module manufacturers cut their investment in new production systems to an absolute minimum, which led to a year-on-year decline of around 90% in equipment manufacturers’ order intake.
Komax Solar was unable to escape the repercus-sions of this collapse, particularly as the business unit started the year with a comparatively weak order book as a result of the crisis, which first broke out in 2011. Total net sales amounted to a modest CHF 9.9 million (2011: CHF 70.8 million). The geographic breakdown of this figure is fairly meaningless, as sales were primarily generated through replacement parts and service orders. Komax Solar continuously adapted its structures to the prevailing demand situ-ation throughout the year and reduced its cost base massively. As the impact of all these measures is subject to a time lag, however, there was no prevent-ing EBIT (CHF –21.2 million) from once again falling well short of the previous year’s equivalent (2011: CHF –3.4 million). However, cash flow from operating activities was even slightly positive.
A further negative factor for the business devel-opment of Komax Solar was the fact that many of its customers found themselves facing serious financial difficulties. All solar module manufacturers reported huge losses in the year under review, and a number of them even declared themselves insolv-ent. For Komax Solar this meant that any new orders involved significant default risks. Against this backdrop, the business unit adopted a highly cir-cumspect approach, only accepting orders that were financially secure.
OperationsThanks to the concentration of the core activities of Komax Solar in York, Pennsylvania (USA) – a strat-egy that was initiated in previous years –, the busi-ness unit was able to adapt its structure to the ser-ious deterioration in market conditions relatively swiftly. Headcount was reduced most heavily in the US. The distribution organization in the key market of China was less affected by these measures, so as not to jeopardize Komax Solar’s presence and excellent positioning in this market. Despite radical adjustments affecting around 50% of the workforce worldwide, the expertise required to ensure the on-going development of processes and products was kept largely intact in York. Komax Solar is therefore in a position to successfully defend its strong com-petitive position once the anticipated market recov-ery materializes.
Marketing and distributionIt is especially crucial to retain an ongoing profes-sional presence in the market and with customers when conditions are difficult. For this reason, Komax Solar took part in six trade fairs in 2012, albeit to a reduced extent in view of the challenging market situ ation. The service and distribution organization in China, which has its own exhibition area and train-ing center, is a key platform from which to offer cus-tomers in this key market the necessary support. At the same time, Komax Solar is keeping its eye on new markets such as South America with a view to participating in any build-up of module manufactur-ing in these markets right from the start.
key figures
in TCHF 2012 2011 +/– in %
Order intake 9 009 63 742 –85.9
Net sales 9 873 70 791 –86.1
Operating loss (EBIT) –21 171 –3 439 n.s.
in %
EBIT margin n.s. −4.9 %
As at 31 Dec.
Headcount 140 285 –50.9
24%Europe
30%Asia
46%North/South
America
23 Annual Report 6 Business Model 14 Wire 20 Solar 26 Medtech 35 Corporate Governance 44 Investors 47 Financial Report 106 Corporate Structure

InnovationIn order to maintain its leading position in the mar-ket for stringers, Komax Solar once again invested continuously in research and development in 2012. The main areas of focus were the further develop-ment of the induction soldering procedure on the one hand and the reduction of product costs on the other. The business unit is therefore remaining com-petitive against its Asian competitors in particular.
Solar cell technology is likely to progressively develop over the next few years towards what are known as backside-contact cells. Komax is al-ready cooperating with leading module manufac-turers to develop ways of processing of such cells.
Trends and strategyThe current situation in the solar industry is char-acterized by massive surplus capacity and major fi-nancial difficulties on the part of module manufac-turers. The consolidation of the industry is likely to continue. A proportion of the surplus capacity can
be found in Europe and the US, where attempts are being made to reduce the cost disadvantages of local manufacturers by imposing punitive tariffs on Chinese imports. However, a far greater proportion of the surplus capacity can be found in Asia, and particularly in China. Accordingly, consolidation be-tween the large Chinese module manufacturers is another prerequisite for a reduction in the substan-tial supply overhang.
The current state aside, the long-term drivers of the solar industry remain unchanged and intact. Major climate events and serious pollution prob-lems in major urban areas are increasingly highlight-ing the necessity of making greater use of renewa-ble energies. Other key factors that will drive growth in the solar industry and the business of Komax Solar include the world’s growing energy require-
ments and the need to safeguard energy supply in the longer term. The collapse in solar module prices has brought grid parity closer; in fact, it has even been reached in a number of countries. This is one of the key milestones that needs to be achieved for solar energy to establish itself as an alternative to traditional energy sources for a wider group of users.
In the 2012 financial year, Komax Solar focused its activities and adapted its structures to market conditions, without jeopardizing its exceptional pos ition in either its core product – the stringer – or its key market of China. Innovations that promise future success are being selectively driven forward. Komax Solar is therefore well placed to benefit when the expected market recovery kicks in.
OutlookSolar will remain an attractive market in the longer term. However, the major supply overhang in cap-acity for solar module manufacturing is preventing a short-term improvement in the competitive envir-onment, which means that the investment activity of solar module manufacturers is likely to remain re-strained in 2013 too.
As a supplier to solar module manufacturers, Komax Solar is directly affected and therefore antici pates another difficult year in 2013. Thanks to adjustments to structures and a dramatically re-duced cost base, the business unit expects a signif-icantly better EBIT figure this year, albeit without reaching positive territory.
Pressing ahead with innovationsKomax Solar is working with customers to realize pioneering concepts.
24

Groundbreaking competencies in the value chainKomax Solar systems
Stringers Lay-up systems Bussing systems Laminators Test equipment
Silicon crystal or ingot
Wafer production Solar cellproduction
Solar modul e production
Installation Electricity
Monocrystalline or polycrystalline silicon ingots are produced from quartz sand. These ingots are then sliced into micron-thin wafers. Next, the wafers are chemically treated and coated to make solar cells. The cells are then grouped, connected together, and installed in frames to form solar modules. This stage of manufacturing consists of many steps. Komax Solar produces machines to carry
out these processes. Once the solar modules have been installed on rooftops or in solar farms, they generate electric power.
25 Annual Report 6 Business Model 14 Wire 20 Solar 26 Medtech 35 Corporate Governance 44 Investors 47 Financial Report 106 Corporate Structure

medtech business unit
For a better life among the many tools available for containing costs in the health care industry, it is self-responsibility and self-medication that stand out most. komax promotes both – the latter through highly efficient systems that produce inhalers, injection systems, and other medical applications. komax machinery is used all around the world, helping millions of people to enjoy a better quality of life.
26


a highly attractive marketThe trend towards self-medication is set to continue.
Komax Medtech’s systems are mainly used in the pharmaceutical industry. The business unit develops complex, customer-specific machine systems pri-marily for the automatic assembly of mass-produced medical products, such as inhalers or insulin delivery and injection systems. Komax Medtech also pro-duces systems for the efficient mass production of inkjet printer cartridges. The purchase prices for these kinds of systems, which are for the most part
developed as part of customer-specific projects, range from a few hundred thousand to several mil-lion Swiss francs, depending on complexity.
Medical devices in particular are subject to especially rigorous cleanliness, quality, and safety requirements. Komax Medtech has many years of experience in this field, and has standardized and certified validation processes in place to ensure that its systems comply with all relevant standards.
Komax Medtech has production facilities at two locations in Switzerland, in the United States, and in Malaysia. Komax Systems LCF SA in La Chaux-de-Fonds, Switzerland, is the largest location in terms of employee headcount and is the business unit’s center of excellence.
Market trends and business performanceFor Komax Medtech, the 2012 financial year was heavily influenced by persistent uncertainties with respect to economic development in Europe. The reticent investment behaviour of numerous custom-ers, a phenomenon that was already evident during the fourth quarter of 2011 and led to projects being postponed, continued during the first half of 2012 and beyond. Given the prevailing backdrop, visibil-ity was extremely poor, which made capacity plan-ning commensurately challenging.
The strategy implemented back in 2011, namely to focus resolutely on projects for the self-medica-tion sector with repeat business or the potential for repeat business, was pursued consistently. How-ever, this strategy restricts the market being tar-geted, which can lead – particularly in an environ-ment like that of 2012 – to temporary surplus capacity. Another difficulty was the continued rela-tive strength of the Swiss franc, which prompted Komax Medtech to abandon certain projects for which it could no longer expect to generate reason-able margins.
Order intake was slow to develop in both the first and second semesters, before gathering mo-mentum towards the end of each period. In the final quarter of 2012, there were increasing signs that the market was beginning to normalize. A number of anticipated projects were then definitively added to the order books, and customers provided con-crete indications that further orders would follow in the first quarter of 2013. Net sales for the 2012 fi-nancial year amounted to CHF 49.8 million (2011: CHF 83.8 million). The lion’s share of this sum was generated with key account customers. From a re-gional perspective, Asia, the US, and Europe re-
Break in the upward trendIn 2012, Komax Medtech was unable to build on the good results of the previous year. Reticent investment activity on the part of customers, which had been evident for some time, led to projects being postponed. This phenomenon, com-bined with additional expenses incurred on individual projects and currency-related pressure on margins, led to unsatisfactory results. Net sales amounted to CHF 49.8 million (2011: CHF 83.8 million), while EBIT came in at CHF –8.6 million (2011: CHF 3.8 million).
28

mained the key areas, with the United Kingdom, Ire-land, and Scandinavia particularly important in the latter. As a result of the above-mentioned project postponements, the project mix in 2012 experi-enced a decline in the share of business with repeat potential, which typically generates more attractive margins. This increase in the risk profile, together with the capacity underutilization, a negative cur-rency situation, and unexpected additional ex-penses incurred on individual projects, led to a dis-appointing EBIT of CHF –8.6 million (2011: CHF 3.8 million).
OperationsThe business unit’s center of excellence, which is based in La Chaux-de-Fonds (CH), was hardest hit by the difficult market environment. Once it became clear that the order situation would not improve in the short term, Komax Systems LCF SA introduced short-time working for its workforce in June. This option enabled the company to avoid having to initi-ate redundancies as a result of the temporarily inad-equate order situation, and it was thus able to retain the full expertise of its workforce. Short-time work-ing was finally suspended at the end of November once the situation improved.
The programs initiated in 2011 in the areas of standardization, cost-controlling, procurement man-agement and project management for the purpose of improving profitability were pursued resolutely at all locations in 2012. Organization was strength-ened at both Komax Rockford, Illinois (USA), and the plant in Penang (MY) in order to reduce depend-ency on the parent company. The Rotkreuz site, which specializes in laboratory automation sys-tems, optimized its internal operational processes and duly received ISO 13485 certification in Octo-ber. This standard defines the requirements to be satisfied by comprehensive management systems for the design and manufacture of medical prod-ucts.
Marketing and distributionKomax Medtech was present at ten trade fairs in the year under review. Furthermore, the marketing and sales organization was strengthened in 2012, particularly in the area of key account management, with a view to being able to respond even more ef-fectively to the needs of key customers.
InnovationKomax Medtech possesses four platforms for the assembly of a wide range of different medical equip-ment devices, covering the entire manufacturing cycle from clinical trials to mass production. In 2012, these platforms were further improved and optimized.
Moreover, Komax Medtech again succeeded in automating a number of its customers’ key pro-cesses by delivering innovative solutions. Notewor-thy examples here include a process for accurately affixing complex labelling on a metered-dose aero-sol or contact-free dispensers on the tips of insulin needles. In addition, Komax Medtech created a complete assembly line that meets the high stand-ards required for approval for use in cleanroom labor atories. This assembly line forms the ends of plastic cannulas for insulin patch pumps. These in-
key figures
in TCHF 2012 2011 +/– in %
Order intake 47 806 84 371 –43.3
Net sales 49 804 83 778 –40.6
Operating loss/profit (EBIT)
–8 600
3 840
–324.0
in %
EBIT margin n.s. 4.6%
As at 31 Dec.
Headcount 256 302 –15.2
Net sales by region
22%North/SouthAmerica
25%Asia
48%Europe
5%Switzerland
29 Annual Report 6 Business Model 14 Wire 20 Solar 26 Medtech 35 Corporate Governance 44 Investors 47 Financial Report 106 Corporate Structure

jection needles are the core element of these pumps, which are worn on the skin and deliver insu-lin to people with diabetes over period of several days.
Trends and strategyIt is a regrettable fact that the number of individuals suffering from diabetes worldwide will continue to rise over the next few years. In its report of Septem-ber 2012, the World Health Organization assumes that the number of afflicted individuals will have risen by two thirds from today’s 347 million by 2030. The number of asthma sufferers, which is currently around 235 million people, is also set to rise.
There are already a number of suitable treat-ments that allow diabetes and asthma sufferers to manage their conditions themselves, and this trend
towards self-medication will likewise strengthen in the future. New applications and treatments will fur-ther increase the safety and cost efficiency of this form of administration, which in turn will make them accessible to a larger number of people. Moreover, industrialized nations in particular are being forced to address the growing problem of continually rising health care costs, and are also looking to further im-prove the quality of life and reduce the unpleasant-ness of administering medication. These factors are driving the development of new applications to ad-minister treatments, and laying the basis for further demand for medical product assembly systems.
Inhaler and insulin administration applications are a strategic focus of Komax Medtech, which is one of the globally acknowledged market leaders in these segments thanks to its long-standing experi-ence and strong technical skills. Komax Medtech is determined to preserve this position. In addition, new niche markets are being specifically developed on the basis of existing competencies to enable the business unit to better compensate for market fluc-tuations in the future.
OutlookThanks to the pleasing order intake in the fourth quarter of 2012 and the first few months of 2013, the foundation has been laid for a good start to the current year. The key factor for success going for-ward is whether and when customers place further orders in order to implement anticipated projects. The risk profile of these projects is appealing, as they involve a high proportion of business with re-peat character. Furthermore, it is expected that the programs initiated in 2012 to improve operating performance will make a positive contribution to business in 2013. As an additional factor, collabora-tion with Doerfer Companies will enable Komax Medtech to further strengthen its market position. Subject to these pre-requisites, and based on the assumption that customers will continue to ap-praise the market more positively, we are confident that we can once again generate positive EBIT in 2013.
Strategic cooperationCooperation with Doerfer Companies is strengthening the market position of Komax Medtech.
30

Medical devices are products used to help diagnose or treat disease. Many of these devices contain active substances or medicines that are administered to patients with certain conditions or disease symptoms. Before a new medicine that is combined with a medical device can be launched, it has to undergo preclinical and clinical studies and gain approval from the competent regulatory authority. Komax Medtech plays an important role in this process: the business unit plans and builds assembly systems that put together the individual components of such medical products (raw materials, plastic parts for the devices, pre-
filled medicines) in several steps on a semi-automated or fully automated basis. Komax Medtech then tests and packages the fully assembled final product (device plus medicine) and prepares it for shipping. When Komax Medtech delivers equipment to customers, a full qualifica-tion/testing package is performed, documenting with evidence that expected results will be achieved at the end of the thorough acceptance procedures, to run safely the validation of the device, which is owned by the customer.
Groundbreaking competencies in the value chain
Komax Medtech systems
Pre-assembly Final assembly Test Packaging Final product
Raw material for device assembly
Drug
Device development Drug development
31 Annual Report 6 Business Model 14 Wire 20 Solar 26 Medtech 35 Corporate Governance 44 Investors 47 Financial Report 106 Corporate Structure

The basic tenets underlying Komax’s business prac-tices are set out in its guiding principles. The Komax Group exercises responsibility towards people and the environment and is keen to continuously de-velop its competencies in matters relating to sus-tainability and social responsibility.
Group-wide code of conductThe way Komax is perceived by customers and sup-pliers, other business partners, shareholders, and the general public, and the respect for and confi-dence in the company that these groups feel is de-pendent to a significant degree on the conduct of Komax’s employees. In 2009, Komax therefore in-
troduced a code of conduct which applies to all Group employees. The code of conduct defines general ethical rules of behaviour and guidelines on how to act towards the Group’s business partners and competitors. All employees are given training on the code of conduct when they join the company. Furthermore, in another code of conduct drawn up specially for suppliers, Komax obliges its suppliers to comply with legislation and to act in an environ-mentally aware and ethical way. Compliance with these defined guidelines is reviewed on a regular
basis through supplier audits. If violations are un-covered, a supplier partnership may be immediately terminated as a result.
Product sustainabilityThe systems developed by Komax are character-ized by their exceptionally high quality. The Group’s global service network ensures that the systems are professionally maintained. This has a positive im-pact on their performance, value retention, and life span, as well as on saving resources. Thanks to their modular construction, the systems can usually be adapted to new technological developments or changing needs.
The Wire business unit supplies solutions for wire processing applications, in particular for the automotive supply industry. These solutions are also used to process wiring for new vehicle con-cepts such as electric and hybrid vehicles, among other applications. Moreover, the innovative tech-nologies used by Komax mean that ever smaller wire cross sections can be machine-processed, thereby contributing to a reduction in vehicle weight and, as a result, fuel consumption. By providing solutions for solar module manufacturing, the Solar business unit’s activities in the renewable energies field are actively helping to provide an environmentally friendly and reliable energy supply for the future. The Medtech business unit, which develops systems for medical device manufacturing, is indirectly helping to reduce health care costs, improve access to medicines and thereby increase people’s quality of life.
Sustainability and social responsibilityThe Komax Group is committed to upholding its responsibilities towards its different stakeholder groups. This commitment is expressed through the products and services it provides on the one hand and through the objectives and approach the company adopts on the other. Komax regards sustain - ability and social responsibility as an integral part of its corporate strategy.
People and the environmentKomax is keen to continuously build on its commit-ment to sustainability and social responsibility.
32

Sustainability in productionSince the Komax Group’s business focuses mainly on the production of machines and systems, it gen-erates few emissions in comparison to other indus-tries. These are further reduced by our use of state-of-the-art production facilities. Around 50% of the production equipment at our sites in Central Swit-zerland has been newly acquired over the last five years. Wherever possible, Komax uses renewable energies such as solar or hydroelectric power. In re-cent years, one of the Group’s sources of electricity has been RegioMix green power from small utilities in Central Switzerland. Komax’s commitment to the environment is also underscored by its own photo-voltaic power plant on the roof of its production building in Rotkreuz. Furthermore, Komax actively encourages its employees to use public transport. Waste materials from production activities, such as swarf and operating materials waste, are separated and disposed of or recycled appropriately. Waste volumes are continuously reduced as part of opti-mization programs. Komax’s products do not con-tain any ecologically harmful components. The com-pany favours suppliers which demonstrate an environmentally aware approach and whose prod-ucts conform to sustainability criteria.
In 2011, a working group was formed to sys-tematically develop the company’s commitment to sustainability. Among other things, it is charged with preparing the Dierikon and Rotkreuz sites for ISO 14001 and OHSAS 18001 certification. These two sites are the Group’s largest production facilities, together employing more than 400 staff. Work is now so far advanced that we are expecting to com-plete the certification processes in the second half of 2013. The ISO 14001 standard sets out recog-nized requirements for the environmental manage-ment systems of companies worldwide. OHSAS (Occupational Health and Safety Assessment Ser-ies) 18001 is one of the most significant and best-known standards for occupational health and safety management systems. Once Dierikon und Rotkreuz have been fully certified, further Group sites will undergo this process. In 2012, the Rotkreuz site obtained ISO 13485 certification. This standard defines the requirements to be satisfied by compre-hensive management systems for the design and manufacture of medical products.
key figures1)
2012 2011
Electric power consumption in MWh 6 704 6 701
Electric power consumption per head in MWh 7.9 7.4
Water consumption (potable and industrial water) in m3 8 450 8 086
Water consumption (potable and industrial water) per head in m3 10.0 8.9
1) Covering the Komax production sites in Dierikon (CH), Rot-kreuz (CH), La Chaux-de-Fonds (CH), Rousset (F), York (USA), Rockford (USA), Penang (MY) and Shanghai (RC).
employees by business unit
2012 2011
Komax Wire 921 541
Komax Solar 140 285
Komax Medtech 256 302
Corporate 13 12
Total 1 330 1 140
employees by area of activity
2012 2011
Production 517 482
Research and development 140 134
Engineering 199 149
Marketing and sales 339 273
Administration 135 102
Total 1 330 1 140
employees by region
2012 2011
Switzerland 563 569
Europe 240 65
Africa 47 12
North/South America 228 266
Asia 252 228
Total 1 330 1 140
33 Annual Report 6 Business Model 14 Wire 20 Solar 26 Medtech 35 Corporate Governance 44 Investors 47 Financial Report 106 Corporate Structure

In 2011, the La Chaux-de-Fonds site received an award from Energo for having cut its energy con-sumption by 10% compared to the previous year. Energo is a Swiss non-profit organization financed by cantons, cities, municipalities, and private sector entities. It works in partnership with EnergieSchweiz to promote the federal government program for a 20% reduction in CO2 by 2020.
In addition, a number of different projects fo-cusing on protecting the environment were either launched or advanced. For example, in 2012, this resulted in a reduction in energy consumption of around 10% at the Group’s sites in Central Switzer-land. Associated initiatives are also in place to fur-ther sensitize employees to environmental issues.
Contribution to regional developmentKomax has been firmly rooted in the Canton of Lu-cerne since 1975, and is one of the canton’s biggest employers. Its other operating facilities worldwide have been based at the same sites since their estab-lishment, and this has generated a strong sense of identification with the local area. This sense of iden-tification is expressed in various ways, notably con-sidering local suppliers wherever economically pos-sible and reasonable.
Attractive employerAs at the end of 2012, Komax employed 1330 staff worldwide, 17% more than in the previous year. This increase is primarily attributable to the takeover of TSK Group and MCM Cosmic KK, Tokyo. However, the persistent crisis in the solar industry has meant that both structures and headcount in the Solar business have had to be adjusted to the changing demand situation. The associated redundancies were implemented in the most socially acceptable way. Personnel expenses amounted to CHF 102.9 million in the reporting year (2011: CHF 103.6 mil-lion).
The companies of the Komax Group ensure that their employees enjoy equal opportunities, equal treatment, and fair employment conditions, receive pay that is in line with the market, and benefits that are in line with national and industry standards. Participation in the pay comparison survey con-ducted by industry association Swissmem last year revealed that pay at both of the Wire business unit’s Swiss production sites is in line with market aver-
ages and that men and women receive equal pay. The proportion of women in the Group’s global workforce stood at 13% in 2012 (2011: 12%). Komax is not alone within the industry in having a relatively low proportion of women in its workforce. This is due to the large number of technical pos-itions within the company, for which the recruitment potential among women is limited.
The Group’s staff turnover rate in 2012 was gratifyingly low. As in 2011, it amounted to less than 9%. Komax has a very good reputation as an at-tractive employer. Among other things, this is high-lighted by the fact that we were able to fill vacancies quickly in 2012, even in the tight market for man-agement and skilled staff. As part of an active staff development policy, Komax organizes regular train-ing for its employees and provides financial support for individual training activities. Komax also encour-ages international exchanges to allow its staff to gain new experiences and career perspectives. At the same time, Komax invests in tomorrow’s work-force. In 2012, 45 apprentices were undergoing training in seven professions at the Group’s Swiss sites.
Employee satisfaction is systematically mea s-ured and evaluated in the course of annual perform-ance review meetings. Komax uses the results of regular employee surveys as a valuable basis for developing and implementing improvement mea s-ures. It goes without saying that Komax satisfies all legal requirements governing working conditions in the countries it operates in. Reported absences due to accidents in 2012 were mainly the result of acci-dents suffered by employees while engaging in leis-ure activities. Komax actively encourages employ-ees at site level to pursue a healthy lifestyle through initiatives such as sport and exercise offerings.
34

Corporate Governance
35

1 Corporate structure and shareholdersCorporate structureThe corporate structure is set out on pages 106 and 107 of the Annual Report.
Komax Holding AG, the holding company of the Komax Group, has its headquarters in Dierikon (CH). Details on the place of listing, market capital-ization, securities number, and ISIN number are set out on page 44 (“Information for investors”).
All shareholdings that have been reported to Komax Holding AG and the Disclosure Office of SIX Swiss Exchange as per Art. 20 of the Federal Act on Stock Exchanges and Securities Trading (SESTA) and the provisions of the Stock Exchange Ordinance of the Swiss Financial Market Supervisory Authority (SESTO-FINMA) and published on SIX Swiss Ex-change AG’s electronic publication platform can beviewed at www.six-exchange-regulation.com/ obligations/ disclosure/major_shareholders_en.html.
Cross-shareholdingsThere are no cross-shareholdings.
Significant shareholders Shareholders whose share of the company's share capital exceeds or falls below the thresholds of 3, 5, 10, 15, 20, 25, 331∕3, 50, and 662∕3 percent have a reporting obligation under the Federal Act on Stock Exchanges and Securities Trading (SESTA) and the Stock Exchange Ordinance of the Swiss Financial Market Supervisory Authority (SESTO-FINMA).
According to these disclosure requirements, at 31 December 2012, the company had the following significant shareholders with voting rights of more than 3%:
Shareholder/shareholder group Number of shares 31 Dec. 2012
% as at 31 Dec. 2012
Max Koch, Meggen, Switzerland 231 4011) 6.72
Sarasin Investmentfonds AG, Basel, Switzerland 144 919 4.21
Leo Steiner, Steinhausen, Switzerland 118 6502) 3.45
1) Plus stock options from the employee share incentive scheme (0.12%): 0.03% 1000 call options, CHF 42.78, duration 1.1.2009 – 31.12.2013 0.03% 1000 call options, CHF 75.68, duration 1.1.2010 – 31.12.2014 0.03% 1000 call options, CHF 94.25, duration 1.1.2011 – 31.12.2015 0.03% 1000 call options, CHF 66.21, duration 1.1.2012 – 31.12.2016 All stock options are subject to a three-year lock-in period and a two-year exercise period, exchange ratio 1:1, effective fulfilment.
2) Plus stock options from the employee share incentive scheme (0.20%): 0.06% 2000 call options, CHF 75.68, duration 1.1.2010 – 31.12.2014 0.07% 2500 call options, CHF 94.25, duration 1.1.2011 – 31.12.2015 0.07% 2500 call options, CHF 66.21, duration 1.1.2012 – 31.12.2016 All stock options are subject to a three-year lock-in period and a two-year exercise period, exchange ratio 1:1, effective fulfilment.
2 Capital structure
Capital
in CHF
Ordinary capital 344 378.90
Conditional capital 40 621.10
Authorized capital 0.00
Further details are provided in the sections below.
Authorized and conditional capital in particularFor information on conditional capital, please refer to the individual financial statements of Komax Holding AG, page 101, and Art. 3.2 of the Articles of Association.
The Annual General Meeting of 13 May 2009 approved the creation of conditional capital up to a maximum of CHF 46 248.00 to cover the exercising of option or subscription rights issued as part of the Executive and Employee Participation Program of Komax Holding AG. The subscription and advance subscription rights of the remaining shareholders in the company are excluded. In 2010, 13 360 options were converted into shares with a par value of CHF 0.10. In 2011, no options were exercised, and in 2012, 42 909 options were exercised. Conditional capital therefore amounted to CHF 40 621.10 as at 31 December 2012.
The newly created capital was entered in the Com-mercial Register within the deadline stipulated under Art. 635h of the Swiss Code of Obligations (CO).
The Komax Group had no authorized capital as at 31 December 2012.
Capital changesDetails of capital changes in 2012 and 2011 can be found on page 56 of the Financial Report. The corre-sponding information for 2010 can be found on page 56 of the financial section of the 2011 Annual Report.
Shares, participation certificates, and profit-sharing certificatesAs at 31 December 2012, Komax Holding AG had fully paid-at capital of CHF 344 378.90, distributed over 3 443 789 registered shares with a par value of CHF 0.10 each. Each registered share entitles the holder to vote at the Annual General Meeting as long as the shareholder is listed in the share register as a “voting shareholder” (see also “Restrictions on transferability of shares and nominee registrations”). Registered shares are fully entitled to receive divi-dends.
Komax Holding AG has not issued any partici-pation certificates or bonus certificates.
36
Restrictions on transferability of shares and nominee registrationsThe Komax Holding AG share register is divided into the categories of “non-voting shareholders” and “voting shareholders”. “Non-voting shareholders” may exercise all property rights, but not the right to vote or rights associated with that of voting. “Voting shareholders” may exercise all rights associated with the share.
Registration of an acquirer of shares as a “voting shareholder” may be refused under Komax Holding AG’s Articles of Association if, as a result of such rec-ognition, the acquirer would directly or indirectly hold more than 5% of the total number of shares recorded in the Commercial Register. Legal entities and groups with joint legal status which are connected through capital, voting rights, management, or in some other manner, along with all natural persons, legal entities, and groups with joint legal status which act in concert by virtue of agreement, syndicate, or in some other manner, are regarded as a single ac-quirer for the purposes of this provision. This limita-tion also applies in the case of the acquisition of reg-istered shares through the exercising of subscription rights, option rights, or conversion rights. This re-striction does not apply to the acquisition of shares through inheritance, division of an estate, or joint marital property. The Board of Directors may grant exceptions to the 5% limitation for good cause.
Komax Holding AG’s Articles of Association also empower the Board of Directors to refuse entry in the share register if the acquirer does not expressly declare, at the request of the Board, that the shares were acquired in their own name and for their own account. Nominees are listed in the share register as “non-voting shareholders”.
After hearing the affected party, Komax Holding AG may delete entries in the share register if such entries occurred in consequence of false statements by the acquirer. The acquirer must be informed of the deletion immediately.
Convertible bonds and options Komax Holding AG has no outstanding convertible bonds. See pages 42, 90 and 91 for information on employee share options.
Management transactionsThe Listing Rules of SIX Swiss Exchange stipulate a disclosure obligation for management transactions. The Board of Directors has issued a set of regula-tions to comply with these provisions. Members of the Board of Directors and Executive Committee have a disclosure obligation towards the company in this respect. A total of 13 reports were submitted in the year under review. Published reports can be found on the website of SIX Swiss Exchange.
3 Board of DirectorsThe Board of Directors has six members. No mem-ber of the Board of Directors was a member of the Executive Committee in the three years prior to the reporting period, nor do any members of the Board of Directors have any material business relationship with any Group companies.
There are no cross-involvements among the Board of Directors. Biographies of the individual Board Members are provided on pages 10 and 11.
Election and term of office The Board of Directors of Komax Holding AG con-sists mainly of independent, non-executive members and is elected by the Annual General Meeting. Under the Articles of Association it consists of three to seven members. Each member is elected individu-ally. The maximum term of office is three years; each member’s term of office is determined at the time of election. Individual terms are staggered so that roughly one-third of all Board members, but no more than three, are elected each year. Members may be re-elected. The term of office is not restricted.
The term of office of Melk M. Lehner expires in 2013. Melk M. Lehner is not standing for re-election. In his place, the Board of Directors is proposing that the Annual General Meeting of 3 May 2013 elect Prof. Dr Roland Siegwart.
members of the Board of Directors
Appointed Term expires
Committees
Leo Steiner, Chairman 1997 2015 AC, RC (Chairman)
Melk M. Lehner 1997 2013 AC
Max Koch 1997 2014 RC
Hans Caspar von der Crone 1997 2015 AC (Chairman)
Daniel Hirschi 2005 2014 RC
Kurt Haerri 2012 2015
AC: Audit Committee RC: Remuneration/Nomination Committee
37 Annual Report 6 Business Model 14 Wire 20 Solar 26 Medtech 35 Corporate Governance 44 Investors 47 Financial Report 106 Corporate Structure

Internal organizationThe Board of Directors consists of the Chairman and the other members of the Board. The Board of Directors organizes itself and elects its Chairman from among its ranks. If the Chairman is prevented from exercising his duties through illness or pro-longed absence, the Board of Directors will appoint a Deputy. The Chairman – or if he is unable to attend, the Deputy Chairman – is responsible for chairing the meetings. The Board of Directors add-itionally appoints a Secretary, who does not need to be a member of the Board of Directors.
The Board of Directors meets as often as busi-ness requires, but no less than four times per year. Meetings are called by the Chairman of the Board. Each member of the Board of Directors may de-mand that a meeting be called by the Chairman to discuss a particular topic.
The Board of Directors is deemed to have a quorum if an absolute majority of its members are present. The resolutions of the Board of Directors are adopted by an absolute majority of votes pres-ent, subject to a minimum of three. In the event of a tie, the Chairman casts the deciding vote. All reso-lutions are minuted. In cases of urgency, a meeting of the Board of Directors may be held by telephone or other appropriate medium. Resolutions by circu-lar letter are permissible provided no Board member calls for verbal discussion. All members were pres-ent at the six meetings of the Board of Directors that took place in 2012. On average, these meet-ings lasted around six hours. However, these aver-age times pertain to the actual duration of the meet-ings themselves, and do not take into account the extensive preparatory and follow-up work done by the individual members.
The Board of Directors has formed two Committees from among its ranks.− Audit CommitteeThe Audit Committee presently consists of Hans Caspar von der Crone (Chairman), Melk M. Lehner and Leo Steiner. The Committee meets at least twice a year. In 2012, the Committee met twice, with all members being present on both occasions. On average, these meetings lasted three hours. These average times do not include the extensive preparatory and follow-up work done by the individ-
ual members. The tasks of the Audit Committee in-clude the overall supervision of the external and in-ternal auditors, as well as financial reporting. The Audit Committee sets out the scope and schedule of the audit to be carried out by the two auditing bodies and also coordinates their work. Both the external and internal auditors draw up a report on their audit work, and the Audit Committee monitors implementation of the audit findings. Furthermore, the Audit Committee evaluates the reliability of the internal control system together with Risk Manage-ment, and acquires a picture of the extent to which statutory and internal regulations are being adhered to (compliance). The CEO and the CFO both attend meetings of the Audit Committee. On occasions, the external auditor is invited to attend. The CFO represents the internal audit unit. Both bodies have access to the minutes of the meetings of the Boards of Directors and Executive Committee. The detailed tasks of the Audit Committee are set out in the Or-ganizational Regulations for the Audit Committee.
− Remuneration/Nomination CommitteeThe Remuneration/Nomination Committee pres-ently consists of Leo Steiner (Chairman), Max Koch, and Daniel Hirschi. Meetings of the Remuneration/Nomination Committee take place as required and may be called by any member. In 2012, the Com-mittee met twice, with all members being present on both occasions. On average, these meetings lasted three hours. These average times do not in-clude the extensive preparatory and follow-up work done by the individual members. The tasks of the Remuneration/Nomination Committee include pro-viding advice on basic HR questions, determining the compensation regulations and models for the Executive Committee, and drawing up proposals for the amount of the compensation paid to the CEO and members of the Board of Directors. The tasks of the Remuneration/Nomination Committee are set out in detail in the Organizational Regulations of Komax Holding AG.
38

Definition of areas of responsibilityUnder Art. 716a Para. 1 CO, the Board of Directors must fulfill, the following non-transferable and in-alienable duties:− Overall management of the company and issu-
ance of the necessary directives− Defining the company’s organizational structure− Determining the principles of accounting, finan-
cial controlling, and financial planning, insofar as this is necessary for the management of the com-pany
− Appointing and removing the persons entrusted with managing and/or representing the company
− Ultimate supervision of the persons entrusted with managing the company, specifically with respect to prevailing legislation, the Articles of Association, regulations, and directives
− Producing the Annual Report, making prepara-tions for the Annual General Meeting, and exe-cuting the resolutions passed by the Annual Gen-eral Meeting
− Informing the courts in the event of excessive in-debtedness
The tasks, obligations, and powers of the Board of Directors, its Chairman, and the above-mentioned Committees are set out in detail in the Organizational Regulations of Komax Holding AG. These regula-tions also define the rights, obligations, and compe-tencies of the CEO and Executive Committee. The Organizational Regulations are reviewed on a regular basis and amended where necessary. The most re-cent amendment was undertaken in August 2011.
To the extent permitted by law and by the Art-icles of Association, the Board of Directors has del-egated operational management of the company to the CEO of the Komax Group. The Executive Com-mittee is made up of the CEO and four further mem-bers. The members of the Executive Committee are appointed by the Board of Directors at the proposal of the Remuneration/Nomination Committee.
Information and control instruments vis-à-vis the Executive CommitteeThe CEO informs the Board of Directors at each meeting about the course of business, the Group’s most important transactions, and the status of the tasks delegated to the Executive Committee. The key data generated by the management information system (MIS) is discussed at length at meetings of the Board of Directors with the CEO and CFO. More-over, the Board of Directors is also provided with full details of the current course of business and the financial situation of the Group between each meet-ing. In addition, the Chairman of the Board of Direc-tors and the CEO are in regular contact to discuss important questions of company policy.
The risks associated with the Group’s commer-cial activities are systematically identified, analysed, monitored, and managed through an institutional-ized risk management function. These risks are amalgamated into groups according to their nature, namely general external risks, business risks, finan-cial risks, risks arising in connection with corporate governance, and IT risks. The Executive Committee is responsible for the operational side of risk man-agement, whereby specially appointed process owners are assigned responsibility for the manage-ment of key individual risks. These individuals take specific measures and monitor their implementa-tion. Every year, the Executive Committee informs the Audit Committee of the risks that have been identified and the measures taken as part of risk management activities.
The MIS of the Komax Group is organized as follows: Each subsidiary’s key balance sheet and profit and loss figures are compiled and consoli-dated once a month. The subsidiaries’ balance sheets, income statements, cash flow statements, and various indicators are compiled and consoli-dated on a quarterly, half-yearly, and yearly basis. A comparison is then made with the previous year and the budget. The budget forecast is checked for attain ability against the quarterly statements for each individual company and on a consolidated basis.
Using key controls, the internal control system (ICS) ensures proper and efficient management, safeguards assets, prevents and identifies offences and errors, and ensures accurate and complete ac-
39 Annual Report 6 Business Model 14 Wire 20 Solar 26 Medtech 35 Corporate Governance 44 Investors 47 Financial Report 106 Corporate Structure

counting records as well as timely preparation of reliable financial information. A report setting out the results of these investigations and the corres-ponding measures taken is submitted to the Audit Committee.
The internal audit function evaluates the effect-iveness of the ICS as well as management and monitoring processes. It also supports the Execu-tive Committee in the risk management process. In-ternal audit duties are performed by the Finance and Accounting unit of Komax Management AG, Dierikon. This unit scrutinizes the individual operat-ing units of the Group and the various business areas of the parent entity at regular intervals and on the basis of an annually updated audit plan. The in-ternal auditors report the results of their investiga-tions to the Audit Committee. The Audit Committee reviews and approves the scope of the audit, the audit plan, and the corresponding responsibilities. It also decides on any measures to be implemented as a result of internal audit findings.
4 Executive Committee The Executive Committee of the Group comprises the CEO, the business unit heads who report di-rectly to him, and the Chief Financial Officer (CFO).
Function exercised since
Dr Beat Kälin, CEO 2007
Andreas Wolfisberg, CFO 1996
Matijas Meyer, Head Business Unit Wire 2010
Walter Nehls, Head Business Unit Solar 2008
René Ronchetti, Head Business Unit Medtech 1 September 2012
Serge Peguiron, Head Business Unit Medtech 2005 to 31 August 2012
Biographies of the individual members of the Exec-utive Committee are provided on pages 12 and 13.
Other activities and interestsAside from the mandates listed on pages 12 to 13, the members of the Executive Committee do not exercise any activities on management or supervis-ory bodies of significant Swiss and foreign corpor-ate entities, institutions, or foundations under pri-vate or public law outside the Komax Group (as at 31 December 2012). Some members of the Execu-tive Committee exercise Board functions at subsidi-ary companies of Komax Holding AG.
Business relationships with related companies and personsThe members of the Executive Committee have not entered into any commercial transactions with re-lated companies and persons.
Management contractsThe Komax Group has not entered into any man-agement contracts with third parties.
5 Compensations, shareholdings, and loans
Content and method of determining the compen-sation and the participation programs The compensation of the Board of Directors is fixed. The Board of Directors determines the amount of the fixed compensation to which individual mem-bers are entitled on an annual basis, at its own dis-cretion, and commensurate with their involvement and degree of responsibility. The compensation consists of a fixed component paid in cash and a proportion provided in the form of options. Add-itional compensation may be granted for efforts above and beyond normal Board activities. In the year under review, no invoices were submitted to the Komax Group by members of the Board of Dir-ectors for additional services.
The salary and bonus of the CEO are deter-mined annually by the Board of Directors on the basis of the proposal submitted by the Remunera-tion Committee. The overall compensation of the mem bers of the Executive Committee is decided by the Remuneration Committee (see also the general marks on the Remuneration Committee on page 38).
The members of the Executive Committee of the Komax Group receive performance-based compen-sation. The target salary (100%) consists of a fixed component (65 to 70%), a remuneration compon-ent which depends on the company’s result in com-parison to the annual plan, and an individual perfor-mance component. The remuneration component that depends on the company’s result is calculated on the basis of key corporate figures (sales, EBIT, EAT, RONCE). The individual performance compo-nent is based on the attainment of previously agreed objectives. There is a 70/30 split between operating objectives and individual objectives. The variable salary component achievable by a member of the Executive Committee may not exceed the set target by more than 70%. In the 2012 financial year,
40

the variable compensation component for members of the Executive Committee amounted to between 10 and 55% of the fixed salary component.
The compensation models for other members of management within the Komax Group also contain a performance-related component.
In addition to their salary, members of the Execu tive Committee, middle management and other staff of the Komax Group (a total of some 160 employees) may – in accordance with the compa-ny’s share option guidelines – receive share options as determined by the Remuneration Committee. These options have a duration of five years and are subject to a three-year lock-in period. The exercise price of the options corresponds to the lower of the following two values: the average price of the fourth quarter of the preceding year or the average price in March of the year the option was issued. The indi-vidual allocation of options is at the discretion of the Board of Directors and senior management.
The basis for determining compensation for the Board of Directors and Executive Committee was unchanged from the previous year. The decrease in compensation is primarily due to the reduction in the variable salary component resulting from the lower Group results and the lower taxable value of the options allocated in the 2012 financial year.
Details on the compensation, option allocations, as well as share and option holdings of the Board of Directors and Executive Committee can be found on pages 95, 103, and 104 of the Financial Report. No shares were allotted in the year under review.
No benefits or special advantages were granted upon the departure of members of the Board of Directors or Executive Committee. No agreements regarding severance payments exist with members of the Board of Directors or with members of the Executive Committee.
Compensation for former members of governing bodiesNo compensation was paid to former members of governing bodies in the 2012 financial year.
Loans granted by governing bodiesKomax Group companies have not granted any guarantees, loans, advances, or credits to mem-bers of the Board of Directors or Executive Commit-tee or parties closely linked to such persons as at 31 December 2012.
No members of the Board of Directors or Execu-tive Committee or persons closely linked to them take or have taken part in Komax Group trans-actions outside their normal duties.
6 Shareholder participation rights The fundamental participation rights of shareholders are set out in the Swiss Code of Obligations (CO) and supplemented by the provisions of the compa-ny’s Articles of Association. The Articles of Associa-tion of Komax Holding AG are available in electronic form on the website www.komaxgroup.com.
Voting rights and representation restrictionsShareholders registered in the Komax Holding AG share register are entitled to vote; each share is en-titled to one vote. No single shareholder may dir-ectly or indirectly exercise the votes of more than 5% of the total number of shares recorded in the Commercial Register for his own registered shares and shares voted by proxy. Legal entities and groups with joint legal status which are connected through capital, voting rights, management, or in some other manner, along with all natural persons, legal entities, and groups with joint legal status which act in concert by virtue of agreement, syndi-cate, or in some other manner, are regarded as one person for the purposes of this provision. The Board of Directors may grant exceptions to this rule for good cause. This voting rights limitation does not apply to proxy holders of deposited shares, repre-sentatives of governing bodies or independent rep-resentatives pursuant to CO Art. 689c and 689d.
This voting rights limitation does not apply to shareholders who were registered as holding regis-tered shares amounting to more than 5% of votes for all shares at the time that the provision of the Articles of Association regarding limitation of voting rights was passed.
Shareholders may be represented at the Annual General Meeting on the basis of a written power of attorney by other shareholders, a proxy holder of deposited shares, a representative of a governing body, or an independent proxy pursuant to CO Art. 689c and 689d.
The voting rights limitation may only be re-scinded by a resolution of the Annual General Meet-ing, which requires a majority of votes cast.
41 Annual Report 6 Business Model 14 Wire 20 Solar 26 Medtech 35 Corporate Governance 44 Investors 47 Financial Report 106 Corporate Structure

Statutory quorumsThe Annual General Meeting votes and passes its resolutions with the absolute majority of votes repre-sented, unless prevailing legislation or the Articles of Association contain mandatory provisions under which resolutions have to be passed in a different way.
In addition to the resolutions specified in CO Art. 704, under the Articles of Association of Komax Holding AG, a two-thirds majority of votes cast and an absolute majority by value of shares voted is re-quired to dismiss members of the Board of Directors.
Convocation of the Annual General Meeting of ShareholdersThe convocation of the Annual General Meeting is governed by applicable law. Shareholders repre-senting at least 1% of the share capital can request that items be placed on the agenda for discussion by submitting the proposed motions in writing within the deadline published by the company.
Entries in the share registerIn principle, any shareholder can be entered in the Komax Holding AG share register. Any person ac-quiring shares is listed as a “shareholder with voting rights” up to a maximum of 5% of the total number of shares published in the Commercial Register. Any person owning more than 5% of the published shares will be entered as a “non-voting shareholder” for the portion in excess of 5% (Komax Holding AG Articles of Association, Art. 6 Para. 4). This restric-tion does not apply to the acquisition of shares through inheritance, division of an estate, or joint marital property. The Board of Directors may grant exceptions for good cause.
The Board of Directors can refuse entry in the share register if the acquirer does not expressly de-clare, at the request of the Board, that the shares were acquired in their own name and for their own account. After hearing the affected party, the com-pany may delete entries in the share register if such entries occurred in consequence of false state-ments by the acquirer. The acquirer must be in-formed of the deletion immediately. Nominees are listed in the share register as “non-voting share-holders”.
Invitation to the Annual General Meeting of 3 May 2013All shareholders registered in the Komax Holding AG share register as per 2 May 2013 are entitled to vote in respect of the number of shares registered in their name at the Annual General Meeting of 3 May 2013. Shareholders registered on 14 March 2013 will receive an invitation indicating the proposals of the Board of Directors and a reservation and entry ticket coupon. Shareholders who acquire shares later and whose registration application is received by the Komax Holding AG share register no later than 2 May 2013 will receive the invitation at that time, or ballot materials will be waiting for them at the front desk of the Annual General Meeting. Shareholders who dispose of their shares before the Annual General Meeting are not entitled to vote. In the event of a partial sale or purchase of add-itional shares, the entry ticket received should be exchanged at the front desk on the date of the Annual General Meeting.
7 Changes of control and defence measures
Duty to make an offerUpon reaching or exceeding a threshold of 33 ¹/³ percent, a shareholder must submit an offer to all shareholders for the purchase of their shares (Art. 32, Federal Act on Stock Exchanges and Securities Trading). The Articles of Association do not include “opting out” or “opting up” rules.
Clauses on change of controlAt the Komax Group, change-of-control clauses are not included in employment contracts. OptionsThe members of the Board of Directors, Executive Committee, and middle management are entitled to exercise their options in part or in full, without regard to the time limits, in the following cases:− if Komax Holding AG or its subsidiaries sell(s) all
assets relevant to the business− if one or more persons or companies merge(s)
and conclude(s) a legally binding agreement for the purpose of acquiring shares in Komax Hold-ing AG, as a result of which they hold more than 50% of the voting rights (including any previous shareholdings)
− if another case of legal or economic disposal or liquidation of Komax Holding AG occurs
− if Komax Holding AG is no longer traded on the stock exchange and no publicly traded shares of the company are available
42
8 AuditorsDuration of the mandate and term of office of the lead auditorPricewaterhouseCoopers AG, Basel, has been the statutory auditor of Komax Holding AG and the Komax Group’s consolidated financial statements since 1994. Pursuant to the provisions of the Swiss Code of Obligations, the lead auditor is replaced after a maximum term of seven years. The lead au-ditor has been responsible for the audit mandate since 2010.
Auditing and additional feesPricewaterhouseCoopers invoiced the Komax Group CHF 627 886 in the 2012 financial year for services in connection with auditing the annual statements of Komax Holding AG and the Group companies, as well as the consolidated statements of the Komax Group. In addition, the auditing company invoiced a fee amounting to a total of CHF 171 278 during the 2012 financial year. This breaks down into a fee of CHF 25 367 for tax advisory services, CHF 78 540 for legal advice, and CHF 67 371 for transaction services.
Supervisory and control instruments pertaining to the auditThe Audit Committee is responsible for evaluating the external auditors, who submit an audit report to the Board of Directors. At least one consultation is held each year between the external auditors and the Audit Committee, at which the material findings for each company (management letters) and the consolidated financial statements covered by the audit report are discussed in detail. The auditors also explain the audits conducted (audit and review) for each company along with recent changes in IFRS (International Financial Reporting Standards) and their impact on the Komax Group’s consoli-dated annual statements. The services provided by the statutory auditors are evaluated by the Audit Committee on the basis of the quality of reporting and the audit reports, the implementation of the audit plan, and the level of cooperation with the in-ternal audit team. The independence of the auditors is verified by comparing the fee for additional ser-vices charged by the external auditors with the audit fee, taking into account the scope of these addi-tional services. The external auditors are selected by tender, and the selection process is repeated or se-lection is confirmed annually. In addition to the min-imum statutory requirements, the selection criteria applied are professional qualifications, industry ex-perience and value for money. Further details on the Audit Committee can be found under section 3.
9 Information policyKomax Holding AG is committed to providing swift, transparent, and simultaneous information for all stakeholders. The CEO, CFO, and the Head Invest or Relations and Corporate Communications are available as contact partners for information purposes.
The consolidated financial statements are com-piled in conformity with IFRS standards. Komax Holding AG publishes comprehensive financial re-sults twice a year, for the first half and for the full year. In addition to the financial results, sharehold-ers and financial markets are regularly kept in-formed of significant changes and developments. Komax Holding AG publishes facts relevant to its share price in conformity with the disclosure poli-cies of SIX Swiss Exchange. The Listing Rules can be found at www.six-exchange-regulation.com (Admission).
The official publication for company notices is the “Swiss Official Gazette of Commerce” (“Schweize-risches Handelsamtsblatt”). Information on share price trends, annual and half-year reports, the finan-cial calendar, the minutes of the most recent General Meeting, press releases, and Komax Holding AG’s Articles of Association are available at www.komax-group.com. Press conferences and presentations for analysts are held at least once a year.
ContactKomax Holding AG Marco KnuchelIndustriestrasse 6 CH-6036 Dierikon Phone +41 41 455 06 16 [email protected]
43 Annual Report 6 Business Model 14 Wire 20 Solar 26 Medtech 35 Corporate Governance 44 Investors 47 Financial Report 106 Corporate Structure

Equity market sentiment in 2012 was on the one hand affected negatively by the European debt cri-sis and global economic risks. On the other hand, stock markets received a boost from the extremely expansive monetary policy of central banks, with the result that they ultimately performed much bet-ter than had been expected at the beginning of the year.
Komax shares enjoyed a very good start to the year. However, growing doubts over the strength of the automotive industry and the weaker-than-expected performance of Komax Solar and Komax Medtech triggered a reversal in the share price in the second quarter. The shares recovered with pleasing trading volumes towards the end of 2012, finally closing 3% up on the year. The closing share price on 28 December 2012 stood at CHF 71.00 (2011: CHF 68.75).
Listing Komax is listed on SIX Swiss Exchange. Market cap-italization at the end of 2012 was CHF 244.5 million.
ISIN CH0010702154
Security number 001070215
Bloomberg code KOMN SW
Thomson Reuters code KOMN.S
Geographical distribution of shareholdings
Switzerland 70%
Other countries 6%
Shares pending registration of transfer 24%
The majority of shares not held in Switzerland is held in the United Kingdom, Germany, and the United States.
Significant shareholders Information on significant shareholders can be found on page 36 of this report.
information for investors
Share price development in CHF
100
110
60
50
70
90
80
January June December
Komax Vontobel Small Cap Index
44

Breakdown of shareholders by number of registered shares held
1–100 1 673
101–1 000 1 811
1 001–10 000 261
10 001–50 000 27
> 50 000 3
Free float The free float as defined by SIX Swiss Exchange stands at 93%.
Dividends The Board of Directors would like to adhere to its attractive dividend policy and is therefore proposing to the General Meeting a distribution of CHF 2.00 per share from capital contribution reserves. The payout ratio will therefore rise in a year-on-year comparison. The dividend yield on the date of the Board resolution stood at an attractive 2.5%.
Information on the Komax registered shareFurther information on the Komax registered share can be found on the internet at: www.komaxgroup.com
Disclosure of shareholdingsUnder Art. 20 of the Swiss Federal Act on Stock Ex-changes and Securities Trading (Stock Exchange Act) and the Stock Market Ordinance of the Swiss Financial Market Supervisory Authority (SESTO-FINMA), whosoever directly, indirectly or in concert
with third parties acquires or disposes of shares, for his own account, in a company incorporated in Switzerland whose equity securities are listed, in whole or in part, in Switzerland and thereby attains, falls below or exceeds the threshold of 3, 5, 10, 15, 20, 25, 331⁄3, 50, or 662⁄3 percent of the voting rights, whether or not such rights may be exercised, shall notify the company and the stock exchanges on which the equity securities in question are listed.
Financial calendar
Annual General Meeting 3 May 2013
Dividend payment 10 May 2013
Half-year results 2013 20 August 2013
First information on the year 2013 21 January 2014
Annual media conference/analysts’ presentation 26 March 2014
Annual General Meeting 7 May 2014
key data komax registered share 2012 2011 2010 2009 2008
Share capital as at 31 Dec. in TCHF 344 340 340 339 339
Number of shares as at 31 Dec. No. 3 443 789 3 400 880 3 400 880 3 387 520 3 387 520
Average number of outstanding shares No. 3 404 850 3 375 217 3 349 278 3 319 791 3 323 199
Par value per share CHF 0.10 0.10 0.10 0.10 0.10
Basic earnings per share CHF 2.99 11.68 5.31 −5.97 6.99
EBITD per share CHF 6.66 16.14 10.72 −4.28 11.54
EBIT per share CHF 4.17 13.98 8.56 −6.69 9.18
Shareholders’ equity per share CHF 70.97 72.63 62.49 59.01 65.56
Dividend per share CHF 2.001) 4.00 2.00 0.00 2.00
High CHF 97.10 120.00 103.00 80.00 175.00
Low CHF 61.25 59.00 73.10 36.05 48.95
Closing price as at 31 Dec. CHF 71.00 68.75 102.00 72.00 53.90
Average daily trade volume No. 6 608 8 383 6 173 6 341 8 932
P/E (price-earnings ratio) as at 31 Dec. 23.7 5.9 19.5 −12.1 7.7
Dividend yield as at 31 Dec. % 2.821) 5.82 1.96 0.00 3.71
1) Proposal of the Board of Directors of Komax Holding AG: distribution of CHF 2.00 per registered share from capital contribution reserves.
45 Annual Report 6 Business Model 14 Wire 20 Solar 26 Medtech 35 Corporate Governance 44 Investors 47 Financial Statements 106 Corporate Structure

This page has been intentionally left blank.

Financial Report Consolidated Financial Statements 48 Comments 52 Consolidated Balance Sheet 53 Consolidated Income Statement 54 Consolidated Statement
of Comprehensive Income 55 Consolidated Cash Flow Statement 56 Consolidated Statement of Shareholders’ Equity 57 Notes 96 Report of the Auditors
Financial Statements of Komax Holding AG 97 Comments 99 Balance Sheet 100 Income Statement 101 Notes 106 Corporate Structure 108 Proposal for the Appropriation of Profit 109 Report of the Auditors
47

Income statement
Acquisitions The Komax Group acquired MCM Cosmic KK in Japan as of 1 April 2012 and TSK Beteiligungs GmbH as of 1 August 2012, including six subsidiaries located in Germany, Brazil, China, Tunisia, Turkey, and the US. The newly acquired businesses generated an order intake of CHF 17.0 million (5.9% of the overall order intake) and revenues of CHF 16.7 million (5.8% of total revenues). Due to the relatively small proportion of overall vol-umes accounted for by the acquisitions in 2012, no breakdown of figures with/without acquisitions is provided in the following commentary. Both acquisitions have been integrated into the Wire business unit.
Order intakeOrders totalled CHF 287.9 million in 2012, compared with CHF 380.4 million in 2011. This represents a decrease of 24.3%. The sharp decline in the order intake is above all attributable to the virtual collapse of the Solar business unit and the sharp decline recorded in the Medtech business unit. By contrast, the order intake continued to hold up well in the Wire business unit. The order book amounted to CHF 70.5 million as at 31 December 2012 (2011: CHF 80.4 million).
Revenues (net sales and other operating income)Komax generated revenues of CHF 288.2 million in the 2012 financial year, representing a decline in revenues of 22.4% compared to the previous year. The following is a breakdown of net sales by currency in 2012 (percentages in brackets are for the previous year):
– CHF 33% (33%) – EUR 24% (20%)– USD 28% (36%) – Other foreign currencies 15% (11%)
The percentage proportion of revenues in CHF remained unchanged in the year under review. Although the EUR barely fluctuated against the CHF – in contrast to previous years – thanks to the support of the SNB, the currency impact remained a challenge in 2012. This is primarily due to the increasing significance of cur-rencies of certain emerging markets, such as Brazil, China, and Morocco. In addition, although the majority of currencies lost a certain amount of ground against the CHF towards the end of the year, the average ex-change rates were significantly higher than in 2011 when viewed in overall terms. The foreign currency impact at net sales level returned to positive territory in 2012 when compared to 2011, with a plus of 1.8% contrasting with –6.9% the previous year.
Gross sales in the EU declined by 21.1% to CHF 92.4 million in the year under review. In Europe as a whole, they amounted to CHF 122.1 million, or 41.7% of gross sales. This means that the share of sales accounted for by Europe declined only minimally in overall terms, despite the sharp absolute decline. In the African re-gion, gross sales amounted to CHF 26.1 million, most of which were generated in Morocco. Komax experi-enced by far the greatest decline in sales in Asia, which suffered a fall of 46.2%. This was attributable to a col-lapse in sales at Komax Solar and a strong decline in sales in Malaysia. By contrast, Komax booked significant sales increases in North and South America. Sales growth in this region overall amounted to just under 15%. After Europe, the Americas contributed the greatest share to business volumes in 2012, namely 29.4%.
Gross profitThe gross profit margin (gross profit as a percentage of revenues) amounted to 59.0% in the year under re-view, 4.9 percentage points higher than the previous year’s margin of 54.1%. This sharp improvement in profitability as a proportion of revenues was the result of margin improvements at Komax Wire and the much lower share of business accounted for by the Solar and Medtech business units, which generate lower gross margins than the Wire business unit and the newly acquired TSK Group. Foreign currency de-velopments also contributed to the improvement in the gross margin to the tune of 1.3 percentage points.
Comments on the consolidated financial statements
48

Operating expensesPersonnel expenses rose to 35.7% of revenues. This sharp increase in personnel expenses as a proportion of sales is attributable to cost legacies resulting from the reduction of headcount at the Solar business unit during the 2012 financial year to 140 employees as at 31 December 2012. In addition, Komax Solar booked restructuring expenses amounting to CHF 1.7 million, which are separately displayed in the income state-ment. The increase in personnel expenses as a proportion of sales is also attributable to the sharp decline in sales at the Medtech business unit. The Komax Group generated revenues per employee of TCHF 246 in 2012, compared to TCHF 343 in 2011. As at 31 December 2012, a total of 1 330 employees were employed by the Komax Group (previous year: 1 140 employees). The increase is solely attributable to the newly acquired companies. From a geographical perspective, 42% of the workforce was employed in Switzerland, while the remainder was divided relatively evenly between the Europe, US, and Asia regions. In addition, 5% of the workforce was employed in Africa and Brazil. In terms of individual areas, 39% of Komax staff were employed in production/procurement in 2012, while 26% worked in marketing/sales (including customer service). Engineering accounted for 15%, research and development for a further 10%. Employees in the engineering area are primarily active in project business, whereas employees in research and development work in the innovation area of standard business. The remaining 10% were engaged in administration, including management and IT.
The “Other operating expenses” item also includes costs from changes to provisions and value adjustments amounting to CHF −0.6 million.
Research and development expenditureR&D expenditure amounted to CHF 24.6 million in 2012, compared to CHF 23.5 million in 2011. R&D ex-penditure therefore amounted to 8.5% of revenues, compared to 6.3% the previous year. In the income statement, the “Other operating expenses” item contains third-party development services amounting to CHF 3.9 million. The lion’s share of the figure for development services (CHF 20.7 million) comprises own work capitalized on the part of our development staff. The increase in R&D expenditure compared to the previous year is the result of an increase in expenses of CHF 2.9 million in the Wire business unit. As at 31 December 2012, the Komax Group employed a total of 140 staff in R&D – the vast majority of them in Switzerland.
Operating profit (EBIT)The Komax Group generated operating profits of CHF 16.0 million in the year under review, after taking restructuring costs into account CHF 14.4 million. This equates to a margin of 5.0% at EBIT level, a signifi-cant decline on the 2011 equivalent of 12.8%. The main reasons for this development are the collapse in business at Komax Solar and the strong decline in sales at Komax Medtech. Further details on segment reporting can be found on pages 88 and 89.
Financial resultThe financial result amounted to CHF −3.4 million, of which CHF −1.3 million related to interest expenditure (2011: CHF −1.5 million). The reduction in interest costs was due to lower interest rates on the syndicated loan. Other financial income of CHF −2.1 million mainly comprised realized and unrealized exchange rate gains in EUR, USD and BRL. These currencies were still trading at a low level against the CHF as at the bal-ance sheet date. The lower valuation against the CHF as at 31 December 2011 resulted in high valued- exchange rate losses, particularly on the financial loans to Group companies.
Group resultIn the 2012 financial year, earnings before taxes (EBT) came in at CHF 11.0 million (3.8% of revenues), as against CHF 46.1 million the previous year. The tax rate for the year under review amounted to 8.3% (2011: 14.8%). The sharp fall in the tax rate is primarily the result of capitalized tax loss carryforwards in countries with significantly higher tax rates than Switzerland. In addition, the Komax Group benefits from being granted reduced tax rates. We are therefore expecting low tax rates to apply over the next few years too, although these can be expected to revert towards the long-term average of around 20%. Earnings after taxes (EAT) amounted to CHF 10.0 million in 2012, with basic earnings per share coming in at CHF 2.99 compared to CHF 11.68 in the previous year.
Financial Report 48 Consolidated Financial Statements 97 Financial Statements of Komax Holding AG 106 Corporate Structure
49

Balance sheet
AssetsAs at 31 December 2012, current assets had declined by 12.3% to CHF 218.3 million, of which cash and cash equivalents amounted to CHF 57.7 million. As at the balance sheet date, the Komax Group can once again report a net cash position of CHF 0.9 million (2011: CHF 5.6 million), which means that the net cash situation has deteriorated only slightly, despite the acquisitions. A key factor behind the pleasing development of the net cash position is the massive decline in the net working capital of Komax Solar of some CHF 25 million to just over CHF 23 million. The figure of CHF 86.9 million for trade receivables also includes underfinanced projects of CHF 16.6 million net according to the POC method. This represents a decline of CHF 18.0 million from the level at 31 December 2011. Overdue receivables are also reported in the notes to the consolidated financial statements. As at 31 December 2012, these amounted to CHF 18.1 million, of which 33.6% were overdue by more than 120 days. At the end of 2011, overdue receivables amounted to CHF 34.1 million. The main reason for higher value adjustments in the area of receivables was the difficult commercial and financial environment, particularly in the photovoltaics area.
LiabilitiesCurrent liabilities amounted to CHF 54.0 million as at 31 December 2012. This amount also includes over-financed projects amounting to CHF 5.6 million net valued according to the POC method. At the end of 2011, the equivalent figure was CHF 8.9 million net.
In addition, provisions for warranties and individual risks amounting to CHF 6.1 million (previous year: CHF 3.3 million) are also booked under current liabilities. The significant increase in provisions is attributable to a combination of project business, the extraordinary charge resulting from the restructuring of the Solar business unit, and higher guarantee costs in the Wire business unit in 2012. Furthermore, provisions of CHF 5.9 million were created in the year under review, and CHF 3.1 million of provisions were used. The figure for the reversal of provisions no longer required was negligible (CHF 0.2 million).
Non-current liabilities include deferred tax liabilities and financial loans. As at 31 December 2012, the latter were CHF 10.2 million higher than the previous year and amounted to CHF 56.8 million. The increase is attributable to the acquisitions made in 2012. The Komax Group continues to have access to a syndicated loan facility amounting to CHF 120 million (a new syndicated loan facility was agreed in July 2012 with a credit limit increase of CHF 20 million), as well as other local lines of credit amounting to a maximum of CHF 15 million. Here too there was a limit increase of CHF 5.0 million compared to last year.
The Group’s shareholders’ equity amounted to CHF 244.4 million as at 31 December 2012 (67.9% of the total assets), compared with CHF 247.0 million at the end of 2011. Compared to the previous year, the impact of currency translation differences was significantly higher at CHF −2.5 million (previous year: CHF −0.3 million), as the reference date exchange rates against the CHF were generally lower than a year ago.
50

Cash flow statement
Cash flow from operating activitiesCash flow from operating activities totalled CHF 17.2 million (2011: CHF 48.0 million) before the change in net current assets and provisions, and CHF 45.2 million after the change in net current assets and provi-sions (2011: CHF 10.1 million). The positive cash flow is attributable to the strong decrease in net working capital following the decline in sales in 2012.
Cash flow from investing activitiesThe cash outflow from investing activities amounted to CHF 17.6 million net, which represents an increase of CHF 7.5 million on the previous year. In addition to the acquisition of TSK Group for CHF 8.5 million net and MCM Cosmic KK for CHF 0.2 million net (see pages 94 and 95 for more information), the key gross investments of Komax in 2012 were effected in the following asset categories:
Machinery/tools CHF 4.4 million
Infrastructure/offices CHF 0.6 million
Buildings/land CHF 1.4 million
IT CHF 2.6 million
Free cash flow, i.e. the cash flow from operating activities after deduction of net investments, amounted to CHF 27.6 million, which represents an increase of CHF 27.7 million compared to the previous year.
Cash flow from financing activitiesFinancial loans amounting to CHF 9.0 million net were taken out in 2012. This is explained by the repayment of loans that were taken over as a part of acquisition activity. In addition, positive cash flow of CHF 1.6 million was generated through the exercising of options by employees. The dividend distribution out of reserves from capital contributions amounted to CHF 13.6 million in 2012. Despite the acquisitions and the significantly higher distribution out of reserves from capital contributions, the cash flow statement recorded an increase in cash and cash equivalents of CHF 5.5 million.
Financial Report 48 Consolidated Financial Statements 97 Financial Statements of Komax Holding AG 106 Corporate Structure
51

Consolidated balance sheet
in TCHF Notes 31.12.2012 31.12.2011
Assets
Cash and cash equivalents 5 57 655 52 142
Securities 6 48 33
Trade receivables 7 86 945 127 272
Other receivables and accrued income / prepaid expenses 8 14 788 13 922
Inventories 9 58 207 55 625
Non-current assets held for sale 10 659 0
Total current assets 218 302 248 994
Deferred tax assets 11 14 499 6 874
Other non-current receivables 12 359 161
Prepaid pension assets 13 1 019 969
Investments in associates 14 2 027 2 085
Property, plant and equipment 15 72 994 68 026
Intangible assets 16 50 989 34 339
Total non-current assets 141 887 112 454
Total assets 360 189 361 448
Liabilities and shareholders’ equity
Trade payables 18 14 335 20 812
Other payables and accrued expenses / deferred income 19 27 481 33 660
Current income tax liabilities 6 095 5 108
Provisions 20 6 110 3 280
Total current liabilities 54 021 62 860
Financial loans 21 56 765 46 571
Deferred tax liabilities 11 4 118 3 982
Total non-current liabilities 60 883 50 553
Total liabilities 114 904 113 413
Share capital 22 344 340
Treasury shares −3 086 −3 086
Capital surplus (premium) 39 399 51 405
Other reserves 207 734 198 335
Equity attributable to equity holders of the parent company 244 391 246 994
Non-controlling interest 894 1 041
Total shareholders’ equity 245 285 248 035
Total liabilities and shareholders’ equity 360 189 361 448
The notes on pages 57 to 95 are an integral component of these consolidated financial statements.
52

Consolidated income statement
in TCHF Notes 2012 2011
Net sales 23 286 725 370 029
Other operating income 24 1 491 1 395
Cost of materials 118 028 170 587
Personnel expenses 25 102 890 103 632
Rental expenses 5 732 4 109
Maintenance and repair expenses 6 397 5 796
Representation and advertising expenses 11 018 11 270
Depreciation 15/16 8 572 7 370
Other operating expenses 27 19 546 21 124
Operating expenses 272 183 323 888
Operating profit before interest, taxes, and extraordinary charges 16 033 47 536
Extraordinary restructuring charges 28 1 681 0
Operating profit before interest and taxes 14 352 47 536
Financial income 29 4 554 7 418
Financial expenses 29 −7 955 −8 861
Group profit before taxes 10 951 46 093
Taxes 30 905 6 813
Group profit after taxes 10 046 39 280
Of which attributable to:
– Equity holders of the parent company 10 177 39 413
– Non-controlling interest −131 −133
10 046 39 280
Attributable to equity holders of the parent company
Basic earnings per share (in CHF) 31 2.99 11.68
Diluted earnings per share (in CHF) 31 2.96 11.48
The notes on pages 57 to 95 are an integral component of these consolidated financial statements.
Financial Report 48 Consolidated Financial Statements 97 Financial Statements of Komax Holding AG 106 Corporate Structure
53

Consolidated statement of comprehensive income
in TCHF 2012 2011
Group profit after taxes 10 046 39 280
Currency translation differences from foreign subsidiaries −2 477 −102
Currency translation differences from investments in associates −17 −115
Other comprehensive income after taxes −2 494 −217
Comprehensive income after taxes 7 552 39 063
Of which attributable to:
– Equity holders of the parent company 7 699 39 104
– Non-controlling interest −147 −41
7 552 39 063
The notes on pages 57 to 95 are an integral component of these consolidated financial statements.
54

Consolidated cash flow statement
in TCHF Notes 2012 2011
Cash flow from operating activities
Group profit after taxes 10 046 39 280
Adjustment for non-cash items
− Taxes 30 905 6 813
− Depreciation and impairment of property, plant and equipment 15 5 806 5 705
− Depreciation and impairment of intangible assets 16 2 766 1 665
− Profit (–) / loss (+) from sale of non-current assets 183 −631
− Expense for share-based payments 1 700 1 730
− Employee benefits −50 843
− Net financial result 29 3 401 1 443
− Other non-cash items 29 45
Interest received and other financial income 876 1 228
Interest paid and other financial expenses −2 960 −1 982
Taxes paid −5 481 −8 093
Cash flow before change in net current assets and provisions 17 221 48 046
Increase (+) / decrease (–) in provisions 2 643 −131
Increase (–) / decrease (+) in trade receivables 43 282 −27 815
Increase (–) / decrease (+) in inventories 1 555 −10 116
Increase (+) / decrease (–) in trade payables −8 419 4 224
Increase (–) / decrease (+) in other net current assets −11 060 −4 153
Total cash flow from operating activities 45 222 10 055
Cash flow from investing activities
Investments in property, plant and equipment 15 −6 975 −5 268
Sale of property, plant and equipment 132 3 420
Investments in intangible assets 16 −2 058 −6 040
Investments in associates 0 −2 228
Investments in Group companies and participations1) −8 694 0
Total cash flow from investing activities −17 595 −10 116
Cash flow from financing activities
Increase in financial liabilities 21 14 640 4 000
Decrease in financial liabilities 21 −23 678 −158
Purchase of treasury shares 0 −693
Sale of treasury shares 0 1 083
Capital increase (share-based payments) 1 631 0
Purchase of non-controlling interests in Group companies 0 1 082
Distribution out of reserves from capital contributions −13 633 −6 753
Total cash flow from financing activities −21 040 −1 439
Effect of currency translations on cash and cash equivalents −1 074 −707
Increase (+) / decrease (–) in funds 5 513 −2 207
Cash and cash equivalents at 1 January 52 142 54 349
Cash and cash equivalents at 31 December 5 57 655 52 142
1) Less cash and cash equivalents acquired.
The notes on pages 57 to 95 are an integral component of these consolidated financial statements.
Financial Report 48 Consolidated Financial Statements 97 Financial Statements of Komax Holding AG 106 Corporate Structure
55
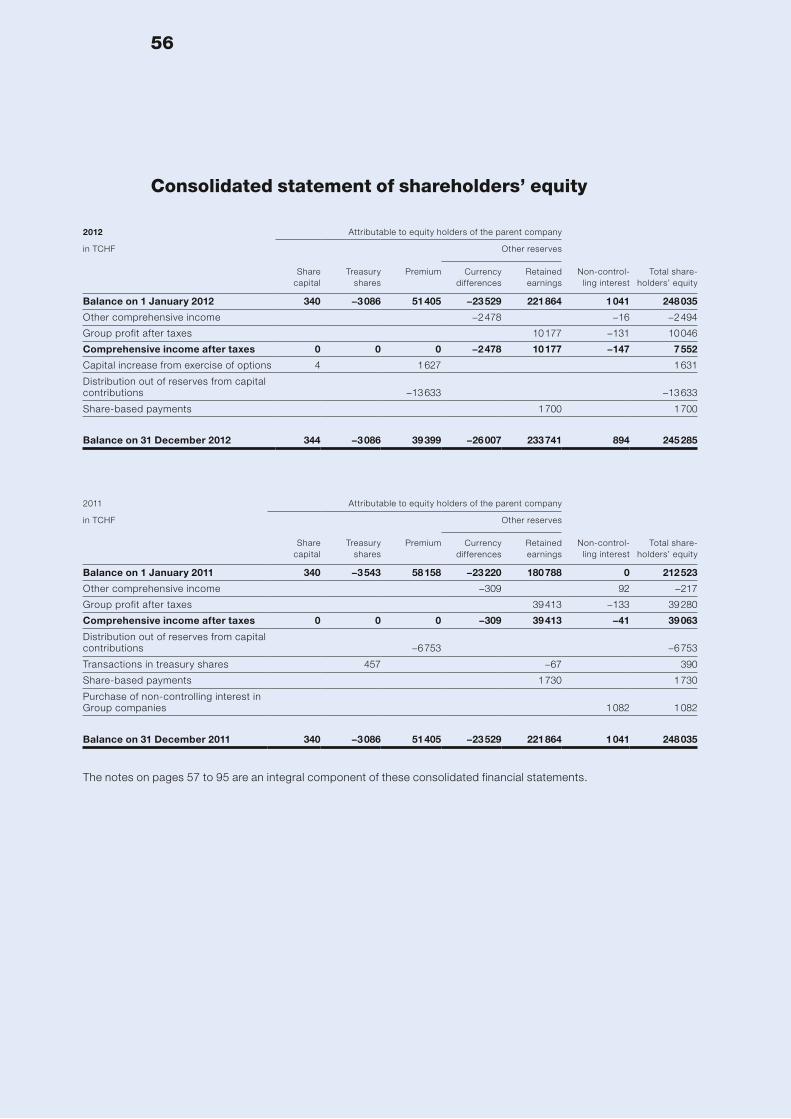
Consolidated statement of shareholders’ equity
2012 Attributable to equity holders of the parent company
in TCHF Other reserves
Sharecapital
Treasuryshares
Premium Currencydifferences
Retainedearnings
Non-control-ling interest
Total share-holders’ equity
Balance on 1 January 2012 340 −3 086 51 405 −23 529 221 864 1 041 248 035
Other comprehensive income −2 478 −16 −2 494
Group profit after taxes 10 177 −131 10 046
Comprehensive income after taxes 0 0 0 −2 478 10 177 −147 7 552
Capital increase from exercise of options 4 1 627 1 631
Distribution out of reserves from capital contributions −13 633 −13 633
Share-based payments 1 700 1 700
Balance on 31 December 2012 344 −3 086 39 399 −26 007 233 741 894 245 285
2011 Attributable to equity holders of the parent company
in TCHF Other reserves
Sharecapital
Treasuryshares
Premium Currencydifferences
Retainedearnings
Non-control-ling interest
Total share-holders’ equity
Balance on 1 January 2011 340 −3 543 58 158 −23 220 180 788 0 212 523
Other comprehensive income −309 92 −217
Group profit after taxes 39 413 −133 39 280
Comprehensive income after taxes 0 0 0 −309 39 413 −41 39 063
Distribution out of reserves from capital contributions −6 753 −6 753
Transactions in treasury shares 457 −67 390
Share-based payments 1 730 1 730
Purchase of non-controlling interest in Group companies 1 082 1 082
Balance on 31 December 2011 340 −3 086 51 405 −23 529 221 864 1 041 248 035
The notes on pages 57 to 95 are an integral component of these consolidated financial statements.
56

Notes to the consolidated financial statements
1 General information The Komax Group is active in the manufacture of machines and as at 31 December 2012 employed 1 330 people worldwide (2011: 1 140 employees). The parent company, Komax Holding AG, is domiciled in Dierikon, Canton Lucerne (Switzerland). The Komax Group’s business activities are focused on the devel-opment, production, and sale of high-quality capital goods for precision engineering, electronics, and infor-mation technology in the areas of wire-processing and automated production and assembly. The focus here is on highly automated production systems for the automotive, household appliances, electronics, telecom-munication, solar energy, and medical technology sectors. The Komax Group sells to the world market. Komax has a network of 23 operating subsidiaries and around 50 independent agencies to ensure on-the-spot sales and service support.
The present consolidated financial statements were adopted by the Board of Directors of Komax Holding AG on 5 March 2013 and released for publication. Their approval by the Annual General Meeting, scheduled for 3 May 2013, is pending.
2 Summary of significant accounting policiesThe significant recognition and measurement policies used in compiling the consolidated financial state-ments are presented in the paragraphs below. Unless otherwise stated, the methods described are always applied to the periods reviewed.
2.1 Accounting policiesThe consolidated financial statements of the Komax Group are based on the individual financial statements of the Group companies, compiled in accordance with uniform standards, as at 31 December 2012. The Group’s accounting is based on historical purchase or production cost. Exceptions to this rule relate to the marking to market of financial assets available for sale, and the valuation of financial assets and liabilities at agreed fair value with effect on the Income Statement (including derivative financial instruments). The consolidated financial statements are structured in accordance with the International Financial Reporting Standards (IFRS) published by the International Accounting Standards Board (IASB) and comply with Swiss law and the Listing Rules of the SIX Swiss Exchange.
2.1.1 New standards and interpretations and amendments to published standards adopted by the Group
Komax adopted the following new standards and amendments to existing standards in accordance with the requirements for the financial year commencing 1 January 2012.
– IFRS 7, “Financial Instruments: Disclosures”. Amendment to the disclosure requirements for transfers of financial assets.
– IAS 12, “Income Taxes”. Amendment to the measurement of deferred tax on the recovery of underlying assets.
The changes to these standards currently have no impact on the consolidated financial statements of the Komax Group.
Financial Report 48 Consolidated Financial Statements 97 Financial Statements of Komax Holding AG 106 Corporate Structure
57

2.1.2 New standards and interpretations and amendments to published standards that are not yet obligatory and are not being applied by the Group at an early stage
– IAS 1, “Presentation of Financial Statements” (applicable from 1 July 2012). The amendment relates to the disclosure of the statement of comprehensive income. No material changes are anticipated for the consoli-dated financial statements of Komax.
– IFRS 9, “Financial Instruments” (applicable from 1 January 2015). This standard introduces new require-ments in relation to the classification and measurement of financial instruments. The impact on the financial statements of the Komax Group cannot yet be fully ascertained; from the current standpoint, however, no material changes or influences are anticipated.
– IFRS 10, “Consolidated Financial Statements” (applicable from 1 January 2013). The standard replaces the previous standard IAS 27, “Consolidated and Separate Financial Statements”, as well as the interpreta-tion SIC 12, “Consolidation – Special Purpose Entities”, and introduces changes in the assessment of how subsidiary companies are controlled. This may have an impact on a company’s scope of consolidation. No material changes are expected for the consolidated financial statements of Komax.
– IFRS 11, “Joint Arrangements” (applicable from 1 January 2013). The new standard replaces the following guidelines that have hitherto applied for questions of accounting for joint ventures: IAS 31, “Interests in Joint Ventures”, and SIC 13, “Jointly Controlled Entities – Non-Monetary Contributions by Venturers”. It sets out the conditions under which an investor is deemed to control a joint venture and must add it to the scope of consolidation, as well as what information must be disclosed. No material changes are expected for the consolidated financial statements of Komax.
– IFRS 12, “Disclosure of Interests in Other Entities” (applicable from 1 January 2013). The standard sets out the information that must be disclosed in order to assess the existence of an interest in other entities as well as the associated risks and repercussions for a company’s asset, financing, and income situation. Above all, this is likely to lead to additional disclosures or to amendments to the presentation of the consoli-dated financial statements.
– IFRS 13, “Fair Value Measurement” (applicable from 1 January 2013). The standard defines what is meant by fair value, how market values should be measured, and what information should be reported. It is applied when another IFRS considers that a fair value measurement is required. From today’s perspective, no material changes or impact on the consolidated financial statements of Komax are expected.
– IAS 19, “Employee Benefits” (applicable from 1 January 2013). In this revised standard, the corridor ap-proach (i.e. the immediate recognition of gains or losses in earnings) is no longer permissible; instead, the actuarial gains or losses have to be recognized at the point they arise in other comprehensive income. The annual costs of defined benefit plans now include the net interest expense or income as per the net position of the plan while taking into account the discount rate for defined benefit obligations. Furthermore, both the disclosure regulations and the definition of benefits arising from the termination of employment contracts have been adjusted. As a result of the revised standard, the Komax Group expects greater volatility in pen-sion plan assets and employee benefit liabilities, as well as in consolidated shareholders’ equity.
A number of other miscellaneous changes and improvements were made to numerous standards. None of these changes are expected to have any significant impact on the financial statements of the Group.
58

2.2 Scope of consolidation2.2.1 SubsidiariesThe consolidated financial statements incorporate the individual financial statements of Komax Holding AG, Dierikon, and its subsidiaries. The individual consolidated subsidiaries are listed on pages 106 and 107. Subsidiaries are fully consolidated if Komax Holding AG exercises control over their financial and business policies. As a rule, this is the case if Komax Holding AG directly or indirectly holds over 50% of the subsid-iary’s voting capital. Subsidiaries are included in the consolidated financial statements (fully consolidated) from the date when the Group assumes control. They are deconsolidated from the date when control ends.
Acquired subsidiaries are accounted for according to the acquisition method. Acquisition costs are equal to the fair value of the assets assumed, equity instruments issued, and liabilities incurred or assumed at the date of exchange. Costs directly assignable to acquisitions will be directly booked to the income statement. Assets, liabilities, and contingent liabilities identified during a merger are recognized at fair value on first consolidation, regardless of the extent of minority interests. The excess of the cost of acquisition over the fair value of the Group’s share of the identifiable net assets acquired is recorded as goodwill. If the cost of acquisition is less than the fair value of the net assets of the subsidiary acquired (negative goodwill), the dif-ference is recognized directly in the income statement.
Intragroup transactions, balances, and unrealized gains and losses from transactions between Group com-panies are eliminated.
2.2.2 Changes in the scope of consolidationIn 2012, Komax acquired 100% of the Japanese company MCM Cosmic KK, as well as 100% of TSK Beteiligungs GmbH and all its subsidiaries. Further details on the acquisitions made in 2012 are provided in Note 33 on pages 94 and 95. In the previous year 2011, Komax signed a joint venture agreement with Yingkou Jinchen Machinery Co. Ltd., Yingkou City (Liaoning Province, China), as a result of which it ac-quired 51% of the ordinary share capital of Komax Jinchen Solar Equipment (Yingkou) Co. Ltd. The com-pany commenced its operating activity in the first half of 2011.
The above-mentioned acquisitions and new company foundation in 2011 aside, there were no changes in the scope of consolidation either in the 2012 reporting year or in the prior year period.
2.2.3 Transactions with non-controlling interestsKomax treats transactions with non-controlling interests as equity capital transactions with the owners. When non-controlling interests are acquired, the difference between the equivalent value paid per share and the corresponding acquired interest in the carrying value of the net assets of the subsidiary company is rec-ognized in shareholders’ equity. Any profit from the sale of non-controlling interests is likewise booked under shareholders’ equity.
2.2.4 Shares in joint ventures and associatesOwnership interests of between 20% and 50% and joint ventures over which Komax Holding AG exercises significant influence are accounted for according to the equity method and initially recognized at acquisition cost. Cumulative changes in the value of such holdings after acquisition are reported in the income state-ment and charged against the carrying value of the holding. If a cumulative loss equals or exceeds the value of the Group’s interest in an associate, no further losses are recorded unless the Group has assumed obli-gations for the associate or made payments on its behalf. Unrealized profits from transactions between Group companies and associates are eliminated in proportion to the Group’s interest in the affiliate.
Interests of less than 20% are treated as held for trading and measured at fair value. They are reported within “Securities”.
Financial Report 48 Consolidated Financial Statements 97 Financial Statements of Komax Holding AG 106 Corporate Structure
59

As at 31 December 2012 and 31 December 2011, Komax held a 30% stake in SLE quality engineering GmbH & Co. KG and a 30% stake in SLE quality engineering Verwaltungs GmbH. Further details on these associated companies are provided in Note 14 on page 81.
Komax held no investments below 20% and no interests in joint ventures at either 31 December 2012 or 31 December 2011.
2.3 Segment reportingKomax’s reportable segments are based on the Group’s strategic business areas, in which products using different technologies are manufactured and sold on the basis of independent marketing strategies. The internal organizational structure is fully geared towards the individual business areas, each of which comes under the responsibility of a separate head.
The Executive Committee of the Komax Group is designated as the chief operating decision-maker. The Board receives financial information on the individual segments on a regular basis, enabling it to assess their profitability and decide the operational allocation of resources to the various areas.
The financial data of the operating segments is established according to the same accounting principles set out here. Transfer prices between the operating segments are set on an “arm’s length” basis. The Executive Committee assesses the profitability of the segments on the basis of their earnings before interest and taxes (EBIT). Information on the assets and liabilities of the individual segments is not reported to the chief operating decision-maker, which is why such information is also not disclosed in external reporting.
In accordance with internal reporting to the chief operating decision-maker, the Group has been disclosing information for its three business segments of Wire, Solar, and Medtech from the 2009 financial year on-wards. The Wire segment essentially comprises the development, production, distribution, and mainte-nance of wire processing machines and systems used primarily for wire production in the automotive and electronics industries. The Solar segment develops and produces machinery and customer-specific pro-cess solutions for the manufacturing of photovoltaic modules. The Medtech segment includes the design and production of assembly systems for the pharmaceutical industry (Medtech) as well as the manufactur-ing of assembly lines for inkjet cartridges (Inkjet). The development and manufacturing of systems for the assembly of mechanical and electronic components in the automotive and electronics sector (Mechanical and Electronic Systems Assembly) is also assigned to this segment.
60

2.4 Currency conversion2.4.1 Functional currency and reporting currencyItems included in the financial statements of each entity are measured using the currency that best reflects the economic substance of the underlying events and circumstances relevant to that entity (the functional currency). The consolidated financial statements are presented in Swiss francs, which is the functional cur-rency of the parent company, Komax Holding AG.
2.4.2 Transactions and balancesForeign currency transactions are translated into the functional currency at the rate prevailing on the date of the transaction. Foreign exchange gains and losses resulting from the settlement of such transactions and from the translation of monetary assets and liabilities denominated in foreign currencies are recognized in the income statement, except when taken to shareholders’ equity as a qualifying cash flow hedge.
2.4.3 Group companiesThe earnings and balance sheet figures of foreign business units with a functional currency other than the Swiss franc are translated to Swiss francs as follows:
a) Assets and liabilities are translated at the exchange rate on the balance sheet date for each such date.b) Revenues and expenses are translated at the weighted average exchange rate for each income statement.c) All exchange rate gains and losses are reported on a separate line within the other reserves under
shareholders’ equity.
Exchange rate differences arising from the translation of net investments in foreign business units are rec-ognized under comprehensive income. When a foreign company is sold, these exchange rate differences are reported in income as part of the gain or loss from the sale.
Goodwill and fair value adjustments occurring during the acquisition of a foreign company are treated as assets and liabilities of the unit and translated at the exchange rate on the balance sheet date.
The most important year-end and average exchange rates were as follows:
Currency Year-end rate31.12.2012
Average rate 2012
Year-end rate31.12.2011
Average rate 2011
USD 0.920 0.950 0.950 0.900
EUR 1.220 1.220 1.230 1.250
BRL 0.452 0.494 0.511 0.545
CNY 0.148 0.150 0.151 0.139
MYR 0.302 0.306 0.300 0.295
Financial Report 48 Consolidated Financial Statements 97 Financial Statements of Komax Holding AG 106 Corporate Structure
61
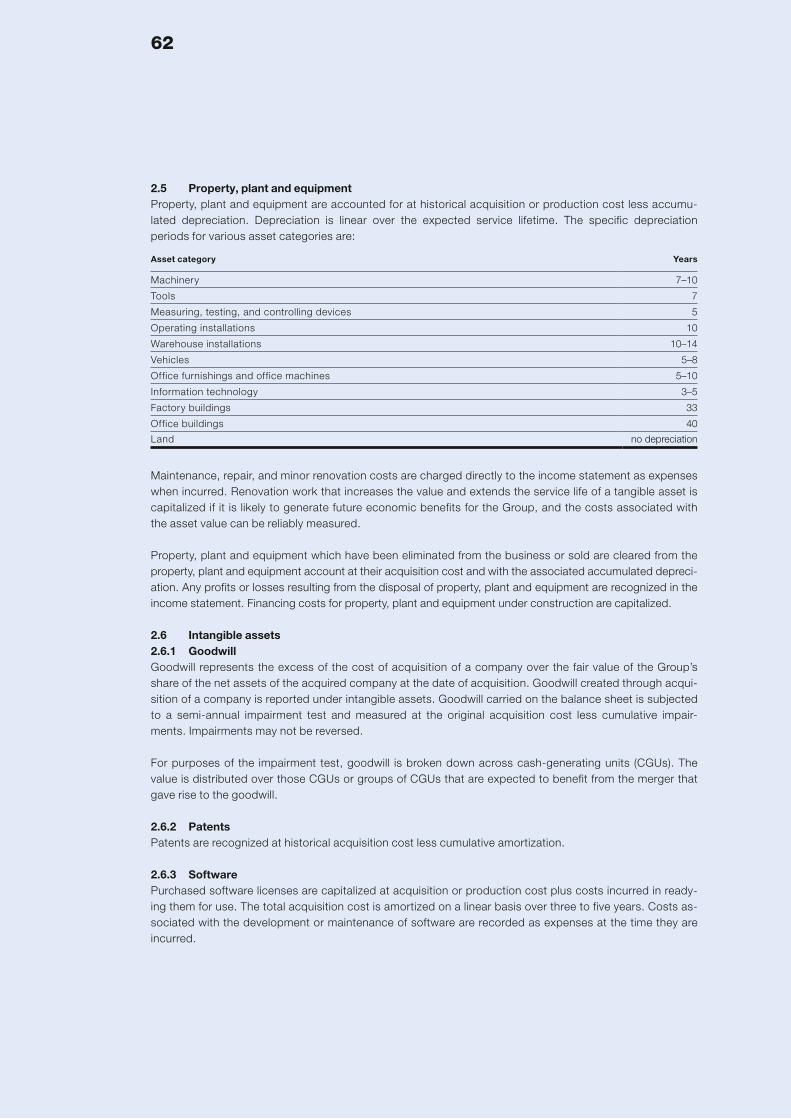
2.5 Property, plant and equipmentProperty, plant and equipment are accounted for at historical acquisition or production cost less accumu-lated depreciation. Depreciation is linear over the expected service lifetime. The specific depreciation periods for various asset categories are:
Asset category Years
Machinery 7–10
Tools 7
Measuring, testing, and controlling devices 5
Operating installations 10
Warehouse installations 10–14
Vehicles 5–8
Office furnishings and office machines 5–10
Information technology 3–5
Factory buildings 33
Office buildings 40
Land no depreciation
Maintenance, repair, and minor renovation costs are charged directly to the income statement as expenses when incurred. Renovation work that increases the value and extends the service life of a tangible asset is capitalized if it is likely to generate future economic benefits for the Group, and the costs associated with the asset value can be reliably measured.
Property, plant and equipment which have been eliminated from the business or sold are cleared from the property, plant and equipment account at their acquisition cost and with the associated accumulated depreci-ation. Any profits or losses resulting from the disposal of property, plant and equipment are recognized in the income statement. Financing costs for property, plant and equipment under construction are capitalized.
2.6 Intangible assets2.6.1 GoodwillGoodwill represents the excess of the cost of acquisition of a company over the fair value of the Group’s share of the net assets of the acquired company at the date of acquisition. Goodwill created through acqui-sition of a company is reported under intangible assets. Goodwill carried on the balance sheet is subjected to a semi-annual impairment test and measured at the original acquisition cost less cumulative impair-ments. Impairments may not be reversed.
For purposes of the impairment test, goodwill is broken down across cash-generating units (CGUs). The value is distributed over those CGUs or groups of CGUs that are expected to benefit from the merger that gave rise to the goodwill.
2.6.2 PatentsPatents are recognized at historical acquisition cost less cumulative amortization.
2.6.3 SoftwarePurchased software licenses are capitalized at acquisition or production cost plus costs incurred in ready-ing them for use. The total acquisition cost is amortized on a linear basis over three to five years. Costs as-sociated with the development or maintenance of software are recorded as expenses at the time they are incurred.
62

2.6.4 Research and development expenditureResearch and development costs are capitalized and written off on a straight-line basis over their useful life, provided the criteria for capitalization are met. No such expenses were capitalized in the year under review or in the previous year, as the future economic benefits of these expenses cannot be accurately estimated.
2.6.5 TechnologyAcquired technology assets are recognized if they bring the company measurable benefits over a period of several years. They are valued at acquisition cost minus linear depreciation. Acquisition costs are written down in a linear way over a period of five to ten years.
2.7 Impairment of non-monetary assetsAssets with an indeterminate service lifetime are not amortized according to plan but subjected to an annual impairment test. Assets subject to planned amortization are also tested for impairment if events or changes in circumstances create a presumption that the carrying value can potentially no longer be realized. An impairment is recorded in the amount by which the asset’s carrying value exceeds its realizable value. The realizable value is the greater of the asset’s fair value less disposal costs and its use value. In determining impairments, assets are grouped according to the smallest separately identifiable cash-generating units.
2.8 Financial assetsFinancial assets are classified into the following categories: recognized at fair value through profit or loss, loans and receivables, held to maturity, and available for sale. The classification depends on the purpose for which a given financial asset was acquired. The financial assets recognized in the consolidated balance sheet are assigned to the following categories:
in TCHF 31.12.2012 31.12.2011
Securities 48 33
Total held for trading 48 33
Cash and cash equivalents 57 655 52 142
Trade receivables 86 945 127 272
Other receivables 10 878 9 821
Other non-current receivables 359 161
Total loans and receivables 155 837 189 396
The financial liabilities are allocated to the following categories:
in TCHF 31.12.2012 31.12.2011
Derivative financial instruments 353 305
Total held for trading 353 305
Financial liabilities (current and non-current) 56 765 46 571
Trade payables 14 335 20 812
Other payables 6 695 7 346
Total at amortized cost 77 795 74 729
Financial Report 48 Consolidated Financial Statements 97 Financial Statements of Komax Holding AG 106 Corporate Structure
63

2.8.1 Financial assets at fair value through profit or lossThis category comprises two subcategories: assets classified as “Held for trading” from the beginning, and those classified as “At fair value through profit or loss” from the beginning. A financial asset is assigned to this category if it was purchased in principle with the intent of short-term resale or designated as such by management. Derivatives also belong to this category if they are not qualified as hedges. Assets in this category are reported as current assets if they are either held for trading or are expected to be realized within 12 months of the balance sheet date.
The “Securities” item reported separately in the balance sheet of the Komax Group is classified as “Financial assets held for trading”. Securities comprise capital market investments acquired for short-term resale. Securities purchases are recorded at their market price on the date of purchase and subsequently measured at fair value. Realized and unrealized gains and losses from changes in fair value are recognized directly in income.
2.8.2 Loans and receivablesLoans and receivables are non-derivative financial assets with fixed or calculable payments that are not listed on an active market. They are regarded as current assets if they mature within 12 months of the bal-ance sheet date. If the period to maturity exceeds 12 months, they are carried as non-current assets. Short-term loans and receivables are reported in the consolidated balance sheet under “Cash and cash equiva-lents”, “Trade receivables”, and “Other receivables and accrued income / prepaid expenses”, whereas long-term receivables are reported under “Other long-term receivables”.
2.8.3 Financial investments held to maturityFinancial investments held to maturity are non-derivative financial assets with fixed or calculable payments and a fixed maturity that the entity wishes and is able to hold to the maturity date. The Komax Group con-solidated balance sheet does not include any financial assets in this category.
2.8.4 Financial assets available for saleFinancial assets available for sale are non-derivative assets that were either assigned to this category or not assigned to any of those described above. They are carried as non-current assets unless management intends to dispose of them within 12 months of the balance sheet date. Komax does not hold any financial assets in this category.
Purchases and sales of financial assets are posted at the settlement date, i.e. the date when the asset is transferred. Financial assets in the “At fair value through profit or loss” category are carried at fair value, both at acquisition and after they are recognized for the first time. Associated transaction costs and gains and losses from financial assets are reported on the income statement for the corresponding period. Loans and receivables are carried at historical purchase price using the effective interest rate method.
Fair values of listed investments are based on current offer prices. For assets without an active market, Komax applies suitable valuation measures to determine the fair value. These include reference to recent “arm’s-length” transactions, current market prices of other similar assets, discounted cash flow procedures, and option price models based as far as possible on market data and as little as possible on company-specific data.
At each balance sheet date, a determination is made as to whether objective indications exist of impairment of a financial asset or group of assets. Any impairments are charged to income in the corresponding period.
64

2.9 Derivative financial instruments and hedging activitiesDerivative financial instruments are initially measured at fair value as at the date when the contract is concluded. Subsequent measurement is likewise at fair value as at each balance sheet date. The method used to measure gains and losses depends on whether the derivative financial instrument was designated as a hedging instru-ment and, if so, on the type of item hedged. Derivative financial instruments may be designated as:
a) hedges of fair value of a balance sheet asset or liability or off-balance-sheet fixed obligation (fair value hedge);b) hedges against risks of payment flow fluctuations associated with a balance sheet asset or liability or an
anticipated and highly probable future transaction (cash flow hedge); orc) hedges of a net investment in a foreign business operation (net investment hedge).
Since the Komax Group uses derivative financial instruments only to hedge against existing foreign ex-change and interest rate risks, such instruments do not qualify for hedge accounting in terms of IAS 39. Foreign currency surpluses are hedged in accordance with financial planning (economic hedges), so that changes in fair value are charged directly to income as realized and unrealized gains or losses for the rele-vant period. Only standardized instruments (currency forward and option contracts, interest rate and cur-rency swaps) are used for hedging. Financing and hedging instruments are utilized in accordance with uni-form rules throughout the Group.
2.10 InventoriesInventories are measured at the lower of purchase or production cost and net sales price. Purchase or pro-duction costs are determined using the weighted average method. Internally produced finished and semi-finished goods are measured at production cost in accordance with the state of completion. Production costs of finished and unfinished products include costs for product design, raw materials, direct personnel costs, other direct costs, and overhead costs allocated to production (based on normal operating capac-ity). Purchase and production costs do not include costs of debt capital since products do not qualify as assets in the sense of IAS 23, “Borrowing Costs”, and any costs of debt capital cannot therefore be directly attributed to products. The net sales price is the estimated proceeds of sale attainable in the normal course of business, less the necessary variable selling costs.
2.11 Trade receivablesTrade accounts receivable are recorded at the original billed amount less provisions for bad debt. Bad debt provisions are formed if there are objective indications that not all the Group’s accounts receivable will be settled. Indications that an amount may not be recoverable include signs that the customer may be in seri-ous financial difficulties or if bankruptcy or financial reorganization appears probable. The allowance is stated separately and comprises the difference between the carrying amount of the receivable and the recoverable amount. The amount of the allowance is charged to the income statement. An impairment loss is posted if the receivable is no longer recoverable. Non-current receivables are discounted to account for current value if the effects are material.
2.12 Manufacturing contractsManufacturing contracts in the automated assembly and production business units, involving the customer-specific manufacture of systems, are valued according to the percentage-of-completion method (POC). On the balance sheet, these are reported either under “Trade receivables” or “Other payables and accrued ex-penses / deferred income”, depending on the degree to which they are underfinanced or overfinanced. The percentage of completion is calculated according to the cost-to-cost method (costs incurred in relation to overall estimated costs of the contract). Anticipated project losses are fully expensed in the income state-ment. Any costs of debt capital are capitalized provided debt capital is raised for the purpose of financing the project and provided its costs can be directly attributed to a manufacturing contract.
Financial Report 48 Consolidated Financial Statements 97 Financial Statements of Komax Holding AG 106 Corporate Structure
65

2.13 Non-current assets held for saleNon-current assets held for sale are reported separately under current assets. Immediately before their first-time classification as assets held for sale, the value of the assets is determined in accordance with pre-vailing accounting principles. Subsequently, non-current assets held for sale are reported at the lower of carrying amount and fair value minus cost to sell. Non-current assets held for sale are not depreciated/ amortized.
2.14 Cash and cash equivalentsCash and cash equivalents includes banknotes, sight deposits and other current, highly liquid financial as-sets with an original maturity of no greater than three months. Utilized current account overdrafts are shown on the balance sheet as payables to credit institutions under current financial liabilities.
2.15 Shareholders’ equityOrdinary shares are classified as equity. No preferred shares have been issued to date.
Costs directly attributable to the issue of new shares are disclosed in equity as a net deduction from the proceeds.
Treasury shares are recognized at the average weighted cost of acquisition, including the transaction costs assignable to them, and offset against equity. When treasury shares are purchased or sold, the considera-tion paid or received will be offset against equity.
2.16 Dividend paymentDividend distribution to the shareholders of Komax Holding AG is recognized as a liability in the consoli-dated financial statements in the period in which the dividend distribution is approved by the company’s shareholders.
2.17 Trade payablesTrade payables are valued initially at fair value, which is normally the amount originally invoiced, and sub-sequently measured at amortized cost.
2.18 Financial liabilitiesFinancial liabilities are initially recognized at fair value after deducting any transaction costs. In subsequent periods, they are measured at historical purchase price. Any differences between the amount paid out and the amount due is reported in income over the duration of the liability.
Borrowings are classified as current liabilities unless the Group has an unconditional right to postpone settlement of the debt until al least 12 months after the balance sheet date.
2.19 Deferred taxesAll the consolidated companies of the Komax Group are independently subject to tax, except for the com-panies in the USA that are affiliated to Komax Holding Corp. (Komax Systems Rockford Inc., Komax Solar Inc. and Komax Corp.). In the case of the other companies, it is not possible to offset the taxable profit of one consolidated company with the loss of another. This should be remembered when comparing earnings with the tax burden.
66

Deferred and future tax expenses are calculated on the basis of the comprehensive liability method. This method is based on the tax rates and tax regulations applicable on the balance sheet date or which have in essence been enacted and are expected to apply at the time the deferred tax claim is realized or the de-ferred tax liability is settled. Deferred and future taxes are calculated on the basis of the temporary differ-ences in value between the individual balance sheets and balance sheets for tax purposes. Such differ-ences primarily exist in the case of non-current assets, inventories, and some provisions. Deferred tax assets are recognized in the amount corresponding to the probability that the Group companies in question will generate sufficient future taxable income to absorb the relevant positive differences in the tax assets.
Deferred tax liabilities are provided on temporary differences arising on investments in subsidiaries and as-sociates, except where the timing of the reversal of the temporary difference cannot be determined by the Group and it is consequently probable that the temporary difference will not reverse in the foreseeable future.
2.20 Payments to employees2.20.1 Employee benefitsEmployee pension and retirement benefits are based on the regulations and prevailing circumstances in those countries in which Komax is represented. In Switzerland, pension and retirement benefits are based on the defined benefit model in conformity with IAS 19, “Employee Benefits”. The consequences of compli-ance with IAS 19 for retirement benefits are detailed in Note 13. In the other countries, pension and retire-ment benefits are provided under defined contribution schemes.
The provision for defined benefit plans stated in the balance sheet represents the present value of the defined benefit obligation (DBO) on the balance sheet date less the fair value of plan assets, adjusted for cumulative, non-recognized actuarial gains and losses. The DBO is calculated annually by an independent actuary according to the projected unit credit method.
Past service costs are recognized immediately in income, unless the changes in the pension plan depend on the employee remaining with the company for a predefined period (until the vesting period). In such an event, the past service costs are amortized on a straight-line basis over the vesting period.
Actuarial gains and losses, which are based on experience adjustments and changes in actuarial assump-tions, are recognized in the income statement over the employee’s expected remaining period of service through the corridor approach.
In the case of defined-contribution plans, the Group funds public or private retirement plans on the basis of statutory or contractual obligations or voluntary contributions. The Group has no payment obligations beyond the payment of contributions. Contributions are recognized in personnel expenses as they become due. Prepayments of contributions are recognized as assets to the extent that a right to repayment or a reduction in future payments exists.
2.20.2 Share-based compensationThe Komax Group has initiated a share-based compensation plan involving grants of its own shares by way of a capital increase. The fair value of the employee services received for the options is included in person-nel expenses. The total amount of the expenses to be charged for employee options issued after 7 Novem-ber 2002 and still locked in is amortized over the vesting period and recognized in expenses. At each balance sheet date, the number of options expected to become exercisable and on which the reportable current value is based is estimated. The effects of any potentially relevant changes in initial estimates are taken into account in the income statement and by a corresponding charge to shareholders’ equity during the remaining time to the vesting date. Payments received upon exercise of the options are credited to sub-scribed capital (at par) and to capital reserves after deducting directly attributable transaction costs.
Financial Report 48 Consolidated Financial Statements 97 Financial Statements of Komax Holding AG 106 Corporate Structure
67

2.20.3 Other payments after termination of employmentThere are no liabilities for payments to pensioners after termination of employment.
2.20.4 Payments triggered by termination of employmentIn some countries, in which the Komax Group operates its own companies, there are local regulations for payment triggered by termination of employment. Komax complied with these legal requirements. The cor-responding expenses are booked under personnel expenses.
2.20.5 Profit sharing and bonus plansFor bonus payments and profit sharing, a liability is recognized based on an appraisal procedure involving Group profit after certain adjustments and the beneficiary’s individual targets. A provision is recorded in the consolidated financial statements in cases where a contractual liability exists. The expense is recognized in income under personnel expenses.
2.21 ProvisionsProvisions are recorded if the Group has a current legal or constructive obligation arising from a past event and it is probable that settling this obligation will impact the asset base, and if the amount of the provision can be reliably estimated.
Provisions for warranties are based on past payments, sales revenues in previous years, and current con-tracts. Komax normally gives a one-year warranty on machines and systems.
The other provisions relate to various obligations and liabilities associated with past events, the perform-ance of which will in all probability result in an outflow of funds.
2.22 Revenue recognitionThe Komax Group’s consolidated income statement is compiled using the nature of expense method. Net sales comprise the fair value of considerations received or receivable for the sale of goods and services in the course of ordinary business activities after deducting VAT, returns, discounts and price reductions, and eliminating intragroup sales. Revenues are recognized as described below.
2.22.1 Sale of goodsRevenue from the sale of goods is recognized when risk and rewards of ownership have been transferred to the buyer. All expenses connected with sales are recognized on an accrual basis.
2.22.2 Sale of servicesRevenue from the sale of services is recognized in accordance with progress on the service according to the ratio of completed to still outstanding service to be performed during the financial year in which the ser-vices are rendered.
2.22.3 Revenue recognition using the POC methodIn the automated assembly and production field, revenue is recognized according to the POC method. The Komax Group calculates the percentage of completion according to the ratio of production costs already incurred to forecast total production costs.
2.22.4 Interest and dividend income Interest income is accrued using the effective interest rate method. Dividend income is recognized at the date when the right to receive the payment originates.
68

2.23 LeasesA lease under which a significant portion of the risks and rewards of ownership remains with the lessor is regarded as an operating lease. Payments under operating leases (less any incentives provided by the lessor) are charged to income on a linear basis over the duration of the lease agreement.
The Komax Group does not assume material liabilities from financial lease contracts.
Contractual relationships in which Komax acts as lessor are reported as financial leases if all risks and re-wards associated with ownership are essentially transferred to the lessee. At the beginning of the lease, lease payments are recognized in the balance sheet in the amount of the net investment value arising from the lease. Revenue is recorded in the same way as the direct sale of goods. Financial income is spread over the term of the lease.
Assets that are the subject of operating leases are reported in the balance sheet in accordance with their properties and are written down at the normal rates for similar assets. Lease income is recognized in the in-come statement on a linear basis over the term of the lease. Komax did not possess any significant assets that were the subject of operating leases in either the 2012 reporting year or the previous year.
2.24 Government grantsGovernment grants are recognized if it is likely that the payments will be received and Komax can fulfil the conditions attached to such subsidies. These are recognized in “Other operating income”, regardless of when payment is received, and on a pro-rata basis in the period in which the associated costs are incurred, and charged to the income statement as an expense. Grants relating to an asset are deducted from the carrying amount.
2.25 Restatement of previous years’ figuresTo ensure that figures are comparable, prior-year figures are restated if it becomes necessary when new provisions of the International Financial Reporting Standards (IFRS) are applied or existing standards are amended, or when changes are made in the presentation and structure of the financial statements during the reporting period.
In the 2012 financial year, no changes were made that had a significant impact on the amounts stated in the balance sheet, income statement or cash flow statement of the Komax Group.
Financial Report 48 Consolidated Financial Statements 97 Financial Statements of Komax Holding AG 106 Corporate Structure
69

3 Financial risk managementThe Komax Group is exposed to various financial risks, for example currency, credit, liquidity, and interest rate risks, through its business activities. The Group’s overall risk management strategy is focused on the unpredictability of developments in the financial markets and is intended to minimize the potential negative impact on the Group’s financial position. The Group uses derivative financial instruments to protect itself against interest rate, currency, and credit risks. The risks are monitored and reported. Risk management is conducted by the finance department of Komax Holding AG in conformity with the guidelines issued by the Board of Directors. These guidelines set out procedures for the use of derivatives as well as dealing with foreign currency, interest rate, and credit risks. The guidelines are binding for all subsidiaries of the Komax Group.
In addition, Komax conducts extensive annual analyses of financial risks as part of its risk management. The principal financial risks form an integral part of the internal control system (ICS) and are therefore subject to systematic, periodic review. Further, in consultation with a bank, the Komax Group prepares an extensive report each quarter on currency, interest, country, and customer risks, using the value-at-risk method. Due to the increased volatility, the Group continually improved and extended its risk management, particularly in relation to foreign exchange and country risks in emerging markets.
3.1 Currency riskThe Komax Group operates internationally and is therefore exposed to a variety of foreign-exchange risks. Foreign currency risks arise from future cash flows, assets and liabilities recognized in the balance sheet, and investment in foreign companies.
Foreign currency items are assessed centrally by Group Treasury as part of the rolling financial planning pro-cess. Corporate guidelines specify that at least one third of foreign currency profits must be hedged through forward rate contracts. Up to 100% of the amount must be hedged if the current exchange rate is below the budgeted rate and the exchange rate for the foreign currency is expected to drop further relative to the functional currency.
Komax is mainly exposed to currency risks relating to the US dollar and the euro. Assuming that the euro had been 10% weaker against the Swiss franc on 31 December 2012 and that all other parameters had been largely unchanged, the EBIT margin would have been 0.4 percentage points (2011: 0.2 percentage points) lower. Conversely, if this exchange rate had been 10% higher, the margin would have risen by the same amount. Assuming that the US dollar had been 10% weaker against the Swiss franc on 31 December 2012 and that all other parameters had been largely unchanged, the EBIT margin would have been 0.8 per-centage points (2011: 1.0 percentage points) lower. Conversely, if this exchange rate had been 10% higher, the margin would have risen by the same amount. The main reasons for these changes would have been currency gains and losses on receivables, payables, and other current receivables and liabilities.
The Komax Group generated around 24% of sales in euros. The largest customer grouping in the eurozone area is based in Germany, followed at some distance by customers in France, Italy, and Austria. Sales in the other eurozone countries are relatively insignificant. As a result of the ongoing debt crisis, the Komax Group has further tightened its credit policy and adjusted its processes accordingly. The Group is not currently exposed to any exceptional default risks as a result of the difficult ongoing situation in certain eurozone countries.
3.2 Credit riskCredit risks may exist with regard to bank account balances, derivative financial instruments and receiv-ables from customers. Banks must have a minimum credit rating of “A” before the Komax Group will enter into a material business relationship with them. Moreover, all risks pertaining to cash and cash equivalents are further minimized by using a variety of banks rather than one single bank.
70

There is no significant concentration of potential credit risks within the Group. There are binding policies to ensure that sales to customers are made only if the customer has shown reasonable payment performance in the past. Moreover, outstanding receivables are monitored at the corporate level on a monthly basis. Contracts for derivative financial instruments and financial transactions are only entered into with banks of the highest financial solidity. The Group also has a business policy that limits credit risk associated with indi-vidual financial institutions through use of multiple banks.
Management does not anticipate any significant losses on the receivables outstanding as at 31 December 2012 that have not already been taken into account in the value adjustments as per Note 7.
The following table shows the receivables and credit limits of the main counterparties as of the reporting date:
in TCHF 31.12.2012 31.12.2011
Counterparty Rating Credit limit Amount held Credit limit Amount held
Credit Suisse1) A 25 000 14 538 20 000 10 333
UBS1) A 24 000 8 293 20 000 10 321
Deutsche Bank1) A+ 8 739 6 369 12 357 11 621
Customer A Group 2 n/a 3 860 n/a 5 326
Customer B Group 2 n/a 3 284 n/a 4 973
Customer C Group 2 n/a 2 690 n/a 3 006
1) Creditor as part of the CHF 120.0 million syndicated loan agreement under the stewardship of Credit Suisse (participating banks: Basler Kantonalbank, Credit Suisse, Deutsche Bank, Luzerner Kantonalbank, UBS, and Zürcher Kantonalbank).
Komax assigns its customers to the following groups:
Group 1: New customer (business relationship established within the past 12 months).Group 2: Existing customer (business relationship established more than 12 months ago) without defaults in the past.Group 3: Existing customer (business relationship established more than 12 months ago) with defaults in the past.
3.3 Capital riskIn the management of its capital, the Komax Group pays special attention to ensuring that the Group is able to continue to operate, that shareholders receive an appropriate return for their risks, and that financial ratios are optimized, taking the cost of capital into account. To achieve these targets, Komax may adjust its dividend payment, issue new shares, or sell assets in order to scale back its debt.
Komax monitors its capital structure principally through the gearing factor and net debt. The latter is calcu-lated from the total outstanding interest-bearing debts of the Group, including liabilities from finance leas-ing, minus cash and cash equivalents. The gearing factor is calculated by dividing net debt at the balance sheet date by the operating profit before interest, taxes, depreciation, and amortization (EBITDA) over the last 12 months (rolling). This resulted in a net cash position (previous year: net cash) at the end of the reporting year, as cash and cash equivalents and securities exceeded existing financial liabilities as at 31 December 2012.
The Group’s financial liabilities are subject to externally regulated capital requirements (covenants). These essentially provided for a maximum gearing factor of 2.75 as at 31 December 2012. In addition, the self- financing ratio (i.e. the Group’s reported equity plus subordinated loans minus goodwill divided by total as-sets less goodwill) may not fall below 50% at any balance sheet date.
The Komax Group has complied with all capital requirements since the contract signing date as well as at 31 December 2012.
Financial Report 48 Consolidated Financial Statements 97 Financial Statements of Komax Holding AG 106 Corporate Structure
71

3.4 Liquidity riskPrudent liquidity risk management involves maintaining sufficient reserves of cash and cash equivalents and liquid securities as well as financing capacity through an adequate volume of approved lines of credit. The amount of cash required for operations is reviewed annually and monitored on a monthly basis by the finance department. Given the business environment in which Komax operates, it is also essential for the Group to maintain the necessary flexibility in financing by maintaining sufficient unused lines of credit.
The table below provides a breakdown of the Komax Group’s primary and derivative financial liabilities by maturity, based on the remaining maturity from the reporting date until the contractually agreed payment date. The table shows carrying amounts as the impact of discounting is negligible.
3.5 Interest rate riskNeither at 31 December 2012 nor at the previous year’s balance sheet date did the Komax Group possess any assets that were subject to any material rate of interest.
The Group’s financial risk policy is to finance long-term investments with long-term liabilities, which gives rise to an interest rate risk. If there is a significant interest rate risk, the related cash flow risks are hedged through interest rate swaps. With respect to the syndicated loan, which as at 31 December 2012 had been utilized to the amount of CHF 54.6 million (31 December 2011: CHF 44.0 million), an interest rate swap with a notional principal amount of CHF 20.0 million was concluded for the entire contract period of around five years which fixes the LIBOR rate at a level of 0.4875% p.a. Furthermore, the interest margin is dependent on the level of indebtedness of the Group. As lending amounts are in each case drawn on in tranches with a term of one to six months, the Komax Group is only subject to short-term fluctuations in LIBOR. The overall risk with respect to changes in the market rate of interest is low. Moreover, there was a net cash position of CHF 0.9 million as at 31 December 2012 (31 December 2011: net cash of CHF 5.6 million). For these reasons, no sensitivity analysis of interest rate risk was undertaken.
3.6 Determination of fair valueThe fair value of financial assets that are traded on an active market is calculated as the number of securities held, multiplied by the closing price on the reporting date.
The fair value of financial assets that are not traded on an active market is determined with the aid of a var iety of valuation methods.
in TCHF 0–30 days 31–60 days 61–90 days 91–120 days 121 days−1 year
1–5 years Total
31.12.2012
Financial liabilities (current and non-current)1) 0 0 0 0 0 56 765 56 765
Trade payables 10 236 2 409 1 007 449 234 0 14 335
Other payables 3 669 580 582 544 1 320 0 6 695
Derivative financial instruments 0 8 0 0 68 340 416
31.12.2011
Financial liabilities (current and non-current)1) 0 0 0 0 0 46 571 46 571
Trade payables 16 163 2 658 1 922 43 26 0 20 812
Other payables 4 342 882 1 072 947 103 0 7 346
Derivative financial instruments 0 19 0 0 168 56 243
1) The cash outflow from future interest payments amounts to CHF 1.417 million for outstanding financial liabilities as at 31 December 2012 and CHF 0.777 million for outstanding financial liabilities as at 31 December 2011.
72

4 Key recognition and measurement assumptions4.1 Key assumptions and sources of uncertainty in relation to estimatesPreparation of the consolidated financial statements in conformity with IFRS requires the Board of Directors and Group Management to make estimates and assumptions, whereby such estimates and assumptions have an effect on the accounting principles applied and are reflected in the amounts stated under assets, liabilities, income, and expenses. Their estimates and assumptions are based on past experience and on various other factors deemed applicable in the current situation. These form the basis for reporting those assets and liabilities that cannot be measured directly from other sources. The actual values may differ from these estimates.
Estimates and assumptions are reviewed at least on a quarterly basis. Changes in estimates are required when the circumstances on which the estimates are based have altered, or when new or additional informa-tion is available. These changes are recognized in the reporting period in which the estimate was adjusted.
The most important assumptions about future developments and most important sources of uncertainty in relation to estimates that could necessitate significant adjustments to reported assets and liabilities over the coming 12 months are shown below.
4.2 Recognition of revenue according to POC methodAutomated assembly and production contracts are measured according to the POC method, provided the assessment meets the requirements of IAS 11. Although projects are assessed monthly and in good faith in accordance with comprehensive project management guidelines, subsequent corrections may be required. These corrections are made in the following period and may have a positive or negative impact on revenue in this period.
4.3 Impairment of non-current assetsProperty, plant and equipment, goodwill, and intangible assets are tested for impairment at least twice each year. To determine whether impairment exists, estimates are made of the expected future cash flows arising from use. Actual cash flows may differ from the discounted future cash flows based on these estimates. Factors such as changes in the planned use of property, plant and equipment, restructuring, reorganization, and closure of facilities, changes in the market situation, technical deficiencies in relation to machinery and systems, or sub-projected sales of machines, spare parts, and systems, may shorten useful life or result in an impairment.
4.4 Employee benefitsEmployees of the Group in Switzerland are insured under defined benefit retirement schemes in conformity with IAS 19. Calculations of the reported credits and liabilities in relation to these schemes are based on dynamic actuarial calculations as well as the expected return on the assets of the retirement plans. The present value of the liabilities relating to the defined benefit schemes is particularly dependent on assump-tions such as the discount rate used to calculate the present value of future pension liabilities, future rises in salary, and increases in other compensation paid to employees. The Group’s independent actuaries addi-tionally use statistical data such as the likelihood of departure and mortality rate of insured individuals. The actuaries’ assumptions may differ substantially from actual events due to changes in market conditions and the economic environment, higher or lower rates of departure, longer or shorter life expectancy of insured individuals, as well as other estimated factors. These differences may have an influence on the assets and liabilities stated in relation to employee benefits in future reporting periods.
Financial Report 48 Consolidated Financial Statements 97 Financial Statements of Komax Holding AG 106 Corporate Structure
73

4.5 ProvisionsIn relation to machines and systems already delivered, Komax calculates the necessary warranty provisions on the balance sheet date on the basis of analysis and estimates in conformity with IAS 37. The actual costs may differ from the provisions stated. Any differences may affect the provision carried for warranty events in future reporting periods and therefore the reported result for the period.
4.6 Current and deferred income taxesIn determining the assets and liabilities from current and deferred income taxes, estimates must be made on the basis of existing tax laws and ordinances. Numerous internal and external factors may have favour-able and unfavourable effects on the assets and liabilities from income taxes. These factors include changes in tax laws and ordinances, as well as the way they are interpreted, in addition to changes in tax rates and the total amount of taxable income for the particular location. Any changes may affect the assets and liabil-ities from current and deferred income taxes carried in future reporting periods.
5 Cash and cash equivalentsThe cash and cash equivalents amounting to CHF 57.7 million (2011: CHF 52.1 million) include demand deposits and call money. The composition of the call money and the applicable interest rates can be found in the table below.
Currency Interest rate31.12.2012
TCHF Interest rate31.12.2011
TCHF
EUR 1.200% 29 1.200% 65
EUR 0.000% 0 0.700% 1 169
INR 7.000% 69 0.000% 0
JPY 0.020% 13 0.000% 0
SGD 0.063% 112 0.050% 108
Total 223 1 342
6 Securities
in TCHF 31.12.2012 31.12.2011
Shares 48 33
Total 48 33
The Komax Group uses forex forward and option contracts as well as interest rate and currency swaps to hedge currency and interest rate risks on cash and cash equivalents. As at 31 December 2012, an interest rate swap with a notional principal amount of CHF 20.0 million and a negative fair value of CHF 0.35 million (31 December 2011: CHF 20.0 milion with a negative fair value of CHF 0.31 million) was outstanding.
The following volumes were transacted in the corresponding financial year:
2012: EUR none, USD 4.1 million2011: EUR 0.8 million, USD 12.8 million
Negative fair values are included in the “Other payables and accrued expenses / deferred income” item, positive fair values under “Other receivables and accrued income / prepaid expenses”.
74
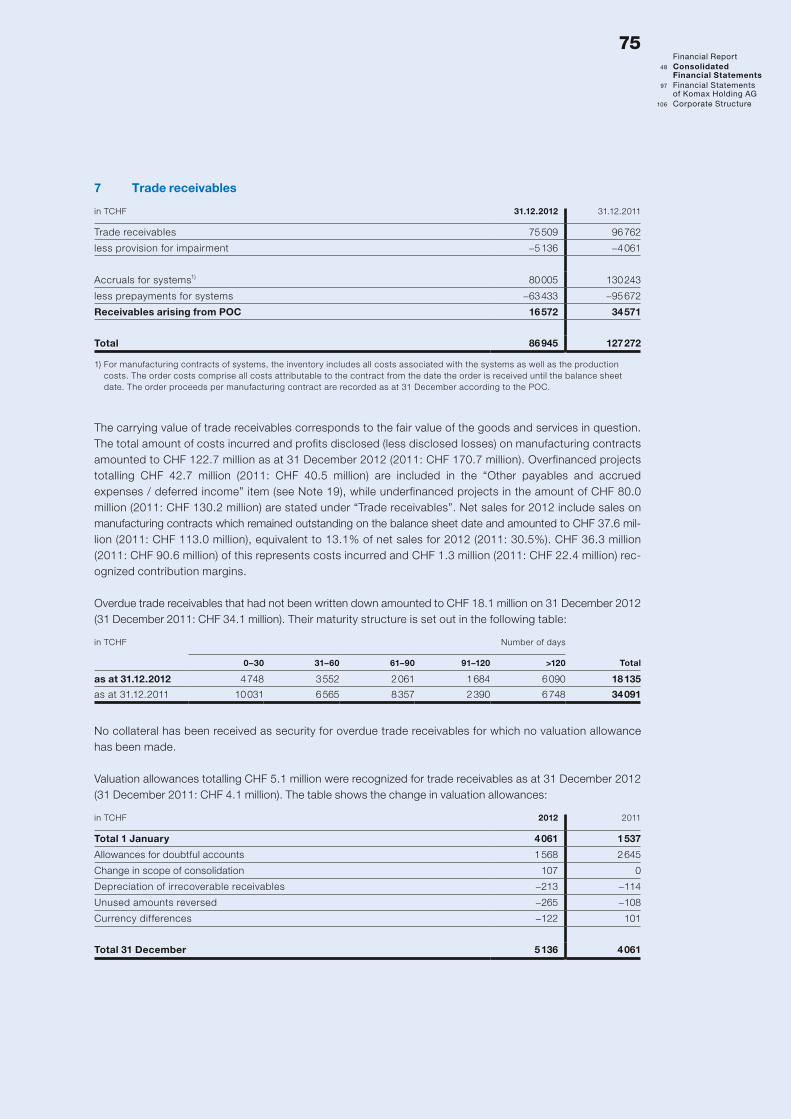
7 Trade receivables
in TCHF 31.12.2012 31.12.2011
Trade receivables 75 509 96 762
less provision for impairment −5 136 −4 061
Accruals for systems1) 80 005 130 243
less prepayments for systems −63 433 −95 672
Receivables arising from POC 16 572 34 571
Total 86 945 127 272
1) For manufacturing contracts of systems, the inventory includes all costs associated with the systems as well as the production costs. The order costs comprise all costs attributable to the contract from the date the order is received until the balance sheet date. The order proceeds per manufacturing contract are recorded as at 31 December according to the POC.
The carrying value of trade receivables corresponds to the fair value of the goods and services in question. The total amount of costs incurred and profits disclosed (less disclosed losses) on manufacturing contracts amounted to CHF 122.7 million as at 31 December 2012 (2011: CHF 170.7 million). Overfinanced projects totalling CHF 42.7 million (2011: CHF 40.5 million) are included in the “Other payables and accrued expenses / deferred income” item (see Note 19), while underfinanced projects in the amount of CHF 80.0 million (2011: CHF 130.2 million) are stated under “Trade receivables”. Net sales for 2012 include sales on manufacturing contracts which remained outstanding on the balance sheet date and amounted to CHF 37.6 mil-lion (2011: CHF 113.0 million), equivalent to 13.1% of net sales for 2012 (2011: 30.5%). CHF 36.3 million (2011: CHF 90.6 million) of this represents costs incurred and CHF 1.3 million (2011: CHF 22.4 million) rec-ognized contribution margins.
Overdue trade receivables that had not been written down amounted to CHF 18.1 million on 31 December 2012 (31 December 2011: CHF 34.1 million). Their maturity structure is set out in the following table:
in TCHF Number of days
0–30 31–60 61–90 91–120 >120 Total
as at 31.12.2012 4 748 3 552 2 061 1 684 6 090 18 135
as at 31.12.2011 10 031 6 565 8 357 2 390 6 748 34 091
No collateral has been received as security for overdue trade receivables for which no valuation allowance has been made.
Valuation allowances totalling CHF 5.1 million were recognized for trade receivables as at 31 December 2012 (31 December 2011: CHF 4.1 million). The table shows the change in valuation allowances:
in TCHF 2012 2011
Total 1 January 4 061 1 537
Allowances for doubtful accounts 1 568 2 645
Change in scope of consolidation 107 0
Depreciation of irrecoverable receivables −213 −114
Unused amounts reversed −265 −108
Currency differences −122 101
Total 31 December 5 136 4 061
Financial Report 48 Consolidated Financial Statements 97 Financial Statements of Komax Holding AG 106 Corporate Structure
75

Trade receivables are classified into the three main currencies used by the Group, with a fourth group for all other currencies.
in TCHF 31.12.2012 31.12.2011
CHF 26 184 34 102
EUR 11 702 12 140
USD 23 313 33 754
Other currencies 14 310 16 766
Total trade receivables (gross) 75 509 96 762
8 Other receivables and accrued income / prepaid expenses
in TCHF 31.12.2012 31.12.2011
Other receivables 9 164 6 850
Prepayments to suppliers 1 714 2 971
Accruals 3 910 4 101
Total 14 788 13 922
Other receivables mainly comprise tax credits due from state authorities (tax authorities). The accruals in-clude amongst others prepayments for insurance benefits and credits for maintenance and servicing work not yet carried out.
9 Inventories
in TCHF 31.12.2012 31.12.2011
Manufacturing components and spare parts 30 629 24 332
Semi-finished goods / work in process 3 614 8 433
Finished goods 23 964 22 860
Total 58 207 55 625
The inventories are not pledged to third parties.
The change in write-downs of inventories is as follows:
in TCHF 2012 2011
Total 1 January 9 903 7 428
Write-downs charged to income statement 4 714 5 813
Change in scope of consolidation 561 0
Used to write off obsolete inventories −1 931 −2 247
Unused amounts reversed −790 −1 013
Currency differences −186 −78
Total 31 December 12 271 9 903
The expenditure recognized in the income statement in connection with the value adjustments of inven-tories amounts to CHF 3.9 million (2011: CHF 4.8 million).
76

10 Non-current assets held for saleThe non-current asset held for sale with a carrying value of CHF 0.7 million as at 31 December 2012 (2011: CHF 0) is a building in Rousset (France) which is no longer used for its original purpose. The search for a buyer was commenced in 2012, and the sale of this building is expected within the next 12 months. As at 31 December 2012, there were no liabilities in connection with the building earmarked for sale.
11 Deferred taxes11.1 Statement of carrying values
in TCHF 31.12.2012 31.12.2011
Property, plant and equipment / intangible assets 1 470 620
Trade receivables and inventories1) 5 262 4 877
Provisions 1 320 647
Tax-loss carryforwards 7 614 1 359
Tax credits 2 176 2 300
Other items 859 924
Total deferred tax assets (gross) 18 701 10 727
Offset against deferred tax liabilities −4 202 −3 853
Balance sheet deferred tax assets 14 499 6 874
Property, plant and equipment / intangible assets 5 288 4 605
Trade receivables and inventories 1 897 2 128
Provisions 634 659
Other items 501 443
Total deferred tax liabilities (gross) 8 320 7 835
Offset against deferred tax assets −4 202 −3 853
Balance sheet deferred tax liabilities 4 118 3 982
Net deferred tax assets (+) / tax liabilities (–) 10 381 2 892
1) Including unrealized intragroup profits.
11.2 Statement of changes
in TCHF 2012 2011
Net total as at 1 January 2 892 −715
Deferred tax income (+) / tax expense (–) 5 719 3 513
Change in scope of consolidation 2 206 0
Currency translation differences −436 94
Net total as at 31 December 10 381 2 892
Financial Report 48 Consolidated Financial Statements 97 Financial Statements of Komax Holding AG 106 Corporate Structure
77

The total of the temporary differences relating to investments in affiliated companies for which no deferred taxes have been reported came to CHF 35.2 million as at 31 December 2012 (2011: CHF 18.3 million). All changes in deferred taxes are included in the income statement for the corresponding periods. As at 31 December 2012, deferred tax assets of CHF 4.9 million (2011: CHF 3.0 million) in connection with tax-loss carryforwards of CHF 16.6 million (2011: CHF 9.3 million) were not capitalized. Thereof CHF 5.9 million will expire between 1–5 years and CHF 10.7 million in more than 5 years.
12 Other non-current receivables
in TCHF 31.12.2012 31.12.2011
Present value of minimum lease payments 178 54
Rent deposit and other non-current receivables 181 107
Total 359 161
Komax has lease agreements with various customers for the financing of machine purchases. The leasing period is normally between 36 and 60 months. The agreements are subject to termination, with the lessee being required to bear the cost of termination. All agreements envisage the purchase of the leased asset at the end of the term, either as a fixed agreement or in the form of a purchase option. It is the duty of the les-see to ensure that the leased asset is properly insured. Non-current receivables from financing leases are recognized in the “Other non-current receivables” item, current receivables from financing leases in the “Trade receivables” item. Details can be found in the table below:
in TCHF 31.12.2012 31.12.2011
Gross investment in the lease 360 180
less unguaranteed residual value in favour of lessor −17 0
less unearned finance income −43 −18
Present value of minimum lease payments 300 162
in TCHF 31.12.2012
0–1 year 1–5 years Total
Gross investment in the lease 143 217 360
Present value of minimum lease payments 122 178 300
in TCHF 31.12.2011
0–1 year 1–5 years Total
Gross investment in the lease 124 56 180
Present value of minimum lease payments 108 54 162
As at 31 December 2012, just as on the previous year’s balance sheet date, no value adjustments needed to be recognized for irrecoverable minimum lease payments.
78

13 Employee benefits (IAS 19)
in TCHF 2012 2011
Current service cost 7 401 8 363
Interest cost 3 079 3 026
Amortization of service cost not yet recorded 269 269
Total employee benefits expenditure of the Komax Group 10 749 11 658
Expected return on plan assets 3 766 3 886
Employee contributions 2 584 2 573
Total employee benefits income of the Komax Group 6 350 6 459
Employee benefits result of the Komax Group1) −4 399 −5 199
Employer contributions 4 449 4 355
Prepayments to the employee benefits plan during the financial year 50 −844
1) The employee benefits expenditure of CHF 4.399 million (2011: CHF 5.199 million) is recognized in the income statement under personnel expenses.
Komax maintains retirement benefit plans for its employees in Switzerland and abroad. In conformity with IFRS, the retirement benefit plans in Switzerland are defined benefit schemes. For the principal defined benefit pension schemes, the net expenditure for employee benefits is shown above. Benefits in accord-ance with IAS 19 are recognized in the balance sheet of the Komax Group under “Prepaid pension assets” and in the consolidated income statement under “Personnel expenses”.
The changes in prepayments recorded in the consolidated balance sheet with respect to the defined benefit schemes were as follows:
in TCHF 2012 2011
Total 1 January 969 1 812
Employee benefits costs of the Komax Group −4 399 −5 199
Employer contributions 4 449 4 355
Total 31 December 1 019 969
Defined benefit obligations developed as follows:
in TCHF 2012 2011
Total 1 January 111 974 110 032
Current service cost 7 401 8 363
Interest cost 3 079 3 026
Payments made to and by beneficiaries (net) −3 471 −6 348
Actuarial gains (–) / losses (+) 1 355 −3 099
Total 31 December 120 338 111 974
Financial Report 48 Consolidated Financial Statements 97 Financial Statements of Komax Holding AG 106 Corporate Structure
79

The present value of plan assets developed as follows:
in TCHF 2012 2011
Total 1 January 100 421 103 628
Expected return on plan assets 3 766 3 886
Employee contributions 2 584 2 573
Employer contributions 4 449 4 355
Payments made to and by beneficiaries (net) −3 471 −6 348
Actuarial gains (+) / losses (–) 4 068 −7 673
Total 31 December 111 817 100 421
Available assets break down as follows:
% 31.12.2012 31.12.2011
Assets held in shares 31.0 31.9
Assets held in bonds 23.4 25.1
Assets held in real estate 29.7 32.1
Other assets 15.9 10.9
Total 100.0 100.0
The available assets of the retirement benefit scheme of Komax AG do not include shares of Komax Holding AG or real estate properties used by the Group. The expected return on assets is based on the investment policy of the Board of Trustees. Expected returns on fixed-interest investments are based on the effective gross interest rates at the balance sheet date. Expected returns from equity securities reflect the effective returns empirically determined as obtainable in the long term on the respective markets.
The following table contains information concerning the current state of overfunding or underfunding of the retirement benefit schemes operated in Switzerland and the figures in the consolidated balance sheet:
in TCHF 31.12.2012 31.12.2011
Fair value of plan assets 111 817 100 421
Present value of funded obligations −120 338 −111 974
Overfunding (+) / underfunding (–) −8 521 −11 553
Unrecognized actuarial gains (–) / losses (+) 1 391 10 862
Unrecognized past service cost 8 149 1 660
Recognized as assets in the consolidated balance sheet 1 019 969
The return on plan assets in the 2012 reporting year was CHF 7.834 million (2011: CHF –3.787 million). Employer contributions for the 2013 business year are expected to amount to CHF 4.449 million.
80

The following table shows the degree of cover (funding) of defined benefit obligations, the effect of differ-ences in the expected and the effective return on plan assets, and the actuarial adjustments to benefit obli-gations in the past five years:
The retirement benefit liabilities are valued using assumptions based on the following economic and demo-graphic parameters (weighted average):
% 2012 2011
Discount rate 2.00 2.75
Estimated wage growth rate 1.00 1.00
Increase in current pensions (expectancy of future benefits) 0.00 0.00
Expected return on plan assets 3.75 3.75
Average life expectancy on reaching retirement at age 65 or 64, respectively:
Years 2012 2011
Men 18.9 18.9
Women 21.4 21.4
Defined-contribution retirement schemes
No costs for defined-contribution plans of foreign subsidiaries had to be recognized in the income statement under personnel expenses, neither in the 2012 business year nor in the previous year. The liabilities aris ing from these retirement benefit plans amounted to CHF 0.09 million as at 31 December 2012 (31 December 2011: CHF 0.11 million). They are recognized in the balance sheet under “Other payables and accrued ex-penses/deferred income”.
14 Investments in associatesAs at 31 December 2012 and 31 December 2011, Komax held a 30% stake in SLE quality engineering GmbH & Co. KG and a 30% stake in SLE quality engineering Verwaltungs GmbH. The investment value in the associated company is calculated via the equity method. The valuation of investments as at 31 December 2012 was based on the unaudited financial statements. Any changes in these statements will be taken into account in the following period. The investment value of CHF 2.0 million reported as at 31 December 2012 (previous year: CHF 2.1 million) is equivalent to the proportion of equity held. There are no contingent liabilities. The proportion of profit is negligible and included in the “Other operating expenses” under “Other expenditure”.
in TCHF 31.12.2012 31.12.2011 31.12.2010 31.12.2009 31.12.2008
Fair value of plan assets 111 817 100 421 103 628 102 123 95 266
Present value of funded obligations −120 338 −111 974 −110 032 −105 584 −105 297
Overfunding (+) / underfunding (–) −8 521 −11 553 −6 404 −3 461 −10 031
Difference between expected and effective return on plan assets 4 068 −7 673 388 5 206 −25 153
Actuarial adjustments to benefit obligations 1 587 4 552 2 341 3 335 −354
Financial Report 48 Consolidated Financial Statements 97 Financial Statements of Komax Holding AG 106 Corporate Structure
81

15 Property, plant and equipment15.1 Property, plant and equipment 2012
Changes in gross valuesin TCHFAsset category
Costs1.1.2012
Currency differences
Reclassifi-cations
Additions Change in scope of con-
solidation
Disposals Costs31.12.2012
Movables
Machinery 15 446 −179 0 3 489 1 094 −951 18 899
Tools / operating equipment 5 844 −33 0 449 56 −272 6 044
Warehouse equipment 1 764 −11 0 109 4 −4 1 862
Vehicles 2 428 −35 0 448 326 −295 2 872
Office furnishings 7 557 −58 14 238 134 −166 7 719
Information technology 4 628 −30 0 539 20 −159 4 998
Prepayments for movables 14 0 −14 260 0 0 260
Total movables 37 681 −346 0 5 532 1 634 −1 847 42 654
Real estate
Buildings1) 72 263 −350 −720 1 389 2 838 −581 74 839
Land 11 625 −57 0 0 862 0 12 430
Prepayments for real estate 0 0 0 54 0 0 54
Total real estate 83 888 −407 −720 1 443 3 700 −581 87 323
Total 121 569 −753 −720 6 975 5 334 −2 428 129 977
Changes in depreciationin TCHFAsset category
Accumulateddepreciation
1.1.2012
Currency differences
Reclassifi-cations
Accumulateddepreciationon disposals
Depreciation 2012
Accumulated depreciation
31.12.2012
Net value property, plant & equipment
31.12.2012
Movables
Machinery 8 973 −36 0 −828 1 445 9 554 9 345
Tools / operating equipment 3 532 −16 0 −192 450 3 774 2 270
Warehouse equipment 1 097 −5 0 −4 98 1 186 676
Vehicles 1 349 −16 0 −230 387 1 490 1 382
Office furnishings 3 933 −36 0 −164 663 4 396 3 323
Information technology 3 770 −21 0 −159 401 3 991 1 007
Prepayments for movables 0 0 0 0 0 0 260
Total movables 22 654 −130 0 −1 577 3 444 24 391 18 263
Real estate
Buildings1) 30 889 −93 −61 −505 2 362 32 592 42 247
Land 0 0 0 0 0 0 12 430
Prepayments for real estate 0 0 0 0 0 0 54
Total real estate 30 889 −93 −61 −505 2 362 32 592 54 731
Total 53 543 −223 −61 −2 082 5 806 56 983 72 994
1) The reclassifications include the building that was reclassified under “Non-current assets held for sale”.
No impairments had to be booked on property, plant and equipment during the 2012 reporting year. As at 31 December 2012, no contractual obligations were existing in respect of the acquisition of property, plant and equipment. Future liabilities arising from operating lease agreements amount to: due 2013: CHF 2.5 million; due 2014–2017: CHF 6.4 million.
82

Changes in gross valuesin TCHFAsset category
Costs1.1.2011
Currency differences
Reclassifi-cations
Additions Disposals Costs31.12.2011
Movables
Machinery 15 588 −13 205 1 743 −2 077 15 446
Tools / operating equipment 5 775 63 −2 1 261 −1 253 5 844
Warehouse equipment 1 956 −15 0 0 −177 1 764
Vehicles 2 145 −18 0 717 −416 2 428
Office furnishings 7 099 1 323 366 −232 7 557
Information technology 6 100 −15 0 374 −1 831 4 628
Prepayments for movables 526 0 −526 14 0 14
Total movables 39 189 3 0 4 475 −5 986 37 681
Real estate
Buildings1) 74 776 −97 46 793 −3 255 72 263
Land 11 656 −31 0 0 0 11 625
Prepayments for real estate 46 0 −46 0 0 0
Total real estate 86 478 −128 0 793 −3 255 83 888
Total 125 667 −125 0 5 268 −9 241 121 569
Changes in depreciationin TCHFAsset category
Accumulateddepreciation
1.1.2011
Currency differences
Reclassifi-cations
Accumulateddepreciationon disposals
Depreciation 2011
Accumulated depreciation
31.12.2011
Net value property, plant & equipment
31.12.2011
Movables
Machinery 9 749 −16 0 −2 004 1 244 8 973 6 473
Tools / operating equipment 3 832 −6 0 −863 569 3 532 2 312
Warehouse equipment 1 176 −4 0 −176 101 1 097 667
Vehicles 1 404 −9 0 −406 360 1 349 1 079
Office furnishings 3 501 −11 0 −223 666 3 933 3 624
Information technology 5 168 −17 0 −1 831 450 3 770 858
Prepayments for movables 0 0 0 0 0 0 14
Total movables 24 830 −63 0 −5 503 3 390 22 654 15 027
Real estate
Buildings1) 29 563 −40 0 −949 2 315 30 889 41 374
Land 0 0 0 0 0 0 11 625
Prepayments for real estate 0 0 0 0 0 0 0
Total real estate 29 563 −40 0 −949 2 315 30 889 52 999
Total 54 393 −103 0 −6 452 5 705 53 543 68 026
1) Restatement: adjustment of gross prior-year figures for disposals without impact on net values of buildings.
15.2 Property, plant and equipment 2011
No impairments had to be booked on property, plant and equipment during the 2011 reporting year. As at 31 December 2011, no contractual obligations were existing in respect of the acquisition of property, plant and equipment. Future liabilities arising from operating lease agreements amounted to: due 2012: CHF 2.5 million; due 2013–2016: CHF 6.8 million.
Financial Report 48 Consolidated Financial Statements 97 Financial Statements of Komax Holding AG 106 Corporate Structure
83

16 Intangible assets16.1 Intangible assets 2012
Changes in gross valuesin TCHFAsset category
Costs1.1.2012
Currency differences
Reclassifi-cations
Additions Change in scope of con-
solidation
Disposals Costs31.12.2012
Intangible assets
Software 11 488 −47 348 2 012 111 −338 13 574
Patents 4 147 −1 0 0 0 0 4 146
Goodwill 26 126 −248 0 0 4 684 0 30 562
Technology 4 523 0 0 0 12 828 0 17 351
Prepayments 348 0 −348 46 0 0 46
Total 46 632 −296 0 2 058 17 623 −338 65 679
Changes in depreciationin TCHFAsset category
Accumulateddepreciation
1.1.2012
Currency differences
Reclassifi-cations
Accumulateddepreciationon disposals
Depreciation 2012
Accumulated depreciation
31.12.2012
Net value intangible assets
31.12.2012
Intangible assets
Software 7 741 −30 0 −338 1 511 8 884 4 690
Patents 4 121 −1 0 0 10 4 130 16
Goodwill 0 0 0 0 0 0 30 562
Technology 431 0 0 0 1 245 1 676 15 675
Prepayments 0 0 0 0 0 0 46
Total 12 293 −31 0 −338 2 766 14 690 50 989
Goodwill impairment testGoodwill acquired through previous acquisitions is allocated to the cash generating units at operating seg-ment level. The allocation is determined by the strategic intention behind the acquisition of each entity.
Cash-Generating Unit (CGU)in TCHF
Segment 31.12.2012 31.12.2011
Wire Wire 14 942 10 330
Solar Solar 3 661 3 765
Medtech (MTS) Medtech 10 005 10 076
Inkjet (INJ) Medtech 1 954 1 955
Total 30 562 26 126
The recoverable amount of a CGU is obtained from the calculation of its value in use. These calculations are based on projected cash flows derived from the five-year plan issued by the Board of Directors. Assump-tions for the calculation of value in use were as follows:
2012 Wire Solar MTS INJ
Gross profit margin 59.6% 42.1% 50.6% 31.2%
Average growth rate 8.2% 61.2% 14.2% 4.2%
Discount rate (pre-tax) 6.2% 6.5% 5.7% 6.2%
84
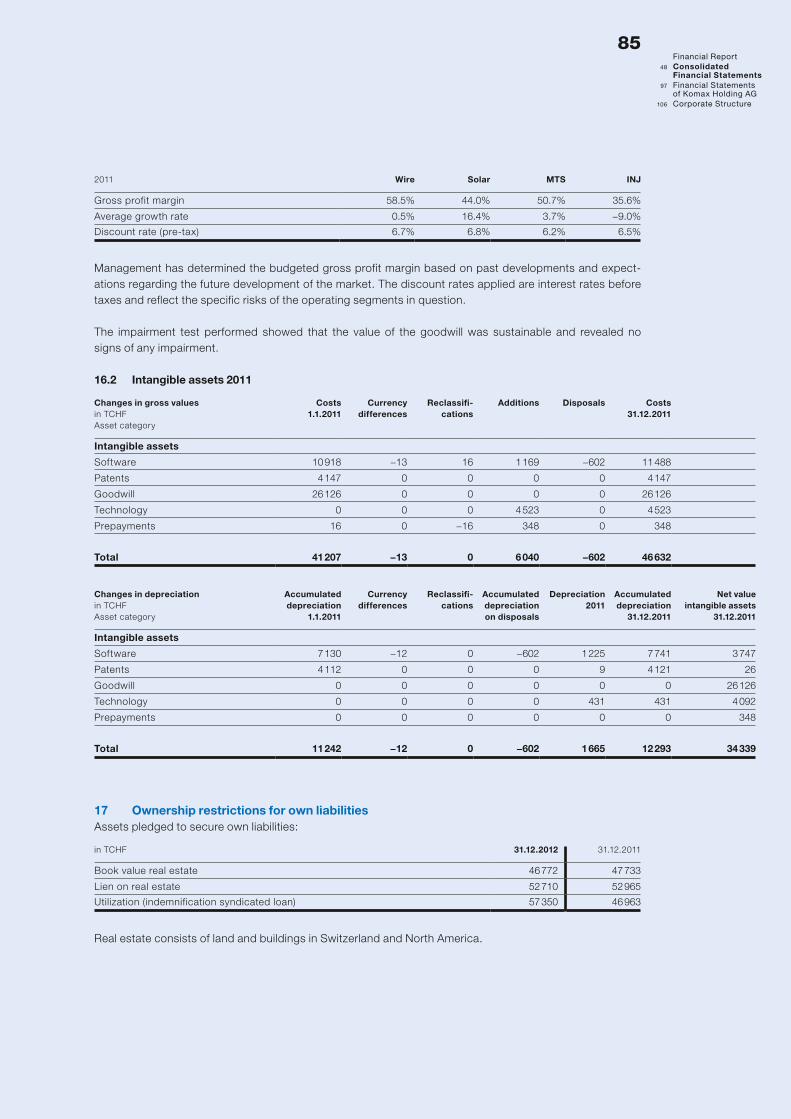
2011 Wire Solar MTS INJ
Gross profit margin 58.5% 44.0% 50.7% 35.6%
Average growth rate 0.5% 16.4% 3.7% −9.0%
Discount rate (pre-tax) 6.7% 6.8% 6.2% 6.5%
Management has determined the budgeted gross profit margin based on past developments and expect-ations regarding the future development of the market. The discount rates applied are interest rates before taxes and reflect the specific risks of the operating segments in question.
The impairment test performed showed that the value of the goodwill was sustainable and revealed no signs of any impairment.
16.2 Intangible assets 2011
17 Ownership restrictions for own liabilitiesAssets pledged to secure own liabilities:
in TCHF 31.12.2012 31.12.2011
Book value real estate 46 772 47 733
Lien on real estate 52 710 52 965
Utilization (indemnification syndicated loan) 57 350 46 963
Real estate consists of land and buildings in Switzerland and North America.
Changes in gross valuesin TCHFAsset category
Costs1.1.2011
Currency differences
Reclassifi-cations
Additions Disposals Costs31.12.2011
Intangible assets
Software 10 918 −13 16 1 169 −602 11 488
Patents 4 147 0 0 0 0 4 147
Goodwill 26 126 0 0 0 0 26 126
Technology 0 0 0 4 523 0 4 523
Prepayments 16 0 −16 348 0 348
Total 41 207 −13 0 6 040 −602 46 632
Changes in depreciationin TCHFAsset category
Accumulateddepreciation
1.1.2011
Currency differences
Reclassifi-cations
Accumulateddepreciationon disposals
Depreciation 2011
Accumulated depreciation
31.12.2011
Net value intangible assets
31.12.2011
Intangible assets
Software 7 130 −12 0 −602 1 225 7 741 3 747
Patents 4 112 0 0 0 9 4 121 26
Goodwill 0 0 0 0 0 0 26 126
Technology 0 0 0 0 431 431 4 092
Prepayments 0 0 0 0 0 0 348
Total 11 242 −12 0 −602 1 665 12 293 34 339
Financial Report 48 Consolidated Financial Statements 97 Financial Statements of Komax Holding AG 106 Corporate Structure
85

18 Trade payablesThe carrying amounts of trade payables are allocated to the currencies shown in the table. The carrying amounts reflect their fair value.
in TCHF 31.12.2012 31.12.2011
CHF 7 335 8 735
EUR 2 840 4 222
USD 2 069 4 209
Other currencies 2 091 3 646
Total trade payables 14 335 20 812
19 Other payables and accrued expenses / deferred income
in TCHF 31.12.2012 31.12.2011
Other payables 6 695 7 346
Liabilities related to defined contribution plans 300 265
Prepayments by customers 1 624 2 211
Accrual for personnel expenses 8 344 8 607
Commission payments to representatives 1 455 1 909
Invoices not yet received 813 1 741
Other accruals 2 658 2 654
Accrued expenses / deferred income 14 894 17 122
Prepayments on systems1) 48 299 49 406
less accruals/deferrals in respect of systems −42 707 −40 479
Liabilities arising from POC 5 592 8 927
Total 27 481 33 660
1) See also Note 7.
Other payables mainly comprise amounts due to state authorities (tax authorities). Their carrying amounts are allocated to the currencies shown in the table:
in TCHF 31.12.2012 31.12.2011
CHF 4 857 4 776
EUR 388 421
USD 49 127
Other currencies 1 401 2 022
Total other payables 6 695 7 346
86

20 Provisions
in TCHF 2012 2011Warranty provisions
Total 1 January 3 280 3 430
Additional provisions 4 446 2 490
Change in scope of consolidation 259 0
Amounts utilized during the year −3 057 −2 304
Unused amounts reversed −216 −327
Currency differences −66 −9
Total 31 December 4 646 3 280
Warranty provisions include material and personnel costs in relation to warranty work. Provisions for war-ranty are reviewed and adjusted annually.
in TCHF 2012 2011Other provisions
Total 1 January 0 0
Additional provisions 1 464 0
Amounts utilized during the year 0 0
Unused amounts reversed 0 0
Currency differences 0 0
Total 31 December 1 464 0
As at 31 December 2012, the other provisions include the provision for restructuring charges.
21 Financial loans
Currency2012
Interest rate31.12.2012
in TCHF2011
Interest rate31.12.2011
in TCHF
Credit Suisse, Zurich1) CHF 1.30% 20 000 2.06% 20 000
Credit Suisse, Zurich1) 2) CHF 0.80% 19 415 0.89% 18 606
Credit Suisse, Zurich1) CHF 0.00% 0 0.88% 5 000
Credit Suisse, Zurich1) EUR 1.43% 14 640 0.00% 0
M&T Bank, York (PA) USD 3.75% 2 710 3.75% 2 965
Total 56 765 46 571
1) Utilized credit facilities as part of the CHF 120.0 million syndicated loan agreement under the stewardship of Credit Suisse (participating banks: Basler Kantonalbank, Credit Suisse, Deutsche Bank, Luzerner Kantonalbank, UBS, and Zürcher Kantonalbank).
2) Utilized credit line amounting to CHF 20.0 million as at 31 December 2012 (31 December 2011: CHF 19.0 million) less transaction costs of CHF 0.6 million (31 December 2011: CHF 0.4 million).
As at 31 December 2012, the Komax Group had unutilized credit lines of CHF 60.9 million (31 December 2011: CHF 56.5 million). The average interest on financial loans was 1.29% in 2012, compared with 2.08% in the previous year. The fair value of non-current financial loans corresponds to their carrying value.
22 Share capitalAs at 31 December 2012, the share capital amounted to CHF 344 379. This comprised 3 443 789 fully paid-up registered shares, each with a par value of CHF 0.10. As a result of the exercising of option rights, the share capital increased by CHF 4 291 in relation to 2011 (2011: no increase).
As at 31 December 2012, the Group held 27 483 treasury shares (2011: 27 483 treasury shares).
Financial Report 48 Consolidated Financial Statements 97 Financial Statements of Komax Holding AG 106 Corporate Structure
87

23 Segment reporting23.1 Information by segment
2012in TCHF
Wire Solar Medtech Corporate1) Group
Net sales from external customers 227 088 9 873 49 722 42 286 725
Net sales from other segments 1 167 0 82 −1 249 0
Total net sales 228 255 9 873 49 804 −1 207 286 725
EBIT 52 729 −21 171 −8 600 −8 606 14 352
Investment in non-current assets 5 994 2 493 546 0 9 033
Sale of non-current assets 120 6 6 0 132
Depreciation 6 033 1 421 1 084 34 8 572
2011in TCHF
Wire Solar Medtech Corporate1) Group
Net sales from external customers 216 482 70 343 82 914 290 370 029
Net sales from other segments 1 310 448 864 −2 622 0
Total net sales 217 792 70 791 83 778 −2 332 370 029
EBIT 57 073 −3 439 3 840 −9 938 47 536
Investment in non-current assets 5 517 5 139 591 2 289 13 536
Sale of non-current assets 2 979 1 440 0 3 420
Depreciation 4 454 1 388 1 483 45 7 370
1) Including elimination of intersegment revenues.
Costs allocated to Corporate include expenses arising in conjunction with the Komax Group’s option plan, expenses and income arising from bookings for defined benefit pension schemes according to IAS 19, the salaries of Group management, compensation for the Board of Directors, as well as the costs of Komax Holding AG.
The table shows the reconciliation of the total of the reportable segments’ EBIT to the Group profit after taxes:
in TCHF 2012 2011
EBIT 14 352 47 536
Financial income 4 554 7 418
Financial expenses −7 955 −8 861
Group profit before taxes 10 951 46 093
Taxes 905 6 813
Group profit after taxes 10 046 39 280
88

Net sales from external customers were generated in the following five operating segments:
in TCHF 2012 2011
Wire1) 227 130 216 772
Solar 9 873 70 343
Medtech (MTS) 35 985 54 680
Inkjet (INJ) 13 028 22 468
Mechanical and Electronic Systems Assembly (MES/EES) 709 5 766
Total 286 725 370 029
1) Including Corporate sales.
23.2 Information by geographical area
Net sales by location of purchasing party
2012in TCHF %
2011in TCHF %
+/−%
Switzerland 5 624 2.0 16 267 4.4 −65.4
Europe1) 141 736 49.4 172 653 46.6 −17.9
North and South America 81 626 28.5 74 583 20.2 9.4
Asia/Pacific 57 739 20.1 106 526 28.8 −45.8
Total 286 725 100.0 370 029 100.0 −22.5
Net sales by location of service provider
2012in TCHF %
2011in TCHF %
+/−%
Switzerland 115 941 40.4 159 847 43.2 −27.5
Europe1) 48 390 16.9 45 045 12.2 7.4
North and South America 73 723 25.7 110 691 29.9 −33.4
Asia/Pacific 48 671 17.0 54 446 14.7 −10.6
Total 286 725 100.0 370 029 100.0 −22.5
Non-current assets by location of service provider2)
2012in TCHF %
2011in TCHF %
+/−%
Switzerland 97 239 77.0 80 971 77.4 20.1
Europe1) 6 683 5.3 3 918 3.7 70.6
North and South America 18 996 15.0 17 018 16.3 11.6
Asia/Pacific 3 451 2.7 2 704 2.6 27.6
Total 126 369 100.0 104 611 100.0 20.8
1) Including Africa.
2) Without deferred tax assets and prepaid pension assets.
Domiciled in Switzerland, the Komax Group is active in three other geographical areas where it is repre-sented with its own companies. The commercial revenues of the Group are predominantly generated in Europe, North and South America, and the Asia/Pacific region. Net sales are assigned on the basis of the country in which the customer is based (location of purchasing party). In addition, reporting is also under-taken on the basis of the country in which the sales company has its headquarters (location of service pro-vider). Assets are listed as per the headquarters of the company to which they belong. The Europe region also includes the sales generated and assets located in Africa (particularly South Africa, Tunisia, and Morocco).
23.3 Significant customersNeither in the 2012 reporting year nor in the previous year did the Komax Group generate sales amounting to 10% or more of Group revenues with any individual customer.
Financial Report 48 Consolidated Financial Statements 97 Financial Statements of Komax Holding AG 106 Corporate Structure
89

24 Other operating income
in TCHF 2012 2011
Own work capitalized 1 277 479
Government grants 150 285
Gains from the disposal of property, plant and equipment 64 631
Total other operating income 1 491 1 395
25 Information on personnel25.1 Personnel expenses
in TCHF 2012 2011
Wages and salaries 82 317 82 442
Share-based payments 1 700 1 730
Social security and pension contributions 16 231 16 857
Other personnel costs (training and development) 2 642 2 603
Total personnel expenses 102 890 103 632
Personnel expenses include all performance-related compensation for the past business year. Further details on employee benefits are given in Note 13.
25.2 Share option plan of the Komax GroupThe executive share ownership scheme for directors and management of the Komax Group includes a share option plan. The option plan was introduced in 1998 and is designed to give executives and selected employees added interest in shareholder value and enable them to share in the company’s success. The stock option plan takes the form of share-based compensation settled in equity instruments by means of a capital increase (equity-settled plan). The number of options allocated depends on the individual perform-ance of the entitled employee. The options granted entitle holders to subscribe one Komax Holding AG share per option and are valid for five years. They have a predetermined exercise price and are subject to a three-year lock-in period.
2012
No.
Weighted average exercise price
CHF
2011
No.
Weighted average exercise price
CHF
Outstanding at beginning of year 327 328 89.70 315 749 100.38
Granted 87 525 66.21 88 525 94.25
Exercised −42 909 42.78 0 0.00
Forfeited −9 433 85.63 −3 423 70.57
Expired −80 304 145.06 −73 523 141.94
Outstanding at end of year 282 207 73.93 327 328 89.70
Of the 282 207 outstanding options (2011: 327 328), 36 832 were exercisable as at 31 December 2012 (2011: 80 304). Options exercised in 2012 led to the issue of 42 909 shares (2011: none) at a price of CHF 42.78 per share. The weighted average share price at the time of exercising was CHF 86.04.
90

The following table summarizes information on options granted and not yet exercised as at 31 December 2012:
Expiry date31 December Number
Exercise priceCHF
2013 36 832 42.78
2014 77 425 75.68
2015 82 342 94.25
2016 85 608 66.21
Total 282 207
The fair value of the options granted in the 2012 financial year – as determined by the Enhanced American Model, an approach based on the binomial model concept – amounted to CHF 16.28 (2011: CHF 30.16). The key parameters for the valuation model are the share price of CHF 68.75 (2011: CHF 102.00) on the day granted, the exercise price listed above, the standard deviation for the expected share price return of 46.6% (2011: 45.8%), the option term of five years, and the risk-free interest rate of 0.32% (2011: 1.04%). The anticipated dividend yield is 5.54% (2011: 3.23%). The volatility of 46.6% used in these calculations represents an arithmetic average of the historical volatility of Komax Holding AG for the last four years and that of a representative peer group.
25.3 Breakdown of employees by country and areas of activity
2012 CH1) Europe2) Americas3) Asia4) Africa5) Total
Production 230 91 71 102 23 517
Research and development 102 20 8 10 0 140
Engineering 73 42 50 31 3 199
Marketing and sales 109 64 74 76 16 339
Administration6) 49 23 25 33 5 135
Total headcount at 31 December 2012 563 240 228 252 47 1 330
2011 CH1) Europe2) Americas3) Asia4) Africa5) Total
Production 245 6 121 110 0 482
Research and development 102 10 13 9 0 134
Engineering 81 0 46 22 0 149
Marketing and sales 96 42 61 63 11 273
Administration6) 45 7 25 24 1 102
Total headcount at 31 December 2011 569 65 266 228 12 1 140
1) Komax AG, Dierikon (including operating facility in Rotkreuz), Komax Systems LCF SA, La Chaux-de-Fonds. 2) Komax companies in Europe: Germany, France, Portugal, Turkey. 3) Komax companies in North and South America: USA, Brazil. 4) Komax companies in Asia: Singapore, China, Malaysia, India, Japan. 5) Komax companies in Africa: Morocco, South Africa, Tunisia. 6) Including management/IT.
25.4 Average number of employeesThe average number of employees in 2012 was 1 170 compared with 1 081 in the previous year.
26 Development expenditureThe aggregate development expenditure for new and further development of Komax products contains personnel expenses, material costs, and costs for third-party development contracts. They amount to CHF 24.6 million, equivalent to 8.5% of revenues, compared with CHF 23.5 million or 6.3% of revenues in the previous year.
Financial Report 48 Consolidated Financial Statements 97 Financial Statements of Komax Holding AG 106 Corporate Structure
91

27 Other operating expensesOther operating expenses amount to CHF 19.5 million (2011: CHF 21.1 million) and comprise the following positions:
in TCHF 2012 2011
Expenditure on operating equipment and energy 4 545 4 611
Third-party services for development expenses 3 905 3 170
Legal and consultancy expenses 3 122 3 419
Expenditure on administration and sales 2 147 2 121
Other expenditure 5 827 7 803
Total other operating expenses 19 546 21 124
28 Extraordinary restructuring chargesThe extraordinary charges of CHF 1.7 million (2011: none) comprise additional personnel expenses arising from the release of staff necessitated by the poor market situation. Furthermore, these also include the costs resulting from social plans drawn up for the staff in question.
29 Financial result
in TCHF 2012 2011
Financial income
Interest income 480 211
Income from securities 145 45
Exchange rate gains on foreign currencies 3 929 7 162
Total financial income 4 554 7 418
Financial expenses
Interest expenses 1 808 1 712
Securities expenses 171 25
Exchange rate losses on foreign currencies 5 976 7 124
Total financial expenses 7 955 8 861
Total financial result −3 401 −1 443
The financial income includes gains of CHF 0.01 million (2011: CHF 0.10 million) on financial assets held for trading. Exchange rate losses amounting to CHF –0.07 million (2011: CHF –0.23 million) resulting from finan-cial liabilities held for trading are taken into account in the financial expenses. The positions include both book gains and losses and realized gains and losses.
92

30 Taxes
in TCHF 2012 2011
Current income taxes 6 624 10 326
Deferred tax income (–) / tax expenses (+) −5 719 −3 513
Total 905 6 813
Analysis of the tax rate
in TCHF 2012 % 2011 %
Group profit before taxes 10 951 46 093
Expected tax expenses 270 2.5 8 716 18.9
Impact of non-capitalized tax-loss carryforwards 380 3.5 777 1.7
Effect of changes in tax rate 161 1.5 −47 −0.1
Tax credits/charges from previous years −41 −0.4 −3 268 −7.1
Effect of non-deductible expenses 293 2.7 82 0.2
Effect of non-taxable income −320 −2.9 −84 −0.2
Non-reclaimable withholding taxes 205 1.9 752 1.6
Others −43 −0.5 −115 −0.2
Effective tax expenses 905 8.3 6 813 14.8
As the Group is internationally active, its income taxes are dependent on a number of different tax juris-dictions. The expected average Group tax rate is equivalent to the weighted average of tax rates of those countries in which the Group is active. Due to the composition of the taxable income of the Group, as well as changes in local tax rates, this Group tax rate varies from year to year.
31 Earnings per share (EPS)
in CHF 2012 2011
Group profit (attributable to equity holders of the parent company) 10 176 293 39 412 969
Weighted average number of outstanding shares 3 404 850 3 375 217
Basic earnings per share 2.99 11.68
Group profit (attributable to equity holders of the parent company) 10 176 293 39 412 969
Weighted average number of outstanding shares 3 404 850 3 375 217
Adjustment for dilutive effect of share options 29 360 56 670
Weighted average number of outstanding shares for calculating diluted earnings per share 3 434 210 3 431 887
Diluted earnings per share 2.96 11.48
Basic earnings per share are calculated by dividing the consolidated net earnings by the average number of shares outstanding during the fiscal year, excluding treasury shares. Diluted earnings per share are calcu-lated by adding all option rights which would have had a dilutive effect to the average number of shares out-standing.
32 Contingent liabilitiesGuarantees in favour of subsidiaries amounting to CHF 7.9 million (2011: CHF 3.3 million) are listed in the notes to the financial statements of Komax Holding AG. Apart from additional guarantees amounting to CHF 0.6 million (2011: CHF 1.5 million) in favour of third parties at subsidiaries, there were no other contin-gent liabilities towards third parties or Group companies.
Financial Report 48 Consolidated Financial Statements 97 Financial Statements of Komax Holding AG 106 Corporate Structure
93

33 Business combinations33.1 MCM Cosmic KKIn the first half of 2012, Komax acquired 100% of the share capital of the Japanese company MCM Cosmic KK. This company was founded in Tokyo in 1992 and currently employs 15 employees. It develops and markets wire stripping machinery. As a result of this takeover, Komax Wire is adding entry-segment machi-nes and coaxial cable processing applications to its product range. The acquisition will also give Komax Wire better access to Japanese customers. The repercussions of the acquisition of MCM Cosmic KK for the presentation of the consolidated financial statements are not significant.
33.2 TSK Group In August 2012, Komax acquired 100% of the share capital of TSK Beteiligungs GmbH, Porta Westfalica, Germany, as well as all its subsidiaries. TSK is one of the world’s leading suppliers of products and services for the quality assurance of electrical and electronic assemblies and components, particularly cable harnes-ses. The company has a workforce of around 350. TSK’s product and service offering is a perfect match for Komax Wire’s activities. Furthermore, there are synergies as regards customers, distribution, and the service business.
in TCHF
Acquired net assets at fair value
Cash and cash equivalents 1 017
Trade receivables 3 963
Other receivables and accrued income / prepaid expenses 1 422
Inventories 5 013
Deferred tax assets 2 317
Other non-current receivables 1
Property, plant and equipment 4 379
Intangible assets 12 350
Total assets 30 462
Financial liabilities −11 406
Trade payables −1 604
Other payables and accrued expenses / deferred income −6 207
Provisions −203
Financial loans −6 050
Deferred tax liabilities −184
Total liabilities −25 654
Acquired net assets 4 808
Goodwill 4 684
Purchase price paid 9 492
less acquired cash and cash equivalents −1 017
Net cash out 8 475
94

The transaction costs directly attributable to the acquisition amounted to CHF 0.5 million. These are re-ported in the operating result for the current period under the “Other operating expenses”.
The agreement involves no contingent consideration arrangement.
No contingent liabilities were taken over from the acquired companies.
The fair value of trade receivables and other receivables amounts to CHF 5.1 million, of which CHF 4.0 million relate to trade receivables. Their gross value amounts to CHF 4.1 million, of which CHF 0.1 million is presumed to be uncollectable.
The acquired company contributed CHF 13.7 million towards net sales in the period 1 August to 31 December 2012, as well as CHF 0.1 million to Group profit after taxes. The acquired company generated EBITD of 10.5% for this period. Had the acquisition been implemented as of 1 January 2012, the net sales of the Komax Group would have amounted to CHF 305.1 million, while profit after taxes would have amounted to CHF 10.4 million.
34 Events after the balance sheet dateNo material events occurred between the balance sheet date and the approval of the consolidated financial statements by the Board of Directors on 5 March 2013 which might adversely affect the information content of the 2012 consolidated financial statements or which would require disclosure.
35 Related-party transactionsAside from a loan of CHF 0.6 million granted to an associated company, there were no outstanding items with respect to related parties (2011: CHF 0.4 million). In the year under review, no transactions were entered into with members of management in key positions in connection with the sale and purchase of goods and services (2011: none). However, rental payments amounting to CHF 0.1 million (2011: CHF 0.1 million) were made in relation to a production facility. With the exception of the regular employer contribu-tions to the pension fund, no transactions were effected with related parties (2011: none).
Compensation for the Executive Committee and Board of DirectorsIn fiscal 2012, the Group’s Executive Committee comprised five (2011: five) members. In conformity with IFRS 2
for the statement of share-based payments, the total compensation for the Executive Committee, including the
six (2011: five) directors, is as follows:
in TCHF Executive Committee Board of Directors Total Total
2012 2011 2012 2011 2012 2011
Salaries and bonus payments1) 1 968 2 530 680 603 2 648 3 133
Share-based payments 326 603 114 196 440 799
Total 2 294 3 133 794 799 3 088 3 932
1) Including the post-employment benefits of CHF 0.20 million for the financial year 2012 (2011: CHF 0.19 million).
A detailed breakdown of the compensation paid to the Board of Directors and the Executive Committee is provided in the notes to the financial statements of Komax Holding AG on pages 103 and 104.
Financial Report 48 Consolidated Financial Statements 97 Financial Statements of Komax Holding AG 106 Corporate Structure
95

Report of the statutory auditor to the general meeting of Komax Holding AG, Dierikon
Report of the statutory auditor on the consolidated financial statementsAs statutory auditor, we have audited the consolidated financial statements of Komax Holding AG, which comprise the balance
sheet, income statement, statement of comprehensive income, cash flow statement, statement of changes in equity, and notes
(pages 52 to 95), for the year ended 31 December 2012.
Board of Directors’ Responsibility
The Board of Directors is responsible for the preparation and fair presentation of the consolidated financial statements in accordance
with the International Financial Reporting Standards (IFRS) and the requirements of Swiss law. This responsibility includes de-
signing, implementing, and maintaining an internal control system relevant to the preparation and fair presentation of consolidated
financial statements that are free from material misstatement, whether due to fraud or error. The Board of Directors is further
responsible for selecting and applying appropriate accounting policies and making accounting estimates that are reasonable in
the circumstances.
Auditor’s Responsibility
Our responsibility is to express an opinion on these consolidated financial statements based on our audit. We conducted our audit
in accordance with Swiss law and Swiss Auditing Standards as well as the International Standards on Auditing. Those standards
require that we plan and perform the audit to obtain reasonable assurance whether the consolidated financial statements are free
from material misstatement.
An audit involves performing procedures to obtain audit evidence about the amounts and disclosures in the consolidated financial
statements. The procedures selected depend on the auditor’s judgment, including the assessment of the risks of material misstate-
ment of the consolidated financial statements, whether due to fraud or error. In making those risk assessments, the auditor considers
the internal control system relevant to the entity’s preparation and fair presentation of the consolidated financial statements in
order to design audit procedures that are appropriate in the circumstances, but not for the purpose of expressing an opinion on the
effectiveness of the entity’s internal control system. An audit also includes evaluating the appropriateness of the accounting
policies used and the reasonableness of accounting estimates made, as well as evaluating the overall presentation of the consoli-
dated financial statements. We believe that the audit evidence we have obtained is sufficient and appropriate to provide a basis
for our audit opinion.
Opinion
In our opinion, the consolidated financial statements for the year ended 31.12.2012 give a true and fair view of the financial posi-
tion, the results of operations, and the cash flows in accordance with the International Financial Reporting Standards (IFRS) and
comply with Swiss law.
Report on other legal requirementsWe confirm that we meet the legal requirements on licensing according to the Auditor Oversight Act (AOA) and independence
(article 728 CO and article 11 AOA) and that there are no circumstances incompatible with our independence.
In accordance with article 728a paragraph 1 item 3 CO and Swiss Auditing Standard 890, we confirm that an internal control
system exists which has been designed for the preparation of consolidated financial statements according to the instructions
of the Board of Directors.
We recommend that the consolidated financial statements submitted to you be approved.
PricewaterhouseCoopers Ltd
Gerd Tritschler Sven Rumpel
Audit expert Audit expert
Auditor in charge
Basel, 11 March 2013
96

Balance sheet
1 AssetsThe financial loans Group rose by CHF 1.6 million in total. This increase is the result of newly granted loans to subsidiaries.
Two acquisitions were made in the year under review, namely TSK Beteiligungs GmbH, Germany, together with all its subsidiaries, and MCM Cosmic KK, Japan. 100% stakes were acquired in both cases. In addition, the investment values of Komax Systems LCF SA, Switzerland, Komax France Sàrl., France, and Komax Maroc Sàrl., Morocco, were increased.
In conjunction with the takeover of TSK Beteiligungs GmbH and its subsidiaries, existing loans were trans-ferred to the accounts of Komax Holding AG as participation loans. This development aside, no new partici-pation loans were granted in 2012.
The increase in non-current loans Group is attributable to loans granted to TSK companies.
2 LiabilitiesKomax Holding AG’s current account debt toward Komax AG, Switzerland, increased to CHF 59.6 million in the 2012 financial year as a result of the above-mentioned acquisitions. The dividend of Komax AG, Switzerland, for the 2011 financial year (CHF 26.0 million) was offset against the current account debt.
The credit agreement concluded in 2009 between Komax Holding AG and a syndicate of banks for a credit limit of CHF 100.0 million (valid until 31 January 2013) was renewed early with effect from 31 July 2012. The new syndicated loan agreement, which has a credit limit of CHF 120.0 million, is led by Credit Suisse and valid until 31 July 2017. This line of credit provides the Group with the necessary entrepreneurial flexibility, guarantees the financing of commercial operations, and ensures the continued implementation of corporate strategy. CHF 54.6 million of this credit line was being utilized as at 31 December 2012.
The “Group loans” balance sheet item relates to a financial loan amounting to USD 4.0 million granted by Komax Corp., USA, and a loan of EUR 0.4 million granted by Komax France Sàrl., France.
In accordance with the prevailing capital contribution principle, capital contributions (share premiums) made after 31 December 1996 are disclosed in the separate equity item “Capital contribution reserves”. Repay-ments to shareholders from this account are treated as equal to the repayment of nominal capital and are therefore not subject to withholding tax.
The self-financing ratio decreased by 3.7 percentage points from 67.7% in 2011 to 64.0% in 2012.
Reserves for treasury shares remained unchanged at CHF 3.1 million as at 31 December 2012. These reserves are valued at the weighted average acquisition value of the treasury shares held.
Comments on the financial statements of Komax Holding AG
Financial Report 48 Consolidated Financial Statements 97 Financial Statements of Komax Holding AG 106 Corporate Structure
97

Income statement
3 RevenuesKomax Holding AG’s dividend income comes from Komax AG, Switzerland (CHF 26.0 million), and Komax Management AG, Switzerland (CHF 0.3 million).
Services to Group companies comprise revenues from holding fees and licences.
Financial income includes interest on loans granted to Group companies, exchange rate gains on short-term financial loans, and realized and unrealized gains on securities held.
4 ExpenditureAdministration expenses comprise compensation for the Board of Directors, patent and licensing costs, legal and advisory expenses, and other operating expenses.
Financial expenses include interest on loans payable to third parties and Group companies, as well as real-ized and unrealized exchange rate losses. As there were no major changes in the EUR and USD exchange rates against local currency CHF, exchange rate losses were CHF 5.1 million lower than in the previous year, resulting in financial expenses of CHF 2.1 million (exchange rate losses in USD) and CHF 0.4 million (exchange rate losses in EUR). The valuation of treasury shares added CHF 0.7 million to financial expenses, whereas this valuation adjustment weighed on the financial result to the tune of CHF 1.1 million in 2011.
98

Balance sheetin TCHF 31.12.2012 31.12.2011
Assets
Cash and cash equivalents 496 1 786
Treasury shares 1 951 1 889
Other receivables third parties 15 23
Other receivables Group 1 849 1 660
Other receivables associates 11 4
Financial loans Group 104 394 102 827
Financial loans associates 610 369
Accrued income / prepaid expenses 36 240
Total current assets 109 362 108 798
Investments in subsidiaries 141 455 126 195
Investments in associates 2 228 2 228
Participation loans Group 19 085 11 433
Financial loans Group 58 798 48 013
Total non-current assets 221 566 187 869
Total assets 330 928 296 667
Liabilities and shareholders’ equity
Other liabilities third parties 193 249
Other liabilities Group 59 601 46 550
Accrued expenses / deferred income 610 519
Provisions 1 3
Loans Group 4 168 4 415
Total current liabilities 64 573 51 736
Loans third parties 54 640 44 000
Total non-current liabilities 54 640 44 000
Total liabilities 119 213 95 736
Share capital 344 340
General statutory reserves 2 100 2 286
Reserves for treasury shares 3 086 3 086
Capital contribution reserves 20 387 32 207
Free reserves 162 816 148 816
Retained earnings 196 0
Profit after taxes 22 786 14 196
Total shareholders’ equity 211 715 200 931
Total liabilities and shareholders’ equity 330 928 296 667
Financial Report 48 Consolidated Financial Statements 97 Financial Statements of Komax Holding AG 106 Corporate Structure
99

Income statementin TCHF 2012 2011
Dividend income 26 250 21 588
Services to Group companies 465 814
Financial income 4 747 4 828
Total income 31 462 27 230
Administrative expenses 2 358 1 895
Financial expenses 5 552 10 312
Other expenses 734 660
Total expenses 8 644 12 867
Profit before taxes 22 818 14 363
Taxes 32 167
Profit after taxes 22 786 14 196
100

Notes to the 2012 financial statements
1 Contingent liabilities
in TCHF 31.12.2012 31.12.2011
Joint liability for Group taxation value-added tax p.m. p.m.
Guarantees (in favour of subsidiaries)
in EUR 42 173
in USD 455 1 054
in CHF 7 355 2 071
Total 7 852 3 298
2 Conditional capitalAs at 1 January 2012, the conditional capital consisted of 449 120 registered shares, each with a par value of CHF 0.10, created for management and employee share ownership schemes. 42 909 options were con-verted into shares in 2012 (2011: none). There was no increase in the conditional capital.
Change in conditional share capital Number of conditional registered shares
Par valueCHF
Conditional share capital
CHF
Opening amount as at 1 January 2012 449 120 0.10 44 912
Reduction in conditional share capital as a result of exercise of options in 2012 −42 909 0.10 −4 291
Closing amount as at 31 December 2012 406 211 0.10 40 621
Financial Report 48 Consolidated Financial Statements 97 Financial Statements of Komax Holding AG 106 Corporate Structure
101
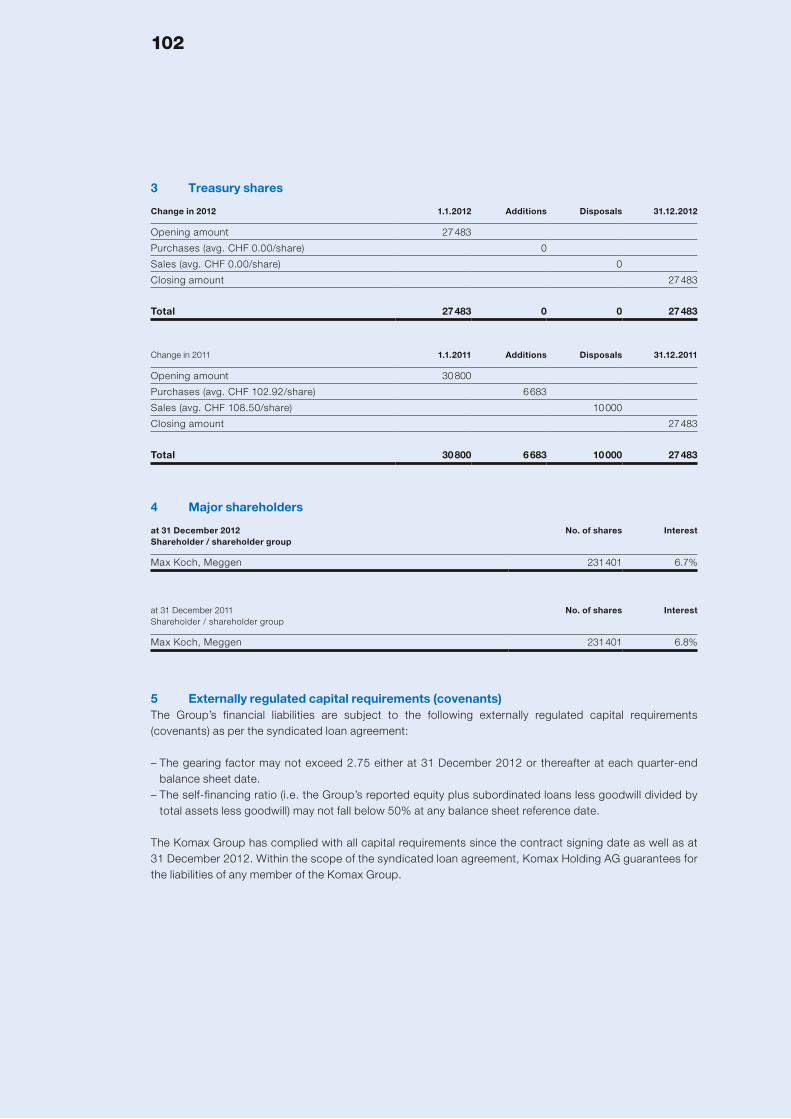
3 Treasury shares
Change in 2012 1.1.2012 Additions Disposals 31.12.2012
Opening amount 27 483
Purchases (avg. CHF 0.00/share) 0
Sales (avg. CHF 0.00/share) 0
Closing amount 27 483
Total 27 483 0 0 27 483
Change in 2011 1.1.2011 Additions Disposals 31.12.2011
Opening amount 30 800
Purchases (avg. CHF 102.92/share) 6 683
Sales (avg. CHF 108.50/share) 10 000
Closing amount 27 483
Total 30 800 6 683 10 000 27 483
4 Major shareholders
at 31 December 2012Shareholder / shareholder group
No. of shares Interest
Max Koch, Meggen 231 401 6.7%
at 31 December 2011Shareholder / shareholder group
No. of shares Interest
Max Koch, Meggen 231 401 6.8%
5 Externally regulated capital requirements (covenants)The Group’s financial liabilities are subject to the following externally regulated capital requirements (cov enants) as per the syndicated loan agreement:
– The gearing factor may not exceed 2.75 either at 31 December 2012 or thereafter at each quarter-end balance sheet date.
– The self-financing ratio (i.e. the Group’s reported equity plus subordinated loans less goodwill divided by total assets less goodwill) may not fall below 50% at any balance sheet reference date.
The Komax Group has complied with all capital requirements since the contract signing date as well as at 31 December 2012. Within the scope of the syndicated loan agreement, Komax Holding AG guarantees for the liabilities of any member of the Komax Group.
102
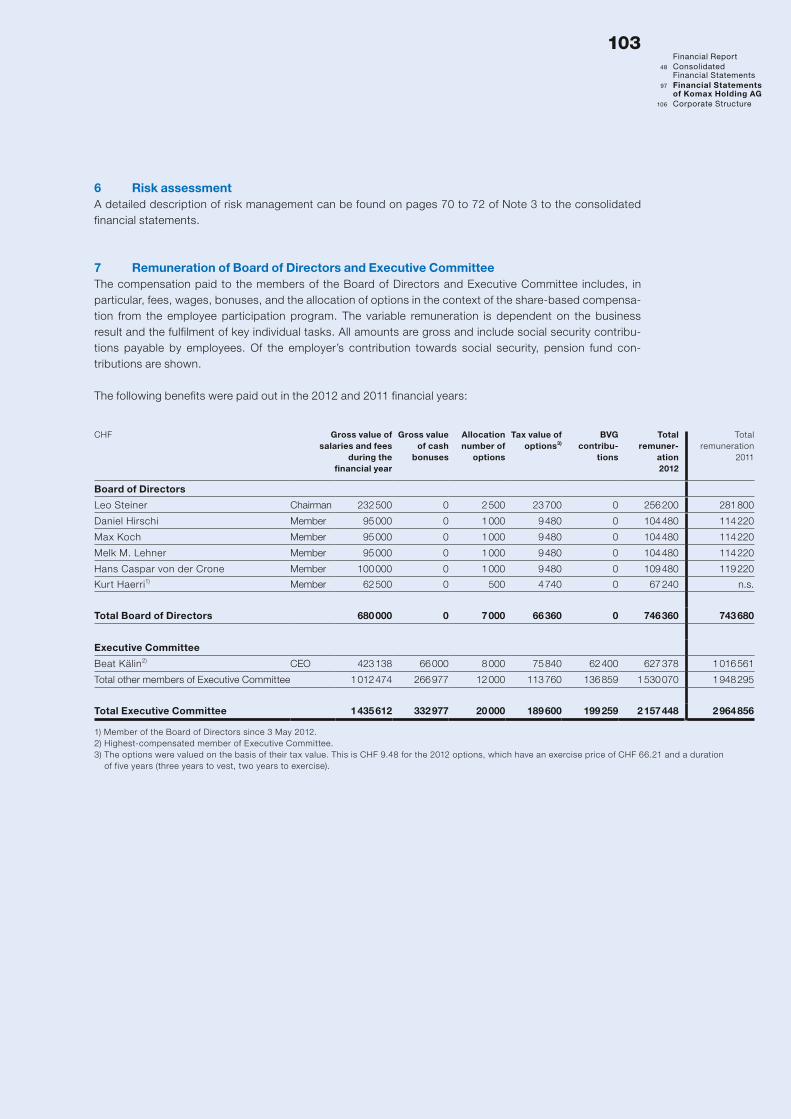
6 Risk assessmentA detailed description of risk management can be found on pages 70 to 72 of Note 3 to the consolidated financial statements.
7 Remuneration of Board of Directors and Executive CommitteeThe compensation paid to the members of the Board of Directors and Executive Committee includes, in particular, fees, wages, bonuses, and the allocation of options in the context of the share-based compensa-tion from the employee participation program. The variable remuneration is dependent on the business result and the fulfilment of key individual tasks. All amounts are gross and include social security contribu-tions payable by employees. Of the employer’s contribution towards social security, pension fund con-tributions are shown.
The following benefits were paid out in the 2012 and 2011 financial years:
CHF Gross value of salaries and fees
during the financial year
Gross value of cash
bonuses
Allocation number of
options
Tax value of options3)
BVG contribu-
tions
Totalremuner -
ation2012
Totalremuneration
2011
Board of Directors
Leo Steiner Chairman 232 500 0 2 500 23 700 0 256 200 281 800
Daniel Hirschi Member 95 000 0 1 000 9 480 0 104 480 114 220
Max Koch Member 95 000 0 1 000 9 480 0 104 480 114 220
Melk M. Lehner Member 95 000 0 1 000 9 480 0 104 480 114 220
Hans Caspar von der Crone Member 100 000 0 1 000 9 480 0 109 480 119 220
Kurt Haerri1) Member 62 500 0 500 4 740 0 67 240 n.s.
Total Board of Directors 680 000 0 7 000 66 360 0 746 360 743 680
Executive Committee
Beat Kälin2) CEO 423 138 66 000 8 000 75 840 62 400 627 378 1 016 561
Total other members of Executive Committee 1 012 474 266 977 12 000 113 760 136 859 1 530 070 1 948 295
Total Executive Committee 1 435 612 332 977 20 000 189 600 199 259 2 157 448 2 964 856
1) Member of the Board of Directors since 3 May 2012. 2) Highest-compensated member of Executive Committee. 3) The options were valued on the basis of their tax value. This is CHF 9.48 for the 2012 options, which have an exercise price of CHF 66.21 and a duration
of five years (three years to vest, two years to exercise).
Financial Report 48 Consolidated Financial Statements 97 Financial Statements of Komax Holding AG 106 Corporate Structure
103

8 Holdings of shares and options
Assets in units 31.12.2012Shares Options
31.12.2011Shares Options
Board of Directors
Leo Steiner Chairman 118 650 7 000 116 650 11 500
Daniel Hirschi Member 200 4 000 200 4 000
Max Koch Member 231 401 4 000 231 401 4 000
Melk M. Lehner Member 11 000 4 000 11 000 4 000
Hans Caspar von der Crone Member 9 300 4 000 9 300 4 000
Kurt Haerri1) Member 25 500 n.s. n.s.
Total Board of Directors 370 576 23 500 368 551 27 500
Executive Committee
Beat Kälin CEO 7 300 27 000 2 300 32 000
Andreas Wolfisberg CFO 1 100 9 000 700 13 000
Walter Nehls Head of BU Solar 1 200 10 000 400 10 000
Matijas Meyer Head of BU Wire 0 7 500 600 6 100
René Ronchetti2) Head of BU Medtech 0 1 000 n.s. n.s.
Serge Peguiron3) Head of BU Medtech n.s. n.s. 620 11 500
Total Executive Committee 9 600 54 500 4 620 72 600
1) Member of the Board of Directors since 3 May 2012. 2) Member of the Executive Committee since 1 September 2012. 3) Member of the Executive Committee until 31 August 2012.
No loans or credits were granted to members of the Board of Directors, members of the Executive Commit-tee, or related parties of these persons during the 2012 and 2011 financial years. There are no outstanding loans or credits to these persons.
There are no other items requiring disclosure under sections 663b, 663bbis , and 663c of the Swiss Code of Obligations.
104

This page has been intentionally left blank.

Komax Group CompaniesDirect and indirect equity participation as at 31 December 2012
Company Place Purpose Participation Ordinary capital
Komax Management AG Dierikon, Switzerland Group services and management 100% CHF 100 000
Komax AG Dierikon, Switzerland R&D, engineering, production, marketing, sales 100% CHF 5 000 000
Komax Systems LCF SA La Chaux-de-Fonds, Switzerland R&D, engineering, production, marketing, sales 100% CHF 4 500 000
Komax France Sàrl. Epinay-sur-Seine, France R&D, engineering, production, marketing, sales 100% EUR 1 500 000
Komax Deutschland GmbH Nuremberg, Germany Sales 100% EUR 400 000
Komax Portuguesa S.A. S. Domingos de Rana, Portugal Sales 100% EUR 1 500 000
Komax Holding Corp. Buffalo Grove, Illinois, USA Holding of equity interests 100% USD 8 160 000
Komax Solar Inc. York, Pennsylvania, USA R&D, engineering, production, marketing, sales 100% USD 150
Komax Systems Rockford Inc. Rockford, Illinois, USA Engineering, production, marketing, sales 100% USD 10 000
Komax Corp. Buffalo Grove, Illinois, USA Sales 100% USD 1 000 000
Komax Comercial do Brasil Ltda. São Paulo, Brazil Sales 100% BRL 200 000
Komax Maroc Sàrl. Mohammédia, Morocco Sales 100% MAD 10 000 000
Komax SA Pty. Ltd. Port Elizabeth, South Africa Sales 100% ZAR 200
Komax Shanghai Co. Ltd. Shanghai, China R&D, production, sales 100% USD 200 000
Komax Systems Malaysia Sdn. Bhd. Penang, Malaysia Engineering, production, sales 100% MYR 3 000 000
MCM Cosmic KK Tokyo, Japan R&D, production, marketing, sales 100% JPY 30 000 000
Komax Singapore Pte. Ltd. Singapore Sales 100% SGD 100 000
Komax Automation India Pvt. Ltd. Gurgaon, India Sales 100% INR 10 000 000
TSK Beteiligungs GmbH Porta Westfalica, Germany Holding of equity interests 100% EUR 4 000 000
TSK Prüfsysteme GmbH Porta Westfalica, Germany R&D, engineering, production, marketing, sales 100% EUR 1 764 700
TSK Innovations Co. El Paso, Texas, USA Engineering, production, marketing, sales 100% USD 1 000 000
TSK do Brasil Ltda. Colombo, Brazil Engineering, production, marketing, sales 100% BRL 362 500
TSK Tunisia s.a.l. Tunis, Tunesia Engineering, production, marketing, sales 100% TND 366 000
TSK Test Sistemleri Ltd. Sti. Velimese Corlu, Turkey R&D, engineering, production, marketing, sales 100% TRY 265 500
TSK Test Systems (Shanghai) Co. Ltd. Shanghai, China R&D, engineering, production, marketing, sales 100% CNY 3 275 902
Komax Jinchen Solar Equipment (Yingkou) Co. Ltd. Yingkou, China R&D, engineering, production 51% CNY 16 000 000
SLE quality engineering Verwaltungs GmbH Grafenau, Germany Administration 30% EUR 25 000
SLE quality engineering GmbH & Co. KG Grafenau, Germany R&D, engineering, production, marketing, sales 30% EUR 5 700 000
Komax Holding AGDierikon, Switzerland
Purpose: Holding of equity interestsListed on the SIX Swiss ExchangeSwiss security ID code: 001070215Share capital: CHF 344 378.90Market capitalization: CHF 244.5 million
106

Company Place Purpose Participation Ordinary capital
Komax Management AG Dierikon, Switzerland Group services and management 100% CHF 100 000
Komax AG Dierikon, Switzerland R&D, engineering, production, marketing, sales 100% CHF 5 000 000
Komax Systems LCF SA La Chaux-de-Fonds, Switzerland R&D, engineering, production, marketing, sales 100% CHF 4 500 000
Komax France Sàrl. Epinay-sur-Seine, France R&D, engineering, production, marketing, sales 100% EUR 1 500 000
Komax Deutschland GmbH Nuremberg, Germany Sales 100% EUR 400 000
Komax Portuguesa S.A. S. Domingos de Rana, Portugal Sales 100% EUR 1 500 000
Komax Holding Corp. Buffalo Grove, Illinois, USA Holding of equity interests 100% USD 8 160 000
Komax Solar Inc. York, Pennsylvania, USA R&D, engineering, production, marketing, sales 100% USD 150
Komax Systems Rockford Inc. Rockford, Illinois, USA Engineering, production, marketing, sales 100% USD 10 000
Komax Corp. Buffalo Grove, Illinois, USA Sales 100% USD 1 000 000
Komax Comercial do Brasil Ltda. São Paulo, Brazil Sales 100% BRL 200 000
Komax Maroc Sàrl. Mohammédia, Morocco Sales 100% MAD 10 000 000
Komax SA Pty. Ltd. Port Elizabeth, South Africa Sales 100% ZAR 200
Komax Shanghai Co. Ltd. Shanghai, China R&D, production, sales 100% USD 200 000
Komax Systems Malaysia Sdn. Bhd. Penang, Malaysia Engineering, production, sales 100% MYR 3 000 000
MCM Cosmic KK Tokyo, Japan R&D, production, marketing, sales 100% JPY 30 000 000
Komax Singapore Pte. Ltd. Singapore Sales 100% SGD 100 000
Komax Automation India Pvt. Ltd. Gurgaon, India Sales 100% INR 10 000 000
TSK Beteiligungs GmbH Porta Westfalica, Germany Holding of equity interests 100% EUR 4 000 000
TSK Prüfsysteme GmbH Porta Westfalica, Germany R&D, engineering, production, marketing, sales 100% EUR 1 764 700
TSK Innovations Co. El Paso, Texas, USA Engineering, production, marketing, sales 100% USD 1 000 000
TSK do Brasil Ltda. Colombo, Brazil Engineering, production, marketing, sales 100% BRL 362 500
TSK Tunisia s.a.l. Tunis, Tunesia Engineering, production, marketing, sales 100% TND 366 000
TSK Test Sistemleri Ltd. Sti. Velimese Corlu, Turkey R&D, engineering, production, marketing, sales 100% TRY 265 500
TSK Test Systems (Shanghai) Co. Ltd. Shanghai, China R&D, engineering, production, marketing, sales 100% CNY 3 275 902
Komax Jinchen Solar Equipment (Yingkou) Co. Ltd. Yingkou, China R&D, engineering, production 51% CNY 16 000 000
SLE quality engineering Verwaltungs GmbH Grafenau, Germany Administration 30% EUR 25 000
SLE quality engineering GmbH & Co. KG Grafenau, Germany R&D, engineering, production, marketing, sales 30% EUR 5 700 000
107 Financial Statements 48 Financial Statements of Komax Group 97 Financial Statements of Komax Holding AG 106 Corporate Structure

Proposal for the appropriation of profit
The Board of Directors proposes the following appropriation of profit and payout (which is not subject to withholding tax) from the capital contribution reserves:
in CHF 31.12.2012 31.12.2011
Balance carried forward from previous year 195 845 0
Profit after taxes 22 785 694 14 195 845
Transfer from capital contribution reserves 6 887 578 13 603 520
Total available for distribution 29 869 117 27 799 365
Payout from capital contribution reserves of CHF 2.00 per registered share (2011: CHF 4.00) which is not subject to withholding tax1) 6 887 578 13 603 520
Allocation to free reserves 22 800 000 14 000 000
Profit carried forward 181 539 195 845
Total 29 869 117 27 799 365
1) The stated amount covers the requirement for the payout from capital reserves for all registered shares outstanding. Registered shares which will be issued after 1 January 2013 upon exercise of options are also entitled to the payout from capital reserves. Therefore, the stated amount may be subject to changes.
108

Report of the statutory auditor to the general meeting of Komax Holding AG, Dierikon
Report of the statutory auditor on the financial statementsAs statutory auditor, we have audited the financial statements of Komax Holding AG, which comprise the balance sheet, income
statement, and notes (pages 99 to 107), for the year ended 31 December 2012.
Board of Directors’ Responsibility
The Board of Directors is responsible for the preparation of the financial statements in accordance with the requirements of Swiss
law and the company’s articles of incorporation. This responsibility includes designing, implementing, and maintaining an internal
control system relevant to the preparation of financial statements that are free from material misstatement, whether due to fraud
or error. The Board of Directors is further responsible for selecting and applying appropriate accounting policies and making
accounting estimates that are reasonable in the circumstances.
Auditor’s Responsibility
Our responsibility is to express an opinion on these financial statements based on our audit. We conducted our audit in accord -
ance with Swiss law and Swiss Auditing Standards. Those standards require that we plan and perform the audit to obtain reasonable
assurance whether the financial statements are free from material misstatement.
An audit involves performing procedures to obtain audit evidence about the amounts and disclosures in the financial statements.
The procedures selected depend on the auditor’s judgment, including the assessment of the risks of material misstatement of the
financial statements, whether due to fraud or error. In making those risk assessments, the auditor considers the internal control
system relevant to the entity’s preparation of the financial statements in order to design audit procedures that are appropriate in the
circumstances, but not for the purpose of expressing an opinion on the effectiveness of the entity’s internal control system. An
audit also includes evaluating the appropriateness of the accounting policies used and the reasonableness of accounting estimates
made, as well as evaluating the overall presentation of the financial statements. We believe that the audit evidence we have
obtained is sufficient and appropriate to provide a basis for our audit opinion.
Opinion
In our opinion, the financial statements for the year ended 31 December 2012 comply with Swiss law and the company’s articles
of incorporation.
Report on other legal requirementsWe confirm that we meet the legal requirements on licensing according to the Auditor Oversight Act (AOA) and independence
(article 728 CO and article 11 AOA) and that there are no circumstances incompatible with our independence.
In accordance with article 728a paragraph 1 item 3 CO and Swiss Auditing Standard 890, we confirm that an internal control
system exists which has been designed for the preparation of financial statements according to the instructions of the Board
of Directors.
We further confirm that the proposed appropriation of available earnings complies with Swiss law and the company’s articles
of incorporation. We recommend that the financial statements submitted to you be approved.
PricewaterhouseCoopers Ltd
Gerd Tritschler Sven Rumpel
Audit expert Audit expert
Auditor in charge
Basel, 11 March 2013
109 Financial Report 48 Consolidated Financial Statements 97 Financial Statements of Komax Holding AG 106 Corporate Structure

Glossary
Mechatronics The term mechatronics describes the synergistic interaction between the specialist disciplines of mechanical engineering, electrical engin-eering, and computer engineering in the design and manufacture of in-dustrial products and in process design.
Crimping Crimping is a bonding technique whereby two components are joined together by plastic deformation. It thus constitutes an alternative to conventional bonding methods such as soldering or welding. Crimp connections are predominantly used in mass production settings with non-stop assembly of single strands.
Crimp force monitoring Measurement and monitoring of crimping processes during wire con-nector crimping.
Micrograph laboratory Micrographs are an important criterion for analysing the quality of crimp connections and ensuring traceability in production. Micrograph laboratories analyse and document the quality of crimp connections, using colour pictures.
Stripping Process whereby a section of the insulating cover (or “insulation sleeve/sheath”) of an electrical conductor (wire or flex) is removed up to a specific required length to allow the wire to be connected to an-other component.
Twisting Process whereby wires are twisted against one another and wound together into a spiral. Twisted pairs are a low-cost way of preventing electromagnetic interference.
Solar cell A solar cell, or photovoltaic cell, is an electronic component that con-verts short-wave radiation energy, usually sunlight, directly into elec-tricity.
Solar module A solar module, or photovoltaic module, converts sunlight directly into electricity. Its most important components are a number of solar cells.
Stringing Process whereby individual solar cells are joined together in individual “strings” using soldering strips.
110

Wafer Wafers are circular discs of less than 1 mm in thickness. They are manufactured from mono- or polycrystalline (semiconductor) blanks (so-called ingots) and are usually used as a substrate (base plate) for electronic components.
Inhaler Device used in the treatment of asthma, bronchitis, and other chronic or acute respiratory diseases.
Pen Injection device, for example for administering insulin, characterized by its ease of use.
Self-medication Self-treatment with medicines.
111 Further Informations 110 Glossary 112 Addresses 116 Five-Year Overview

Addresses
Headquarters Komax Holding AG
CH-6036 DierikonPhone +41 41 455 04 55Fax +41 41 450 42 [email protected]
Angola Komax Portuguesa
PT-2785-034 S. Domingos de RanaPhone +351 21 444 8480Fax +351 21 444 [email protected]
Argentina El Proveedor S.R.L.
AR-Buenos AiresPhone +54 11 476 136 07Fax +54 11 476 136 [email protected]
Australia Suba Engineering Pty. Ltd.
AU-2200 Bankstown N.S.W. Phone +61 297 900 900Fax +61 297 083 [email protected]
Austria Thonauer GmbH
AT-1230 WienPhone +43 1 804 28 710Fax +43 1 804 28 [email protected]
Belarus Asber
BY-220018 MinskPhone +375 17 258 1166Fax +375 17 258 [email protected]
Belgium Smans N.V.
BE-2300 TurnhoutPhone +32 1442 4401Fax +32 1442 [email protected]
Botswana Komtech
ZA-4391 Salt Rock BallitoPhone +27 32 525 5155Fax +27 86 766 [email protected]
Brasil Komax Comercial do Brasil Ltda.
BR-06440-110 Barueri/São PauloPhone +55 11 3028 1112Fax +55 11 4689 [email protected]
TSK do Brasil Ltda.BR-83404 ColomboPhone +55 413 621 1794Fax +55 413 621 [email protected]
Bulgaria Tekuni Eood
BG-1415 DragalevtsiPhone +359 897 761 159Fax +359 297 530 [email protected]
Canada Komax Corporation
US-Buffalo Grove, IL 60089-4507Phone +1 847 537 6640Fax +1 847 537 [email protected]
China Komax Shanghai Co. Ltd.
CN-201108 ShanghaiPhone +86 21 2416 5668Fax +86 21 2416 [email protected]
Beijing OfficePhone +86 10 5162 7825Fax +86 10 5278 6140
Changchun OfficePhone +86 431 8455 2252Fax +86 431 8455 2251
Chendu OfficePhone +86 28 8738 24 85Fax +86 28 8738 24 86
Guangzhou OfficePhone +86 20 2886 0648Fax +86 20 3878 0400
Shandong OfficePhone +86 631 5990 475Fax +86 631 5990 465
Komax Jinchen Solar Equipment(Yingkou) Co. Ltd.CN-115000 YingkouPhone +86 417 3252 372Fax +86 417 3252 402
TSK Test Systems (Shanghai) Co. Ltd.CN-201111 ShanghaiPhone +86 21 5159 5228 Fax +86 21 5159 [email protected]
Croatia Mikom D.O.O.
HR-49247 Zlatar Bistrica HrvatskaPhone +385 49 462 034Fax +385 49 461 [email protected]
Czech Republic Komax Deutschland GmbH
DE-90449 NurembergPhone +49 911 32 49 50Fax +49 911 32 49 [email protected]
TSK ServicesCZ-34901 StříbroPhone +420 374 623 896Fax +420 374 627 [email protected]
Denmark Matech Systems ApS
DK-7190 BillundPhone +45 75 33 89 49Fax +45 75 33 89 [email protected]
Dubai Contax Automatin Ltd.
GB-W5 3BU LondonPhone +44 208 354 9923Fax +44 208 9988 [email protected]
Production Sales and service Participation Sales representative
112

Egypt Sigma Group Egypt
EG-11361 CairoPhone +202 2644 7245Fax +202 2642 [email protected]
El Salvador Komax Service Office
HN-San Pedro SulaCortes HondurasPhone +1 9932 [email protected]
Estonia Gammeter OU
EE-76606 KeilaPhone +372 671 22 52Fax +372 671 22 [email protected]
Finland AD Contact AB Gammeter
FI-33560 TamperePhone +358 3380 2211Fax +358 3380 [email protected]
France Komax France
FR-93806 Epinay-sur-SeinePhone +33 14 940 1313Fax +33 14 940 [email protected]
Komax FranceFR-13106 RoussetPhone +33 44 229 1200Fax +33 44 229 [email protected]
Germany Komax Deutschland GmbH
DE-90449 NurembergPhone +49 911 32 49 50Fax +49 911 32 49 [email protected]
TSK Prüfsysteme GmbHDE-32457 Porta WestfalicaPhone +49 571 79 580Fax +49 571 79 [email protected]
SLE quality engineeringGmbH & Co. KG DE-94481 GrafenauPhone +49 911 32 49 50Fax +49 911 32 49 550
AAT Aston GmbHDE-90257 NurembergPhone +49 911 32 66 210Fax +49 911 32 66 [email protected]
Great Britain KPE Ltd.
GB-Hants SO31 5QAPhone +44 845 519 2418Fax +44 238 045 [email protected]
Honduras Komax Service Office
HN-San Pedro SulaCortes HondurasPhone +1 9932 [email protected]
Hungary Thonauer Kereskedelmi és Szerviz Kft.
HU-1113 BudapestPhone +36 1372 7700Fax +36 1372 [email protected]
India Komax Automation India Pvt. Ltd.
IN-122016 GurgaonPhone +91 124 4599 100Fax +91 124 4599 [email protected]
TSK Sales and ServicesIN-411051 PunePhone +91 20 24 345 [email protected]
Indonesia Komax Singapore Pte. Ltd.
SG-368357 SingaporePhone +65 6285 9713Fax +65 6285 [email protected]
Ireland Kinetic Electronics Ltd.
IE-Co. OffalyPhone +353 5793 21014Fax +353 5793 [email protected]
Israel Tamir Engineering &
Development Ltd. IL-49170 Petach-TiqvaPhone +972 3922 9422Fax +972 3922 [email protected]
Italy Cofilimacchine S.R.L.
IT-20853 BiassonoPhone +39 039 232 41 25Fax +39 039 232 21 [email protected]
Japan MCM Cosmic KK
JP-Tokyo 191-0062Phone +81 42 582 7911Fax +81 42 582 [email protected]
Korea Hansung Tech Cc. Ltd.
KR-463-828 Kyunggi-DoPhone +82 31 781 3971 Fax +82 31 781 [email protected]
Latvia Gammeter OU
EE-76606 KeilaPhone +37 2671 2251Fax +37 2671 [email protected]
Luxembourg Smans N.V.
BE-2300 TurnhoutPhone +32 1442 4401Fax +32 1442 [email protected]
Macedonia Mikom D.O.O.
HR-49247 Zlatar Bistrica HrvatskaPhone +385 49 462 034Fax +385 49 461 [email protected]
Malaysia Komax KL
MY-58000 Kuala LumpurPhone +60 37981 2662Fax +60 37987 [email protected]
Komax Systems Malaysia Sdn. Bhd.MY-11900 PenangPhone +60 4627 2233Fax +60 4627 [email protected]
Mexico Komax Corporation
US-El Paso, TX 79936Phone +1 915 591 4551Fax +1 915 591 [email protected]
TSK ServicesMX –72590 PueblaPhone +52 222 31 12 398Fax +52 222 31 12 [email protected]
Montenegro Mikom D.O.O.
HR-49247 Zlatar Bistrica HrvatskaPhone +385 49 462 034Fax +385 49 461 [email protected]
113 Further Informations 110 Glossary 112 Addresses 116 Five-Year Overview

Morocco Komax Maroc
MA-20800 MohammédiaPhone +212 5 2330 5285Fax +212 5 2330 [email protected]
Netherlands Smans N.V.
BE-2300 TurnhoutPhone +32 1442 4401Fax +32 1442 [email protected]
New Zealand Suba Engineering Ptv. Ltd.
AU-2200 Bankstown N.S.W. Phone +61 297 900 900Fax +61 297 083 [email protected]
Nicaragua Komax Service Office
HN-San Pedro SulaCortes HondurasPhone +1 9932 [email protected]
Norway Adcontact AB
SE-17207 SundbybergPhone +46 8445 3600Fax +46 8445 [email protected]
Paraguay Komax Comercial do Brasil Ltda.
BR-06440-110 - Barueri / Sao PauloPhone +55 11 3028 1112Fax +55 11 4689 [email protected]
Philippines Neuftech Philippines Inc.
PH-4027 Calamba LagunaPhone +63 49 545 4056Fax +63 49 545 [email protected]
Poland Evoltec
PL-02-676 WarschauPhone +48 22 550 27 40-44Fax +48 22 550 27 [email protected]
Portugal Komax Portuguesa
PT-2785-034 S. Domingos de RanaPhone +351 21 444 8480Fax +351 21 444 [email protected]
Romania SC Thonauer Automatic S.R.L.
RO-024011 BukarestPhone +40 21335 1287Fax +40 21336 [email protected]
SC Amaprest SRLRO-420005 BistritaPhone +40 263 228 025Fax +40 263 228 [email protected]
Russia Komax Moscow
RU-125190 MoscowPhone +7 495 221 2943Fax +7 495 221 [email protected]
OstecRU-121467 MoscowPhone +7 495 788 4444Fax +7 495 788 [email protected]
OstecRU-195009 St. PetersburgPhone +7 911 849 7986Fax +7 495 788 [email protected]
Serbia Mikom Electronic D.O.O
SRB-34210 Raca Phone +381 34 752 760 Fax +381 34 752 760 [email protected]
Singapore Komax Singapore Pte. Ltd.
SG-368357 SingaporePhone +65 6285 9713Fax +65 6285 [email protected]
Slovakia TSK Services
SK-066 01 HumennéPhone +421 57 776 77 [email protected]
Thonauer SPOL S.R.O.SK-81339 BratislavaPhone +421 2527 33664Fax +421 2527 [email protected]
Slovenia Mikom-si D.O.O.
SI-3320 VelenjePhone +386 3 8919 310Fax +386 3 8919 [email protected]
South Africa TSK Sales & Services SA
SA-6001 Port ElizabethPhone +27 82 046 9484Fax +27 86 607 [email protected]
KomtechZA-Salt Rock Ballito Phone +27 32 525 5155 Fax +27 86 766 1572 [email protected]
Spain Estanflux S.A.
ES-08023 BarcelonaPhone +34 9 3351 6151Fax +34 9 3352 [email protected]@estanflux.com
Sweden Adcontact AB
SE-17207 SundbybergPhone +46 8445 3600Fax +46 8445 [email protected]
Switzerland Komax AG
CH-6036 DierikonPhone +41 41 455 04 55Fax +41 41 450 42 [email protected]
Komax AGCH-6343 RotkreuzPhone +41 41 799 45 00Fax +41 41 799 45 [email protected]
Komax Systems LCF SACH-2301 La Chaux-de-FondsPhone +41 32 924 71 11Fax +41 32 924 71 [email protected]
Taiwan Chain Year Industr. Corp.
RC-221 Taipei HsienPhone +886 22 691 3568Fax +886 22 691 [email protected]
Production Sales and service Participation Sales representative
114

Thailand DKSH (Thailand) Ltd.
TH-10310 BangkokPhone +66 2254 4900 1696Fax +66 2652 9417 [email protected]
Tunesia TSK Tunisia s.a.l.
TN-8603 TunisPhone +216 71 770 506Fax +216 71 770 [email protected]
ReemiTN-2000 Le BardoPhone +216 71 222 811Fax +216 71 519 [email protected]
Turkey TSK Test Sistemleri Ltd. Sti.
TR-59860 Velimese CorluPhone +90 282 691 12 27Fax +90 282 691 12 [email protected]
Unitek Elektrik San. Ve Tic. Ltd. Sti.TR-34852 Maltepe – IstanbulPhone +90 216 518 9440Fax +90 216 518 [email protected]
UAE Contax Automatin Ltd.
GB-W5 3BU LondonPhone +44 208 354 9923Fax +44 208 9988 [email protected]
Ukraine Wireworks
UA-79015 LvivPhone +38 067 673 0314Fax +38 032 245 [email protected]
Uruguay EL PROVEEDOR S.R.L.
AR-Buenos AiresPhone +54 11 476 136 07Fax +54 11 476 136 [email protected]
USA Komax Corporation
US-Buffalo Grove, IL 60089-4507Phone +1 847 537 6640Fax +1 847 537 [email protected]
Komax Systems Rockford Inc.US-Rockford, IL 61109Phone +1 815 229 3800Fax +1 815 229 [email protected]
Komax Solar Inc.US-York, PA 17402Phone +1 717 755 6800Fax +1 717 755 [email protected]
TSK Innovations Co.US-9922 El Paso, TexasPhone +1 915 581 9718Fax +1 915 581 9768
Uzbekistan Ostec
RU-121467 MoscowPhone +7 495 788 4444Fax +7 495 788 [email protected]
Vietnam DKSH Technology Co. Ltd.
VN-Ho Chi Minh CityPhone +84 38 125 806Fax +84 38 125 [email protected]
DKSH Technology Co. Ltd.VN-HanoiPhone +84 34 9424 725Fax +84 34 9424 [email protected]
All other countries Komax AG
CH-6036 DierikonPhone +41 41 455 04 55Fax +41 41 450 42 [email protected]
115 Further Informations 110 Glossary 112 Addresses 116 Five-Year Overview

Five-year overview
in TCHF 2012 2011 2010 2009 2008
Revenues1) 288 216 371 424 340 172 211 504 342 733
Gross profit 170 188 200 837 178 559 120 169 192 636
in % of revenues 59.0 54.1 52.5 56.8 56.2
EBITD 22 924 54 906 36 443 −14 504 39 091
in % of revenues 8.0 14.8 10.7 −6.9 11.4
Operating profit/loss (EBIT) 14 352 47 536 29 110 −22 672 31 119
in % of revenues 5.0 12.8 8.6 −10.7 9.1
Group profit/loss after taxes (EAT) 10 046 39 280 17 780 −19 835 23 226
in % of revenues 3.5 10.6 5.2 −9.4 6.8
Depreciation 8 572 7 370 7 333 8 168 7 972
Cash flow from operating activities 45 222 10 055 24 546 −8 196 29 268
Investments in non-current assets 9 033 13 536 5 890 14 414 8 744
Free cash flow 27 627 −61 19 500 −21 513 21 717
Research and development 24 566 23 526 20 511 20 101 25 248
in % of revenues 8.5 6.3 6.0 9.5 7.4
Total assets 360 189 361 448 318 698 290 855 322 086
Non-current assets 141 887 112 454 107 162 114 187 108 397
Current assets 218 302 248 994 211 536 176 668 213 689
Shareholders’ equity2) 244 391 246 994 212 523 199 899 222 098
in % of total assets 67.9 68.3 66.7 68.7 69.0
Share capital 344 340 340 339 339
Total liabilities 114 904 113 413 106 175 90 956 99 988
in % of total assets 31.9 31.4 33.3 31.3 31.0
Non-current financial loans 56 765 46 571 42 374 44 524 2 000
Current financial loans 0 0 0 0 24 680
Net cash (+) / net indebtedness (−) 938 5 604 12 026 −6 270 19 683
Headcount (at year-end) No. 1 330 1 140 1 023 987 1 138
Revenues per employee3) 246 343 333 209 309
Gross value added per employee3) 108 147 135 87 137
Net value added per employee3) 100 140 127 79 130
Shares4) No. 1 000 3 444 3 401 3 401 3 388 3 388
Par value CHF 0.10 0.10 0.10 0.10 0.10
High CHF 97.10 120.00 103.00 80.00 175.00
Low CHF 61.25 59.00 73.10 36.05 48.95
Closing price on 31.12. CHF 71.00 68.75 102.00 72.00 53.90
1) Revenues: net sales + other operating income. 2) Equity attributable to equity holders of the parent company. 3) Calculated on the basis of average headcount. 4) Changes resulting from the exercising of option rights.
116

0336008
Forward-looking statementsThe present Annual Report contains forward-looking statements in relation to Komax which are based on current assumptions and expectations. Unfore- seeable events and developments could cause actual results to differ ma- terially from those anticipated. Exam-ples include: changes in the economic and legal environment, the outcome of legal disputes, exchange rate fluctu-ations, unexpected market behaviour on the part of our competitors, negative publicity, and the departure of mem-bers of management. The forward-looking statements are pure assump-tions, made on the basis of information that is currently available. This Annual Report is available in English and Ger-man. The original German version is binding.
Imprint
Published by: Komax Holding AG, Dierikon
Concept and realisation: Linkgroup, Zurich www.linkgroup.ch Publishing platform/PublishingSuite® Linkgroup, Zurich www.linkgroup.ch Steiner Communications, Zurich/Uitikon www.steinercom.ch
Illustrations: Corinna Staffe, Lyon www.corinnastaffe.com
Portraits: Bernd Schifferdecker, Stuttgart www.berndschifferdecker.com
Produced on a climate-neutral basis by Linkgroup.
Komax Holding AGInvestor Relations and Corporate Communications Marco KnuchelIndustriestrasse 6CH-6036 DierikonPhone +41 41 455 06 [email protected]
Financial calendar
Annual General Meeting 3 May 2013
Dividend payment 10 May 2013
Half-year results 2013 20 August 2013
First information on the year 2013 21 January 2014
Annual media conference/analysts’ presentation
26 March 2014
Annual General Meeting 7 May 2014
Komax Holding AGIndustriestrasse 6CH-6036 DierikonSwitzerland
Phone +41 41 455 04 55www.komaxgroup.com T
he
wa
y T
o m
ak
e i
T
k
om
ax
an
nu
al R
ep
ort
201
2