aquifer material balance wabamun area co s … material balances.pdf · aquifer material balance...
TRANSCRIPT

Energy and Environmental Systems Group
Institue for Sustainable Energy, Environment and Economy (ISEEE)
Aquifer Material Balance
WABAMUN AREA CO2
SEQUESTRATION PROJECT (WASP)
Author Rob Lavoie
Rev. Date Description Prepared by
1 August 3, 2009 Nisku Oil Pool Aquifer Material Balance Analysis Rob Lavoie
2 December 21, 2009 Nisku Oil Pool Aquifer Material Balance Analysis Rob Lavoie

Wabamun Area CO2 Sequestration Project (WASP) Page 2 of 25
Aquifer Material Balance
Table of Contents
INTRODUCTION ........................................................................................................................................... 5
BACKGROUND ............................................................................................................................................ 5
DISCUSSION ................................................................................................................................................ 6
1. Study Approach ........................................................................................................................................ 6
2. Paleogeography Of The WASP Study Area ............................................................................................ 7
3. Reservoir Data ......................................................................................................................................... 9
4. Material Balance Results ....................................................................................................................... 10 4.1 Acheson D2-A and D2-B Pools ...................................................................................................... 10 4.2 Golden Spike D2A .......................................................................................................................... 13 4.3 Golden Spike D2B .......................................................................................................................... 16 4.4 Leduc Woodbend D2A and D2B Pools .......................................................................................... 18
CONCLUSIONS .......................................................................................................................................... 23
REFERENCES ............................................................................................................................................ 24
APPENDIX 1 ............................................................................................................................................... 25
Wabamun Area CO2 Sequestration Project (WASP) Page 3 of 25
Aquifer Material Balance
List of Tables
Table 1: Data summary for Acheson D2-A pool. ........................................................................................ 11
Table 2: Data summary for Golden Spike D2-A pool. ................................................................................. 13
Table 3: Data summary for Golden Spike D2-B pool. ................................................................................. 16
Table 4: Data summary for Leduc Woodbend D2-A pool. .......................................................................... 18
Table 5: Data summary for Leduc Woodbend D2-B pool. .......................................................................... 19

Wabamun Area CO2 Sequestration Project (WASP) Page 4 of 25
Aquifer Material Balance
List of Figures
Figure 1: WASP study area........................................................................................................................... 5
Figure 2: Water disposal well study area. ..................................................................................................... 6
Figure 3: WASP study area........................................................................................................................... 8
Figure 4: Cross section of the Nisku aquifer and adjacent stratigraphy (Reference 3). ............................... 9
Figure 5: Location of Acheson D2-A Pool. .................................................................................................. 10
Figure 6: Acheson D2-A pool production, injection, and pressure versus time history. ............................. 12
Figure 7: Acheson D2-A pool pressure versus time history. ....................................................................... 12
Figure 8: Location of Golden Spike D2-A. .................................................................................................. 13
Figure 9: Golden Spike D2-A pressure, production, and injection history. ................................................. 14
Figure 10: Golden Spike D2-A material balance history match. ................................................................. 14
Figure 11: Golden Spike D2-A mapping of aquifer shape and size. ........................................................... 15
Figure 12: Golden Spike D2-B pressure, production, and injection history. ............................................... 16
Figure 13: Golden Spike D2-B pressure, production, and injection history. ............................................... 17
Figure 14: Golden Spike D2-B pressure, production, and injection history. ............................................... 17
Figure 15: Leduc Woodbend D2-A pressure history. .................................................................................. 19
Figure 16: Leduc Woodbend D2-A production history (post 1961)............................................................. 20
Figure 17: Leduc Woodbend D2-A injection history (post 1961). ............................................................... 21
Figure 18: Leduc Woodbend D2-B pressure history. .................................................................................. 21
Figure 19: Leduc Woodbend D2-B production history (post 1961)............................................................. 22
Figure 20: Leduc Woodbend D2-B injection history (post 1961). ............................................................... 23

Wabamun Area CO2 Sequestration Project (WASP) Page 5 of 25
Aquifer Material Balance
INTRODUCTION
BACKGROUND
One of the most useful methods of characterizing the quality of a reservoir for its deliverability or
injectivity on a regional scale is to make use of analogues from similar or adjacent areas to the area
of study. Furthermore, material balance analysis on analogue pools or wells can be conducted to
characterize the aquifer that is providing pressure support for them. Moreover, material balance
analysis is capable of characterising a very large area of investigation, if an oil or gas pool has been
on depletion drive for an extended period of time. The Wabamun Area CO2 Sequestration Project
(WASP) study area is an entire 53 township of land area over top of a large portion of the Nisku
aquifer in central Alberta, Figure 1. This study area was chosen intentionally to avoid existing
hydrocarbon production. As such, there are no depleted pools or mature oil fields producing from
the Nisku horizon in the entire study area.
Figure 1: WASP study area.
Wabamun Area CO2 Sequestration Project (WASP) Page 6 of 25
Aquifer Material Balance
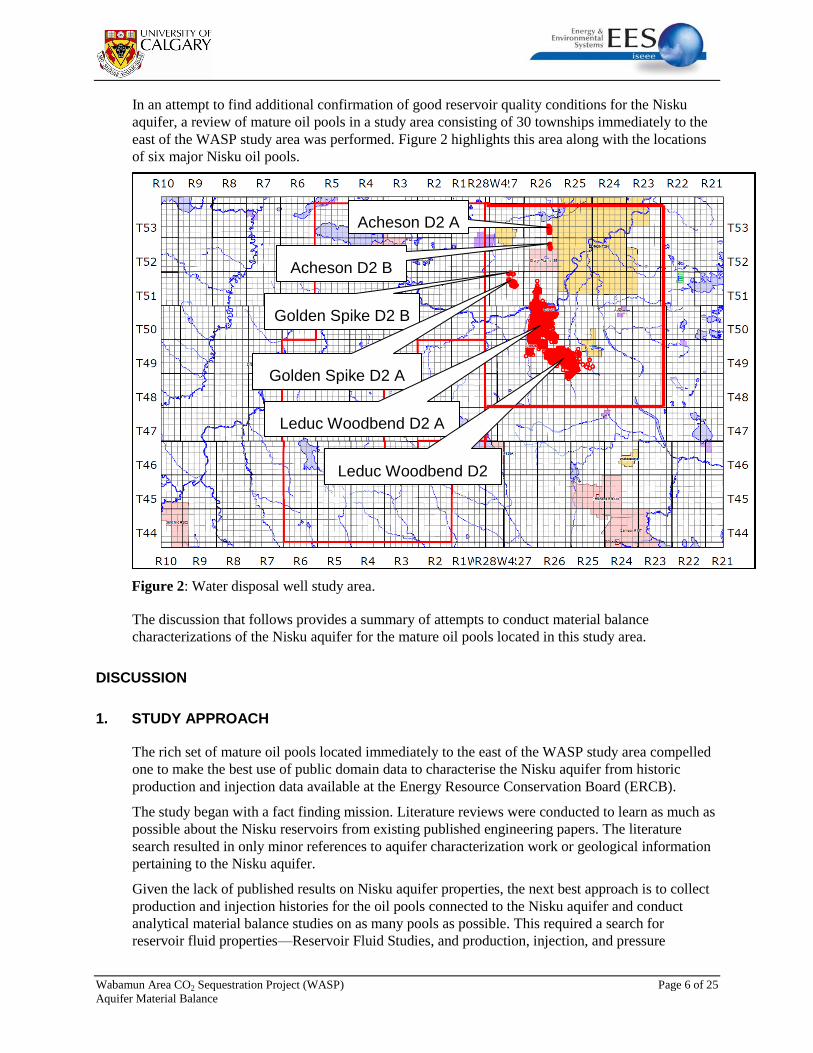
In an attempt to find additional confirmation of good reservoir quality conditions for the Nisku
aquifer, a review of mature oil pools in a study area consisting of 30 townships immediately to the
east of the WASP study area was performed. Figure 2 highlights this area along with the locations
of six major Nisku oil pools.
Figure 2: Water disposal well study area.
The discussion that follows provides a summary of attempts to conduct material balance
characterizations of the Nisku aquifer for the mature oil pools located in this study area.
DISCUSSION
1. STUDY APPROACH
The rich set of mature oil pools located immediately to the east of the WASP study area compelled
one to make the best use of public domain data to characterise the Nisku aquifer from historic
production and injection data available at the Energy Resource Conservation Board (ERCB).
The study began with a fact finding mission. Literature reviews were conducted to learn as much as
possible about the Nisku reservoirs from existing published engineering papers. The literature
search resulted in only minor references to aquifer characterization work or geological information
pertaining to the Nisku aquifer.
Given the lack of published results on Nisku aquifer properties, the next best approach is to collect
production and injection histories for the oil pools connected to the Nisku aquifer and conduct
analytical material balance studies on as many pools as possible. This required a search for
reservoir fluid properties—Reservoir Fluid Studies, and production, injection, and pressure
Acheson D2 A
Acheson D2 B
Golden Spike D2 B
Golden Spike D2 A
Leduc Woodbend D2 A
Leduc Woodbend D2 B

Wabamun Area CO2 Sequestration Project (WASP) Page 7 of 25
Aquifer Material Balance
histories on these pools, as well as basic volumetric reserves information for each pool. All of this
was available in the ERCB archives.
The reservoir fluid study information, along with production, injection, and pressure histories were
entered into Petroleum Expert’s MBAL™ application (Reference 1). This application has a rich set
of analytical aquifers that can be used to history match the aquifer response to pressure depletion in
an oil or gas pool.
Although not all of the pools were easily history matched for a number of reasons discussed in this
report, there was an adequate amount of public domain data and results were conclusive enough to
make some useful conclusions on aquifer strength, as discussed in the conclusions section of this
report.
2. PALEOGEOGRAPHY OF THE WASP STUDY AREA
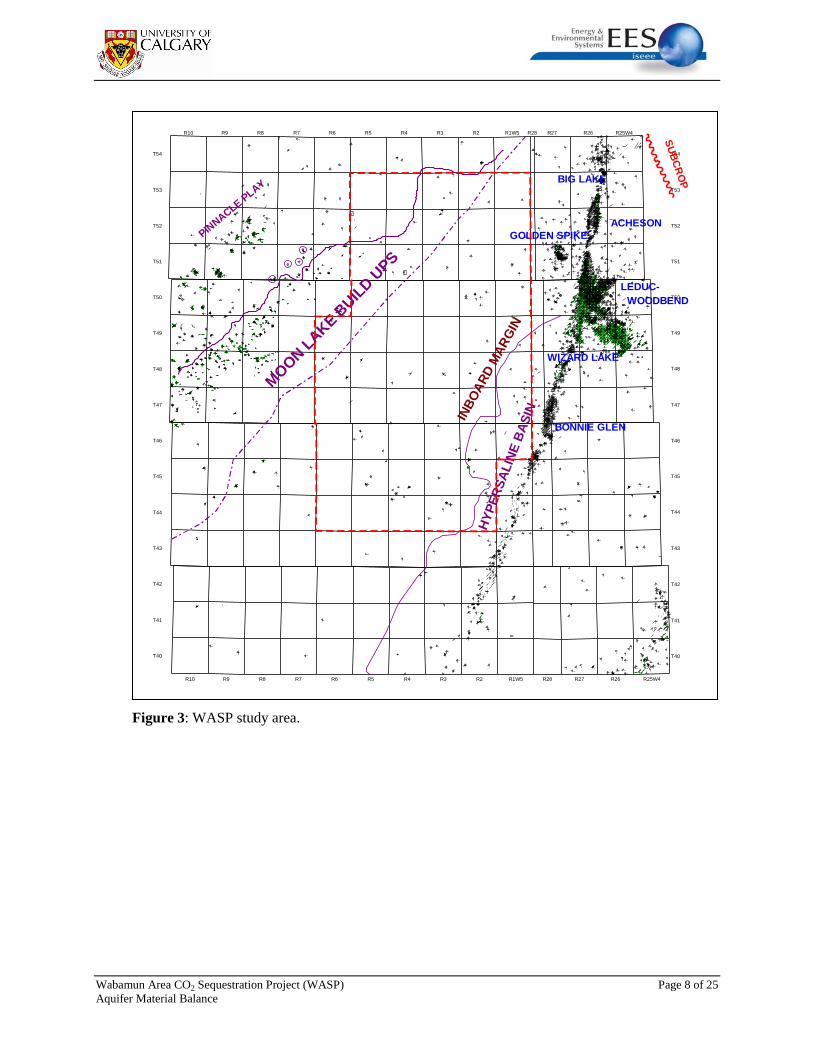
The red outline in Figure 3 defines the location of the WASP study area. It is located between the
Moon Lake Build-ups on the west side and the inboard margin of the Nisku aquifer on the east side.
A series of Nisku oil pools extends down the eastern edge of the Nisku aquifer. In fact these oil
accumulations are Nisku carbonate reefs that are draping over top of the underlying Leduc D3
reefs. As can be seen in Figure 3 the Nisku pools of interest range from the Big Lake pool in the
extreme north down to the Bonnie Glen Pool to the south. Also observable on this diagram is the
fact that the inboard margin intersects this trend of Nisku pools at about the level of the Leduc
Woodbend pools. This means that pools to the south of Leduc Woodbend D2-A and D2-B will be
less well connected to the Nisku aquifer and are less analogous to the type of Nisku reservoir of
interest for the WASP study.
Figure 4 provides a cross section of the stratigraphy above and below the Nisku formation. From
this diagram it is evident that the Nisku aquifer is located both underneath as bottom water and
laterally as edge water to the Nisku oil accumulations. This should provide some indication to the
type of analytical aquifer that might best be used to achieve a history match of pressure depletion
for oil pools connected to the Nisku aquifer.
Wabamun Area CO2 Sequestration Project (WASP) Page 8 of 25
Aquifer Material Balance
Figure 3: WASP study area.
T40
T41
T42
T43
T44
T45
T46
T47
T48
T49
T50
T51
T52
T53
T54
T40
T41
T42
T43
T44
T45
T46
T47
T48
T49
T50
T51
T52
T53
T54
R25W4R26R27R28R1W5R2R3R4R5R6R7R8R9R10
R25W4R26R27R28R1W5R2R3R4R5R6R7R8R9R10
BIG LAKE
LEDUC-
WIZARD LAKE
WOODBEND
ACHESON
GOLDEN SPIKE
BONNIE GLEN
PINNACLE P
LAY
MO
ON L
AKE B
UIL
D U
PS
HY
PE
RS
AL
INE
BA
SININB
OA
RD
MA
RG
IN
SU
BC
RO
P

Wabamun Area CO2 Sequestration Project (WASP) Page 9 of 25
Aquifer Material Balance
Figure 4: Cross section of the Nisku aquifer and adjacent stratigraphy (Reference 3).
3. RESERVOIR DATA
The following public-domain data are available for the Nisku oil pools:
a. Reservoir Parameters
b. Reserves
c. Production
d. Injection
e. Fluid Studies—i.e., PVT Reports
Tables containing pool reserves data and fluid properties for each of the studied pools are included
in Appendix 1.
Nisku Aquifer
Nisku Oil Accumulations, Draping over the Leduc D3 Pools
Wabamun Area CO2 Sequestration Project (WASP) Page 10 of 25
Aquifer Material Balance
4. MATERIAL BALANCE RESULTS
The following discussion is a pool by pool account of the results in an attempt to match production
and pressure histories with an analytical aquifer model that best simulates the observed pool
response. The discussions are more or less complete, depending on availability of data from the
ERCB and other difficulties described for each pool.
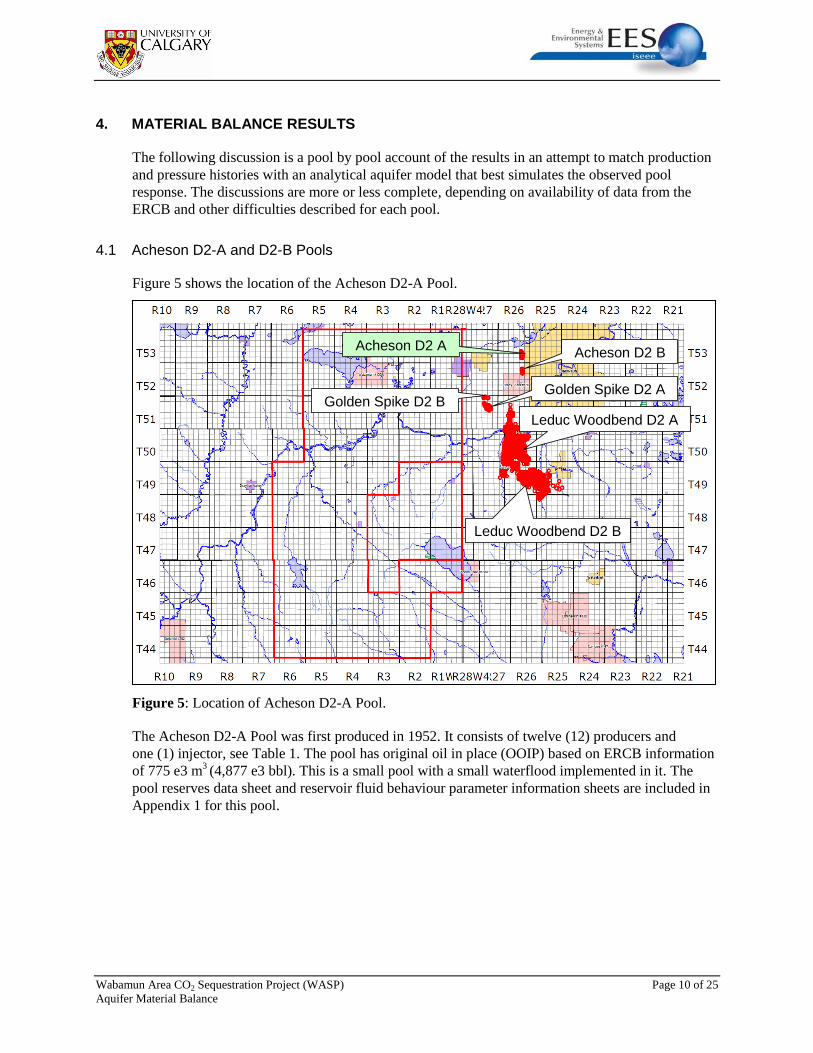
4.1 Acheson D2-A and D2-B Pools
Figure 5 shows the location of the Acheson D2-A Pool.
Acheson D2 AAcheson D2 B
Golden Spike D2 BGolden Spike D2 A
Leduc Woodbend D2 A
Leduc Woodbend D2 B
Acheson D2 AAcheson D2 B
Golden Spike D2 BGolden Spike D2 A
Leduc Woodbend D2 A
Leduc Woodbend D2 B
Figure 5: Location of Acheson D2-A Pool.
The Acheson D2-A Pool was first produced in 1952. It consists of twelve (12) producers and
one (1) injector, see Table 1. The pool has original oil in place (OOIP) based on ERCB information
of 775 e3 m3 (4,877 e3 bbl). This is a small pool with a small waterflood implemented in it. The
pool reserves data sheet and reservoir fluid behaviour parameter information sheets are included in
Appendix 1 for this pool.

Wabamun Area CO2 Sequestration Project (WASP) Page 11 of 25
Aquifer Material Balance
Table 1: Data summary for Acheson D2-A pool.
Description Pool Characteristics
Depth 1395.1 m
Area 486 ha (1201 acres)
Number of Producers 12
Number of Brine Injectors 1
Net Pay 8.17 m
Porosity 3.4%
API Gravity 38 deg API
Initial Pressure 10,994 kPa (1,595 psi)
Temperature 57 deg C
OOIP 775 e3 m3 (4,877 e3 bbl)
Initial OOIP Recovered 60.5%
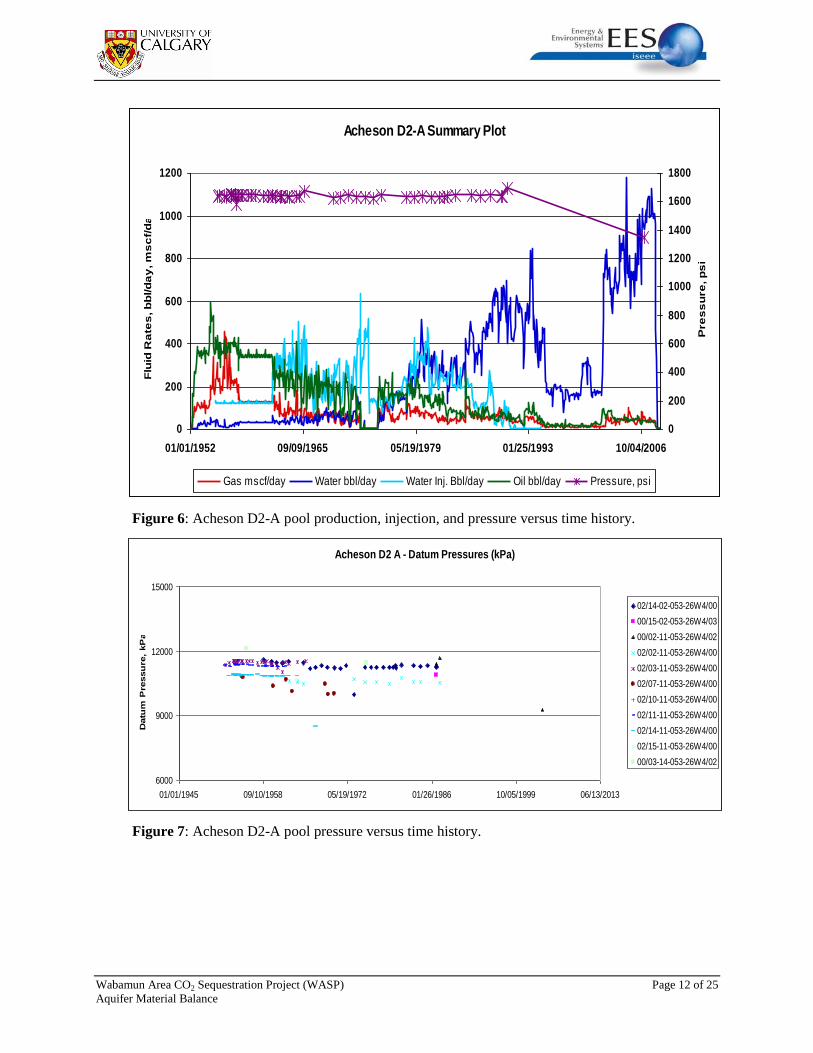
A plot of the production, water injection, and average pressure versus time history for the pool is
provided in Figure 6. More detailed pressure data for individual wells in the pool is provided in
Figure 7. As can be seen in both of these plots, although substantial production of both water and
oil took place from this pool beginning in the early 1950s and extending until the early 1990s, the
pressure decline was minimal.
As a result of the minimal pressure decline experienced in this pool, it was not possible to perform
a material balance history match since this pressure response leads to the calculation of an infinite
sized aquifer providing pressure support. There are two possible reasons for this kind of outcome:
Scenario 1 Pool size is small relative to the size of the attached aquifer. In this scenario, the
aquifer associated with the Acheson D2-A Pool is large compared with the pool
itself. With an OOIP of less than 5 million barrels, this pool is not large
compared to other Alberta oil pools and this could very much be the reason for
such a small pressure decline. The total off-take from this pool may not have
been large enough to have produced a significant pressure decline in the larger
aquifer.
Scenario 2 The aquifer attached to this pool is very large. It may be true that the Nisku
aquifer is very large and that the minimal pressure decline is truly the result of an
“infinite” aquifer response. In this case, the accuracy of the material balance
approach is limited in terms of being able to accurately determine just how large
the aquifer is relative to the size of the producing entity.
For the reasons described above, it was not possible to place a definitive size on the aquifer
attached to the Acheson D2-A pool. The only conclusion that can be made is that the aquifer is very
much larger than the oil pool.
The Acheson D2-B pool is even smaller than the D2-A pool at 49 e3 m3 (308 e3 bbl). The pressure
decline is also minimal and similar material balance history matching difficulties were encountered.
The only conclusion relative to aquifer size attached to the D2-B pool is similar to that for the D2-A
pool, the aquifer is large relative to the size of these oil accumulations.
Wabamun Area CO2 Sequestration Project (WASP) Page 12 of 25
Aquifer Material Balance
Figure 6: Acheson D2-A pool production, injection, and pressure versus time history.
Figure 7: Acheson D2-A pool pressure versus time history.
Acheson D2-A Summary Plot
0
200
400
600
800
1000
1200
01/01/1952 09/09/1965 05/19/1979 01/25/1993 10/04/2006
Flu
id R
ate
s, b
bl/d
ay
, m
sc
f/d
ay
0
200
400
600
800
1000
1200
1400
1600
1800
Pre
ss
ure
, p
si
Gas mscf/day Water bbl/day Water Inj. Bbl/day Oil bbl/day Pressure, psi
Acheson D2 A - Datum Pressures (kPa)
6000
9000
12000
15000
01/01/1945 09/10/1958 05/19/1972 01/26/1986 10/05/1999 06/13/2013
Datu
m P
ressu
re,
kP
a
02/14-02-053-26W4/00
00/15-02-053-26W4/03
00/02-11-053-26W4/02
02/02-11-053-26W4/00
02/03-11-053-26W4/00
02/07-11-053-26W4/00
02/10-11-053-26W4/00
02/11-11-053-26W4/00
02/14-11-053-26W4/00
02/15-11-053-26W4/00
00/03-14-053-26W4/02

Wabamun Area CO2 Sequestration Project (WASP) Page 13 of 25
Aquifer Material Balance
4.2 Golden Spike D2A
The Golden Spike D2-A pool is located directly south west of the Acheson pools as seen in
Figure 8. A summary of pool parameters for Golden Spike D2-A is provided below. This is a much
larger pool that the Acheson pools.
Table 2: Data summary for Golden Spike D2-A pool.
Description Pool Characteristics
Depth 1543.7 m
Area 769 ha (1900 acres)
Number of Producers 16
Number of Brine Injectors 4
Net Pay 13 m
Porosity 5.7%
API Gravity 37 deg API
Initial Pressure 12,422 kPa (1,802 psi)
Temperature 61 deg C
OOIP 2804 e3 m3 (17,645 e3 bbl)
Initial OOIP Recovered 14.5%
Acheson D2 AAcheson D2 B
Golden Spike D2 BGolden Spike D2 A
Leduc Woodbend D2 A
Leduc Woodbend D2 B
Acheson D2 AAcheson D2 B
Golden Spike D2 BGolden Spike D2 A
Leduc Woodbend D2 A
Leduc Woodbend D2 B
Figure 8: Location of Golden Spike D2-A.

Wabamun Area CO2 Sequestration Project (WASP) Page 14 of 25
Aquifer Material Balance
The pressure and production history for the Golden Spike D2-A Pool is provided in Figure 9. This
figure illustratates a very pronounced pressure decline followed by a repressurization shortly after
the initiation of a waterflood scheme in 1965.
Golden Spike D2-A Summary Plot
0
500
1000
1500
2000
2500
3000
3500
4000
4500
5000
01/01/1951 09/09/1964 05/19/1978 01/26/1992 10/04/2005
Flu
id R
ate
s, b
bl/d
ay
, m
sc
f/d
ay
1250
1350
1450
1550
1650
1750
1850
1950
2050
Pre
ss
ure
, p
si
Gas mscf/day Water bbl/day Water Inj. Bbl/day Oil bbl/day Pressure, psi
Figure 9: Golden Spike D2-A pressure, production, and injection history.
Figure 10: Golden Spike D2-A material balance history match.
The significant pressure decline observed in the early years of producing this pool enables a very
accurate pressure match using a radial aquifer with an outer to inner dimension ratio of 4.4. The
Hurst-van Everdingen-Modified aquifer model was used to achieve this match. As can be seen in
Figure 10, the simulated pressure response without aquifer support (the red line) would have been
much different than that observed (the black symbols). From the quality of this match (the blue
line) we can state with a high degree of accuracy that the selected aquifer model is a good
approximation of the type and size of aquifer associated with the Golden Spike D2-A Pool.

Wabamun Area CO2 Sequestration Project (WASP) Page 15 of 25
Aquifer Material Balance
The reservoir pore volume calculated by the simulator is 4.66 e6 m3 (29.3 e6 bbl), while the aquifer
volume is 85.5 e6 m3 (538 e6 bbl). This is a reservoir to aquifer ratio of 18.4. The oil reservoir
radius is about 1,564 m (5,133 ft.). Assuming the aquifer exposure angle is 180 degrees and
assuming an aquifer tank thickness of 22.8 m (75 ft.) and permeability of 23 md, it is possible to
calculate the radius of the aquifer connected to this pool to be about 7,010 m (23,000 ft.). Figure 11
illustrates this shape relative to the Golden Spike D2-A Pool. This calculated aquifer geometry
indicates how much of the Nisku aquifer the Golden Spike D2-A Pool is exposed to. It does not
conclusively demonstrate the extent of the larger aquifer itself.
Acheson D2 AAcheson D2 B
Golden Spike D2 BGolden Spike D2 A
Leduc Woodbend D2 A
Leduc Woodbend D2 B
Acheson D2 AAcheson D2 B
Golden Spike D2 BGolden Spike D2 A
Leduc Woodbend D2 A
Leduc Woodbend D2 B
Acheson D2 AAcheson D2 B
Golden Spike D2 BGolden Spike D2 A
Leduc Woodbend D2 A
Leduc Woodbend D2 B
Figure 11: Golden Spike D2-A mapping of aquifer shape and size.

Wabamun Area CO2 Sequestration Project (WASP) Page 16 of 25
Aquifer Material Balance
4.3 Golden Spike D2B
The Golden Spice D2-B Pool is considerably smaller than the Golden Spike D2-A Pool. Table 3
provides the basic pool datea for this pool. The OOIP value of 356 e3 m3 or 2.2 million bbls
suggests that this pool is in the size category of the Acheson pools.
Table 3: Data summary for Golden Spike D2-B pool.
Description Pool Characteristics
Depth 1556.2 m
Area 173 ha (427 acres)
Number of Producers 4
Number of Brine Injectors 1
Net Pay 4 m
Porosity 7.8%
API Gravity 37 deg API
Initial Pressure 12,395 kPa (1,798 psi)
Temperature 61 deg C
OOIP 356 e3 m3 (2,240 e3 bbl)
Initial OOIP Recovered 15%
Pressure data recorded for the Golden Spike D2-B pool is less complete that for the D2-A pool but
since early time pressures were available, it was possible to perform a material balance analysis.
Figure 12 provides the pressure, production and injection history for this pool.
Golden Spike D2-B Summary Plot
0
50
100
150
200
250
01/01/1951 09/09/1964 05/19/1978 01/26/1992 10/04/2005
Flu
id R
ate
s, b
bl/d
ay
, m
sc
f/d
ay
1250
1350
1450
1550
1650
1750
1850
Pre
ss
ure
, p
si
Gas mscf/day Water bbl/day Water Inj. Bbl/day Oil bbl/day Pressure, psi
Figure 12: Golden Spike D2-B pressure, production, and injection history.
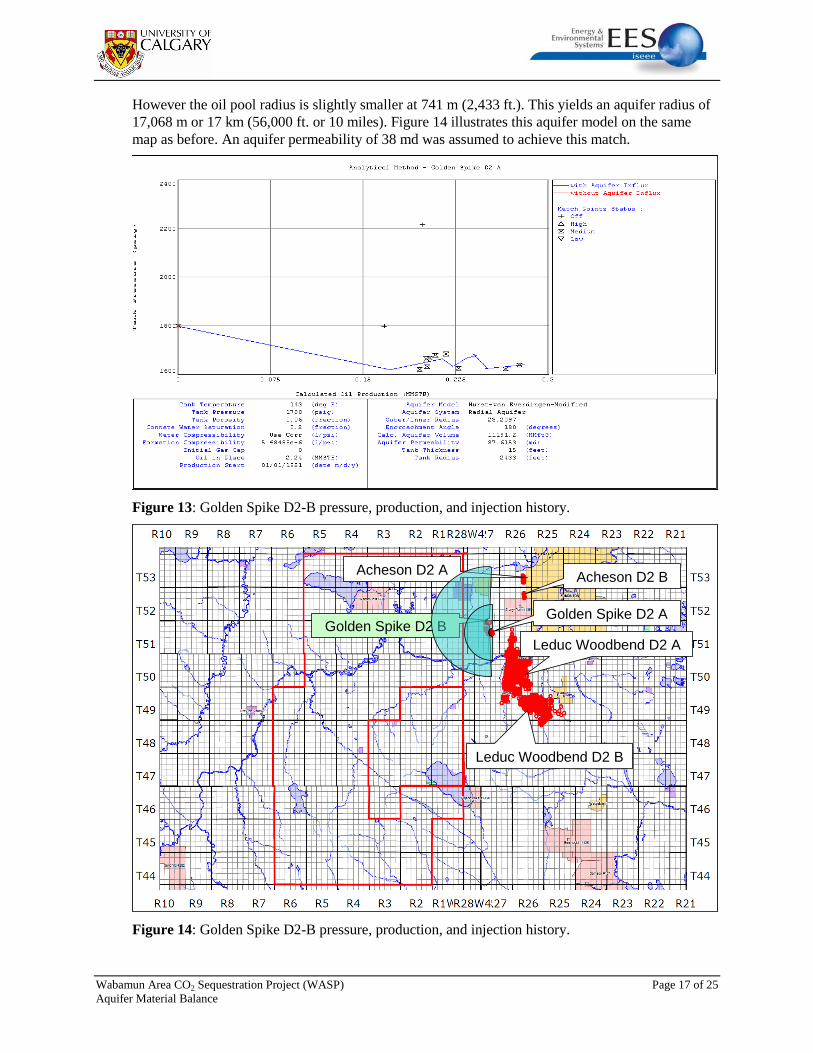
A material balance history match was obtained using the same analytical radial model as was used
for the D2-A pool. This time the dimensionless outer to inner radius value was 23.2 (Figure 13).
Wabamun Area CO2 Sequestration Project (WASP) Page 17 of 25
Aquifer Material Balance
However the oil pool radius is slightly smaller at 741 m (2,433 ft.). This yields an aquifer radius of
17,068 m or 17 km (56,000 ft. or 10 miles). Figure 14 illustrates this aquifer model on the same
map as before. An aquifer permeability of 38 md was assumed to achieve this match.
Figure 13: Golden Spike D2-B pressure, production, and injection history.
Acheson D2 AAcheson D2 B
Golden Spike D2 BGolden Spike D2 A
Leduc Woodbend D2 A
Leduc Woodbend D2 B
Acheson D2 AAcheson D2 B
Golden Spike D2 BGolden Spike D2 A
Leduc Woodbend D2 A
Leduc Woodbend D2 B
Acheson D2 AAcheson D2 B
Golden Spike D2 BGolden Spike D2 A
Leduc Woodbend D2 A
Leduc Woodbend D2 B
Figure 14: Golden Spike D2-B pressure, production, and injection history.
Wabamun Area CO2 Sequestration Project (WASP) Page 18 of 25
Aquifer Material Balance
As can be seen from Figure 14, the Golden Spike D2-B aquifer solution suggests a larger radius
aquifer than for the D2-A pool. This outcome must be tempered by the fact that the D2-B pool is
significantly smaller than the D2-A pool and as such it does not enable as highly accurate a results
for materal balance matchhing purposes as was possible for the D2-A pool.
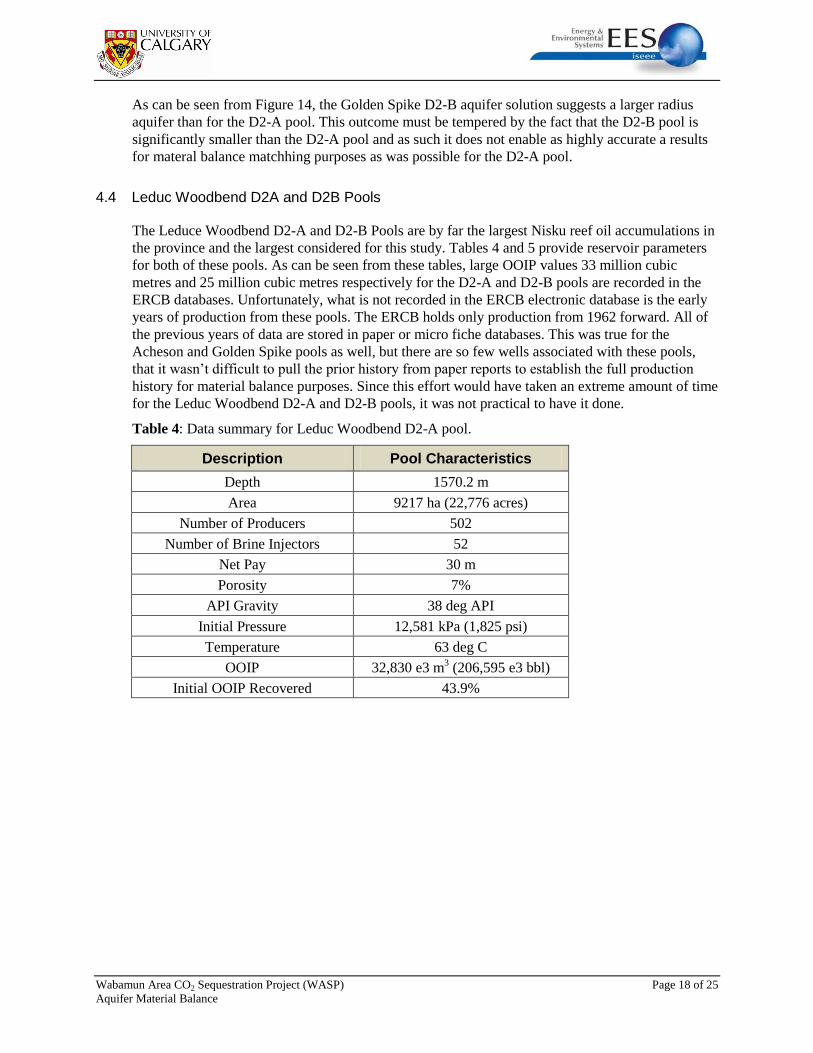
4.4 Leduc Woodbend D2A and D2B Pools
The Leduce Woodbend D2-A and D2-B Pools are by far the largest Nisku reef oil accumulations in
the province and the largest considered for this study. Tables 4 and 5 provide reservoir parameters
for both of these pools. As can be seen from these tables, large OOIP values 33 million cubic
metres and 25 million cubic metres respectively for the D2-A and D2-B pools are recorded in the
ERCB databases. Unfortunately, what is not recorded in the ERCB electronic database is the early
years of production from these pools. The ERCB holds only production from 1962 forward. All of
the previous years of data are stored in paper or micro fiche databases. This was true for the
Acheson and Golden Spike pools as well, but there are so few wells associated with these pools,
that it wasn’t difficult to pull the prior history from paper reports to establish the full production
history for material balance purposes. Since this effort would have taken an extreme amount of time
for the Leduc Woodbend D2-A and D2-B pools, it was not practical to have it done.
Table 4: Data summary for Leduc Woodbend D2-A pool.
Description Pool Characteristics
Depth 1570.2 m
Area 9217 ha (22,776 acres)
Number of Producers 502
Number of Brine Injectors 52
Net Pay 30 m
Porosity 7%
API Gravity 38 deg API
Initial Pressure 12,581 kPa (1,825 psi)
Temperature 63 deg C
OOIP 32,830 e3 m3 (206,595 e3 bbl)
Initial OOIP Recovered 43.9%

Wabamun Area CO2 Sequestration Project (WASP) Page 19 of 25
Aquifer Material Balance
Table 5: Data summary for Leduc Woodbend D2-B pool.
Description Pool Characteristics
Depth 1601.3 m
Area 7106 ha (17,559 acres)
Number of Producers 250
Number of Brine Injectors 35
Net Pay 14.3 m
Porosity 5%
API Gravity 38 deg API
Initial Pressure 12,834 kPa (1,861 psi)
Temperature 60 deg C
OOIP 24,606 e3 m3 (151,406 e3 bbl)
Initial OOIP Recovered 13.8%
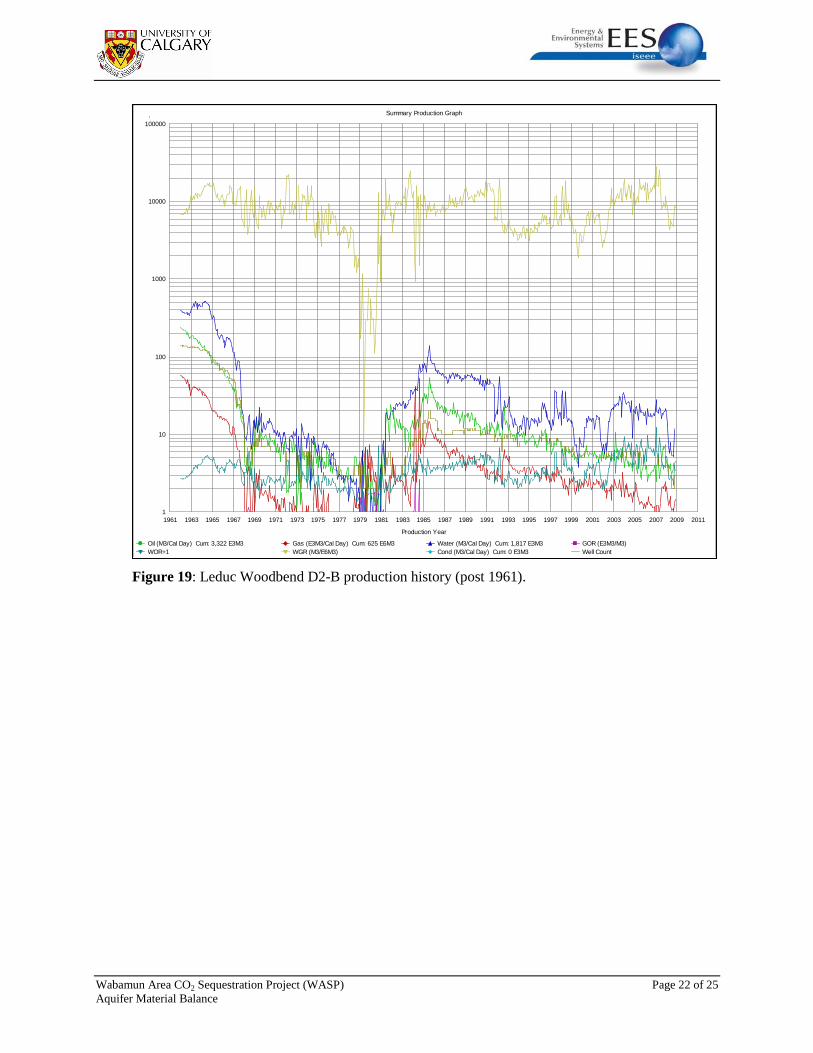
Since practical material balance analysis for the Leduc Woodbend pools was not possible, due to
missing data, only a review of the production and pressure response data was possible. By
inference, a review of the pressure histories in Figure 15 and 18 along with the production and
injection data (post 1961) in Figures 16,17 and 19, 20 for the D2-A and D2-B pools, respectively,
suggests that the aquifer strength associated with the Leduc Woodbend pools is similar to that
observed for the Golden Spike Pools.
Leduc Wood Bend D2-A Datum Pressure (kPa)
0
3000
6000
9000
12000
15000
01/01/1945 09/10/1958 05/19/1972 01/26/1986 10/05/1999 06/13/2013
Pre
ssu
re,
kP
a
Figure 15: Leduc Woodbend D2-A pressure history.

Wabamun Area CO2 Sequestration Project (WASP) Page 20 of 25
Aquifer Material Balance
Oil (M3/Cal Day) Cum: 14,423 E3M3 Gas (E3M3/Cal Day) Cum: 3,115 E6M3 Water (M3/Cal Day) Cum: 4,901 E3M3 GOR (E3M3/M3)
WOR+1 WGR (M3/E6M3) Cond (M3/Cal Day) Cum: 0 E3M3 Well Count
1
10
100
1000
10000
100000
1961 1963 1965 1967 1969 1971 1973 1975 1977 1979 1981 1983 1985 1987 1989 1991 1993 1995 1997 1999 2001 2003 2005 2007 2009 2011
Summary Production GraphSummary Production Graph
Production Year
Figure 16: Leduc Woodbend D2-A production history (post 1961).

Wabamun Area CO2 Sequestration Project (WASP) Page 21 of 25
Aquifer Material Balance
Water Injection (M3/Cal Day) Cum: 17,353 E3M3 Gas Injection (E3M3/Cal Day) Cum: 333 E6M3
Steam Injection (M3/Cal Day) Cum: 0 E3M3 Wells
1
10
100
1000
10000
100000
1961 1963 1965 1967 1969 1971 1973 1975 1977 1979 1981 1983 1985 1987 1989 1991 1993 1995 1997 1999 2001 2003 2005 2007 2009 2011
SummarySummary
Year
Figure 17: Leduc Woodbend D2-A injection history (post 1961).
Datum Pressure (kPa)
0
3000
6000
9000
12000
15000
01/01/1945 09/10/1958 05/19/1972 01/26/1986 10/05/1999 06/13/2013
Figure 18: Leduc Woodbend D2-B pressure history.
Wabamun Area CO2 Sequestration Project (WASP) Page 22 of 25
Aquifer Material Balance
Oil (M3/Cal Day) Cum: 3,322 E3M3 Gas (E3M3/Cal Day) Cum: 625 E6M3 Water (M3/Cal Day) Cum: 1,817 E3M3 GOR (E3M3/M3)
WOR+1 WGR (M3/E6M3) Cond (M3/Cal Day) Cum: 0 E3M3 Well Count
1
10
100
1000
10000
100000
1961 1963 1965 1967 1969 1971 1973 1975 1977 1979 1981 1983 1985 1987 1989 1991 1993 1995 1997 1999 2001 2003 2005 2007 2009 2011
Summary Production GraphSummary Production Graph
Production Year
Figure 19: Leduc Woodbend D2-B production history (post 1961).

Wabamun Area CO2 Sequestration Project (WASP) Page 23 of 25
Aquifer Material Balance
Water Injection (M3/Cal Day) Cum: 3,383 E3M3 Gas Injection (E3M3/Cal Day) Cum: 0 E6M3
Steam Injection (M3/Cal Day) Cum: 0 E3M3 Wells
1
10
100
1000
10000
100000
1961 1963 1965 1967 1969 1971 1973 1975 1977 1979 1981 1983 1985 1987 1989 1991 1993 1995 1997 1999 2001 2003 2005 2007 2009 2011
SummarySummary
Year
Figure 20: Leduc Woodbend D2-B injection history (post 1961).
CONCLUSIONS
Conclusions relative to aquifer strength, permeability, and size (radius), for the Nisku oil fields
directly to the east of the WASP study are as follows:
The Nisku aquifer can generally be classified as a “strong aquifer” with some variability in
connectivity depending on location.
Strong connections exist for distances ranging from a few kilometres to tens of kilometres.
Weak connections may exist but this is, as yet, inconclusive.
Average permeability is in the order of 10 to 40 md.

Wabamun Area CO2 Sequestration Project (WASP) Page 24 of 25
Aquifer Material Balance
REFERENCES
1. Bob Michenson, Public Knowledge, “Oil and Gas Reserves Database”, Version 2008 1.01.
2. Petroleum Experts Ltd. “MBAL Reservoir Analytical Simulation”, Version 8.
3. Geological Survey of Canada, 1981.

Wabamun Area CO2 Sequestration Project (WASP) Page 25 of 25
Aquifer Material Balance
APPENDIX 1
Table Number Table Name
1 Acheson D2-A Reserve Report
2 Acheson D2-B Reserve Report
3 Golden Spike D2-A Reserve Report
4 Golden Spike D2-B Reserve Report
5 Leduc Woodbend D2-A Reserve Report
6 Leduc Woodbend D2-B Reserve Report
7 Acheson Flash Corrected PVT Data
8 Golden Spike Flash Corrected PVT Data

Field Code : 9
Field Name : ACHESON
Pool Code : 696001
Pool Name : D-2 A
Field Location : 053-26W4
Discovery Year : 1952
Pool Type : Primary
Light-Medium OilPool Class :
OIL RESERVES Detailed Report Database Date:
Dec. 31, 2007
Initial OIP Volume: 775
Primary Recovery Factor: 0.615
Enhanced Recovery Factor: 0.000
Primary Initial Reserves: 477.0
Enhanced Initial Reserves: 0.0
Total Initial Reserves: 477.0
Cumulative Production: 468.7
Remaining Reserves: 8.3
Area: 486
Net Pay: 8.17
Porosity: 0.034
Water Saturation: 0.3
Shrinkage: 0.82
Mean Formation Depth: 1395.1
Oil Density: 834.3
Solution Gas Oil Ratio: 64
Initial Pressure 10,994
Temperature: 57
Remarks: 2007-10 GPP
Datum Elevation: -689.2
KB (reference elevation): 705.9
Volume: 3971
Initial OIP Recovered: 0.605
m
m
m
ha
m
e4 m3
kg/m3
kPa
deg C
e3 m3
e3 m3
e3 m3
e3 m3
e3 m3
e3 m3
Metric Imperial
ft
ft
ft
acres
ft
3.4
30.0
82.0
38.10
2316
4577
-2261
1201
26.8
361
1,595 psi
4877
61.5
0.0
3002
0
3002
2949
52
60.5
e3 bbl
e3 bbl
e3 bbl
e3 bbl
e3 bbl
e3 bbl
deg F135
32190 acre ft
deg API
m3/m3 SCF/Bbl
38.10 deg API
52.1 lbs/SCF
API Gravity:
%
%
%
%
%
%
Tuesday, August 04, 2009 Page 1 of 1

Field Code : 9
Field Name : ACHESON
Pool Code : 696002
Pool Name : D-2 B
Field Location : 053-26W4
Discovery Year : 1952
Pool Type : Primary
Light-Medium OilPool Class :
OIL RESERVES Detailed Report Database Date:
Dec. 31, 2007
Initial OIP Volume: 49
Primary Recovery Factor: 0.600
Enhanced Recovery Factor: 0.000
Primary Initial Reserves: 29.4
Enhanced Initial Reserves: 0.0
Total Initial Reserves: 29.4
Cumulative Production: 29.4
Remaining Reserves: 0.0
Area: 64
Net Pay: 6.01
Porosity: 0.024
Water Saturation: 0.36
Shrinkage: 0.83
Mean Formation Depth: 1420.4
Oil Density: 834.3
Solution Gas Oil Ratio: 64
Initial Pressure 11,093
Temperature: 56
Remarks: 2006-12 GPP
Datum Elevation: -705.7
KB (reference elevation): 714.7
Volume: 385
Initial OIP Recovered: 0.600
m
m
m
ha
m
e4 m3
kg/m3
kPa
deg C
e3 m3
e3 m3
e3 m3
e3 m3
e3 m3
e3 m3
Metric Imperial
ft
ft
ft
acres
ft
2.4
36.0
83.0
38.10
2345
4660
-2315
158
19.7
361
1,609 psi
308
60.0
0.0
185
0
185
185
0
60.0
e3 bbl
e3 bbl
e3 bbl
e3 bbl
e3 bbl
e3 bbl
deg F133
3118 acre ft
deg API
m3/m3 SCF/Bbl
38.10 deg API
52.1 lbs/SCF
API Gravity:
%
%
%
%
%
%
Tuesday, August 04, 2009 Page 1 of 1

Field Code : 421
Field Name : GOLDEN SPIKE
Pool Code : 696001
Pool Name : D-2 A TOTAL
Field Location : 051-27W4
Discovery Year : 1952
Pool Type : Primary
Light-Medium OilPool Class :
OIL RESERVES Detailed Report Database Date:
Dec. 31, 2007
Initial OIP Volume: 2804
Primary Recovery Factor: 0.000
Enhanced Recovery Factor: 0.000
Primary Initial Reserves: 275.0
Enhanced Initial Reserves: 131.0
Total Initial Reserves: 406.0
Cumulative Production: 405.9
Remaining Reserves: 0.1
Area: 769
Net Pay: 0
Porosity: 0
Water Saturation: 0
Shrinkage: 0
Mean Formation Depth: 1543.7
Oil Density: 839.3
Solution Gas Oil Ratio: 87
Initial Pressure 12,422
Temperature: 61
Remarks: 2001-12 GPP
Datum Elevation: -831.7
KB (reference elevation): 712.0
Volume: 0
Initial OIP Recovered: 0.145
m
m
m
ha
m
e4 m3
kg/m3
kPa
deg C
e3 m3
e3 m3
e3 m3
e3 m3
e3 m3
e3 m3
Metric Imperial
ft
ft
ft
acres
ft
0.0
0.0
0.0
37.09
2336
5065
-2729
1900
0.0
491
1,802 psi
17645
0.0
0.0
1731
824
2555
2554
1
14.5
e3 bbl
e3 bbl
e3 bbl
e3 bbl
e3 bbl
e3 bbl
deg F142
0 acre ft
deg API
m3/m3 SCF/Bbl
37.09 deg API
52.4 lbs/SCF
API Gravity:
%
%
%
%
%
%
Tuesday, August 04, 2009 Page 1 of 1

Field Code : 421
Field Name : GOLDEN SPIKE
Pool Code : 696002
Pool Name : D-2 B
Field Location : 051-27W4
Discovery Year : 1951
Pool Type : Primary
Light-Medium OilPool Class :
OIL RESERVES Detailed Report Database Date:
Dec. 31, 2007
Initial OIP Volume: 356
Primary Recovery Factor: 0.150
Enhanced Recovery Factor: 0.000
Primary Initial Reserves: 53.4
Enhanced Initial Reserves: 0.0
Total Initial Reserves: 53.4
Cumulative Production: 53.1
Remaining Reserves: 0.3
Area: 173
Net Pay: 3.93
Porosity: 0.078
Water Saturation: 0.14
Shrinkage: 0.78
Mean Formation Depth: 1556.2
Oil Density: 839.3
Solution Gas Oil Ratio: 87
Initial Pressure 12,395
Temperature: 61
Remarks: 2000-11 GPP
Datum Elevation: -847.5
KB (reference elevation): 708.7
Volume: 680
Initial OIP Recovered: 0.149
m
m
m
ha
m
e4 m3
kg/m3
kPa
deg C
e3 m3
e3 m3
e3 m3
e3 m3
e3 m3
e3 m3
Metric Imperial
ft
ft
ft
acres
ft
7.8
14.0
78.0
37.09
2325
5106
-2781
427
12.9
491
1,798 psi
2240
15.0
0.0
336
0
336
334
2
14.9
e3 bbl
e3 bbl
e3 bbl
e3 bbl
e3 bbl
e3 bbl
deg F142
5512 acre ft
deg API
m3/m3 SCF/Bbl
37.09 deg API
52.4 lbs/SCF
API Gravity:
%
%
%
%
%
%
Tuesday, August 04, 2009 Page 1 of 1

Field Code : 551
Field Name : LEDUC-WOODBEND
Pool Code : 696001
Pool Name : D-2 A TOTAL
Field Location : 050-26W4
Discovery Year : 1947
Pool Type : Primary
Light-Medium OilPool Class :
OIL RESERVES Detailed Report Database Date:
Dec. 31, 2007
Initial OIP Volume: 32830
Primary Recovery Factor: 0.000
Enhanced Recovery Factor: 0.000
Primary Initial Reserves: 11160.0
Enhanced Initial Reserves: 3270.0
Total Initial Reserves: 14430.0
Cumulative Production: 14421.2
Remaining Reserves: 8.8
Area: 9217
Net Pay: 0
Porosity: 0
Water Saturation: 0
Shrinkage: 0
Mean Formation Depth: 1570.2
Oil Density: 834
Solution Gas Oil Ratio: 115
Initial Pressure 12,581
Temperature: 63
Remarks: 2007-12 GPP
Datum Elevation: -851.3
KB (reference elevation): 718.9
Volume: 0
Initial OIP Recovered: 0.439
m
m
m
ha
m
e4 m3
kg/m3
kPa
deg C
e3 m3
e3 m3
e3 m3
e3 m3
e3 m3
e3 m3
Metric Imperial
ft
ft
ft
acres
ft
0.0
0.0
0.0
38.16
2359
5152
-2793
22776
0.0
649
1,825 psi
206595
0.0
0.0
70228
20578
90806
90751
55
43.9
e3 bbl
e3 bbl
e3 bbl
e3 bbl
e3 bbl
e3 bbl
deg F145
0 acre ft
deg API
m3/m3 SCF/Bbl
38.16 deg API
52.1 lbs/SCF
API Gravity:
%
%
%
%
%
%
Tuesday, August 04, 2009 Page 1 of 1

Field Code : 551
Field Name : LEDUC-WOODBEND
Pool Code : 696002
Pool Name : D-2 B
Field Location : 050-26W4
Discovery Year : 1950
Pool Type : Primary
Light-Medium OilPool Class :
OIL RESERVES Detailed Report Database Date:
Dec. 31, 2007
Initial OIP Volume: 24060
Primary Recovery Factor: 0.139
Enhanced Recovery Factor: 0.000
Primary Initial Reserves: 3344.0
Enhanced Initial Reserves: 0.0
Total Initial Reserves: 3344.0
Cumulative Production: 3320.3
Remaining Reserves: 23.7
Area: 7106
Net Pay: 14.33
Porosity: 0.05
Water Saturation: 0.37
Shrinkage: 0.75
Mean Formation Depth: 1601.3
Oil Density: 834.3
Solution Gas Oil Ratio: 98
Initial Pressure 12,834
Temperature: 60
Remarks: 2007-12 GPP
Datum Elevation: -866.6
KB (reference elevation): 734.7
Volume: 101829
Initial OIP Recovered: 0.138
m
m
m
ha
m
e4 m3
kg/m3
kPa
deg C
e3 m3
e3 m3
e3 m3
e3 m3
e3 m3
e3 m3
Metric Imperial
ft
ft
ft
acres
ft
5.0
37.0
75.0
38.10
2410
5254
-2843
17559
47.0
553
1,861 psi
151406
13.9
0.0
21043
0
21043
20894
149
13.8
e3 bbl
e3 bbl
e3 bbl
e3 bbl
e3 bbl
e3 bbl
deg F140
825541 acre ft
deg API
m3/m3 SCF/Bbl
38.10 deg API
52.1 lbs/SCF
API Gravity:
%
%
%
%
%
%
Tuesday, August 04, 2009 Page 1 of 1

Flash Corrected PVT Data
Reservoir Fluid Study for Calstan Acheson 11-11 Mu 53-26Well 02/11-11-53-26W4Location Acheson D-2 ACalifornia Research Corp. Project 8036 File 568.22Date of Cover Letter 19158Date of Sample 19086
Flash Corrected PVTGOR
Adjusted PVT data Separator Flash Conditions psig psig scf/bblFirst Stage Flash from 1305 to 70 at 286Second Stage Flash at from 70 0 at 77Total Flash GOR 363 scf/bbl 363Flash FVF 1.221 rvol/svol
Tres Pressure Bubble Pt. Soln GOR Oil FVF Visc Oil Density(deg F) (psig) (psig) (scf/bbl) (rvol/svol) (cp) gm/cc
134 3000 1305 363.0 1.2006134 2800 1305 363.0 1.2031 0.98134 2600 1305 363.0 1.2054 0.96134 2400 1305 363.0 1.2078 0.94134 2200 1305 363.0 1.2103 0.92134 2000 1305 363.0 1.2127 0.91134 1800 1305 363.0 1.2150 0.89134 1600 1305 363.0 1.2175 0.88134 1400 1305 363.0 1.2198 0.86134 1305 1305 363.0 1.2210 0.85 Bubble Point134 1200 1305 0.88134 1118 1305 332.0134 1000 1305 0.93 Rem GOR134 973 1305 302.9 EUB Database 276.02134 846 1305 276.7134 800 1305 0.99 Material Bal. 276.02134 603 1305 218.5 1.1430134 600 1305 1.07134 458 1305 180.6 1.1225134 400 1305 1.17134 299 1305 132.1 1.0962134 201 1305 103.0 1.0825134 200 1305 1.34134 104 1305 57.4 1.0609134 51 1305 17.7 1.0056134 14.7 1305 0.9700 1.86
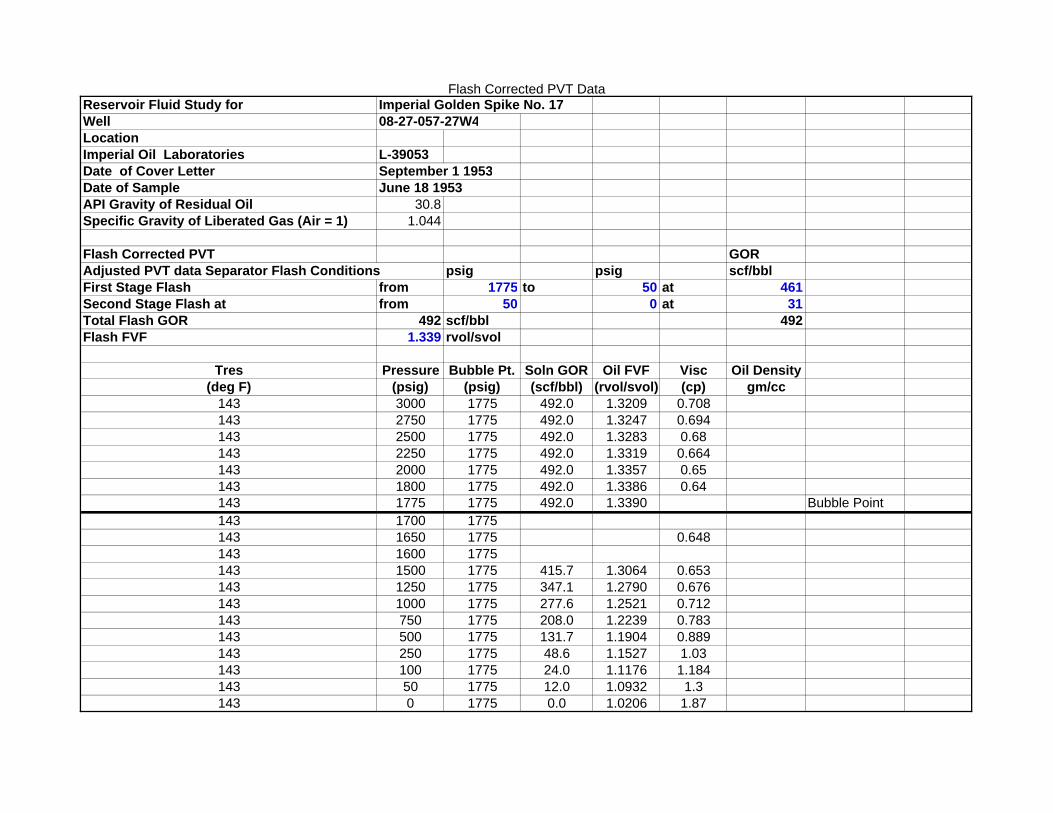
Flash Corrected PVT DataReservoir Fluid Study for Imperial Golden Spike No. 17Well 08-27-057-27W4LocationImperial Oil Laboratories L-39053Date of Cover Letter September 1 1953Date of Sample June 18 1953API Gravity of Residual Oil 30.8Specific Gravity of Liberated Gas (Air = 1) 1.044
Flash Corrected PVT GORAdjusted PVT data Separator Flash Conditions psig psig scf/bblFirst Stage Flash from 1775 to 50 at 461Second Stage Flash at from 50 0 at 31Total Flash GOR 492 scf/bbl 492Flash FVF 1.339 rvol/svol
Tres Pressure Bubble Pt. Soln GOR Oil FVF Visc Oil Density(deg F) (psig) (psig) (scf/bbl) (rvol/svol) (cp) gm/cc
143 3000 1775 492.0 1.3209 0.708143 2750 1775 492.0 1.3247 0.694143 2500 1775 492.0 1.3283 0.68143 2250 1775 492.0 1.3319 0.664143 2000 1775 492.0 1.3357 0.65143 1800 1775 492.0 1.3386 0.64143 1775 1775 492.0 1.3390 Bubble Point143 1700 1775143 1650 1775 0.648143 1600 1775143 1500 1775 415.7 1.3064 0.653143 1250 1775 347.1 1.2790 0.676143 1000 1775 277.6 1.2521 0.712143 750 1775 208.0 1.2239 0.783143 500 1775 131.7 1.1904 0.889143 250 1775 48.6 1.1527 1.03143 100 1775 24.0 1.1176 1.184143 50 1775 12.0 1.0932 1.3143 0 1775 0.0 1.0206 1.87