aq group q3 2021
TRANSCRIPT


•
•
•
•
•
•
•
▪
▪
▪
▪
▪
▪
▪
SEK M unless otherwise stated Q1 Q2 Q3 Ack Q1 Q2 Q3 Q4 Full year
Net turnover 1,307 1,361 1,306 3,974 1,342 1,116 1,104 1,256 4,819
Operating profit (EBIT) 121 118 94 333 98 81 97 125 401
Profit after net financial items (EBT) 126 114 91 331 87 78 93 111 369
Profit for the period 109 96 76 280 76 70 79 93 318
Total equity 2,352 2,438 2,526 2,526 2,176 2,129 2,206 2,191 2,191
Operating margin (EBIT), % 9.3 8.7 7.2 8.4 7.3 7.2 8.8 10.0 8.3
Profit margin before tax (EBT), % 9.6 8.4 6.9 8.3 6.5 7.0 8.4 8.8 7.7
Liquid ratio, % 134 167 142 142 108 155 169 135 135
Debt/equity ratio, % 56 57 55 55 54 56 56 57 57
Return on total assets, % 2) 10.6 11.9 11.3 11.3 9.5 8.8 8.9 10.8 10.8
Return on equity after tax, % 2) 15.5 16.5 15.8 15.8 12.9 12.9 12.9 15.1 15.1
Number of employees in Sweden 782 792 794 794 833 805 789 794 794
Number of employees outside Sweden 5,298 5,206 5,711 5,711 5,465 5,231 5,237 5,097 5,097
Key indicators per share, SEK 1)
Profit for the period 5.89 5.22 4.12 15.23 4.11 3.80 4.30 5.03 17.24
Equity 128.56 133.29 138.06 138.06 118.97 116.38 120.60 119.75 119.75
Number of shares, thousands 18,294 18,294 18,294 18,294 18,294 18,294 18,294 18,294 18,294
1) There are no instruments that could lead to share dilution.
2) Calculated based on 12 months rolling amounts.
2021 2020


R12
Jul-Sep Jul-Sep Jan-Sep Jan-Sep Oct 2020 Full Year
SEK M Note 2021 2020 2021 2020 -Sep 2021 2020
Net sales 1,306 1,104 3,974 3,563 5,230 4,819
Other operating income 25 26 82 106 130 153
Total income 1,331 1,131 4,056 3,669 5,359 4,972
Change in inventory and work in progress 55 -4 105 -11 97 -18
Raw material and consumables -717 -545 -2,032 -1,770 -2,614 -2,352
Goods for resale -16 -13 -102 -49 -141 -89
Other external expenses -145 -106 -412 -347 -534 -469
Personnel costs -344 -297 -1,077 -997 -1,433 -1,353
Depreciation and amortisation -62 -59 -173 -177 -230 -234
Other operating expenses -9 -9 -31 -41 -47 -57
Total operating costs -1,237 -1,033 -3,723 -3,393 -4,901 -4,571
Operating profit 94 97 333 276 458 401
Net financial income/expense 5 -3 -4 -2 -18 -16 -32
Profit before tax 91 93 331 258 442 369
Taxes -15 -14 -50 -33 -69 -51
Profit for the period 76 79 280 225 373 318
PROFIT FOR THE PERIOD ATTRIBUTABLE TO:Parent company shareholders 75 79 279 223 371 315
Non-controlling interests 0 1 2 2 2 2
76 79 280 225 373 318
Earnings per share 1) 4.12 4.30 15.23 12.21 20.26 17.24
1) There were no transactions during the year that might result in dilution effects.
R12
Jul-Sep Jul-Sep Jan-Sep Jan-Sep Oct 2020 Full Year
SEK M Note 2021 2020 2021 2020 -Sep 2021 2020
PROFIT FOR THE PERIOD 76 79 280 225 373 318
OTHER COMPREHENSIVE INCOMEItems that cannot be transferred to the profit for the period
Revaluation of defined benefit pension plans - - - - -0 -0
Revalutation of defined benefit pension plans, tax effect - - - - 0 0Items transferred or that can be transferred to the profit
Translation difference for foreign operations 12 -2 55 -34 -54 -142
Other comprehensive income for the period after tax 12 -2 55 -34 -54 -142
Comprehensive income for the period 87 77 335 191 319 175
COMPREHENSIVE INCOME FOR THE PERIOD
ATTRIBUTABLE TO:Parent company shareholders 87 77 333 189 317 173
Non-controlling interests 0 1 2 2 2 2
87 77 335 191 319 175

Sep 30 Sep 30 Dec 31
SEK M Note 2021 2020 2020
ASSETS
NON-CURRENT ASSETSGoodwill 369 347 330
Other intangible assets 168 195 178
Tangible assets 1,005 955 913
Financial assets 2 2 2
Deferred tax assets 58 62 54
Total non-current assets 1,602 1,562 1,477
Inventories 1,159 869 816
Trade and other receivables 1,117 1,004 995
Other current receivables 5 194 141 125
Cash and cash equivalents 505 333 452
Total current assets 2,975 2,346 2,388
TOTAL ASSETS 4,577 3,908 3,864
EQUITY AND LIABILITIES
EQUITYEquity attributable to parent company shareholders 2,514 2,197 2,181
Non-controlling interests 11 9 9
TOTAL EQUITY 2,526 2,206 2,191
Non-current liabilities to credit institutions 670 721 406
Non-current non-interest-bearing liabilities 102 104 101
Total non-current liabilities 772 825 508
Interest-bearing current liabilities 201 77 391
Trade and other payables 661 446 439
Other current liabilities 5 416 353 336
Total current liabilities 1,279 876 1,166
TOTAL LIABILITIES 2,051 1,701 1,674
TOTAL EQUITY AND LIABILITIES 4,577 3,908 3,864

SEK M
Share capital Other
contributed
capital
Translation
reserve
Retained
earnings
incl. profit
Subtotal Non-
controlling
interests
Total
equity
Equity, 01/01/2020 37 84 156 1,731 2,008 7 2,015
Profit for the period 223 223 2 225
Translation differences in foreign operations -34 - -34 0 -34
Other comprehensive income -34 - -34 0 -34
Comprehensive income for the period -34 223 189 2 191
Dividends paid - - - -
Transactions with shareholders - - - -
Equity, 09/30/2020 37 84 121 1,955 2,197 9 2,206
Equity, 01/01/2021 37 84 14 2,047 2,181 9 2,191
Profit for the period 279 279 2 280
Translation differences in foreign operations 55 - 55 0 55
Other comprehensive income 55 - 55 0 55
Comprehensive income for the period 55 279 333 2 335
Dividends paid 0 0 -0 -0
Transactions with shareholders 0 0 -0 -0
Equity, 09/30/2021 37 84 68 2,325 2,514 11 2,526
Equity attributable to parent company shareholders
Jul 1 - Sep 30 Jul 1 - Sep 30 Jan 1 - Sep 30 Jan 1 - Sep 30 Jan 1 - Dec 31
SEK M Note 2021 2020 2021 2020 Full Year 2020
Profit before tax 91 93 331 258 369
Adjustment for non cash generating items 53 83 166 202 250
Income tax paid -18 -16 -57 -49 -56
Cash flow from operating activities before change in working capital 126 160 440 410 564
Increase (-)/decrease (+) in inventories -141 22 -232 8 31
Increase (-)/decrease (+) in trade receivables 84 -42 -30 25 -3
Increase (-)/decrease (+) in other receivables -19 -10 -35 -13 -19
Increase (+)/decrease (-) in trade payables 62 19 174 -12 3
Increase (+)/decrease (-) in other liabilities -13 -10 26 27 32
Change in working capital -27 -21 -97 35 45
Cashflow from operating activities 99 139 343 445 609
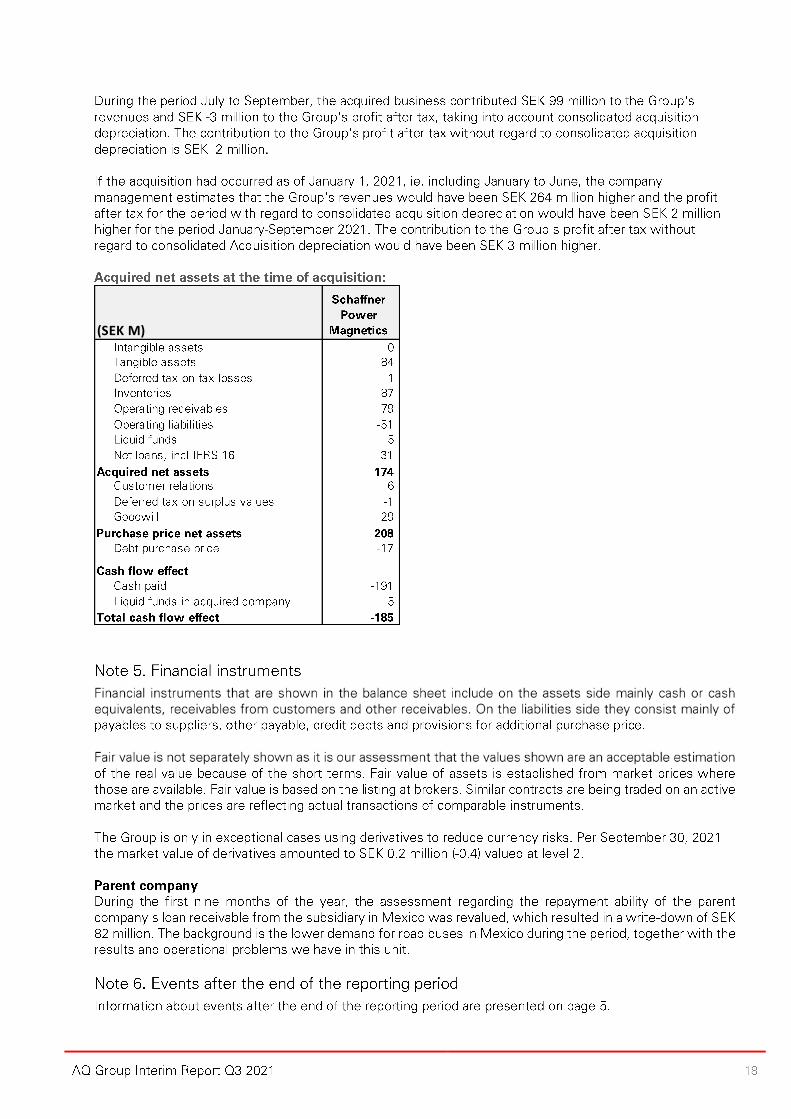
Aquisitions of subsidiaries net of cash aquired and other businesses 4 -185 -3 -185 -20 -20
Acquisition of intangible non-current assets -0 -1 -2 -8 -8
Acquisition of tangible non-current assets -65 -23 -123 -102 -114
Sale of tangible non-current assets 0 6 2 10 5
Other changes in non-current assets -1 - 0 - 1
Cashflow from investing activities -251 -21 -309 -120 -137
New borrowings, credit institutions 70 - 82 - -
Amortisation of loans -16 -1 -33 -19 -21
Amortisation of loans (lease) -25 -22 -71 -68 -91
Change in bank overdraft facilities 18 -11 32 -63 -59
Dividends -0 - -0 - -
Other changes in financial activities - - - - 1
Casflow from financing activities 47 -34 11 -151 -169
Change in cash and cash equivalents for the period -105 84 46 175 303
Cash and cash equivalents at the beginning of the year 608 250 452 161 161
Periodens kassaflöde -105 84 46 175 303
Exchange rate difference in cash and cash equivalents 2 -1 8 -4 -12
Cash and cash equivalents at the end of the period 505 333 505 333 452
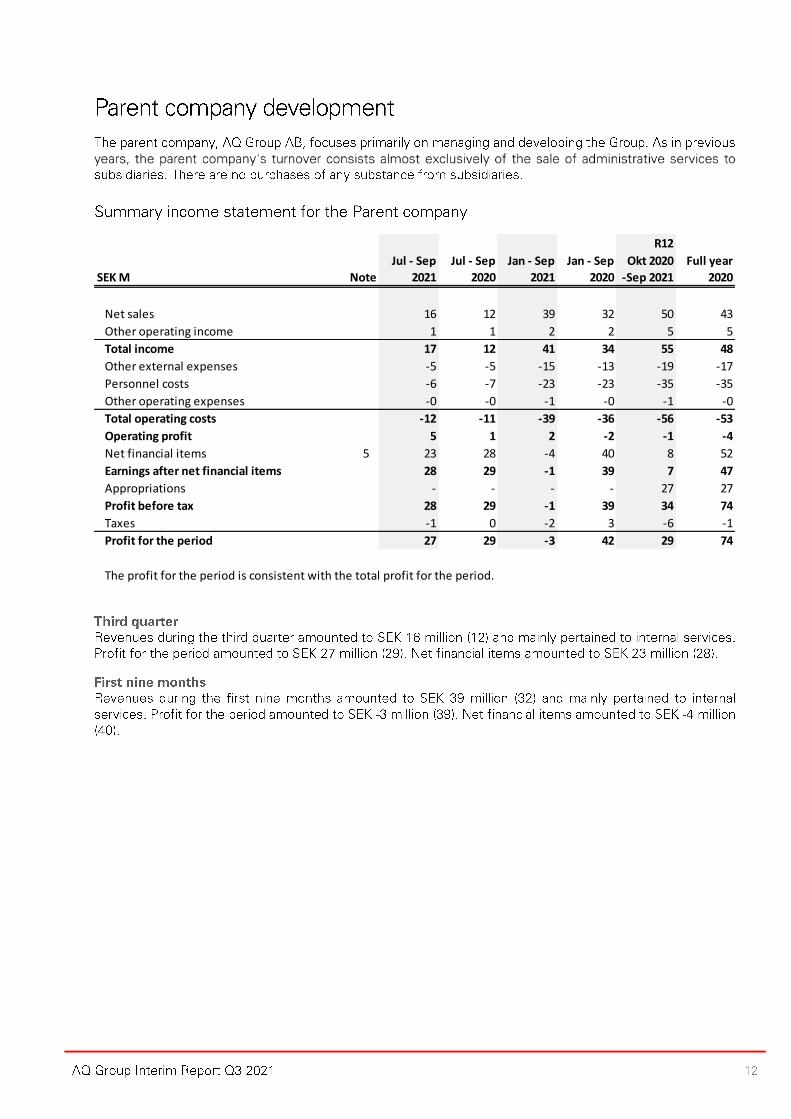
R12
Jul - Sep Jul - Sep Jan - Sep Jan - Sep Okt 2020 Full year
SEK M Note 2021 2020 2021 2020 -Sep 2021 2020
Net sales 16 12 39 32 50 43
Other operating income 1 1 2 2 5 5
Total income 17 12 41 34 55 48
Other external expenses -5 -5 -15 -13 -19 -17
Personnel costs -6 -7 -23 -23 -35 -35
Other operating expenses -0 -0 -1 -0 -1 -0
Total operating costs -12 -11 -39 -36 -56 -53
Operating profit 5 1 2 -2 -1 -4
Net financial items 5 23 28 -4 40 8 52
Earnings after net financial items 28 29 -1 39 7 47
Appropriations - - - - 27 27
Profit before tax 28 29 -1 39 34 74
Taxes -1 0 -2 3 -6 -1
Profit for the period 27 29 -3 42 29 74
The profit for the period is consistent with the total profit for the period.
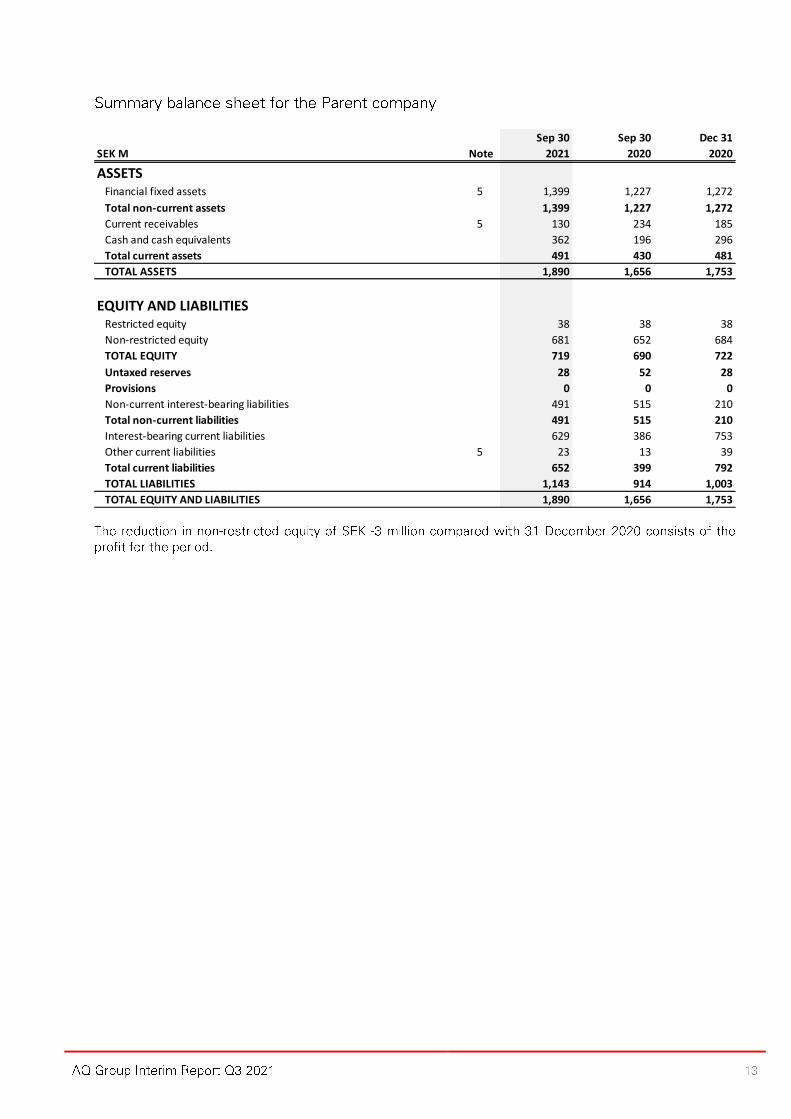
Sep 30 Sep 30 Dec 31
SEK M Note 2021 2020 2020
ASSETSFinancial fixed assets 5 1,399 1,227 1,272
Total non-current assets 1,399 1,227 1,272
Current receivables 5 130 234 185
Cash and cash equivalents 362 196 296
Total current assets 491 430 481
TOTAL ASSETS 1,890 1,656 1,753
EQUITY AND LIABILITIESRestricted equity 38 38 38
Non-restricted equity 681 652 684
TOTAL EQUITY 719 690 722
Untaxed reserves 28 52 28
Provisions 0 0 0
Non-current interest-bearing liabilities 491 515 210
Total non-current liabilities 491 515 210
Interest-bearing current liabilities 629 386 753
Other current liabilities 5 23 13 39
Total current liabilities 652 399 792
TOTAL LIABILITIES 1,143 914 1,003
TOTAL EQUITY AND LIABILITIES 1,890 1,656 1,753

Jul-Sep 2021, SEK M Component System
Unallocated and
eliminations Group
Net sales, external 1,076 230 - 1,306
Net sales, internal 89 49 -138 -
Total net turnover 1,165 279 -138 1,306
Material costs, excl. purchases own segment -609 -185 116 -678
Depreciation -55 -7 -0 -62
Other operating expenses/income -444 -56 27 -472
Operating profit 58 31 5 94
Net financials items -3
Profit before tax 91

Jul-Sep 2020, SEK M Component System
Unallocated and
eliminations Group
Net sales, external 854 251 - 1,104
Net sales, internal 72 41 -113 -
Total net turnover 926 292 -113 1,104
Material costs, excl. purchases own segment -464 -198 99 -562
Depreciation -51 -7 -0 -59
Other operating expenses/income -358 -50 22 -386
Operating profit 52 37 8 97
Net financials items -4
Profit before tax 93
Jan-Sep 2021, SEK M Component System
Unallocated and
eliminations Group
Net sales, external 3,173 800 - 3,974
Net sales, internal 254 225 -479 -
Total net turnover 3,428 1,025 -479 3,974
Material costs, excl. purchases own segment -1,735 -716 422 -2,029
Depreciation -151 -21 -1 -173
Other operating expenses/income -1,320 -179 60 -1,439
Operating profit 221 109 3 333
Net financial items -2
Profit before tax 331
Jan-Sep 2020, SEK M Component System
Unallocated and
eliminations Group
Net sales, external 2,754 809 - 3,563
Net sales, internal 247 134 -381 -
Total net turnover 3,001 943 -381 3,563
Material costs, excl. purchases own segment -1,496 -646 312 -1,830
Depreciation -157 -19 -0 -177
Other operating expenses/income -1,173 -168 61 -1,280
Operating profit 175 109 -8 276
Net financial items -18
Profit before tax 258

Jul-Sep 2021, SEK M Component System
Unallocated and
eliminations Group
Sweden 225 176 16 417
Other European countries 700 64 - 764
Other countries 240 39 - 279
Net sales 1,165 279 16 1,460
Internal sales, eliminations - - -154 -154
Total net turnover 1,165 279 -138 1,306
Jul-Sep 2020, SEK M Component System
Unallocated and
eliminations Group
Sweden 218 183 12 412
Other European countries 542 64 - 605
Other countries 167 45 - 212
Net sales 926 292 12 1,229
Internal sales, eliminations - - -125 -125
Total net turnover 926 292 -113 1,104
Geographical markets are based on where AQ Group's subsidiaries have their registered office.
Jan-Sep 2021, SEK M Component System
Unallocated and
eliminations Group
Sweden 780 577 39 1,396
Other European countries 2,046 225 - 2,271
Other countries 601 224 - 825
Net sales 3,428 1,025 39 4,492
Internal sales, eliminations - - -518 -518
Total net turnover 3,428 1,025 -479 3,974
Jan-Sep 2020, SEK M Component System
Unallocated and
eliminations Group
Sweden 715 556 32 1,303
Other European countries 1,840 246 - 2,086
Other countries 446 141 - 587
Net sales 3,001 943 32 3,976
Internal sales, eliminations - - -413 -413
Total net turnover 3,001 943 -381 3,563
Geographical markets are based on where AQ Group's subsidiaries have their registered office.
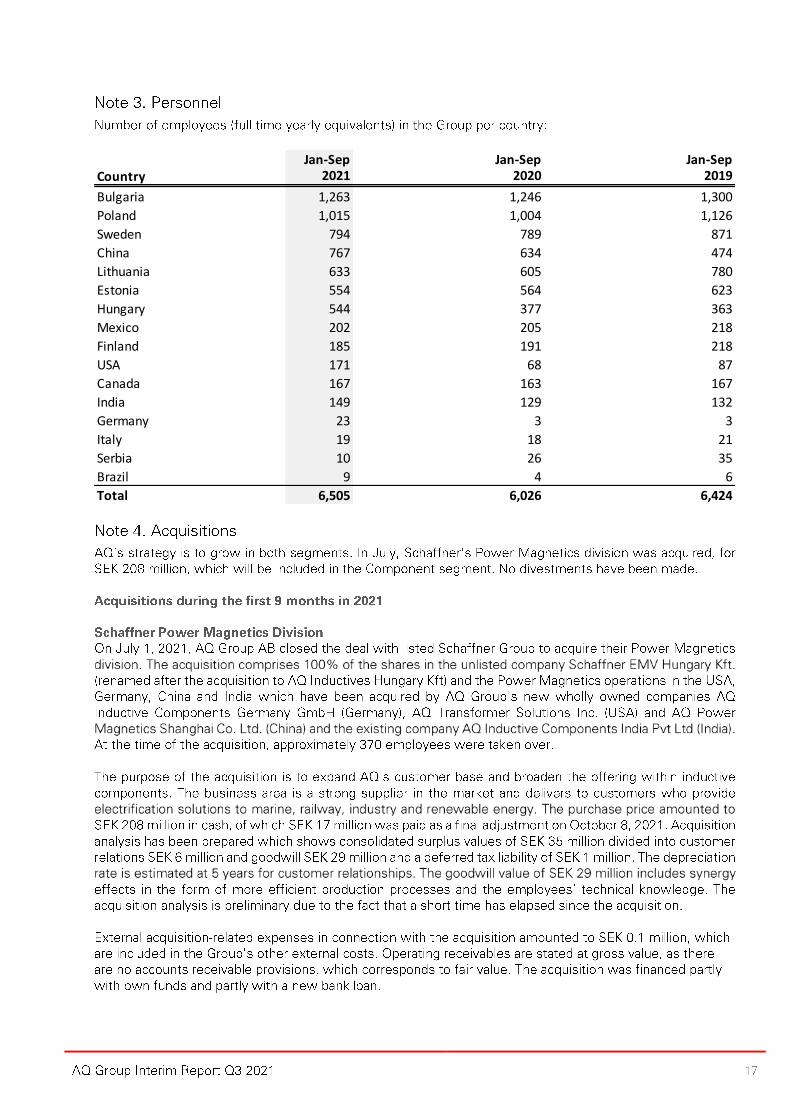
Jan-Sep Jan-Sep Jan-SepCountry 2021 2020 2019
Bulgaria 1,263 1,246 1,300
Poland 1,015 1,004 1,126
Sweden 794 789 871
China 767 634 474
Lithuania 633 605 780
Estonia 554 564 623
Hungary 544 377 363
Mexico 202 205 218
Finland 185 191 218
USA 171 68 87
Canada 167 163 167
India 149 129 132
Germany 23 3 3
Italy 19 18 21
Serbia 10 26 35
Brazil 9 4 6
Total 6,505 6,026 6,424
(SEK M)

SEK M unless otherwise stated Q1 Q2 Q3 YTD Q1 Q2 Q3 Q4 Full year
Operating margin, (EBIT %)
Operating profit 121 118 94 333 98 81 97 125 401
Net revenue 1,307 1,361 1,306 3,974 1,342 1,116 1,104 1,256 4,819
Operating margin 9.3 8.7 7.2 8.4 7.3 7.2 8.8 10.0 8.3
EBITDA
Profit before tax 121 118 94 333 98 81 97 125 401
Depreciations/amortisations -55 -56 -62 -173 -59 -59 -59 -57 -234
EBITDA 177 173 156 506 157 140 156 182 635
Profit margin before tax, (EBT %)
Profit before tax 126 114 91 331 87 78 93 111 369
Net revenue 1,307 1,361 1,306 3,974 1,342 1,116 1,104 1,256 4,819
Profit margin before tax, % 9.6 8.4 6.9 8.3 6.5 7.0 8.4 8.8 7.7
Liquid ratio, %
Trade receivables 1,121 1,127 1,117 1,117 1,162 964 1,004 995 995
Other current receivables 132 151 194 194 136 128 141 125 125
Cash and cash equivalents 571 608 505 505 163 250 333 452 452
Current liabilities 1,361 1,132 1,279 1,279 1,354 864 876 1,166 1,166
Liquid ratio, % 134 167 142 142 108 155 169 135 135
Debt/equity ratio, %
Total equity 2,352 2,438 2,526 2,526 2,176 2,129 2,206 2,191 2,191
Total assets 4,196 4,281 4,577 4,577 4,063 3,818 3,908 3,864 3,864
Debt/equity ratio, % 56 57 55 55 54 56 56 57 57
Return on total assets, %
Profit before tax, rolling 12 months 408 444 442 442 315 305 316 369 369
Financial expenses, rolling 12 months -31 -36 -36 -36 -45 -39 -36 -48 -48
Total equity and liabilities, opening balance for 12 months 4,063 3,818 3,908 3,908 3,492 3,972 3,983 3,852 3,852
Total equity and liabilities, closing balance 4,196 4,281 4,577 4,577 4,063 3,818 3,908 3,864 3,864
Total equity and liabilities, average 4,130 4,049 4,242 4,242 3,777 3,895 3,945 3,858 3,858
Return on total assets, % 10.6 11.9 11.3 11.3 9.5 8.8 8.9 10.8 10.8
Return on equity after tax, %
Profit for the period after tax, rolling 12 months 351 377 373 373 262 263 273 318 318
Total equity, opening for 12 months 2,176 2,129 2,206 2,206 1,896 1,928 2,021 2,015 2,015
Total equity, closing 2,352 2,438 2,526 2,526 2,176 2,129 2,206 2,191 2,191
Total equity, average 2,264 2,284 2,366 2,366 2,036 2,029 2,114 2,103 2,103
Return on equity after tax, % 15.5 16.5 15.8 15.8 12.9 12.9 12.9 15.1 15.1
Net cash / Net debt
Cash and cash equivalents 571 608 505 505 163 250 333 452 452
Non-current interest bearing liabilities 381 611 670 670 420 719 721 406 406
Current interest bearing liabilities 415 170 201 201 412 84 77 391 391
Total interest bearing liabilities 796 781 872 872 832 803 798 797 797
Net cash / Net debt -225 -173 -367 -367 -668 -553 -466 -345 -345
Growth, %
Organic growth
Net revenue 1,307 1,361 1,306 3,974 1,342 1,116 1,104 1,256 4,819
- Effect of changes in exchange rates -67 -53 -6 -127 14 -11 -44 -49 -91
- Net revenue for last year 1,342 1,116 1,104 3,563 1,253 1,313 1,247 1,300 5,113
- Net revenue for acquired companies - - 93 93 142 94 - - 236
= Organic growth 32 298 115 445 -67 -280 -98 6 -439
Organic growth divided by last year net revenue, % 2.4 26.7 10.4 12.5 -5.3 -21.3 -7.8 0.4 -8.6
Growth through acquisitions
Net revenue for acquired companies divided by last year
net revenue, % 0.0 0.0 8.4 2.6 11.3 7.2 0.0 0.0 4.6
2021 2020