aprila bank asa | q2 2018 | 16 august 2018
TRANSCRIPT
Aprila Bank ASA | Q2 2018 | 16 August 2018
2
DisclaimerForward-looking statements
This presentation contains forward-looking statements that reflect management’scurrent views with respect to certain future events and potential financialperformance.
Although Aprila Bank believes that the expectations reflected in such forward-lookingstatements are reasonable, no assurance can be given that such expectations willprove to be correct. Accordingly, results could differ materially from those set out inthe forward-looking statements as a result of various factors.
Important factors that may cause such a difference for Aprila Bank include, but arenot limited to: (i) the macroeconomic development, (ii) change in the competitiveclimate, (iii) change in the regulatory environment and other government actions and(iv) change in interest rate and foreign exchange rate levels.
This presentation does not imply that Aprila Bank has undertaken to revise theseforward-looking statements, beyond what is required by applicable law or otherapplicable regulations if and when circumstances arise that will lead to changescompared to the date when these statements were provided.

3
Table of contentsOverview
01
02
03
Status
Key figures
Appendix

4
A digital bank for SMB Hypothesis put to practice, and it is working.
• Innovative distribution modelRe-bundling of banking through integration with established ERP solutions and a cost effective B2B agent model for ERP-partners and other relevant distribution agents.
• Instant onboardingSetting a new standard for on-boarding of corporate banking customers, making factoring and other working capital products available for a new market.
• Introducing new productsSpot factoring and vendor payment with risk-adjusted and real-time pricing. Automatically booked in the accounting system.
• Tailored modern technology platformAdvanced, flexible and highly scalable architecture developed in-house.
• Highly data drivenAccess to up-to-date accounting data through ERP-integration combined with short end-customer credits provide a unique platform for accelerated collection of credit information, and development of new standards for credit scoring of SMEs.

5
StatusHighlights
• DistributionSigned agreements with three ERP system providers; Tripletex, Xledger and one more
• TripletexRelease June 26th, good results during summer. Speeding up further integration
• Products and distributionProducts will depend on distribution agreements. Cloud based ERP is core, but also in discussions with several other potential channels
• Technology companyIntegrations and processes made available by own technology. Highly flexible and modular
• Data and analysisMachine learning project to commence in Q4 – relevant people have been identified
• ChallengesCan be displaced – no direct customer relationships. Software development. Depend on a few key people. Ability to price correctly and avoid losses. Distribution agreements take time
6
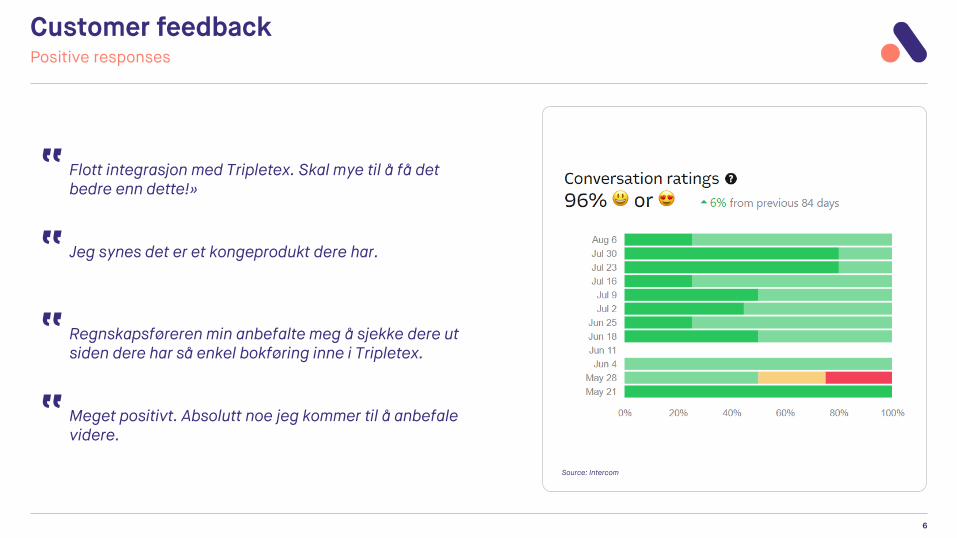
Customer feedbackPositive responses
Meget positivt. Absolutt noe jeg kommer til å anbefale videre.“
Jeg synes det er et kongeprodukt dere har.“Regnskapsføreren min anbefalte meg å sjekke dere ut siden dere har så enkel bokføring inne i Tripletex.“
Flott integrasjon med Tripletex. Skal mye til å få det bedre enn dette!»“
Source: Intercom
7
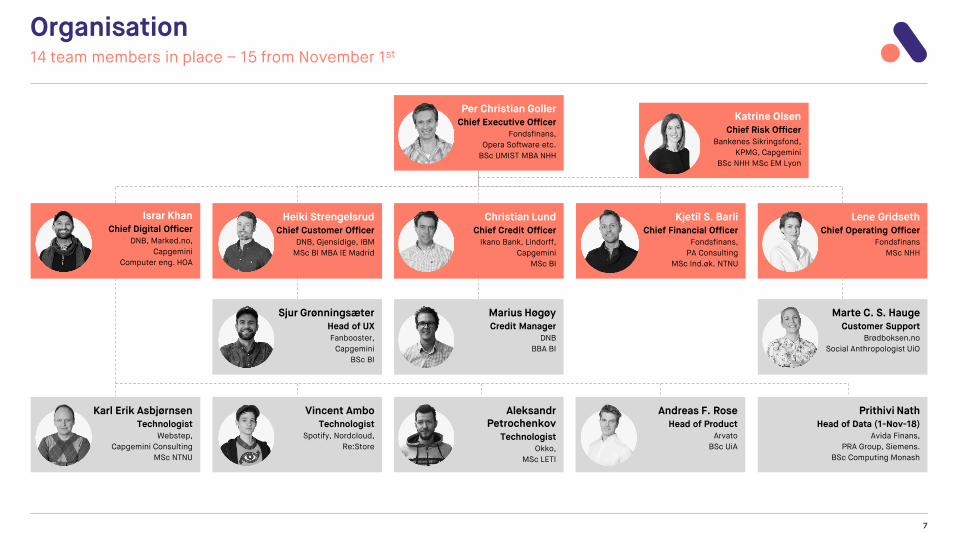
Organisation14 team members in place – 15 from November 1st
Lene GridsethChief Operating Officer
Fondsfinans
MSc NHH
Christian LundChief Credit Officer
Ikano Bank, Lindorff,
Capgemini
MSc BI
Kjetil S. BarliChief Financial Officer
Fondsfinans,
PA Consulting
MSc Ind.øk. NTNU
Israr KhanChief Digital Officer
DNB, Marked.no,
Capgemini
Computer eng. HOA
Heiki StrengelsrudChief Customer Officer
DNB, Gjensidige, IBM
MSc BI MBA IE Madrid
Per Christian GollerChief Executive Officer
Fondsfinans,
Opera Software etc.
BSc UMIST MBA NHH
Katrine OlsenChief Risk Officer
Bankenes Sikringsfond,
KPMG, Capgemini
BSc NHH MSc EM Lyon
Sjur GrønningsæterHead of UXFanbooster,
Capgemini
BSc BI
Marius HøgøyCredit Manager
DNB
BBA BI
Marte C. S. HaugeCustomer Support
Brødboksen.no
Social Anthropologist UiO
Karl Erik AsbjørnsenTechnologist
Webstep,
Capgemini Consulting
MSc NTNU
Vincent AmboTechnologist
Spotify, Nordcloud,
Re:Store
Aleksandr Petrochenkov
TechnologistOkko,
MSc LETI
Andreas F. RoseHead of Product
Arvato
BSc UiA
Prithivi Nath Head of Data (1-Nov-18)
Avida Finans,
PRA Group, Siemens.
BSc Computing Monash

8
Table of contentsOverview
03
Key figures
Appendix
02
01 Status

9
Key figures
Note 1: As of 14 August | | Note 2: Nominal amount of invoices
YTD 2018 (11 April – 14 August)
Purchased volume accumulated 1, 2
NOK millions
Customers accumulated1
Purchased volume by month 1, 2
NOK millions
New customers1
#
#
Key comments
• Piloting of Aprila Invoice Sales in Tripletex commenced 11 April
• From 11 April to 25 June, the product was gradually rolled out to new users, before proceeding with full-scale launch 26 June
• At EOB 14 August we had 192 customers, of which ~75% onboarded during the last seven weeks after launch
• Purchased volume has picked up significantly after launch and continues to increase
- During July, the volume was stable around NOK 0.7 – 0.9 million per week
- The previous weekly record was doubled last week (w32) with NOK 1.8m in purchased volume
1
1
825
93
168
192
Apr May Jun Jul Aug
817
68 75
24
Apr May Jun Jul Aug
0.0 0.3
1.6
5.3
8.5
Apr May Jun Jul Aug
0.0 0.2
1.3
3.73.2
Apr May Jun Jul Aug

10
Key customer figures
Note 1: As presented in the Investor Presentation dated 20 December 2017. || Note 2: 24 new customers first 14 days.
Customer growth better than expected
Actual14 Aug 18
First 1.5 quarters
Business plan1
31 Mar 19First operational year (EOP)
Customers#
360 192
Average annual customer revenue
NOKm
6.7 7.3
Customer exposureOur partners’ customers 18,800 ~8,500
CU
ST
OM
ER
S
• Business plan: 8,800 from first operational quarter (Q2-18), 18,800 from third op. quarter (Q4-18)
• Actual: ~8,500 from 26 June, expected ~20,000 from Q4-18, depending on our partners’ implementation speed
• Business plan: 360 customers at the end of the first operational year (Q1-19)
• Actual: 192 half way into the second operating quarter
• Monthly run-rates: July: 75 new customers, YTD Aug: ~50 new customers2
• Slightly higher than assumed
Impliedannual potential volume
NOKm(Avg. revenue x # of customers
EOP)
~2,400 ~1,400 • Ahead of plan

11
Key invoice figures
Note 1: As presented in the Investor Presentation dated 20 December 2017. || Note 2: Nominal invoice amount purchased from customers in % of total available invoice volume.
Effective interest rate in line with plan - share of customers’ revenue lower than assumed, but increasing
Average interest marginGross interest income in % of
purchased volume1.95% 2.15%
Purchased %% of customers’ revenue
purchased by Aprila40% ~10%2
Average invoice amountNOK thousand 5.0 20.3
Average marginGross interest and fee income in %
of purchased volume2.26% 2.19%
INV
OIC
ES
• 4x business plan
• Implies lower transaction costs but also lower fee income in % of purchased volume
• During July and so far in August we have purchased ~10% of the available invoice volume (in NOK) in Tripletex vs. assumed 40%
• Partly offset by more customers (higher available volume)
• Slightly lower than business plan, however offset by lower transaction costs due to higher average invoice amount. Further; fee income from collection notifications will increase going forward
• Fee per invoice will be increased from NOK 10 to NOK 29 this week, i.e. fee margin of 0.15% at an average invoice amount of NOK 20k (vs. ~0.05% YTD). Implies an average margin of 2.30% going forward (ceteris paribus)
• Business plan: 1.95% per 22 days
• Actual: 2.15% per 20 days
Average days outstanding
From purchase to payment
22.0 19.9 • In line with expectations
ActualQ2-18 – 14-Aug-18
First 1.5 quarters
Business plan1
Q2-18 – Q1-19First operational year

12
Table of contentsOverview
Key figures
Appendix
01 Status
02
02

13
Income statement & general administrative expenses
Income Statement General administrative expenses
Amounts in NOK thousand Q2 2018 YTD 2018
Interest income 314 364
Interest expense 53 53
Net interest income 261 311
Income commissions and fees 1 1
Expenses commissions and fees 10 10
Net commissions and fees -9 -9
Net gains / losses (-) on certificates, bonds and currency 3 3
Other income 6 6
Total income 261 310
Salary and other personnel expenses 3,269 7,108
General administrative expenses 2,960 4,656
Total salary and administrative expenses 6,229 11,764
Ordinary depreciation 325 351
Total operating expenses excl. losses on loans 6,554 12,115
Losses on loans 1 1
Pre-tax operating profit -6,293 -11,805
Tax expenses 0 0
Profit after tax -6,293 -11,805
Earnings per share (NOK) -0.17 -0.33
Diluted earnings per share (NOK) -0.15 -0.28
Amounts in NOK thousand Q2 2018
External services 1,165
IT operations 1,042
Rental of premises 240
Sales and marketing 196
Credit information 80
External audit and related services 28
Credit insurance 1
Other operating expenses 208
Total general administrative expenses 2,960
39 %
35 %
8 %
7 %
11 %
External services
IT operations
Rental of premises
Sales and marketing
Other
NOK
2.96m

14
Balance sheet & regulatory capital
Balance Sheet Regulatory capital
Amounts in NOK thousand 30.06.2018
Loans and deposits with credit institutions 103,858
Net loans to customers 986
Certificates and bonds 30,003
Other intangible assets 6,487
Deferred tax assets 0
Fixed assets 1,141
Other receivables 1,794
Total assets 144,269
Deposits from and debt to customers 0
Other debt 2,715
Total liabilities 2,715
Share capital 36,183
Share premium 127,036
Other paid-in equity 43
Retained earnings -21,707
Total equity 141,554
Total equity and liabilities 144,269
Amounts in NOK thousand 30.06.2018
Share capital 36,183
Share premium 127,036
Other equity -21,664
Total equity 141,554
Other intangible assets -6,487
Deferred tax assets 0
Common equity tier 1 (CET 1) 135,068
Tier 1 capital 135,068
Total capital 135,068
Risk-weighted assets
Loans and deposits with credit institutions 20,772
Loans to customers 986
Certificates and bonds 0
Other assets 2,935
Credit risk 24,693
Operational risk 16,067
Risk-weighted assets 40,760
Capital ratios
Common equity tier 1 ratio (%) 331.4 %
Tier 1 ratio (%) 331.4 %
Total capital ratio (%) 331.4 %
LCR 1509 %
Key comments
• NOK 30 million invested in the LCR-fund DNB Global Treasury
• All other liquidity currently held as bank deposits
• Other intangible assets consists of investments in core banking platform, our own technology platform, aprila.no and a datawarehouse
• No deferred tax assets recognised as of 30 June 2018

15
Ownership & warrant structure1
Note 1: As registered in VPS 12 August 2018.
Aligned interests among key stakeholders
Top 30 shareholders Share distribution
Warrant distribution
36.2mshares
6.7mwarrants
# Investor Name Role # shares % Warrants
1 AMESTO GROUP AS Spandow Family Chairman 3,618,182 10.0 % 1,875,000
2 ALLIANCE VENTURE SPRING AS 2,193,182 6.1 %
3 PRIMERA AS Per Christian Goller Chief Executive Officer 1,600,000 4.4 % 1,750,000
4 MP PENSJON PK 1,596,996 4.4 %
5 STRØMSTANGEN AS 1,595,400 4.4 %
6 REDIVIVUS AS 950,000 2.6 %
7 NORUS AS 877,470 2.4 %
8 TOLUMA INVEST AS 877,470 2.4 %
9 SIX SIS AG 877,470 2.4 %
10 SIRKELBUE AS Karl Erik Asbjørnsen Technologist 800,000 2.2 % 500,000
11 SES AS 797,699 2.2 %
12 UNIVERSAL PRESENTKORT AS 797,699 2.2 %
13 SANDSOLO HOLDING AS 788,565 2.2 %
14 COSIMO AS 775,000 2.1 %
15 SPORTSMAGASINET AS 709,709 2.0 %
16 DISRUPTOR AS Israr Khan Chief Digital Officer 700,000 1.9 % 600,000
17 AREPO AS 658,102 1.8 %
18 SVINDAL AKSEL LUND 630,852 1.7 %
19 INCHOATE AS Heiki Strengelsrud Chief Customer Officer 610,000 1.7 % 500,000
20 NORDIC PRIVATE EQUITY AS 600,000 1.7 %
21 BERGEN KOMMUNALE PENSJONSKASSE 587,747 1.6 %
22 ELIGERE AS Lene Gridseth Chief Operating Officer 573,200 1.6 % 375,000
23 DRAGESUND INVEST AS 571,985 1.6 %
24 SIDEKICK INVEST AS Katrine Olsen Chief Risk Officer 500,000 1.4 % 375,000
25 BLUE MOUNTAIN CAPITAL AS Kjetil S. Barli Chief Financial Officer 500,000 1.4 % 375,000
26 AS PLEIADENE 478,619 1.3 %
27 OSMANI VENTURE CAPITAL AS 478,221 1.3 %
28 ENIMAE AS 400,000 1.1 %
29 ASTEROIDEBAKKEN AS 319,079 0.9 %
30 PIIOTARHO AS 263,241 0.7 %
Others 9,456,839 26.1 % 312,500
Total 36,182,727 100.0 % 6,662,500
Ownership
16 %
11 %
73 %
Mgmt. &employees
Board ofDirectors
Others
70 %
28 %
2 %
Mgmt. &employees
Board ofDirectors
Others
