april2019 albuquerque metro · 2020-04-23 · survey, which asks more than 100 leading economists,...
TRANSCRIPT
www.zillow.com/research/
APRIL2019 Albuquerque Metro
National Home Values
Current: $226,800Monthly Change: -0.1%Quarterly Change: 0.4%Annual Change: 6.1%Negative Equity*: 8.2%
Albuquerque Home Values
Current: $199,500Monthly Change: -0.1%Quarterly Change: 0.7%Annual Change: 5.9%Negative Equity*: 10.4%
Home Values Forecast
(next 12 months)
National: 2.8%Albuquerque Metro: 2.8%
Major Cities - Home Values
AlbuquerqueCurrent: $201,800Monthly Change: -0.1%Annual Change: 5.7%
Rio RanchoCurrent: $192,800Monthly Change: -0.2%Annual Change: 4.8%
Los LunasCurrent: $150,900Monthly Change: -0.3%Annual Change: 4.5%
South ValleyCurrent: $154,100Monthly Change: 0.3%Annual Change: 10.2%
BelenCurrent: $120,800Monthly Change: -0.3%Annual Change: 4.7%
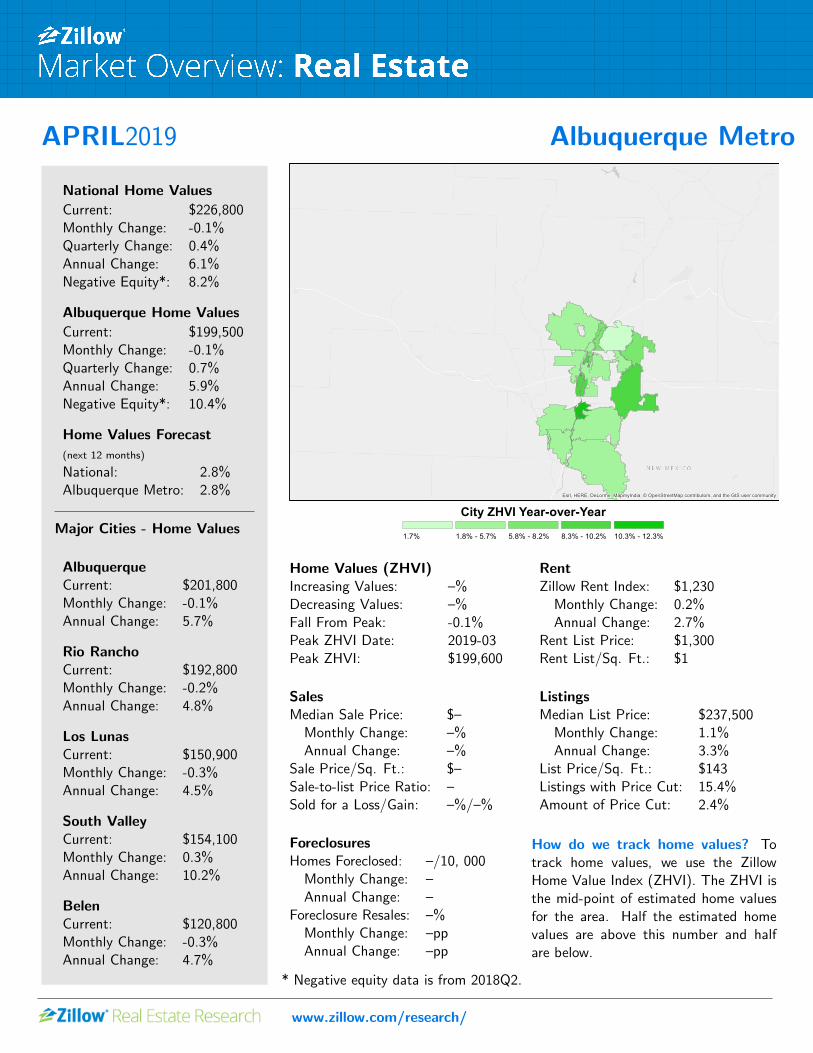
Esri, HERE, DeLorme, MapmyIndia, © OpenStreetMap contributors, and the GIS user community
City ZHVI Year-over-Year1.7% 1.8% - 5.7% 5.8% - 8.2% 8.3% - 10.2% 10.3% - 12.3%
Home Values (ZHVI)Increasing Values: –%Decreasing Values: –%Fall From Peak: -0.1%Peak ZHVI Date: 2019-03Peak ZHVI: $199,600
RentZillow Rent Index: $1,230Monthly Change: 0.2%Annual Change: 2.7%
Rent List Price: $1,300Rent List/Sq. Ft.: $1
SalesMedian Sale Price: $–Monthly Change: –%Annual Change: –%
Sale Price/Sq. Ft.: $–Sale-to-list Price Ratio: –Sold for a Loss/Gain: –%/–%
ListingsMedian List Price: $237,500Monthly Change: 1.1%Annual Change: 3.3%
List Price/Sq. Ft.: $143Listings with Price Cut: 15.4%Amount of Price Cut: 2.4%
ForeclosuresHomes Foreclosed: –/10, 000Monthly Change: –Annual Change: –
Foreclosure Resales: –%Monthly Change: –ppAnnual Change: –pp
How do we track home values? Totrack home values, we use the ZillowHome Value Index (ZHVI). The ZHVI isthe mid-point of estimated home valuesfor the area. Half the estimated homevalues are above this number and halfare below.
* Negative equity data is from 2018Q2.
APRIL2019
*The top 20 largest cities and top 10 (or all) counties within the metro are listed. Additional counties, cities, neighborhoods and ZIP codes may be
available online at www.zillow.com/research/data by emailing [email protected]
Zillow Research:Zillow R© is the leading real estate and rental marketplace dedicated to empowering consumers with data, inspiration and knowledge around the placethey call home, and connecting them with the best local professionals who can help. In addition, Zillow operates an industry-leading economics andanalytics bureau led by Zillow’s Chief Economist Dr. Svenja Gudell. Dr. Gudell and her team of economists and data analysts produce extensive housingdata and research covering more than 450 markets at Zillow Real Estate Research. Zillow also sponsors the quarterly Zillow Home Price ExpectationsSurvey, which asks more than 100 leading economists, real estate experts and investment and market strategists to predict the path of the Zillow HomeValue Index over the next five years. Zillow also sponsors the bi-annual Zillow Housing Confidence Index (ZHCI) which measures consumer confidence inlocal housing markets, both currently and over time. Launched in 2006, Zillow is owned and operated by Zillow Group (NASDAQ: Z), andheadquartered in Seattle.
www.zillow.com/research/
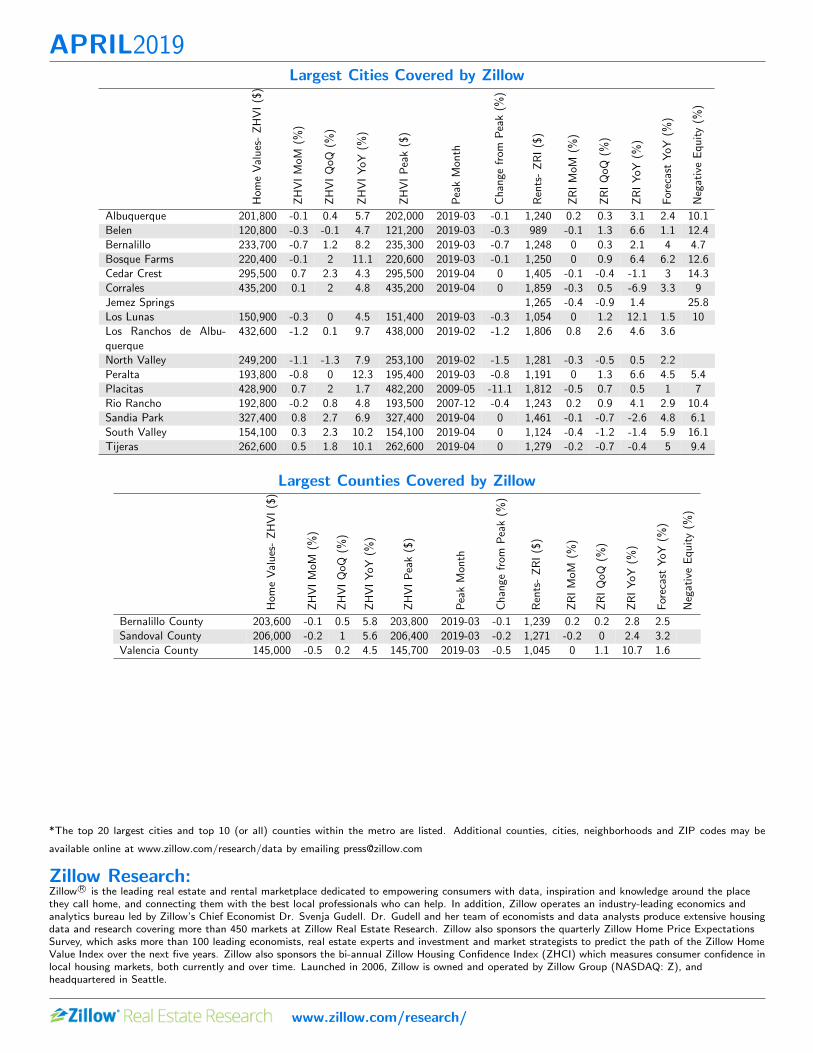
Largest Cities Covered by Zillow
Hom
eValues-ZHVI($)
ZHVIMoM
(%)
ZHVIQoQ
(%)
ZHVIYoY
(%)
ZHVIPeak($)
PeakMon
th
Change
from
Peak(%
)
Rents-ZRI($)
ZRIMoM
(%)
ZRIQoQ
(%)
ZRIYoY
(%)
ForecastYoY
(%)
NegativeEquity(%
)
Albuquerque 201,800 -0.1 0.4 5.7 202,000 2019-03 -0.1 1,240 0.2 0.3 3.1 2.4 10.1Belen 120,800 -0.3 -0.1 4.7 121,200 2019-03 -0.3 989 -0.1 1.3 6.6 1.1 12.4Bernalillo 233,700 -0.7 1.2 8.2 235,300 2019-03 -0.7 1,248 0 0.3 2.1 4 4.7Bosque Farms 220,400 -0.1 2 11.1 220,600 2019-03 -0.1 1,250 0 0.9 6.4 6.2 12.6Cedar Crest 295,500 0.7 2.3 4.3 295,500 2019-04 0 1,405 -0.1 -0.4 -1.1 3 14.3Corrales 435,200 0.1 2 4.8 435,200 2019-04 0 1,859 -0.3 0.5 -6.9 3.3 9Jemez Springs 1,265 -0.4 -0.9 1.4 25.8Los Lunas 150,900 -0.3 0 4.5 151,400 2019-03 -0.3 1,054 0 1.2 12.1 1.5 10Los Ranchos de Albu-querque
432,600 -1.2 0.1 9.7 438,000 2019-02 -1.2 1,806 0.8 2.6 4.6 3.6
North Valley 249,200 -1.1 -1.3 7.9 253,100 2019-02 -1.5 1,281 -0.3 -0.5 0.5 2.2Peralta 193,800 -0.8 0 12.3 195,400 2019-03 -0.8 1,191 0 1.3 6.6 4.5 5.4Placitas 428,900 0.7 2 1.7 482,200 2009-05 -11.1 1,812 -0.5 0.7 0.5 1 7Rio Rancho 192,800 -0.2 0.8 4.8 193,500 2007-12 -0.4 1,243 0.2 0.9 4.1 2.9 10.4Sandia Park 327,400 0.8 2.7 6.9 327,400 2019-04 0 1,461 -0.1 -0.7 -2.6 4.8 6.1South Valley 154,100 0.3 2.3 10.2 154,100 2019-04 0 1,124 -0.4 -1.2 -1.4 5.9 16.1Tijeras 262,600 0.5 1.8 10.1 262,600 2019-04 0 1,279 -0.2 -0.7 -0.4 5 9.4
Largest Counties Covered by Zillow
Hom
eValues-ZHVI($)
ZHVIMoM
(%)
ZHVIQoQ
(%)
ZHVIYoY
(%)
ZHVIPeak($)
PeakMon
th
Change
from
Peak(%
)
Rents-ZRI($)
ZRIMoM
(%)
ZRIQoQ
(%)
ZRIYoY
(%)
ForecastYoY
(%)
NegativeEquity(%
)
Bernalillo County 203,600 -0.1 0.5 5.8 203,800 2019-03 -0.1 1,239 0.2 0.2 2.8 2.5Sandoval County 206,000 -0.2 1 5.6 206,400 2019-03 -0.2 1,271 -0.2 0 2.4 3.2Valencia County 145,000 -0.5 0.2 4.5 145,700 2019-03 -0.5 1,045 0 1.1 10.7 1.6