april 8, 2005 from black-scholes to binomial – fas 123(r): working session on eso valuation...
TRANSCRIPT
April 8, 2005
From Black-Scholes to Binomial – From Black-Scholes to Binomial – FAS 123(R): Working Session on FAS 123(R): Working Session on
ESO Valuation MethodologiesESO Valuation Methodologies

2
Background
• Most companies have not adopted FAS 123 – “Accounting of Stock Based Compensation” as of the date of this presentation
• FAS 123(R) requires that financial statements for public companies realize the impact of stock-based compensation according to “fair value”
– Means valuations of employee stock options (ESOs) must be performed for current and future grants
• Companies must expense ESOs beginning for financial reporting periods starting after June 15, 2005
– Means that grants made between now and June 15, 2005 will begin to be expensed, so that proper valuation is critical right now
– Shareholders and external parties will be scrutinizing how companies perform these valuations

3
Accounting for Stock Options - Defining "Fair Value"
• Current valuation guidance in FAS 123(R) allows use of various valuation techniques or models:
– Black-Scholes is perceived to overstate the value by 10%-20%– Because it didn't affect earnings, companies ignored the
overstatement– FAS 123(R) does not explicitly state a preference for a lattice
model, but encourages its use: “…design of a lattice model more fully reflects the substantive characteristics of a particular employee share option…”
– “…an entity shall develop reasonable and supportable estimates for each assumption used in the model…taking into account both the contractual term of the option and the effects of employees’ expected exercise and post-vesting employment termination behavior.”

4
Black-Scholes and the Traditional Binomial Model
* Simplification such that there is an equal probability of downward and upward movements. This is not the case generally as the probability of upward and downward movements are governed by the volatility, the dividend yield, and the discount rate.
21 dNXedSNeC rtt
t
trXS
d
2
/ln2
1
tdd 12
Black-Scholes Traditional Binomial ModelProbability *
Illustration comparing closed-form Black-Scholes model with a traditional binomial model (present value of future cash flows)
S5,0
S4,0
S3,0 S5,1
S2,0 S4,1
S1,0 S3,1 S5,2
S0,0 S2,1 S4,2
S1,1 S3,2 S5,3
S2,2 S4,3
S3,3 S5,4
S4,4
S5,5
3.125%
15.625%
3.125%
31.25%
31.25%
15.625%

5
Benefits of a Binomial Model
• Presents much greater transparency to the users of financial information– Upward/downward stock movements are governed by underlying
stock volatility– Assumptions being used can be examined easily – Model is conceptually easier to understand than Black-Scholes
• Allows greater flexibility in modeling – Calculate option values during each distinct measurement period– Can use a term structure of volatility, a different volatility during
each distinct measurement period (i.e. implied volatility during first 3 months and long-term volatility thereafter)
– Use different risk-free rates of return during each distinct measurement period
– Can use different assumptions such as probability of exercise, termination, and mortality

6
S10,0
S9,0
S8,0 S10,1
S7,0 S9,1
S6,0 S8,1 S10,2
S5,0 S7,1 S9,2
S4,0 S6,1 S8,2 S10,3
S3,0 S5,1 S7,2 S9,3
S2,0 S4,1 S6,2 S8,3 S10,4
S1,0 S3,1 S5,2 S7,3 S9,4
S0,0 S2,1 S4,2 S6,3 S8,4 S10,5
S1,1 S3,2 S5,3 S7,4 S9,5
S2,2 S4,3 S6,4 S8,5 S10,6
S3,3 S5,4 S7,5 S9,6
S4,4 S6,5 S8,6 S10,7
S5,5 S7,6 S9,7
S6,6 S8,7 S10,8
S7,7 S9,8
S8,8 S10,9
S9,9
S10,10
500% 0.00% 0.00% 0.00% 95.00% 95.00% 95.00% 95.00% 95.00% 95.00% 95.00% 100.00%400% 0.00% 0.00% 0.00% 95.00% 95.00% 95.00% 95.00% 95.00% 95.00% 95.00% 100.00%300% 0.00% 0.00% 0.00% 95.00% 95.00% 95.00% 95.00% 95.00% 95.00% 95.00% 100.00%200% 0.00% 0.00% 0.00% 95.00% 95.00% 95.00% 95.00% 95.00% 95.00% 95.00% 100.00%190% 0.00% 0.00% 0.00% 95.00% 95.00% 95.00% 95.00% 95.00% 95.00% 95.00% 100.00%180% 0.00% 0.00% 0.00% 95.00% 95.00% 95.00% 95.00% 95.00% 95.00% 95.00% 100.00%170% 0.00% 0.00% 0.00% 89.58% 95.00% 95.00% 95.00% 95.00% 95.00% 95.00% 100.00%160% 0.00% 0.00% 0.00% 74.65% 89.58% 95.00% 95.00% 95.00% 95.00% 95.00% 100.00%150% 0.00% 0.00% 0.00% 62.21% 74.65% 89.58% 95.00% 95.00% 95.00% 95.00% 100.00%140% 0.00% 0.00% 0.00% 51.84% 62.21% 74.65% 89.58% 95.00% 95.00% 95.00% 100.00%130% 0.00% 0.00% 0.00% 43.20% 51.84% 62.21% 74.65% 89.58% 95.00% 95.00% 100.00%120% 0.00% 0.00% 0.00% 36.00% 43.20% 51.84% 62.21% 74.65% 89.58% 95.00% 100.00%110% 0.00% 0.00% 0.00% 30.00% 36.00% 43.20% 51.84% 62.21% 74.65% 89.58% 100.00%100% 0.00% 0.00% 0.00% 25.00% 30.00% 36.00% 43.20% 51.84% 62.21% 74.65% 100.00%
<100% 0.00% 0.00% 0.00% 15.00% 15.00% 15.00% 15.00% 15.00% 15.00% 15.00% 100.00%0-1 1-2 2-3 3-4 4-5 5-6 6-7 7-8 8-9 9-10 10+
Sto
ck P
rice
Rel
ativ
e to
Str
ike
Pri
ce
Time After Grant
The Aon Actuarial Binomial Model
Values the full term of the option
Applies probabilities based on exercise patterns and actuarial demographic analysis
Considers plan provisions of option program

7
Exercise Behaviors
• Exercise behavior and post-termination vesting behavior– Identified in FAS 123(R) and by FASB members as important to
good valuation– Most important components in valuation accuracy, compared to
other fair market value inputs– Has the most influence on differentiating the results arrived at by
different methodologies– Enhances credibility of ESO valuation results– Requires actuaries to study experience and create probabilities for
future expectations

8
Some Defining Events Regarding Exercise Behavior
Terminating Event: Separation from employment, retirement, death, or disability
Option Events:Forfeiture A non-vested option (either in-the-money or underwater) is
forfeited due to a Terminating Event
Cancellation A vested underwater option is cancelled because of a Terminating Event
Expiration A vested underwater option reaches its contractual termination
Exercise Exercise can be classified based on two types of events: (1) Exercises that occur when an in-the-money vested option is exercised due to a Terminating Event; (2) Exercises that occur when, absent a Terminating Event, an in-the-money option is exercised

9
Defining Events in a Binomial Model
S10,0
S9,0
S8,0 S10,1
S7,0 S9,1
S6,0 S8,1 S10,2
S5,0 S7,1 S9,2
S4,0 S6,1 S8,2 S10,3
S3,0 S5,1 S7,2 S9,3
S2,0 S4,1 S6,2 S8,3 S10,4
S1,0 S3,1 S5,2 S7,3 S9,4
S0,0 S2,1 S4,2 S6,3 S8,4 S10,5
S1,1 S3,2 S5,3 S7,4 S9,5
S2,2 S4,3 S6,4 S8,5 S10,6
S3,3 S5,4 S7,5 S9,6
S4,4 S6,5 S8,6 S10,7
S5,5 S7,6 S9,7
S6,6 S8,7 S10,8
S7,7 S9,8
S8,8 S10,9
S9,9
S10,10
Gra
nt
Da
te
Co
ntr
act
ua
l Te
rm =
Exp
iratio
n
Quadrant 1 -Pre-Vesting Forfeiture
Quadrant 2 -Post-Vesting Exercise In-The-Money
Quadrant 4 -Post-Vesting Cancellation Out-of -the-Money

10
Defining Events in The Aon Actuarial Binomial Model
• Defining events are:– Distributed throughout contractual period– Stated in terms of probabilities, combining Terminating Event and Option
Event>1000% 0.00% 100.00% 100.00% 100.00% 100.00% 100.00% 100.00% 100.00% 100.00% 100.00% 100.00%
900% - 999.99% 0.00% 95.00% 95.00% 95.00% 95.00% 95.00% 95.00% 95.00% 95.00% 95.00% 100.00%
800% - 899.99% 0.00% 95.00% 95.00% 95.00% 95.00% 95.00% 95.00% 95.00% 95.00% 95.00% 100.00%
700% - 799.99% 0.00% 95.00% 95.00% 95.00% 95.00% 95.00% 95.00% 95.00% 95.00% 95.00% 100.00%
600% - 699.99% 0.00% 95.00% 95.00% 95.00% 95.00% 95.00% 95.00% 95.00% 95.00% 95.00% 100.00%
500% - 599.99% 0.00% 95.00% 95.00% 95.00% 95.00% 95.00% 95.00% 95.00% 95.00% 95.00% 100.00%
400% - 499.99% 0.00% 95.00% 95.00% 95.00% 95.00% 95.00% 95.00% 95.00% 95.00% 95.00% 100.00%
300% - 399.99% 0.00% 95.00% 87.50% 93.75% 95.00% 95.00% 95.00% 95.00% 95.00% 95.00% 100.00%
200% - 299.99% 0.00% 80.00% 70.00% 75.00% 80.00% 85.00% 90.00% 95.00% 95.00% 95.00% 100.00%
190% - 199.99% 0.00% 75.00% 60.00% 70.00% 75.00% 80.00% 85.00% 90.00% 90.00% 90.00% 100.00%
180% - 189.99% 0.00% 70.00% 55.00% 65.00% 70.00% 75.00% 80.00% 85.00% 85.00% 85.00% 100.00%
170% - 179.99% 0.00% 65.00% 50.00% 60.00% 65.00% 70.00% 75.00% 80.00% 80.00% 80.00% 100.00%
160% - 169.99% 0.00% 60.00% 45.00% 55.00% 60.00% 65.00% 70.00% 75.00% 75.00% 75.00% 100.00%
150% - 159.99% 0.00% 55.00% 40.00% 50.00% 55.00% 60.00% 65.00% 65.00% 65.00% 65.00% 100.00%
140% - 149.99% 0.00% 50.00% 35.00% 45.00% 50.00% 55.00% 55.00% 55.00% 55.00% 55.00% 100.00%
130% - 139.99% 0.00% 45.00% 30.00% 40.00% 45.00% 45.00% 45.00% 50.00% 50.00% 50.00% 100.00%
120% - 129.99% 0.00% 35.00% 20.00% 30.00% 35.00% 35.00% 35.00% 40.00% 40.00% 40.00% 100.00%
110% - 119.99% 0.00% 25.00% 15.00% 20.00% 25.00% 25.00% 25.00% 30.00% 30.00% 30.00% 100.00%
100% - 109.99% 0.00% 15.00% 13.00% 15.00% 15.00% 15.00% 15.00% 20.00% 20.00% 20.00% 100.00%
< 100% 0.00% 12.00% 12.00% 12.00% 12.00% 12.00% 12.00% 12.00% 12.00% 12.00% 100.00%
0.00-0.99 1.00-1.99 2.00-2.99 3.00-3.99 4.00-4.99 5.00-5.99 6.00-6.99 7.00-7.99 8.00-8.99 9.00-9.99 10.00
Time After Grantdate (In Years)
Rat
io o
f S
tock
Pri
ce t
o S
trik
e P
rice

11
Developing Exercise Behavior – Variables
• Determine drivers of Option Event activity
Core Variables– Elapsed time from the grant date– Current market price relative to the strike price
Supplemental Variables– Continued employment by the option holder– Demographic characteristics
•Age at grant•Gender•Pay
– Wealth diversification needs by the option holder– Immediate cash flow needs by the option holder
12
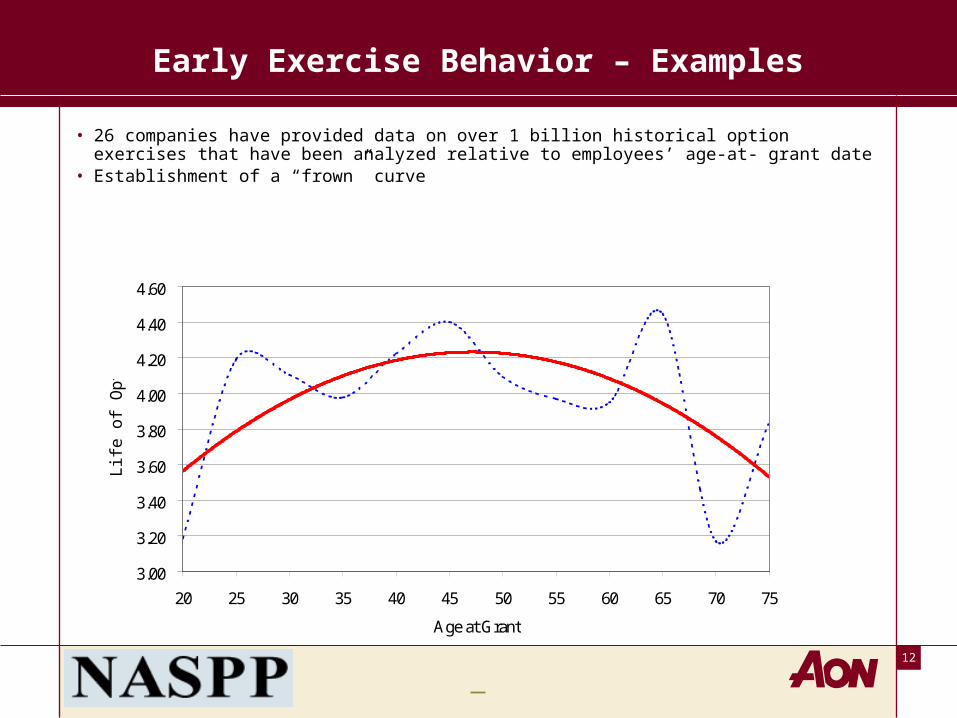
Early Exercise Behavior – Examples
• 26 companies have provided data on over 1 billion historical option exercises that have been analyzed relative to employees’ age-at- grant date
• Establishment of a “frown” curve
3.00
3.20
3.40
3.60
3.80
4.00
4.20
4.40
4.60
20 25 30 35 40 45 50 55 60 65 70 75
Age at Grant
Lif
e of
Opt
ion
13
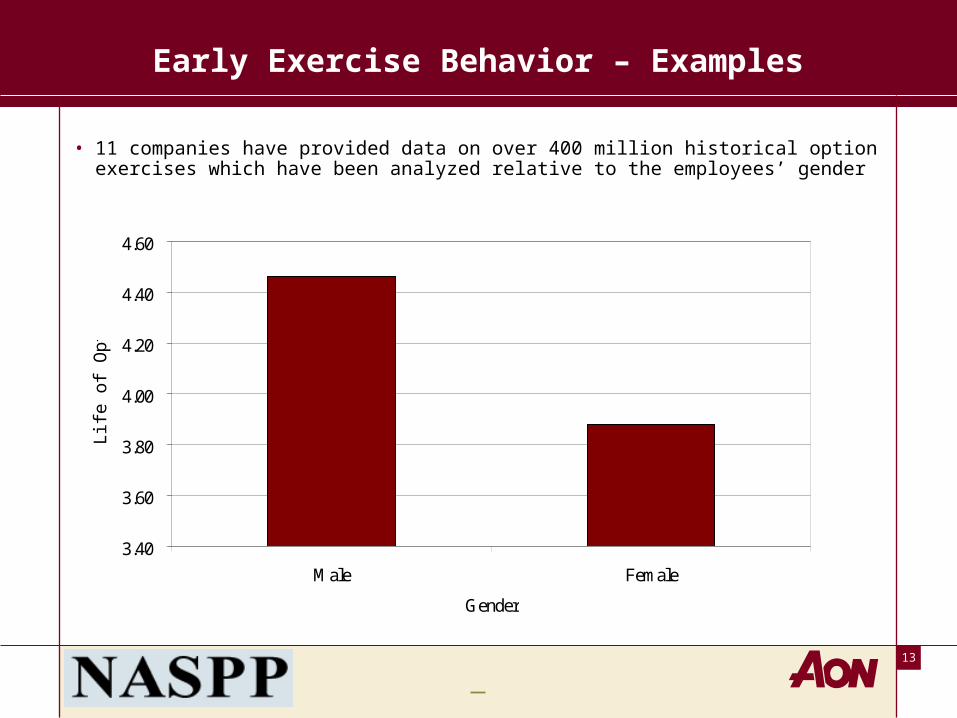
Early Exercise Behavior – Examples
• 11 companies have provided data on over 400 million historical option exercises which have been analyzed relative to the employees’ gender
3.40
3.60
3.80
4.00
4.20
4.40
4.60
Male Female
Gender
Lif
e of
Opt
ion

14
Example of Exercise Behavior from a Financial Client
• FAS 123(R) states that option pricing models should consider the exercise patterns of the employees
• Graph on following page compares historical exercise experience (line) to distribution built within Aon model (bars)– The valuation’s average life output of the Aon model is the same as
the input expected life for the Black-Scholes model– However, more appropriate distribution of exercise patterns yielded
9% reduction in fair market value from Black-Scholes value– 9% reduction in fair market value worth approximately $20 million
in compensation expense

15
Example of Exercise Behavior from a Financial Client
0.00%
5.00%
10.00%
15.00%
20.00%
25.00%
30.00%
-Year0-1
-Year1-2
-Year2-3
-Year3-4
-Year4-5
-Year5-6
-Year6-7
-Year7-8
-Year8-9
-Year9-10
0.00%
5.00%
10.00%
15.00%
20.00%
25.00%
30.00%

16
Developing Economic Assumptions -- Volatility
• Factors to consider in estimating expected volatility– Term structure of volatility of share price– Implied volatility of share price– Length of time entity’s shares have been publicly traded– Mean reverting tendency of volatilities– Appropriate intervals for price observations– Corporate structure
• Binomial models can incorporate a term structure
• Peer groups companies should also be considered
17
Developing Economic Assumptions -- Volatility
• Important to study volatility of peer group– Data suggests that positive correlation exists between peers and
client company– Serves as a check that client volatility is not divergent from that of
peer group; if it is, then why?
• All alternatives offered in a range should be reasonable and acceptable– Some will be more reasonable and better estimates than others– FAS 123(R) states that if all estimates in a range are reasonable, then
the estimate in the middle of the range should be selected

18
Developing Economic Assumptions -- Dividends
• Dividend yield or expected dividend amount may be used– Important to anticipate increases in dividend amounts for setting
dividend assumption– Understand the client’s dividend policy and history– Suggest range that may reflect stock price movement over certain
time period
• Impact of dividend assumption on volatility– Stock prices used to set volatility should be redeveloped by
removing effect of ex-dividend– Paragraphs 406-409 of FAS 123 directs users on necessary
adjustments
19
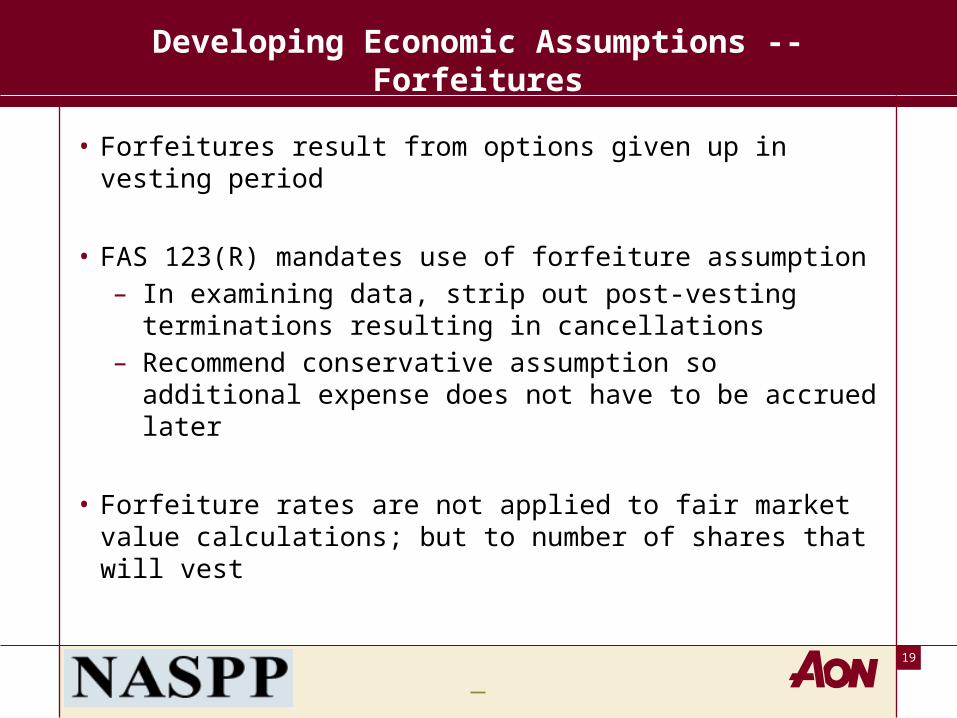
Developing Economic Assumptions -- Forfeitures
• Forfeitures result from options given up in vesting period
• FAS 123(R) mandates use of forfeiture assumption– In examining data, strip out post-vesting terminations resulting in
cancellations– Recommend conservative assumption so additional expense does not
have to be accrued later
• Forfeiture rates are not applied to fair market value calculations; but to number of shares that will vest

20
New Attribution Approach
• FAS 123 allowed companies who had graded vesting schedules the choice of straight-lining the expense or attributing options by each vesting tranche– Nearly all companies chose to straight-line the expense
• New FASB statement prefers companies to value stock options and attribute stock options over each respective vesting tranche (FIN 28)– Provides better valuation of "fair value"– More appropriately matches expense with experience– Effectively frontloads expense
• However, attribution has been decoupled from valuation

21
Accounting for Stock Options - Summary
• To provide for more transparent financial statements and a better estimate of “fair value” than Black-Scholes – Consider restrictions of ESOs (non-transferability, vesting, etc.)– Study historical exercise patterns of employees– Use dynamic assumptions that are time-dependent
• To be consistent with Sarbanes-Oxley– Segregate valuation and consulting services from independent
auditor and/or internal corporate resources– Follow corporate governance procedures– Obtain auditor sign-off under GAAS and GAAP

CASE STUDYCASE STUDY

23
Process
• Peer Group Analysis
• Data Analysis
• Assumption Analysis
• Assumption Alternatives
• Valuation Results

24
Initial Peer Group
• ABC Company supplied Aon Consulting with a list of 11 companies to be included in this study as its peers for the Initial Peer Group. –Broad range of industries (biotech, semiconductor, electronic security, surgical & medical equipment)
–Revenues between $1M to $256M, and market capitalization between $106M to $450M.
–Median revenues of $111M and median market capitalization of $328M.
• It is important to have an appropriate peer group foundation.

25
Initial Peer Data – Expected Life
Peer CompanyPrior Year FAS 123
Expected Life
Company 11 1.00-6.00
Company 2 2.92
Company 3 5.70
Company 4 5.00
Company 5 6.30
Company 6 4.00
Company 7 7.00
Company 8 8.83
Company 9 4.00
Company 10 5.00
Company 11 5.00
Average 5.38
Median 5.00
ABC COMPANY 5.00
Footnote1 Not included in the peer group average and median calculations

26
Company Data – Exercise Experience
Grant Year
Options Exercised
Exercise Life
Options Remaining
Remaining Life Total
Exercise at Full Vesting
Exercise at Midpoint
Exercise at Full Term
1989 279 3.50 - - 279 3.50 3.50 3.501990 214 6.83 - - 214 6.83 6.83 6.831991 1,555 7.23 - - 1,555 7.23 7.23 7.231992 1,769 6.07 - - 1,769 6.07 6.07 6.071993 809 4.85 - - 809 4.85 4.85 4.851994 751 4.04 - - 751 4.04 4.04 4.041995 132,031 2.90 904,012 1.03 1,036,043 8.19 8.64 9.091996 54,004 4.06 389,482 1.59 443,486 7.88 8.58 9.281997 543,423 3.07 457,122 2.69 1,000,545 5.01 5.62 6.231998 463,528 3.60 327,194 3.67 790,722 4.73 5.49 6.251999 232,062 3.01 386,251 4.83 618,313 4.36 5.87 7.382000 69,389 2.55 682,492 5.74 751,881 4.10 6.71 9.312001 73,434 3.12 565,928 6.51 639,362 3.45 6.33 9.212002 102,877 2.05 1,053,931 7.44 1,156,808 2.52 5.90 9.292003 31,291 1.16 652,041 8.45 683,332 2.02 5.56 9.60
Average 1,708,319 3.11 6,353,140 5.59 8,061,459 4.34 6.34 8.54

27
Company Data – Exercise Experience
Age Groupings Age 20 25 30 35 40 45 50 55
2004 Percentage 0.00% 7.89% 9.71% 53.09% 14.64% 5.84% 6.68% 2.15% Historical Percentage 0.39% 7.86% 9.31% 55.23% 13.71% 6.30% 5.46% 1.75% Historical Trend 3.09 3.53 3.79 3.86 3.74 3.43 2.94 2.25
Historical Weighted Average Option Life Based upon Historical Trendline 41.87Prospective Age Weighted Option Life based upon Historical Trendline 40.49
Historical Weighted Average Option Life 3.65Prospective Age Weighted Option Life based upon Historical Trendline 3.72Adjustment Factor from Historical Exercise Behavior 101.94%
0 .0 0
1 .0 0
2 .0 0
3 .0 0
4 .0 0
5 .0 0
6 .0 0
7 .0 0
2 0 2 5 3 0 3 5 4 0 4 5 5 0 5 5
A g e a t G ra n t
Lif
e o
f O
pti
on
D a ta P o ints P o ly. (D a ta P o ints)

28
Initial Peer Data – Expected Volatility
Years Median of Most Recent Prior Yearof Mean 5.0 Year 1.0-Year Implied FAS 123
Peer Company Data Reversion 1 Life 2 Volatility Volatility 3 Selection 4
Company 1 9.38 86.53% 100.64% 73.41% 66.82% 52.22% / 115.30% 115.00%Company 2 13.87 59.00% 60.49% 56.63% 62.49% 48.42% / 103.87% 80.00%Company 3 10.84 68.08% 71.90% 39.89% 60.90% 40.97% / 209.57% 84.60%Company 4 13.87 73.59% 65.06% 68.36% N/A 53.93% / 139.54% 83.00%Company 5 11.95 54.01% 56.09% 42.46% 51.28% 35.68% / 69.07% 60.00%Company 6 13.87 56.36% 56.41% 33.84% 44.28% 26.77% / 54.26% 70.00%Company 7 13.87 42.69% 33.05% 53.12% N/A N/A / N/A 38.00%Company 8 13.87 63.28% 58.23% 59.31% 68.61% 48.49% / 98.03% 87.00%Company 9 6.41 74.34% 78.08% 57.26% N/A N/A / N/A 93.00%Company 10 13.42 35.25% 35.03% 27.18% N/A N/A / N/A 50.00%Company 11 11.56 50.95% 51.76% 26.63% N/A N/A / N/A 71.80%Average 60.37% 60.61% 48.92% 59.06% 43.78% / 112.81% 75.67%Median 59.00% 58.23% 53.12% 61.70% 48.42% / 103.87% 80.00%ABC Company 4.02 67.87% N/A 43.98% N/A N/A / N/A 57.00%ABC Company (Post 2000) 3.08 57.82% N/A 43.98% N/A N/A / N/A 57.00%
Footnotes:1 The Mean Reversion represents the annualized volatility of the stock prices over it's entire stock history2 If a volatility is calculated over a 5.0-year life at every point throughout a stock's history, this represents the median of these volatilities 3Implied Volatility is the underlying volatility in the open market of publicly traded Call options as quoted on ivolatility.com on 2/4/2004.4 Represents the volatility selection for the prior reporting year as disclosed in their financial statements.
Implied Volatility52 Week
Min / Max

29
Company Data – Historical Volatility
ABC Company

30
Peer Group Analysis
• Aon Consulting developed an additional peer group of 15 companies to develop the Revised Peer Group.
• Companies who develop, manufacture and market medical/surgical systems and/or products
• Companies with revenues that generally fall between $50M to $100M
• Companies with positive three-year revenue growth• Companies with employee populations greater than 150
but less than 500

31
Revised Peer Data – Expected Life
Peer CompanyPrior Year FAS 123
Expected Life
Company 12 5.00
Company 13 5.00
Company 14 6.50
Company 151 3.00 – 7.00
Company 5 6.30
Company 6 4.00
Company 16 4.00
Company 17 5.00
Company 18 4.50
Company 19 6.10
Average 5.16
Median 5.00
ABC COMPANY 5.00
Footnote1 Not included in the peer group average and median calculations

32
Revised Peer Data – Average Life Alternatives
• Alternative A – 6.34 Years – This is based on the average of the weighted average expected life using actual exercise experience and the actual experience if it is assumed that outstanding options will be exercised at their midpoint of their remaining expected life.
• Alternative B – 5.10 Years – This is based the actual selection by the client for 2003 and the median peer group selection for the 2003 FAS 123 valuations but with adjustments for the average age of the client’s 2004 grant recipients.
5.00 x 101.94% = 5.10
• Alternative C – 5.00 Years – This is based the actual selection by the client for 2003 and the median peer group selection for the 2003 FAS 123 valuations. Since a large majority of the client’s option grants have yet to complete their full term, peer data may be more representative.
• Alternative D – 4.67 Years – This is an average based on the weighted average exercise-at-full- vesting and peer data.
4.34 + 5.00 = 4.67 2
• Alternative E – 4.34 Years – This is based on the weighted average exercise-at-full-vesting. This number may underestimate the experience since all outstanding options are assumed to exercise as early as they can.

33
Revised Peer Data – Expected Volatility
Years Median of Most Recent Prior Yearof Mean 5.0 Year 1.0-Year Implied FAS 123
Peer Company Data Reversion 1 Life 2 Volatility Volatility 3 Selection 4
Company 12 11.72 42.16% 46.04% 44.67% 36.05% 25.68% / 67.28% 49.28%Company 13 18.08 40.98% 43.22% 41.32% 22.76% 16.26% / 33.92% 22.80%Company 14 16.01 39.12% 40.60% 40.48% 19.31% 17.09% / 37.02% 35.80%Company 15 9.15 40.17% 46.52% 34.56% 26.39% 24.02% / 47.77% 37.00%Company 5 11.95 54.01% 56.09% 54.80% 51.28% 35.68% / 69.07% 60.00%Company 6 13.87 56.36% 56.41% 54.46% 44.28% 26.77% / 51.38% 70.00%Company 16 7.92 80.52% 89.80% 83.65% 36.87% 32.45% / 54.69% 84.00%Company 17 8.00 60.20% 64.41% 62.49% 41.41% 35.76% / 60.22% 70.00%Company 18 8.48 60.95% 67.89% 56.57% 46.73% 27.05% / 58.01% 61.00%Company 19 6.98 65.66% 71.32% 67.68% 49.52% 31.99% / 60.09% 85.00%Average 54.01% 58.23% 54.07% 37.46% 27.28% / 53.95% 57.49%Median 55.19% 56.25% 54.63% 39.14% 26.91% / 56.35% 60.50%ABC Company 4.02 67.87% N/A 43.98% N/A N/A / N/A 57.00%ABC Company (Post 2000) 3.08 57.82% N/A 43.98% N/A N/A / N/A 57.00%
Footnotes:1The Mean Reversion represents the annualized volatility of the stock prices over it's entire stock history2If a volatility is calculated over a 5.0-year life at every point throughout a stock's history, this represents the median of these volatilities 3
Implied Volatility is the underlying volatility in the open market of publicly traded Call options as quoted on ivolatility.com on 2/4/2004.4Represents the volatility selection for the prior reporting year as disclosed in their financial statements.
Implied Volatility52 Week
Min / Max

34
Revised Peer Data – Volatility Alternatives
• Alternative A – 59.28% - Based upon a weighted average combining the median of the peer group implied volatility, most recent one-year client stock volatility, 75% of the mean reversion volatility of client stock, and 25% of the median of the mean reversion volatility of the client’s peers.
0.25 x 39.14% + 1.00 x 43.98% + 3.75 x 67.87 + 3.75 x 25% x 55.19% = 59.28% 5.00 5.00 5.00 5.00
• Alternative B – 55.25% - Based upon a weighted average combining the median of the peer group implied volatility, most recent one-year client stock volatility, and on the mean reversion volatility of client stock after carving out year 2000 anomalies.
0.25 x 61.70 + 1.00 x 43.98% + 3.75 x 57.82% = 55.25% 5.00 5.00 5.00
• Alternative C – 55.00% - Based on the client’s selection for expected volatility in valuing their options granted in 2004.
• Alternative D – 53.13% - Based upon a weighted average combining the median of the peer group implied volatility, most recent one-year client stock volatility, 50% of the mean reversion volatility of client stock carving out year 2000 anomaly, and 50% of the median of the mean reversion volatility of the client’s peers.
0.25 x 39.14% + 1.00 x 43.98% + 3.75 x 57.82% + 3.75 x 50% x 55.19% = 53.13% 5.00 5.00 5.00 5.00
• Alternative E – 52.44% - Based upon a weighted average combining the median of the peer group implied volatility, most recent one-year client stock volatility, 25% of the mean reversion volatility of client stock, and 75% of the median of the mean reversion volatility of the client’s peers.
0.25 x 55.19% + 1.00 x 43.98% + 3.75 x 25% x 57.82% + 3.75 x 75% x 55.19% = 52.44% 5.00 5.00 5.00 5.00
35
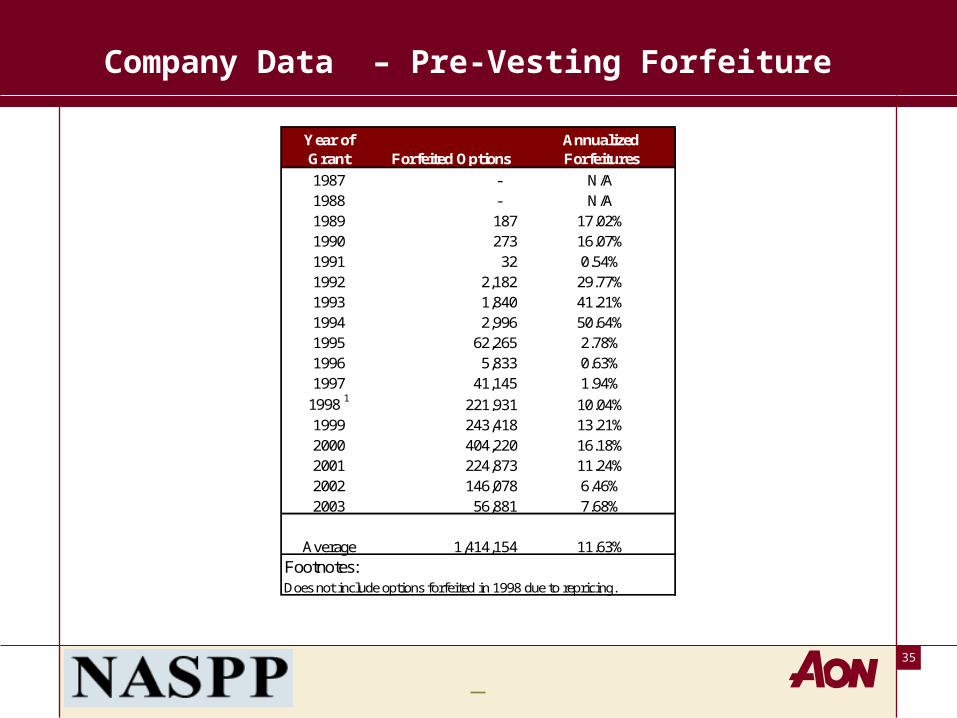
Company Data – Pre-Vesting Forfeiture
Year of Grant Forfeited Options
Annualized Forfeitures
1987 - N/A1988 - N/A1989 187 17.02%1990 273 16.07%1991 32 0.54%1992 2,182 29.77%1993 1,840 41.21%1994 2,996 50.64%1995 62,265 2.78%1996 5,833 0.63%1997 41,145 1.94%
1998 1 221,931 10.04%1999 243,418 13.21%2000 404,220 16.18%2001 224,873 11.24%2002 146,078 6.46%2003 56,881 7.68%
Average 1,414,154 11.63%Footnotes:Does not include options forfeited in 1998 due to repricing.

36
Forfeiture Alternatives
• Alternative A – 0.00% - This is based on ABC’s assumption in prior years
• Alternative B – 6.30% - A conservative annual forfeiture rate assumption based on analysis of expected forfeiture data based on ABC’s current demographics.
• Alternative C – The following table combines the voluntary turnover provided by ABC (an average of quarters 1, 2, and 3) and the prospective actuarial analysis.
• Alternative D – 11.63% - This is based on historical forfeiture seen to date
Time TurnoverYear 0 - 1 10.3%Year 1 - 2 7.7%Year 2 - 3 7.0%Year 3 - 4 6.8%Year 4 - 5 5.4%Year 5 - 6 5.3%Year 6 - 7 5.0%Year 7 - 8 5.0%Year 8 - 9 5.0%
Year 9 - 10 5.0%

37
Final Assumptions Selections
ABC Aon
Fiscal Year 2004 2004
Volatility 55.68% 45.25%
Risk Free Rate 3.21% 3.07%
Expected Life 5.00 5.24
Dividend Yield 0.00% 0.00%

38
Valuation Results & Sensitivity Analysis
Grant Price Fair Value % of Grant Incremental Comparison
Cumulative Comparison
Weighted Average Grant Price
$15.37
Fair Value (ABC Company assumptions – Black-Scholes model
$7.83 50.91% 0.00% 0.00%
Fair Value (revise Risk-Free Rate to 3.07% - Black-Scholes model)
$7.80 50.72% -0.36% -0.36%
Fair Value (revise Expected Volatility to 55.00% - Black-Scholes model)
$7.73 50.26% -1.27% -1.27%
Fair Value (Aon Actuarial Binomial Model, Single Option Model)
$6.87 44.69% -11.10% -12.23%
• A Single Option Model was used

39
“Next Step” Considerations
• How will new valuation and accounting rules impact your use and distribution of employee stock options in future?
• Will you continue to offer same types of options as you have used in the past?…..or will they be redesigned?
• How will you assess economic value for purposes of designing award levels in light of new valuation rules?
• Have you had preliminary discussions with your auditors on how they view compliance with the new rules?
• Is it worth doing some planning now to get ready for the impact of adoption of the new rules later in 2005?

40
Questions
For more information, please contact:Philip A. Peterson, FSASenior Vice President
Aon Consulting610.834.2169
Terry AdamsonVice PresidentAon Consulting610.834.2280
Thank you!