apresentação datamar eng - imsf · dataliner –container terminals btp santos brasil tcp...
TRANSCRIPT
Agenda
•What does Datamar do
•Manifest contribution system
•Brazil’s current scenario
What do we do?Datamar provides data, analysis and associated services on the maritime and foreign trade segments of the East Coast of South America.
Including:
• Detailed data on Exports and Imports to / from Brazil, Argentina, Uruguay and Paraguay
• Terminals – updated information on terminals infrastructure, equipment, shareholding, vessel calls, cargo throughput.
• News Publication
• Consulting Services
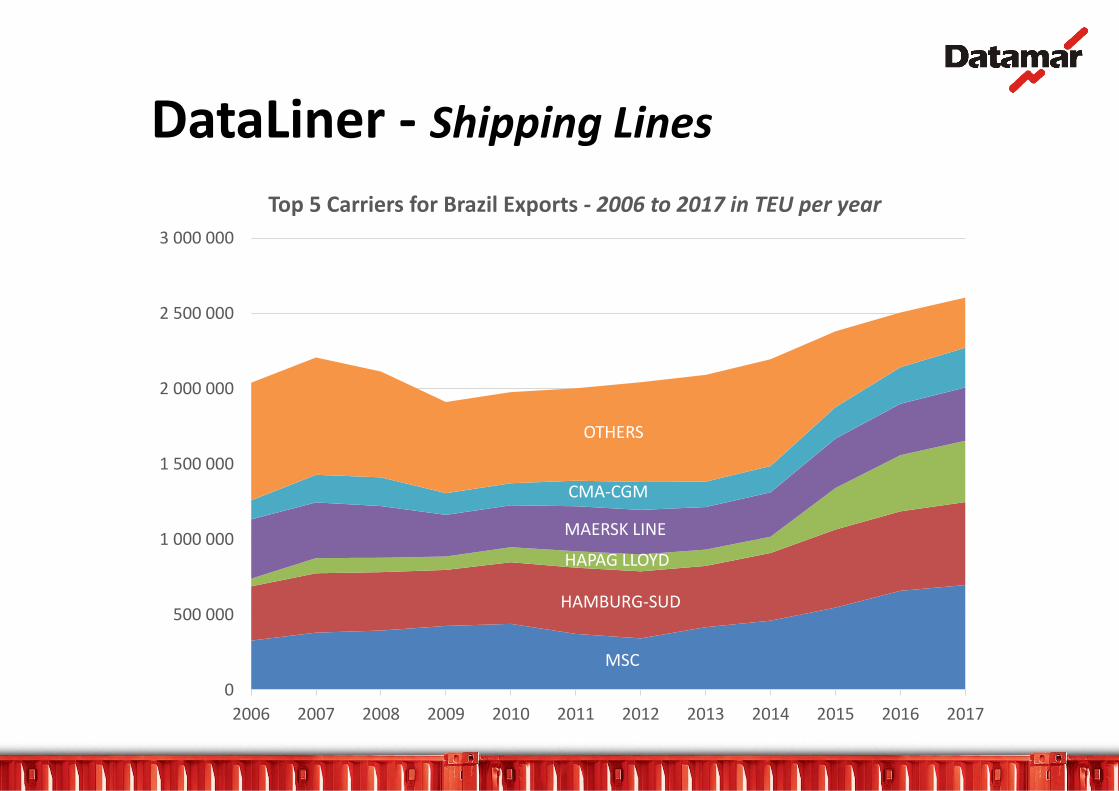
DataLiner - Shipping Lines
MSC
HAMBURG-SUD
HAPAG LLOYD
MAERSK LINE
CMA-CGM
OTHERS
0
500 000
1 000 000
1 500 000
2 000 000
2 500 000
3 000 000
2006 2007 2008 2009 2010 2011 2012 2013 2014 2015 2016 2017
Top 5 Carriers for Brazil Exports - 2006 to 2017 in TEU per year
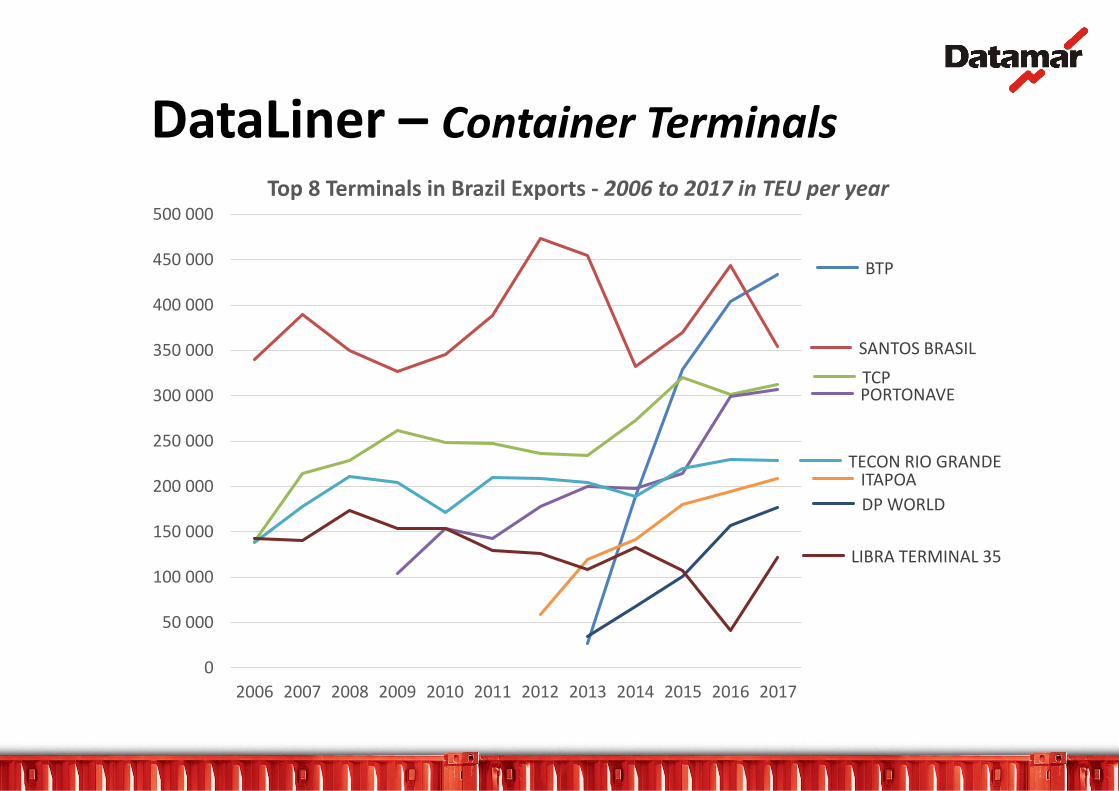
DataLiner – Container Terminals
BTP
SANTOS BRASIL
TCPPORTONAVE
TECON RIO GRANDEITAPOA
DP WORLD
LIBRA TERMINAL 35
0
50 000
100 000
150 000
200 000
250 000
300 000
350 000
400 000
450 000
500 000
2006 2007 2008 2009 2010 2011 2012 2013 2014 2015 2016 2017
Top 8 Terminals in Brazil Exports - 2006 to 2017 in TEU per year
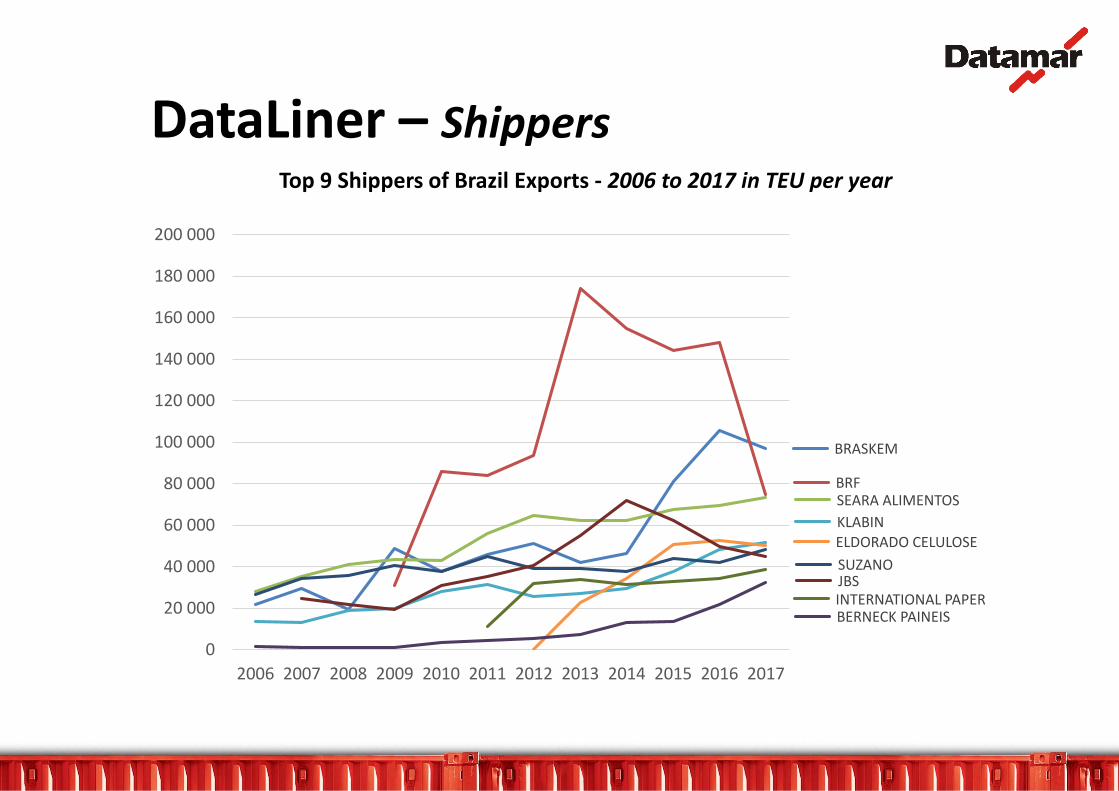
DataLiner – Shippers
BRASKEM
BRFSEARA ALIMENTOS
KLABIN
ELDORADO CELULOSE
SUZANOJBSINTERNATIONAL PAPERBERNECK PAINEIS
0
20 000
40 000
60 000
80 000
100 000
120 000
140 000
160 000
180 000
200 000
2006 2007 2008 2009 2010 2011 2012 2013 2014 2015 2016 2017
Top 9 Shippers of Brazil Exports - 2006 to 2017 in TEU per year

DataLiner – Commodities
02 - MEAT AND EDIBLE MEAT OFFAL
44 - WOOD AND ARTICLES OF WOOD39 - PLASTICS AND ARTICLES THEREOF
09 - COFFEE, TEA, MATE AND SPICES
OTHERS
0
500 000
1 000 000
1 500 000
2 000 000
2 500 000
3 000 000
2010 2011 2012 2013 2014 2015 2016 2017
Top 7 Brazil Export Commodities in HS2 - 2010 to 2017 in TEU per year

Datamar monitors vessel calls, creates and maintains a terminals database, tracks changes to shipping services and updates port and terminal throughput figures regularly. Datamar also receives detailed information, such as ship manifests, from its partners within the maritime community. Governmentdata is also stored andcleaned to supply high quality and easy-to-use services to the market by adding value to its data.
Manifests
Shipping Moves
Carriers
Port Authorities
Shipping Agencies
Manifests
Container throughput
Official statisticsGovernment data
AIS Ship Monitoring Service
DatamarWeek
CompCont
Liner Services -VSAs
DataLiner
Terminals Database
Datamar Consulting
Primaryresearch
Original Data
Data Sources

Manifest agreement
Carriers send ship manifests to Datamar
voluntarily
Datamar matches the information with
other datasets
Data Harmonization and Standardization
DataLiner product is delivered to carriers
and third parties
Time lag to DataLinerrelease is one month.
On 1st of May, fullMarch data will be
released.
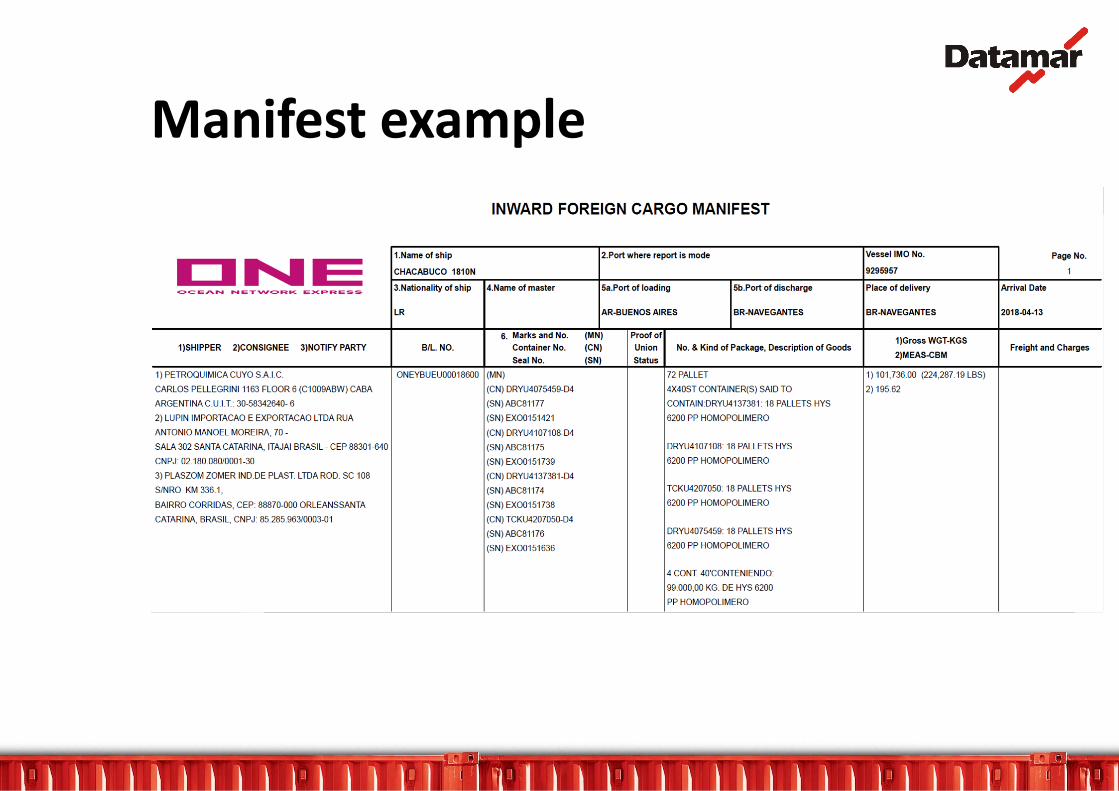
Manifest example
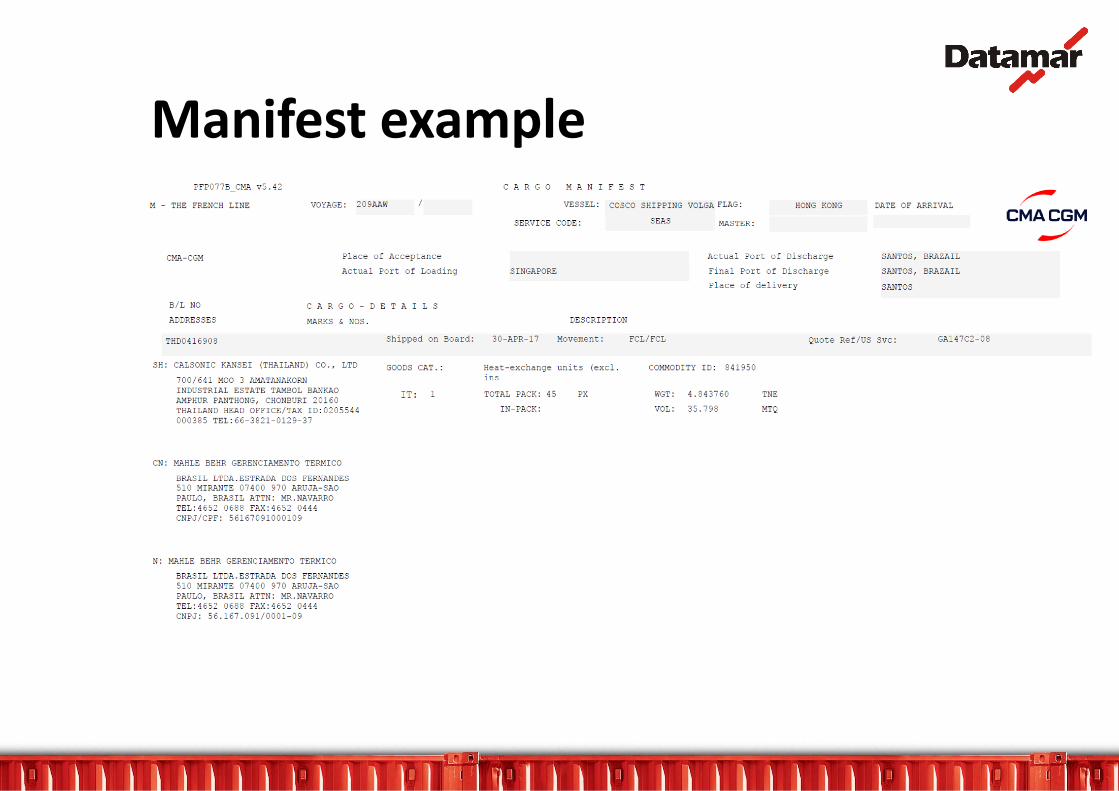
Manifest example
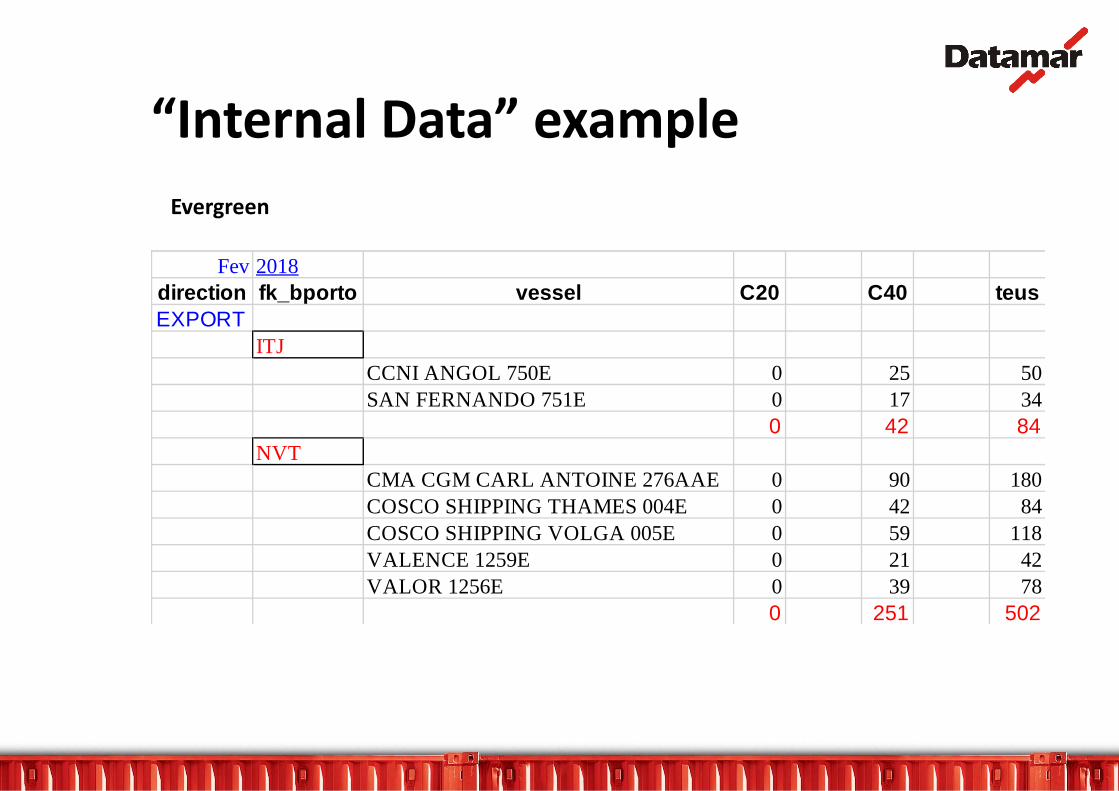
“Internal Data” example
Fev 2018
direction fk_bporto vessel C20 C40 teus
EXPORT
ITJ
CCNI ANGOL 750E 0 25 50
SAN FERNANDO 751E 0 17 34
0 42 84
NVT
CMA CGM CARL ANTOINE 276AAE 0 90 180
COSCO SHIPPING THAMES 004E 0 42 84
COSCO SHIPPING VOLGA 005E 0 59 118
VALENCE 1259E 0 21 42
VALOR 1256E 0 39 78
0 251 502
Evergreen

DataLiner example

Brazil’s current scenario• Operation Car Wash –
unprecedented corruption butalso unprecedentedpunishment of politicians andexecutives
• Elections in October 2018 –with Lula in prison there is a vacuum
• Delay in Pensions Reform hasled to downgrade of Braziliangovernment bonds to junkstatus by Rating Agencies.
• Currently low inflation andlowest ever interest rates –encouraging fixed investments.
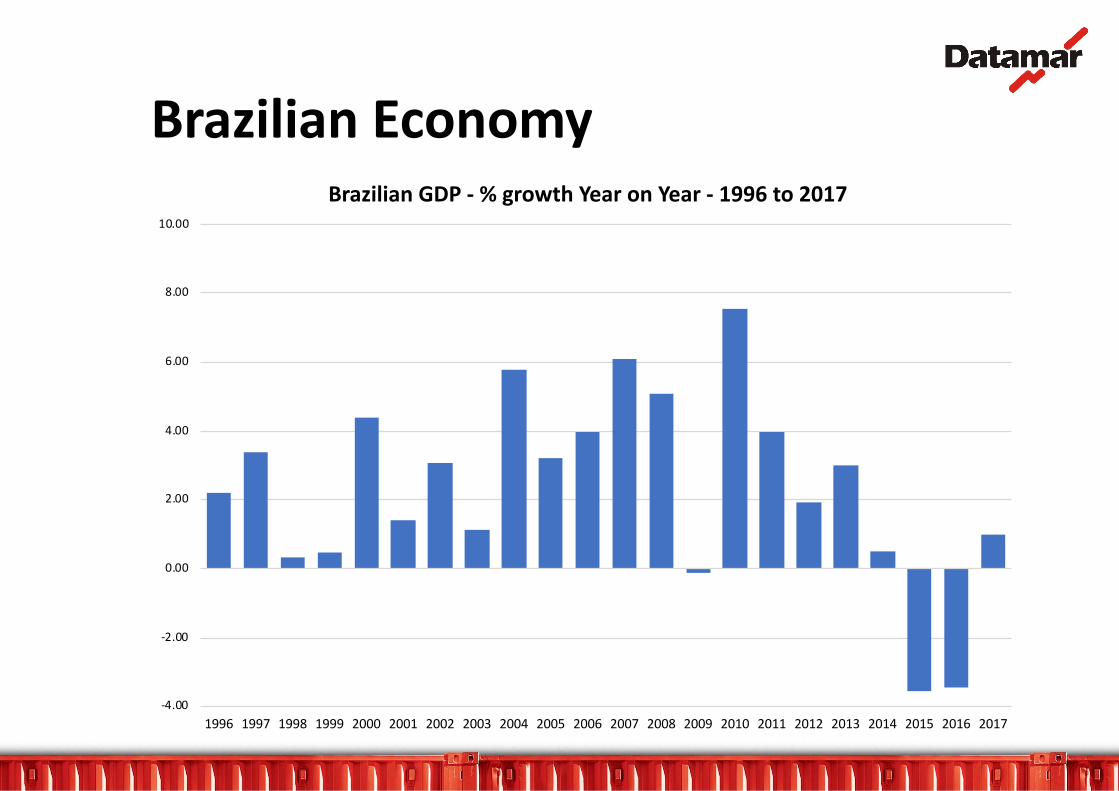
Brazilian Economy
-4.00
-2.00
0.00
2.00
4.00
6.00
8.00
10.00
1996 1997 1998 1999 2000 2001 2002 2003 2004 2005 2006 2007 2008 2009 2010 2011 2012 2013 2014 2015 2016 2017
Brazilian GDP - % growth Year on Year - 1996 to 2017
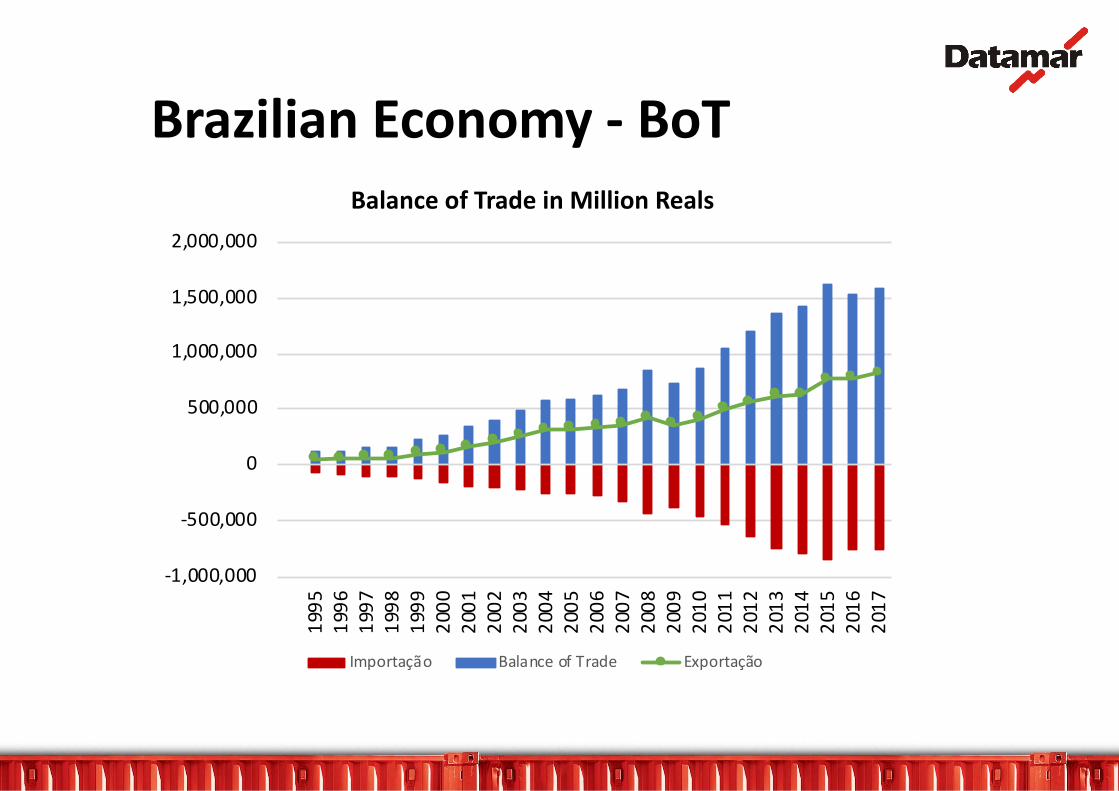
Brazilian Economy - BoT
-1,000,000
-500,000
0
500,000
1,000,000
1,500,000
2,000,000
199
51
996
199
71
998
199
92
000
200
12
002
200
32
004
200
52
006
200
72
008
200
92
010
201
12
012
201
32
014
201
52
016
201
7
Balance of Trade in Million Reals
Importação Balance of Trade Exportação
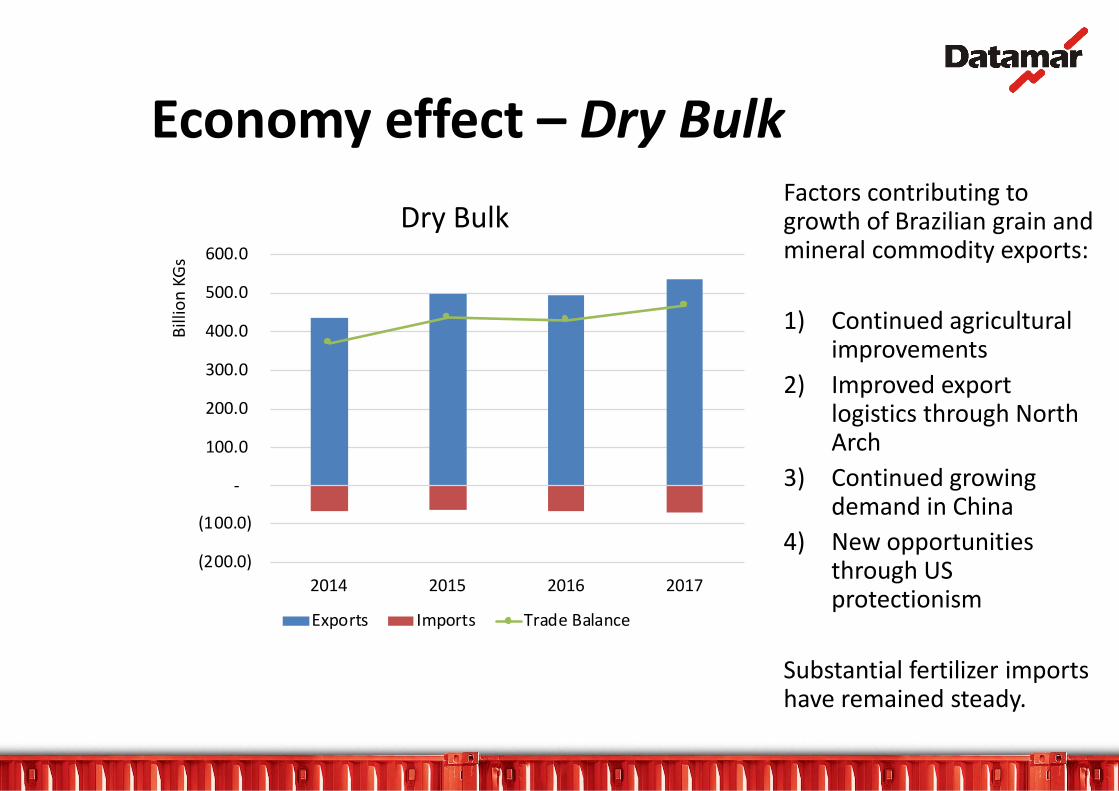
Economy effect – Dry BulkFactors contributing togrowth of Brazilian grain andmineral commodity exports:
1) Continued agriculturalimprovements
2) Improved exportlogistics through North Arch
3) Continued growingdemand in China
4) New opportunitiesthrough US protectionism
Substantial fertilizer importshave remained steady.
(200.0)
(100.0)
-
100.0
200.0
300.0
400.0
500.0
600.0
2014 2015 2016 2017
Bill
ion
KG
s
Dry Bulk
Exports Imports Trade Balance
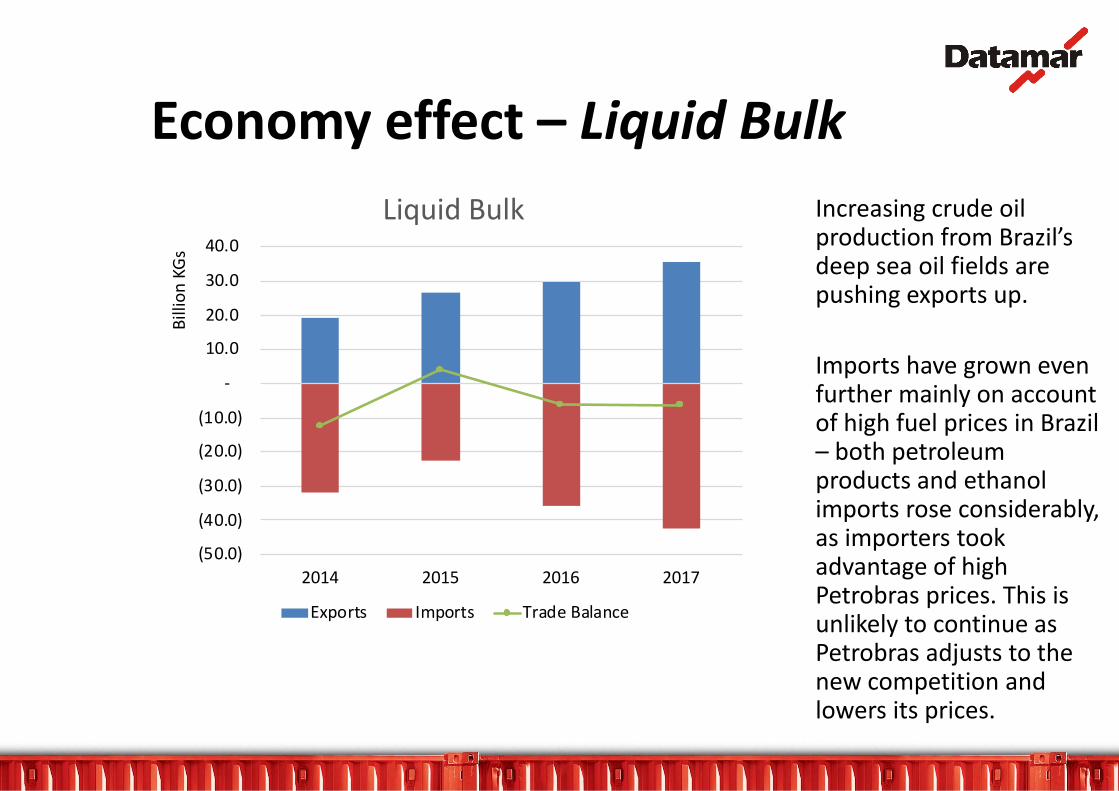
(50.0)
(40.0)
(30.0)
(20.0)
(10.0)
-
10.0
20.0
30.0
40.0
2014 2015 2016 2017
Bill
ion
KG
s
Liquid Bulk
Exports Imports Trade Balance
Increasing crude oilproduction from Brazil’sdeep sea oil fields are pushing exports up.
Imports have grown evenfurther mainly on accountof high fuel prices in Brazil– both petroleumproducts and ethanolimports rose considerably, as importers tookadvantage of high Petrobras prices. This isunlikely to continue as Petrobras adjusts to thenew competition andlowers its prices.
Economy effect – Liquid Bulk
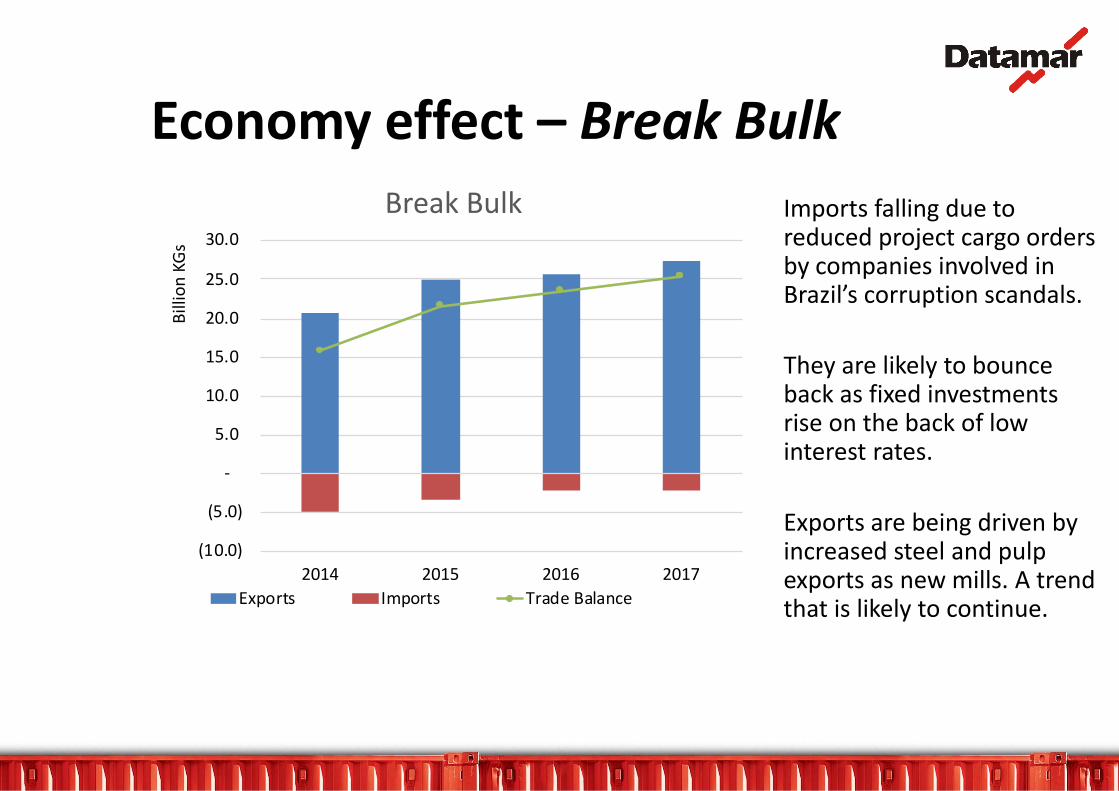
Imports falling due toreduced project cargo ordersby companies involved in Brazil’s corruption scandals.
They are likely to bounceback as fixed investmentsrise on the back of lowinterest rates.
Exports are being driven byincreased steel and pulpexports as new mills. A trendthat is likely to continue.
Economy effect – Break Bulk
(10.0)
(5.0)
-
5.0
10.0
15.0
20.0
25.0
30.0
2014 2015 2016 2017
Bill
ion
KG
s
Break Bulk
Exports Imports Trade Balance
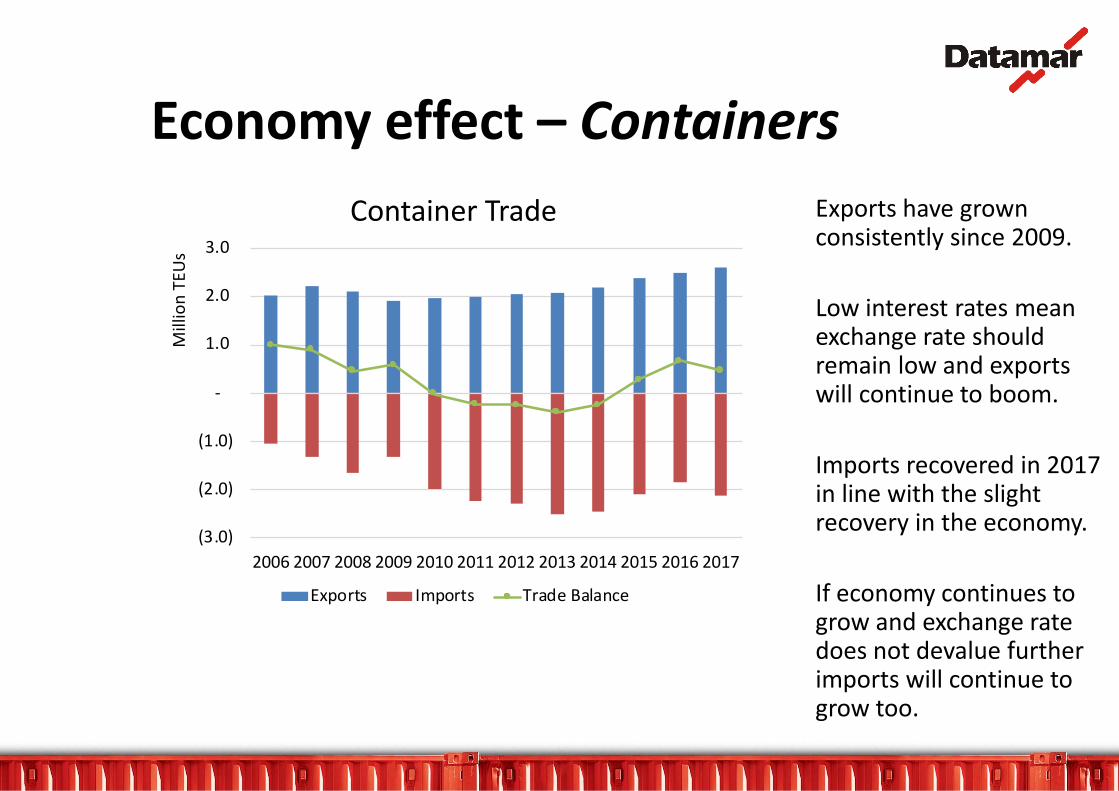
Exports have grownconsistently since 2009.
Low interest rates meanexchange rate shouldremain low and exportswill continue to boom.
Imports recovered in 2017 in line with the slightrecovery in the economy.
If economy continues togrow and exchange rate does not devalue furtherimports will continue togrow too.
Economy effect – Containers
(3.0)
(2.0)
(1.0)
-
1.0
2.0
3.0
2006 2007 2008 2009 2010 2011 2012 2013 2014 2015 2016 2017
Mill
ion
TEU
s
Container Trade
Exports Imports Trade Balance
Thank you!
Questions?