approaches to biodiversity conservation planning...approaches to biodiversity conservation planning...
TRANSCRIPT
Approaches to Approaches to Biodiversity Conservation Biodiversity Conservation
PlanningPlanning
Pat ComerPat Comer
Patrick CristPatrick Crist

Transportation Planning: Transportation Planning: paradigm shiftsparadigm shifts
“… the avoidance, minimization, and mitigation efforts used may not always provide the greatest environmental benefit, or may do very little to promote ecosystem sustainability.”
Eco-Logical: An Ecosystem Approach to Infrastructure Projects

Biodiversity Conservation Biodiversity Conservation Planning: Planning:
paradigm shiftsparadigm shifts
“… we protect the last of the least, and the best of the rest.”
Often heard adage among staff of The Nature Conservancy throughout the 1980s and early 1990s
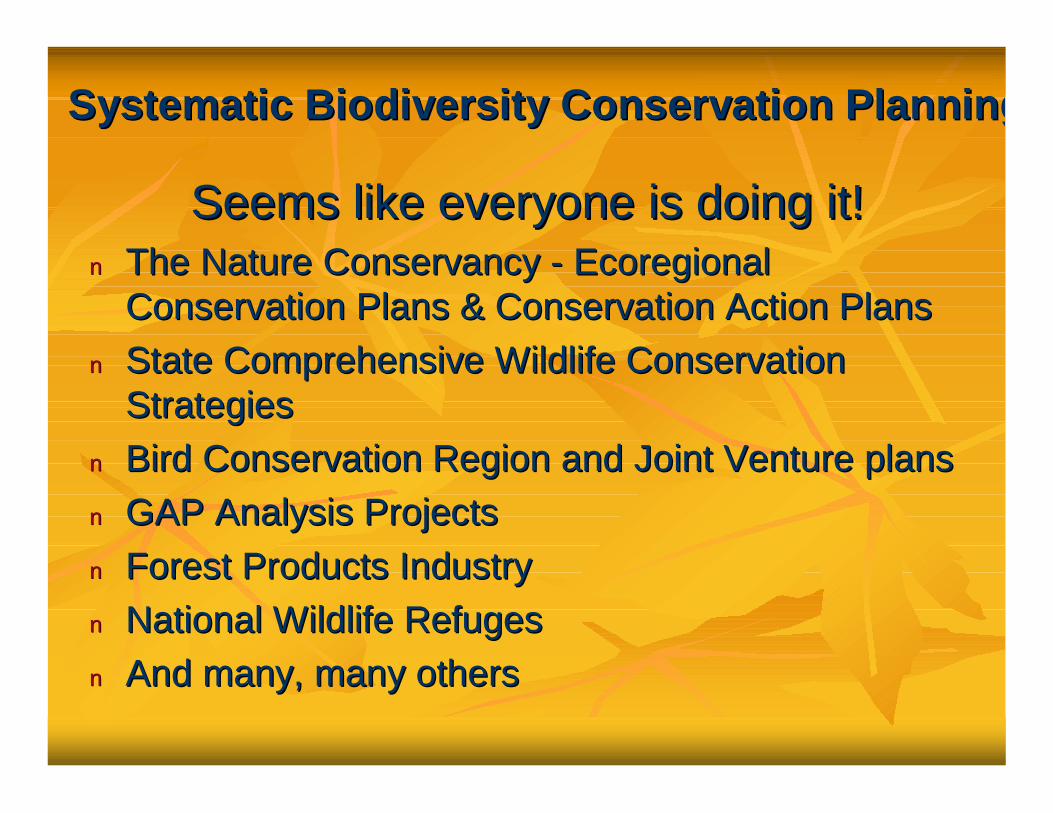
Systematic Biodiversity Conservation PlanningSystematic Biodiversity Conservation Planning
Seems like everyone is doing it!Seems like everyone is doing it!nn The Nature Conservancy The Nature Conservancy -- Ecoregional Ecoregional
Conservation Plans & Conservation Action PlansConservation Plans & Conservation Action Plansnn State Comprehensive Wildlife Conservation State Comprehensive Wildlife Conservation
StrategiesStrategiesnn Bird Conservation Region and Joint Venture plans Bird Conservation Region and Joint Venture plans nn GAP Analysis ProjectsGAP Analysis Projectsnn Forest Products IndustryForest Products Industrynn National Wildlife RefugesNational Wildlife Refugesnn And many, many othersAnd many, many others
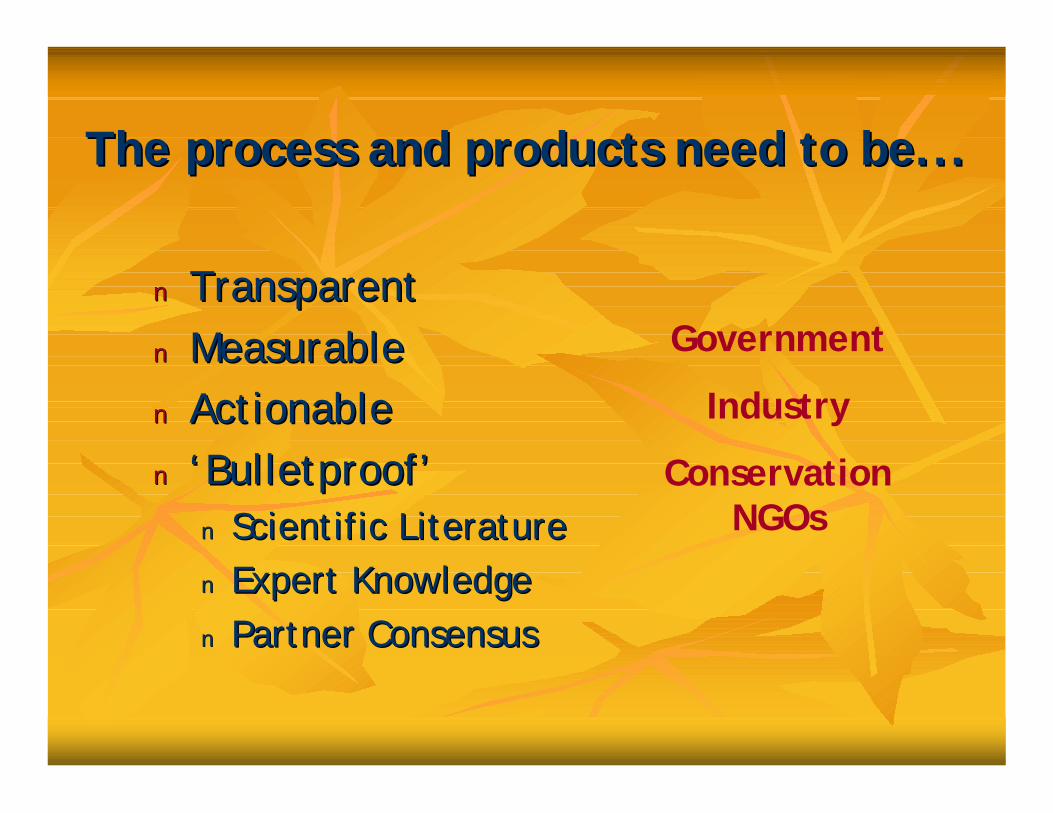
The process and products need to be...The process and products need to be...
nn TransparentTransparentnn MeasurableMeasurablenn ActionableActionablenn ‘Bulletproof’‘Bulletproof’
nn Scientific LiteratureScientific Literaturenn Expert KnowledgeExpert Knowledgenn Partner ConsensusPartner Consensus
Government
Industry
Conservation NGOs

Value of Using Value of Using a Common Planning Frameworka Common Planning Framework
nn Increase efficiencyIncrease efficiencynn Improve credibility and defensibilityImprove credibility and defensibilitynn Roll up or step down conservation needs Roll up or step down conservation needs
across scalesacross scalesnn Share monitoring protocols and many dataShare monitoring protocols and many data--
related investments across jurisdictionsrelated investments across jurisdictions

Develop Develop StrategiesStrategies
EvaluateEvaluate
Adaptive ConservationAdaptive Conservation
MonitorMonitor
ImplementImplement

Adapted from Hagan & Whitman (2006) Biodiversity Indicators for Sustainable Forestry. Journal of Forestry, June 2006
Vision for Sustainability
SocialEconomic Ecological
Clean Water Biodiversity Clean Air
Landscape Diversity
At-risk Species
Community Diversity
Desirable Species
Indicators Indicators Indicators Indicators
Adapted from Hagan & Whitman (2006) Biodiversity Indicators for Sustainable Forestry. Journal of Forestry, June 2006
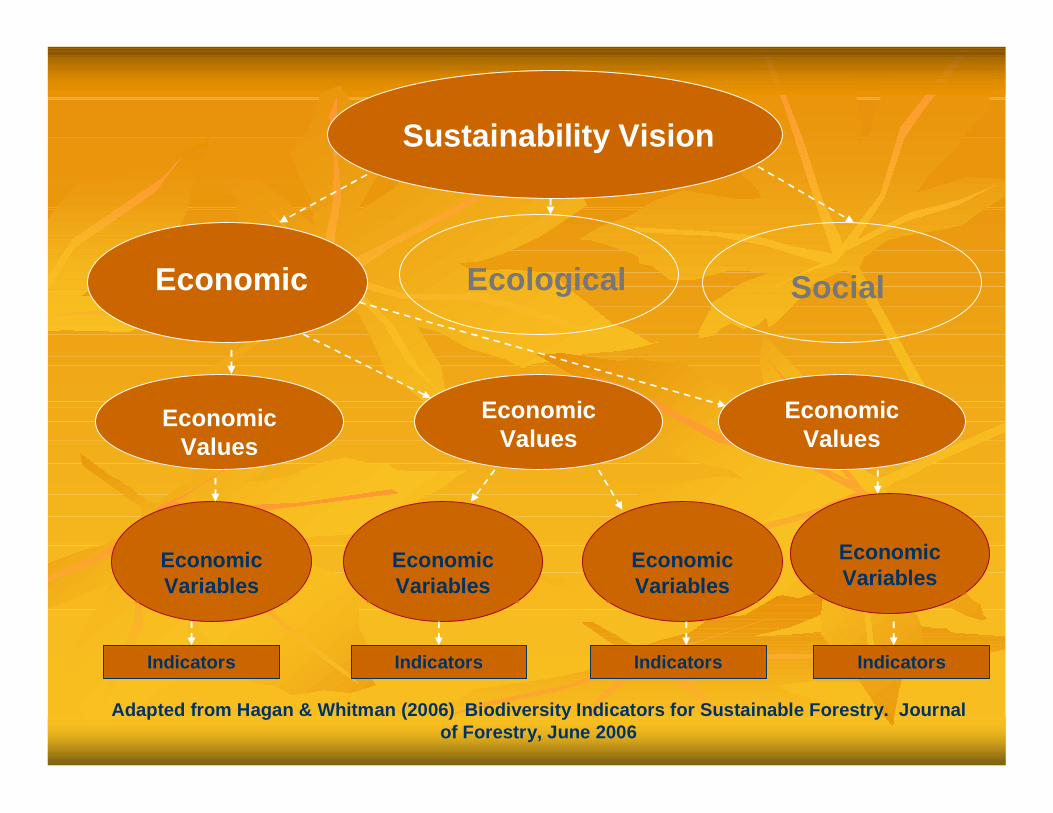
Economic Variables
Economic Variables
Economic Variables
Economic Variables
Indicators Indicators Indicators Indicators
Sustainability Vision
SocialEconomic Ecological
Economic Values
Economic Values
Economic Values

Adapted from Hagan & Whitman (2006) Biodiversity Indicators for Sustainable Forestry. Journal of Forestry, June 2006
Social Variables
Social Variables
Social Variables
Social Variables
Indicators Indicators Indicators Indicators
Sustainability Vision
SocialEconomic Ecological
Social Values Social Values Social Values

Adapted from Hagan & Whitman (2006) Biodiversity Indicators for Sustainable Forestry. Journal of Forestry, June 2006
Landscape Diversity
At-Risk Species
Community Diversity
Desirable Species
Sustainability Vision
SocialEconomic Ecological
Clean Water Biodiversity Clean Air
IndicatorsCondition
Trend
Policy Response
Condition
Trend
Policy Response
Condition
Trend
Policy Response
Condition
Trend
Policy Response

Analysis at Multiple Spatial ScalesAnalysis at Multiple Spatial Scales
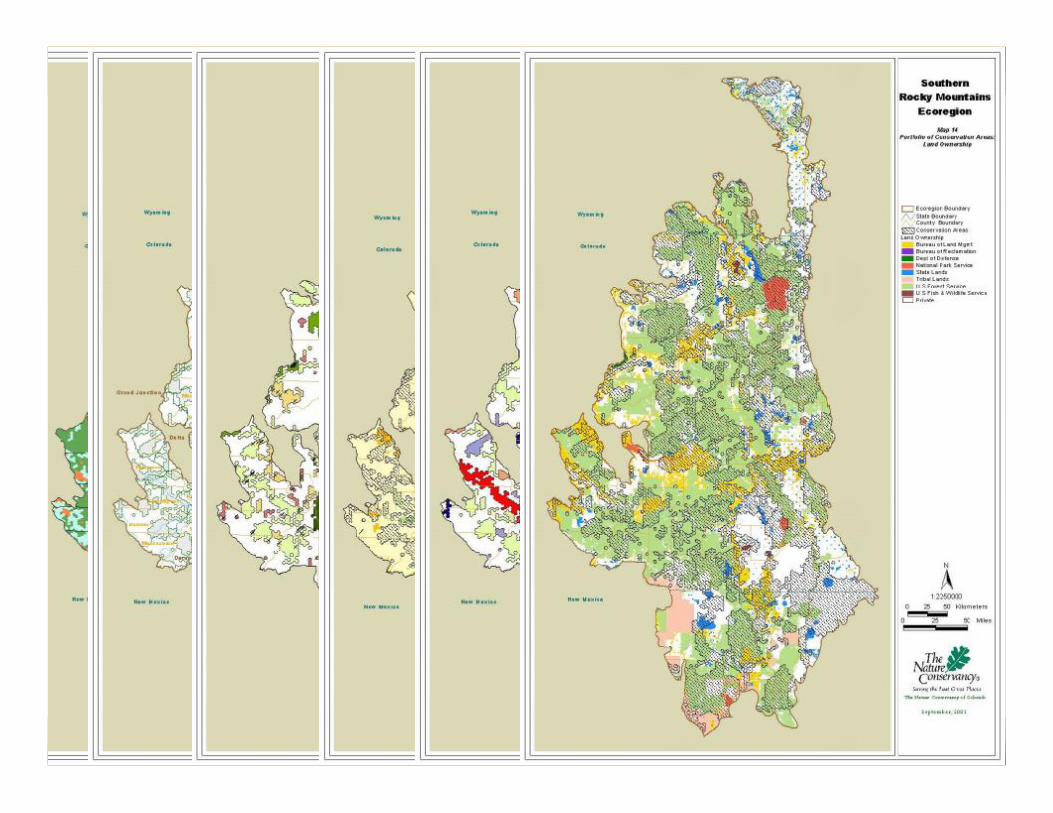
•Regional-scale (e.g., habitat representation throughout the Southern Rocky Mountains ecoregion)
•Local Landscape (e.g., multiple habitat patches within a proposed project area)
•Individual Habitat Patch (e.g., one wetland or species habitat patch of conservation concern)
•Public/Private Land Planning Unit (e.g., management emphasis on the Arapaho & Roosevelt National Forests)

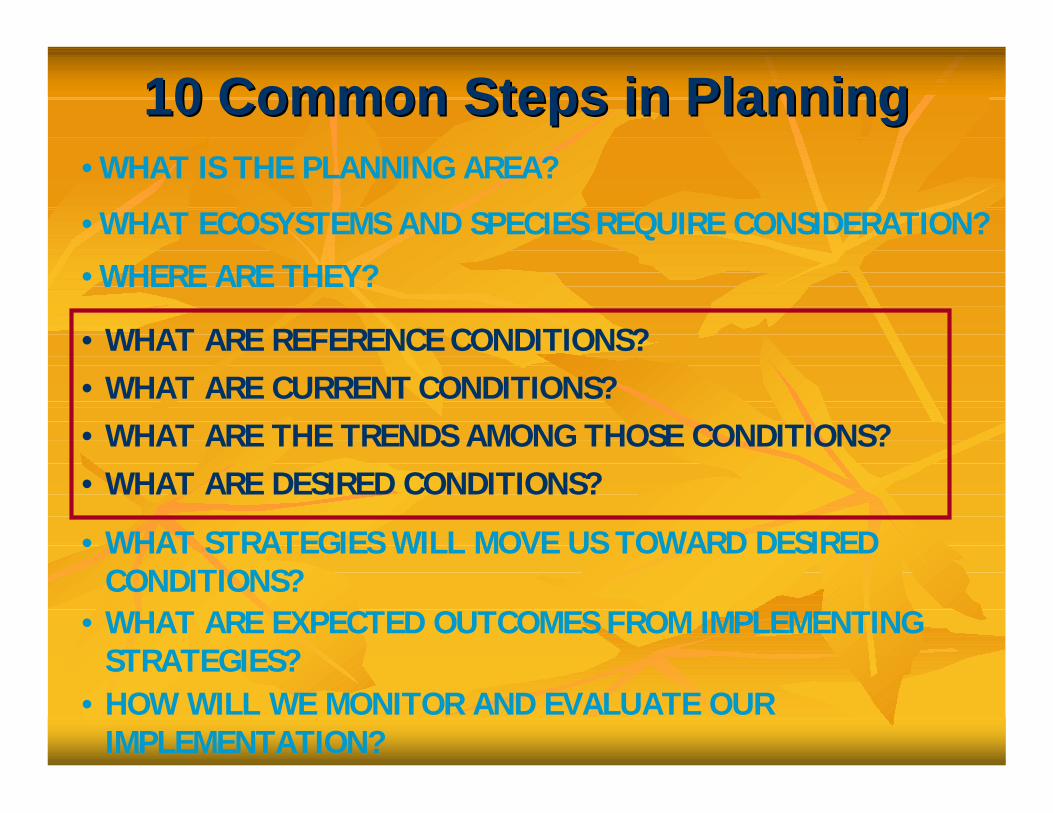
10 Common Steps in Planning10 Common Steps in Planning•WHAT IS THE PLANNING AREA?
•WHERE ARE THEY?
• WHAT ARE CURRENT CONDITIONS?
• WHAT ARE DESIRED CONDITIONS?
• WHAT ARE EXPECTED OUTCOMES FROM IMPLEMENTING STRATEGIES?
• WHAT STRATEGIES WILL MOVE US TOWARD DESIRED CONDITIONS?
•WHAT ECOSYSTEMS AND SPECIES REQUIRE CONSIDERATION?
• HOW WILL WE MONITOR AND EVALUATE OUR IMPLEMENTATION?
• WHAT ARE REFERENCE CONDITIONS?
• WHAT ARE THE TRENDS AMONG THOSE CONDITIONS?

Ecological Subregions of the Central Shortgrass Prairie Ecoregion

Conservation ElementsConservation ElementsProviding Focus for Ecological SustainabilityProviding Focus for Ecological Sustainability
•• Species DiversitySpecies DiversitySpecies of ConcernSpecies of Concern
•• ESA proposed, candidates, petitionedESA proposed, candidates, petitioned•• G1G1--G3 (T1G3 (T1--T3) NatureServe statusT3) NatureServe status•• May include distinct populationsMay include distinct populationsSpecies of InterestSpecies of Interest•• S1S1--S2 NatureServe statusS2 NatureServe status•• Other T/E not captured aboveOther T/E not captured above•• UAFWS birds of concernUAFWS birds of concern•• Regional/local concernRegional/local concern•• Other public interest requiring plan Other public interest requiring plan
componentscomponents
•• Ecosystem DiversityEcosystem DiversityRepresentative ecosystem typesRepresentative ecosystem typesVegetation types and structural stagesVegetation types and structural stages

Mapping BiodiversityMapping Biodiversity
10 Common Steps in Planning10 Common Steps in Planning•WHAT IS THE PLANNING AREA?
•WHERE ARE THEY?
• WHAT ARE CURRENT CONDITIONS?
• WHAT ARE DESIRED CONDITIONS?
• WHAT ARE EXPECTED OUTCOMES FROM IMPLEMENTING STRATEGIES?
• WHAT STRATEGIES WILL MOVE US TOWARD DESIRED CONDITIONS?
•WHAT ECOSYSTEMS AND SPECIES REQUIRE CONSIDERATION?
• HOW WILL WE MONITOR AND EVALUATE OUR IMPLEMENTATION?
• WHAT ARE REFERENCE CONDITIONS?
• WHAT ARE THE TRENDS AMONG THOSE CONDITIONS?
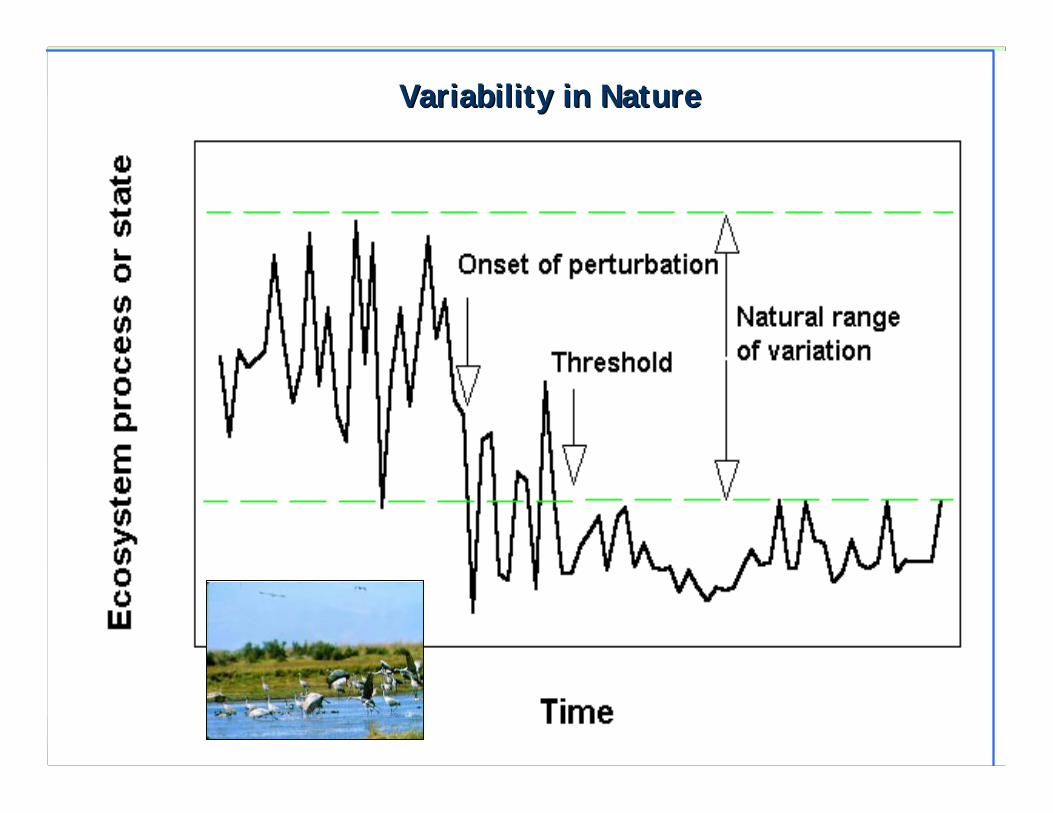
Variability in NatureVariability in Nature

Test Area
Value
High : 1.000000
Low : 0.001000
Modeling Modeling Landscape Landscape Condition for Condition for WildlifeWildlife
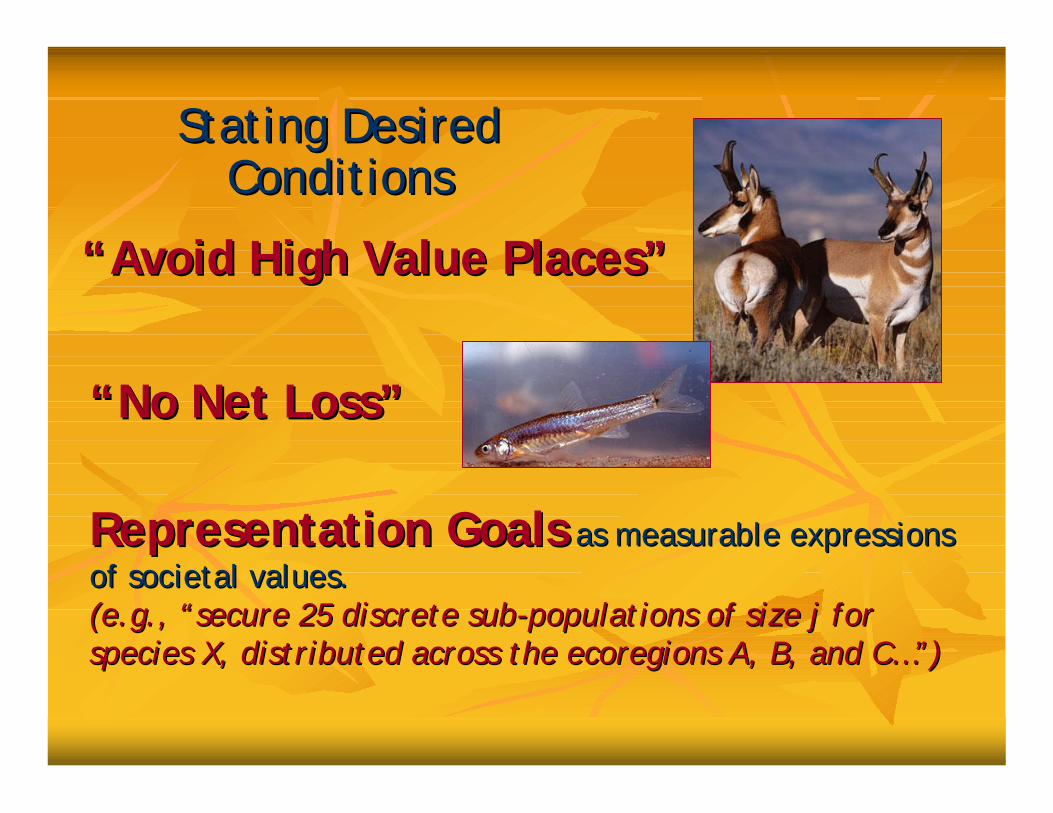
Stating Desired Stating Desired ConditionsConditions
Representation GoalsRepresentation Goals as measurable expressions as measurable expressions of societal values.of societal values.(e.g., (e.g., ““secure 25 discrete subsecure 25 discrete sub--populations of size j for populations of size j for species X, distributed across the ecoregions A, B, and Cspecies X, distributed across the ecoregions A, B, and C…”…”))
““Avoid High Value Places”Avoid High Value Places”
““No Net Loss”No Net Loss”

Local Landscape Integrity
Ecosystem types, Species of Concern
Key Ecological Attribute Key Ecological Attribute Key Ecological Attribute
Indicator
Indicator
Indicator
Indicator
Indicator
Indicator
Rating Criteria
Rating Criteria Rating Criteria
Rating Criteria
Rating Criteria
Rating Criteria
Conditions at Conditions at LocalLocal ScalesScales
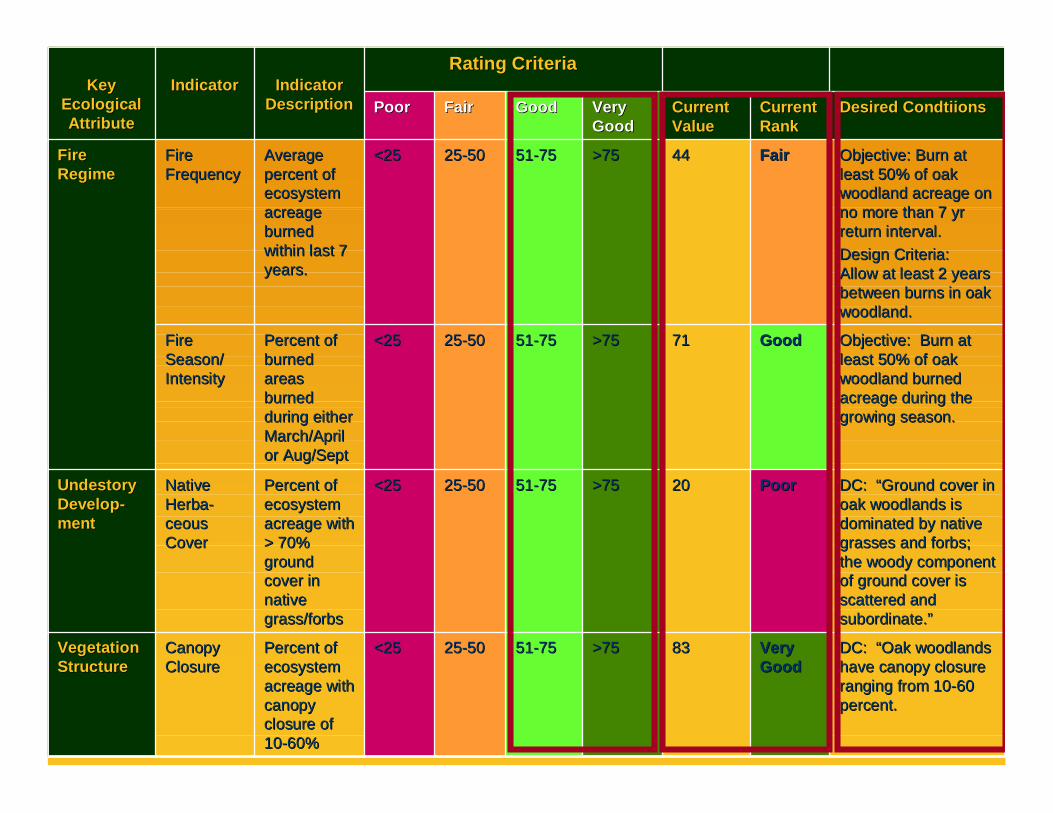
Rating CriteriaRating Criteria
DC: “Oak woodlands DC: “Oak woodlands have canopy closure have canopy closure ranging from 10ranging from 10--60 60 percent.percent.
Very Very GoodGood
8383>75>755151--75752525--5050<25<25Percent of Percent of ecosystem ecosystem acreage with acreage with canopy canopy closure of closure of 1010--60%60%
Canopy Canopy ClosureClosure
Vegetation Vegetation StructureStructure
DC: “Ground cover in DC: “Ground cover in oak woodlands is oak woodlands is dominated by native dominated by native grasses and forbs; grasses and forbs; the woody component the woody component of ground cover is of ground cover is scattered and scattered and subordinate.”subordinate.”
PoorPoor2020>75>755151--75752525--50 50 <25<25Percent of Percent of ecosystem ecosystem acreage with acreage with > 70% > 70% ground ground cover in cover in native native grass/forbsgrass/forbs
Native Native HerbaHerba--ceousceousCoverCover
UndestoryUndestoryDevelopDevelop--mentment
Objective: Burn at Objective: Burn at least 50% of oak least 50% of oak woodland burned woodland burned acreage during the acreage during the growing season.growing season.
GoodGood7171>75>755151--75752525--50 50 <25<25Percent of Percent of burned burned areas areas burned burned during either during either March/April March/April or Aug/Septor Aug/Sept
Fire Fire Season/ Season/ IntensityIntensity
Objective: Burn at Objective: Burn at least 50% of oak least 50% of oak woodland acreage on woodland acreage on no more than 7 yr no more than 7 yr return interval.return interval.Design Criteria: Design Criteria: Allow at least 2 years Allow at least 2 years between burns in oak between burns in oak woodland.woodland.
FairFair4444>75>755151--75752525--50 50 <25<25Average Average percent of percent of ecosystem ecosystem acreage acreage burned burned within last 7 within last 7 years.years.
Fire Fire FrequencyFrequency
Fire Fire RegimeRegime
Desired Desired CondtiionsCondtiionsCurrent Current RankRank
Current Current ValueValue
Very Very GoodGood
GoodGoodFairFairPoor Poor Indicator Indicator
DescriptionDescriptionIndicatorIndicatorKey Key
Ecological Ecological AttributeAttribute

10 Common Steps in Planning10 Common Steps in Planning•WHAT IS THE PLANNING AREA?
•WHERE ARE THEY?
• WHAT ARE CURRENT CONDITIONS?
• WHAT ARE DESIRED CONDITIONS?
• WHAT ARE EXPECTED OUTCOMES FROM IMPLEMENTING STRATEGIES?
• WHAT STRATEGIES WILL MOVE US TOWARD DESIRED CONDITIONS?
•WHAT ECOSYSTEMS AND SPECIES REQUIRE CONSIDERATION?
• HOW WILL WE MONITOR AND EVALUATE OUR IMPLEMENTATION?
• WHAT ARE REFERENCE CONDITIONS?
• WHAT ARE THE TRENDS AMONG THOSE CONDITIONS?
Developing Developing Regional Regional
Conservation Conservation StrategiesStrategies


What Are We Aiming For?What Are We Aiming For?
••Common Planning FrameworkCommon Planning Framework
••Common LibraryCommon Library
••Standard ToolsStandard Tools