appraisal of ground-water quality in the bunker hill basin of san
TRANSCRIPT

Appraisal of Ground-Water Quality in the Bunker Hill Basin of San Bernardino Valley, California
By Lowell F.W. Duell, Jr., and Roy A. Schroeder
U.S. GEOLOGICAL SURVEY Water-Resources Investigations Report 88 4203
Prepared in cooperation with the
SAN BERNARDINO VALLEY MUNICIPAL WATER DISTRICT
CO vO
Io<NO LD
Sacramento, California 1989
DEPARTMENT OF THE INTERIOR
MANUEL LUJAN, JR., Secretary
U.S. GEOLOGICAL SURVEY
Dallas L. Peck, Director
For additional information write to:
District Chief U.S. Geological Survey Federal Building, Room W2234 2800 Cottage Way Sacramento, CA 95825
Copies of this report can be purchased from:
U.S. Geological SurveyBooks and Open-File Reports SectionFederal Center, Building 810Box 25425Denver, CO 80225

CONTENTS
PageAbstract.................................................................. 1Introduction.............................................................. 2
Purpose and scope.................................................... 2Previous investigations.............................................. 6Acknowledgments....................................................... 7Well-numbering system................................................ 7
Description of study area................................................. 8Physiographic setting................................................ 8Geohydrology......................................................... 8Land use............................................................. 16
Methods of data collection................................................ 20Site selection....................................................... 20Field and laboratory methods ........................................ 22Quality assurance.................................................... 26
Appraisal of ground-water quality......................................... 27Inorganic chemistry.................................................. 30
Inorganic-constituent concentrations ............................ 30Relation to land use and aquifer................................ 32Historical trends............................................... 33
Nitrate.............................................................. 38Nitrate concentration........................................... 38Relation to land use and aquifer................................ 38Historical trends............................................... 43
Volatile organic compounds ........................................... 43Quality-assurance results ....................................... 46Volatile-organic-compound concentrations ........................ 48Relation to land use and aquifer................................ 54
Need for observation-well network......................................... 54Summary and conclusions ................................................... 55References cited.......................................................... 56Supplemental data: Physical and chemical data for wells.................. 58
III

ILLUSTRATIONS
Page Figures 1-3. Maps showing:
1. Location of study area. ............................... 32. Ground-water basins in San Bernardino Valley.......... 43. Generalized geology................................... 10
4. Geologic sections A-A' and B-B'............................. 125-10. Maps showing:
5. Altitude of potentiometric surface and direction ofground-water movement, summer 1986.................. 14
6. Land use, 1984........................................ 187. Location of wells sampled............................. 248. Distribution of dissolved solids in ground water,
1984-86............................................. 349. Chemical quality of water from selected wells......... 36
10. Nitrate concentration in water from selected wells,1984-86............................................. 40
11. Graph showing distribution of nitrate concentration comparedto depth of well-perforation interval..................... 42
12-14. Maps showing:12. Comparison of present (1986) and historical nitrate
concentration in water from selected wells.......... 4413. Tetrachloroethylene concentration in water from
selected wells, 1984-86 ............................. 5014. Trichloroethylene concentration in water from selected
wells, 1984-86 ...................................... 52
TABLES
Page Table 1. Wells used for water-quality sampling........................... 21
2. Water-quality constituents analyzed for this study.............. 233. Maximum contaminant levels for domestic drinking water.......... 284. Selected data for statistical analysis, 1988.................... 295. Concentration of selected inorganic constituents in samples from
wells in the upper and lower aquifers, 1988................... 336. Summary statistics of recovery rate on surrogate spikes for 52
samples analyzed for volatile organic compounds............... 467. Volatile-organic-compound concentrations in duplicate samples,
1988.......................................................... 478. Frequency of detection, highest concentration, and well having
the highest concentration of volatile organic compounds....... 499. Wells and locations for potential ground-water quality
observation-well network...................................... 55
IV

CONVERSION FACTORS
For readers who prefer to use metric (International System) units rather than inch-pound units, the conversion factors for the terms used in this report are listed below:
BX 0.40470.0012330.001233
0.30480.1894 25.4
25,4001.609
29.572.835 x 10 72.590
To obtain metric unithectarecubic hectometercubic hectometer per
annum metermeter per kilometer millimeter micrometer (/im) kilometer milliliter (mL) microgram square kilometer
Multiply inch-pound unitacreacre-foot (acre-ft)acre-foot per year
(acre-ft/yr) foot (ft)foot per mile (ft/mi) inch (in.)
mile (mi)ounce, fluid (fl. oz) ounce, avoirdupois (oz) square mile (mi 2 )
Abbreviations used: DBCP - dibromochloropropane PCE - tetrachloroethylene TCE - trichloroethylene
Temperature is given in degrees Celsius (°C), which can be converted to degrees Fahrenheit (°F) by using the following equation:
Temp. °F = 1.8 (temp. °C) + 32.
Chemical concentration is given in milligrams per liter (mg/L) or micrograms per liter (/ig/L). Milligrams per liter is a unit expressing the solute per unit volume (liter) of water. One thousand micrograms per liter is equivalent to one milligram per liter. For concentrations less than 7,000 mg/L, the numerical value in milligrams per liter is about the same as for concentrations in parts per million (ppm), and the numerical value in micrograms per liter is about the same as for concentrations in parts per billion (ppb).
Specific conductance is given in microsiemens per centimeter (/is/cm) at 25 °C. Microsiemens per centimeter is numerically equal to micromhos per cen timeter.
Sea level: In this report "sea level" refers to the National Geodetic Vertical Datum of 1929 (NGVD of 1929)--a geodetic datum derived from a general adjustment of the first-order level nets of both the United States and Canada, formerly called Sea Level Datum of 1929.
V

APPRAISAL OF GROUND-WATER QUALITY IN THE BUNKER HILL BASIN
OF SAN BERNARDINO VALLEY, CALIFORNIA
By Lowell F.W. Duell, Jr., and Roy A. Schroeder
ABSTRACT
Increasing population and an associated shift from agricultural to urban land use in the Bunker Hill basin of San Bernardino Valley, California, have caused increasing concern about the ground-water quality in the basin. Forty-seven wells were sampled during 1986 and analyzed for the concentration of major inorganic ions, nitrogen species, and volatile (purgeable) organic priority pollutants to address this concern. Data from this study were supplemented with additional analyses of nitrate, tetrachloroethylene, and trichloroethylene concentrations determined by other agencies.
The inorganic quality of ground water in the basin generally was suitable for most uses during 1986, although fluoride concentration exceeded the California public drinking-water standard of 1.4 milligrams per liter in water from 5 of the 47 wells that were sampled.
Nitrate (as nitrogen) concentration equaled or exceeded the public drinking-water standard of 10 milligrams per liter in water from 13 of 47 wells sampled for this study and in an additional 19 of 120 samples analyzed by other agencies. Concentration generally decreased with increasing depth below land surface. No relation between nitrate concentration and land use was found, and no basinwide trend in concentration since 1955 was evident.
Twenty-four of the 33 volatile organic priority pollutants were detected in water from wells sampled during this study. When supplemental data from other agencies are included, tetrachloroethylene concentration was found to exceed California's interim advisory standard (action level) of 4 micrograms per liter in water from 36 of 134 wells, and trichloroethylene concentration exceeded the standard of 5 micrograms per liter in water from 49 of 138 wells. No basinwide relation between contamination by these two chemicals and well depths or land use was discerned; however, the two chemicals were commonly detected in ground water in central Redlands and northwest San Bernardino.
A network of 11 observation wells that could be sampled twice yearly and 47 wells that could be sampled once every 5 years would enhance the monitoring of changes in ground-water quality in the Bunker Hill basin.
INTRODUCTION
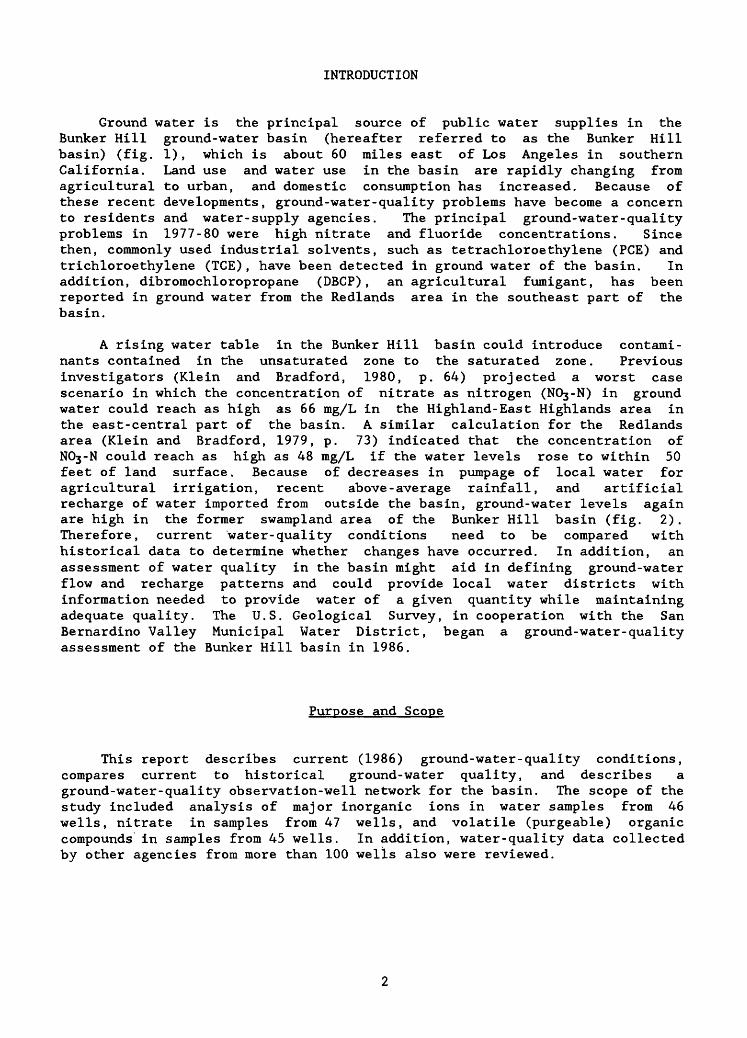
Ground water is the principal source of public water supplies in the Bunker Hill ground-water basin (hereafter referred to as the Bunker Hill basin) (fig. 1), which is about 60 miles east of Los Angeles in southern California. Land use and water use in the basin are rapidly changing from agricultural to urban, and domestic consumption has increased. Because of these recent developments, ground-water-quality problems have become a concern to residents and water-supply agencies. The principal ground-water-quality problems in 1977-80 were high nitrate and fluoride concentrations. Since then, commonly used industrial solvents, such as tetrachloroethylene (PCE) and trichloroethylene (TCE), have been detected in ground water of the basin. In addition, dibromochloropropane (DBCP), an agricultural fumigant, has been reported in ground water from the Redlands area in the southeast part of the basin.
A rising water table in the Bunker Hill basin could introduce contami nants contained in the unsaturated zone to the saturated zone. Previous investigators (Klein and Bradford, 1980, p. 64) projected a worst case scenario in which the concentration of nitrate as nitrogen (N03-N) in ground water could reach as high as 66 mg/L in the Highland-East Highlands area in the east-central part of the basin. A similar calculation for the Redlands area (Klein and Bradford, 1979, p. 73) indicated that the concentration of N03 -N could reach as high as 48 mg/L if the water levels rose to within 50 feet of land surface. Because of decreases in pumpage of local water for agricultural irrigation, recent above-average rainfall, and artificial recharge of water imported from outside the basin, ground-water levels again are high in the former swampland area of the Bunker Hill basin (fig. 2). Therefore, current water-quality conditions need to be compared with historical data to determine whether changes have occurred. In addition, an assessment of water quality in the basin might aid in defining ground-water flow and recharge patterns and could provide local water districts with information needed to provide water of a given quantity while maintaining adequate quality. The U.S. Geological Survey, in cooperation with the San Bernardino Valley Municipal Water District, began a ground-water-quality assessment of the Bunker Hill basin in 1986.
Purpose and Scope
This report describes current (1986) ground-water-quality conditions, compares current to historical ground-water quality, and describes a ground-water-quality observation-well network for the basin. The scope of the study included analysis of major inorganic ions in water samples from 46 wells, nitrate in samples from 47 wells, and volatile (purgeable) organic compounds in samples from 45 wells. In addition, water-quality data collected by other agencies from more than 100 wells also were reviewed.

R9
WR
7W
1ir3
°'R
6W
R5
WR
4W
R3
WR
2W
117°
R 1
W
R 1
ER
2E
20
KIL
OM
ETER
S
EX
PL
AN
AT
ION
UR
BA
N A
REA
S
BO
UN
DA
RY
OF
STU
DY
A
REA
(B
unke
r H
ill b
asin
)
UPP
ER S
AN
TA A
NA
RIV
ER
BA
SIN
-- A
ppro
xim
ate
100
KIL
OM
ET
ER
S11
7°
FIG
UR
E 1.
-Lo
catio
n of
stu
dy a
rea.

34° 12'
Base from U.S. Geological Survey 1:1,000,000,1982
34° 06
FIGURE 2.--Ground-water basins in San Bernardino Valley.

6 KILOMETERS
6 MILES
EXPLANATION
UNCONSOLIDATED DEPOSITS
PARTLY CONSOLIDATED DEPOSITS
CONSOLIDATED ROCKS
CONTACT
FAULT
BOUNDARY OF UPPER CONFINING LAYER
BOUNDARY OF STUDY AREA
GROUND-WATER BARRIER
FORMER SWAMPLAND
^ JL ^ » ^_ " x >g, .. j^i^u^.^s- ,-t^^F-iGeology modified from Dibblee (1963, 1968) and Dutcher and Garrett (1963)

This report includes (1) water-quality data that indicate where constitu ents exceeded public-health standards; (2) illustrations that show areal distribution of ground-water quality, with emphasis on dissolved solids, nitrate, PCE, and TCE; (3) identification of factors that might affect ground- water quality, such as land use, recharge, and geology; (4) comparison of current and historical ground-water quality; and (5) description of an obser vation-well network that could be used to identify future ground-water-quality changes in the basin.
Previous Investigations
Extensive descriptions of the geology, hydrology, and ground-water chemistry are given for the Redlands area, in the southeast part of the Bunker Hill basin, by Burnham and Dutcher (1960) and for the San Bernardino area, in the west-central part of the basin (fig. 2), by Dutcher and Garrett (1963). Furthermore, they identified sources of recharge and discharge, and delineated subbasin boundaries on the basis of the presence of flow barriers (faults). Geologic sections and recharge and discharge values for the basin are given by Hardt and Hutchinson (1980).
Nitrate contamination in the Bunker Hill basin has been reported in several previous studies. Eccles (1979) identified high nitrate concentra tions in some wells of the Bunker Hill basin during a general assessment of ground-water quality in the upper Santa Ana River basin, of which Bunker Hill basin is a part (fig. 1). The distribution of nitrate in ground water in the Redlands area was determined by Eccles and Bradford (1977, p. 25) to be dependent primarily on depth below the water table. Eccles and Klein (1978) reported the results of a similar study in the Highland-East Highlands area, in the east-central part of Bunker Hill basin. Studies to quantify and delineate the distribution of nitrate and other forms of nitrogen in the unsaturated zone were done by Klein and Bradford (1979) for the Redlands area and Klein and Bradford (1980) for the Highland-East Highlands area.
Historical data on contamination by volatile organic compounds in the Bunker Hill basin are sparse. The California Department of Health Services first detected PCE and TCE contamination during a 1980 basinwide water-quality survey (California Department of Health Service, written commun., 1986). Since then, sampling for PCE and TCE has been required for public water-supply wells in the basin, and these data were made available for this study (Cali fornia Department of Health Services and California Regional Water Quality Control Board (Santa Ana Region), written commun., 1986). The URS Corporation (1986) compiled a list of possible sources of PCE and TCE in the northwest part of the basin and identified areas of contamination on the basis of analysis of soil-pore gas.
A generalized map shows land use in 1976 in the Highland-East Highlands area (Eccles and Klein, 1978), and a similar map shows land use in 1975 in the Redlands area (Klein and Bradford, 1979). A 1984 survey by the California Department of Water Resources of the upper Santa Ana River drainage area provides detailed land-use information for the Bunker Hill basin on 1:24,000-scale U.S. Geological Survey topographic maps (California Department of Water Resources, 1985).

Acknowledgments
For help in collecting the water samples and well data used in this study, appreciation is expressed to employees of the cities of San Bernardino, Redlands, Loma Linda, and Riverside; to employees of San Bernardino Valley Municipal Water District, California Regional Water Quality Control Board (Santa Ana Region), California Department of Health Services, Gage Canal Company, Fatten State Hospital, Southern California Water Company, East Valley Water District, and Southern California Edison; and to numerous private citizens. ,
Well-Numbering System
Wells are numbered according to their location in the rectangular system for subdivision of public land. For example, in well number 1S/3W-21H7, that part of the number preceding the slash indicates the township (T. 1 S.); the number and letter following the slash indicate the range (R. 3 W.); the number following the hyphen indicates the section (sec. 21); and the letter (H) indicates the 40-acre subdivision of the section according to the lettered diagram below. The final digit (7) is a serial number for wells in each 40-acre subdivision. The area covered by this report lies in the northwest and southwest quadrants of the San Bernardino base line and meridian. Township and range are given along the margin of maps, and thus wells on maps are identified by the section number and the letter of the 40-acre subdivision in that section. The computer-tabulated well numbers in table 1 and in the supplemental data section are 14-character State well numbers in which unused spaces and the slash are replaced with zeros, and the hyphen is excluded. For example, well 1S/3W-21H7 is identified in table 1 and in the supplemental data section at the end of this report as 001S003W21H07S. The final letter (S) indicates the San Bernardino base line and meridian.
co cr
T4N
T3N
T2N
T1 N
T1S
T2S
Basj Line
6
7
18
19
30
31
5
8
17
20
29
32
4
9
16
21
28
33
3
10
If
n27
34
2
&H;
13
2635
1
4t:if*24
j&36
7
1S/3W-21H7

DESCRIPTION OF STUDY AREA
Physiographic Setting
The area of this study, the Bunker Hill basin, is entirely within the San Bernardino Valley. The basin occupies approximately 120 mi 2 between the San Andreas and San Jacinto faults. It is bounded on the northwest by the San Gabriel Mountains, on the northeast by the San Bernardino Mountains, on the south by the Badlands and the Crafton Hills, and on the southwest by a low east-facing escarpment of the San Jacinto fault (fig. 2). The land surface slopes generally downward to the southwest; gradients range from 75 to 150 ft/mi on the edges of the basin and from 30 to 50 ft/mi in the central part.
Climate in the Bunker Hill basin is semiarid and is characterized by relatively dry, warm summers and cool, wet winters. Data collected at U.S. National Oceanic and Atmospheric Administration stations show that temperatures commonly exceed 40 °C during summer and occasionally are below freezing in the winter. In addition, mean annual precipitation ranges from 12 inches in the Badlands to 25 inches at the base of the San Bernardino and San Gabriel Mountains.
Geohvdrology
Dutcher and Garrett (1963) identified the principal ground-water basins in the San Bernardino Valley as Bunker Hill, Rialto-Colton, upper and lower Lytle, and Chino (fig. 2). Faults across the valley form barriers that restrict, to varying degrees, the movement of ground water through unconsoli- dated deposits that fill the basins. Faults are inferred from topographic and water-level data; other barriers are inferred from water-level differences in wells. Water-level differences across these faults and barriers are 50 feet or more. Some faults are only partial barriers to ground-water movement; examples are (some sections of) the Loma Linda fault in the southern part of the basin and fault K in the northern part. Ground water flows from the upper and lower Lytle basins into the Bunker Hill basin; therefore, this study includes some data from these basins (fig. 2). Ground-water flow from the Bunker Hill basin discharges mostly to the southwest across the San Jacinto fault and into the Rialto-Colton basin.

The generalized geology of the Bunker Hill basin is shown in figure 3. According to Dutcher and Garrett (1963), the unconsolidated material that fills the basin includes river-channel deposits and younger alluvium, both of Holocene age, and older alluvium (including terrace deposits and fanglom- erates) of Pleistocene age. Partly consolidated material in the basin includes continental deposits of Quaternary and Tertiary age. A basement complex of Precambrian igneous and metamorphic rocks underlies the unconsoli dated and partly consolidated deposits and crops out in the surrounding mountain ranges.
The water-bearing material in the basin consists of alluvial deposits of sand, gravel, and boulders interspersed with lenticular deposits of silt and clay. The maximum depth to bedrock is greater than 1,400 feet below land surface along the northeast side of the San Jacinto fault south of San Bernardino (fig. 3); the basin deposits become progressively thinner toward the surrounding mountains. Adjacent to the San Jacinto fault, the unconsolidated deposits contain numerous clay layers that act as leaky confining beds.
Although individual sand and clay layers in the basin generally can be correlated for only short distances, Dutcher and Garrett (1963), using litho- logic information in drillers' logs, distinguished three aquifers (upper, middle, and lower), each separated by 50 to 300 feet of clay and silt. Hardt and Hutchinson (1980) divided the same water-bearing material into two aquifers (upper and lower) on the basis of lithologic information, electric logs, and water levels in a test hole that was drilled to bedrock in the middle of the basin. The middle and lower aquifers of Dutcher and Garrett (1963) were combined and referred to as the lower aquifer by Hardt and Hutchinson. For the purpose of this study, the Hardt and Hutchinson (1980) concept of a two-layer aquifer system was used. In the central part of the basin, upgradient from the San Jacinto fault, a poorly permeable clay layer, which is called the upper confining layer (fig. 3), creates confined conditions in the lower aquifer over an area of about 25 mi 2 . The area of confined water in the lower aquifer is not static but varies depending on the variations in inflow-outflow relations.
Thickness of the upper and lower aquifers and depth of the confining layer that separates them are illustrated on the generalized geologic sections in figure 4. Maximum thickness of the upper aquifer is approximately 350 feet, and maximum thickness of the lower aquifer is approximately 650 feet. Section A-A' (fig. 4) indicates that the confining layer separating the upper and lower aquifers disappears near the northeast margin of the basin at the mountains.
Figure 4 also indicates the presence of a near-surface deposit of low hydraulic conductivity that creates a shallow water-bearing zone in about 10 mi 2 of the former swampland near the confluence of Warm Creek and the Santa Ana River (fig. 2). The upper aquifer is confined within this area.

R. 5W. 117° 20' R. 4W.
34° 12
J 4J_|_4_4__,T*l T j |R?alto
~. Municipal Airport
I J 1 , i I ! '^^ ^-UTf l -4= ii it»j> HE! I ; >
EXPLANATION (Continued)
FORMER SWAMPLAND
CONTACT
FAULT
LINE OF SECTION
----- BOUNDARY OF UPPER CONHNING LAYER
BOUNDARY OF STUDY AREA
GROUND-WATER BARRIER
RGURE 3.--Gcncralized geology.
10

6 MILES
6 KILOMETERS
R3W
EXPLANATION
UNCONSOLIDATED DEPOSITS- RIVER-CHANNEL DEPOSITS OF HOLOCENE AGE--
Unconsolidated boulders, coarse gravel, sand and silt in major river channels; highly permeable, largely unsaturated, but transmit large seepage losses from river and streams to main aquifer
YOUNGER ALLUVIUM OF HOLOCENE AGE-Uncon- solidated boulders, coarse gravel, sand, silt, and clay; highly permeable, and yields water copiously to wells
OLDER ALLUVIUM OF PLEISTOCENE AGE-Uncon- solidated boulders, coarse gravel, sand, silt, and clay; locally contains clay beds; fractured and folded in places; yields water copiously to wells that penetrate permeable deposits
PARTLY CONSOLIDATED DEPOSITS CONTINENTAL DEPOSITS OF QUATERNARY AND
TERTIARY AGE-- Unconsolidated to compacted gravel, sand, silt, and clay; yield water in moderate quantities to wells that penetrate permeable deposits
CONSOLIDATED ROCKS BASEMENT COMPLEX OF PRECAMBRIAN AGE -
Consolidated metamorphic and igneous rocks; virtually non-water bearing
Geology modified from Dibblee (1963, 1968) and Dutcher and Garrett (1963)
11

EXPLANATION
NEAR-SURFACE DEPOSITS OF LOW HYDRAULIC CONDUCTIVITY
UPPER CONFINING LAYER- Dashes and queries indicate discontinuous confinement
BASEMENT COMPLEX OF PRECAMBRIAN AGE
5 MILES
0 5 KILOMETERS
Vertical exaggeration X 12
FIGURE 4.-- Geologic sections A-A' and B-B' (modified from Hardt and Hutchinson, 1980). See figure 3 for location of sections.
12

Recharge to the Bunker Hill basin historically has resulted from infil tration of streamflow runoff from the San Gabriel and San Bernardino Moun tains. During the period 1945-74, total measured stream inflow to the basin averaged about 143,000 acre-ft/yr, and measured stream outflow averaged about 35,000 acre-ft/yr (Hardt and Hutchinson, 1980, p. 24). Thus, the net stream inflow to the study area during this period was at least 108,000 acre-ft/yr. Three main tributary streams contribute more than 60 percent of the total recharge to the ground-water system. They are the Santa Ana River and Mill Creek in the southeast part of the basin, and Lytle Creek in the northwest part (fig. 2). Lesser contributors include Cajon Creek, Devil Canyon Creek, Waterman Canyon Creek, East Twin Creek, City Creek, Plunge Creek, and San Timoteo Creek. Artificial recharge during 1975-81 ranged from about 11,000 to 100,000 acre-ft/yr (Hardt and Freckleton, 1987, p. 19). Recharge from precip itation falling directly on the basin floor is assumed to be negligible because of the semiarid climatic conditions.
Ground-water levels in the Bunker Hill basin during the last 80 years initially declined and subsequently rose (Hardt and Freckleton, 1987, p. 11). In the early 1900's,-marshlands, springs, and flowing streams were evident in the swampland area (fig. 2). From the early 1940's to the late 1960's, ground-water levels declined more than 100 feet near San Bernardino in response to pumping for agricultural use and to below-normal precipitation. As a result, the former swampland dried completely and the land became urban as commercial and industrial development proceeded. Since the late 1960's, the basin has received greater than average quantities of recharge from increased streamflow caused by above-normal precipitation and by artificial recharge of local and imported water.
Depth to water was measured in selected wells of the Bunker Hill basin during April-June 1986. This information was used to estimate the altitude of the potentiometric surface for both the upper and lower aquifers, shown in composite form in figure 5. The potentiometric surface is the level to which ground water will rise in a tightly cased well. The direction of ground-water flow within the basin generally is similar to that of the surface drainage, which is toward the former swampland area. Surface water enters the uncon- fined aquifer through permeable deposits near the mountain fronts and along stream channels. Ground water generally moves toward the southwest--except in the Lytle and Cajon Creek areas, where it moves toward the southeast--and converges and discharges at the San Jacinto fault beneath the Santa Ana River. Present depth to water ranges from about 200 feet below land surface, in the east part of the basin near the Crafton Hills and Badlands area and north along the San Bernardino Mountains where Waterman Canyon and East Twin Creeks enter the basin, to near land surface, in the former swampland (fig. 2).
13

34
! Municipal Aifport i 1 ' A ' i- "Itfehi- « iS' J*^f '^ V "x^-jt^bAf , RMfro^ieid T"NV -V-^^J^u*iV x> Yxl'i^-fu. ; ; \ i ; ,; ^i- -4 -^op^X. ;\. \\tf l
T. 1 K.
T. 1 s.
34° 06'^
FIGURE 5.--Altitude of potentiometric surface and direction of ground-water movement, summer 1986.
14

6 MILES
6 KILOMETERS
117° 10
EXPLANATION
UNCONSOLIDATED DEPOSITS
PARTLY CONSOLIDATED DEPOSITS
CONSOLIDATED ROCKS
CONTACT
FAULT
BOUNDARY OF STUDY AREA
GROUND-WATER BARRIER
POTENTIOMETRIC CONTOUR-Shows composite altitude at which water level would have stood in tightly cased wells tapping both upper and lower aquifers. Contour interval variable, in feet. Datum is sea level
DIRECTION OF GROUND-WATER MOVEMENT
Geology modified from Dibblee (1963, 1968) and Dutcher and Garrett (1963)
15

Land Use
Human activities commonly are important factors affecting the contamina tion of ground water; the various land uses can determine the type of contami nants that might be present. Because previous, as well as current, land use may exert an influence on water quality, both recent and historical land-use information was used to classify land use in the vicinity of wells sampled for this study.
A survey in 1984 of the upper Santa Ana River drainage area by the California Department of Water Resources (1985) provided current land use on 1:24,000-scale U.S. Geological Survey topographic maps. Using this informa tion, a land-use map for the Bunker Hill basin was prepared and is shown in figure 6. In preparing this map, small-scale details were ignored and several specific land-use categories were combined as shown below:
Land-use categories ___(this study)
Land-use categories(California Department ofWater Resources, 1985)
Urban
Unused
Citrus
Other agriculture
1) Residential2) Commercial3) Industrial4) Vacant, paved, or unpaved5) Military
1) Native vegetation2) Barren land3) Stream channels
1) Orange and grapefruit
1) Field, vegetable, and grass crops2) Avocados3) Feedlots for livestock or poultry4) Parks, lawn areas, or golf courses
16

The most extensive land use in 1984 in the Bunker Hill basin was urban, which occupied approximately 50 percent of the area. Unused land occupied approximately 25 percent, citrus agriculture approximately 20 percent, and other agriculture approximately 5 percent of the basin. The major residential areas in the basin are in the cities of San Bernardino and Redlands. Approxi mate populations in 1986 were 150,000 for the city of San Bernardino, 50,000 for the city of Redlands, and 50,000 for the outlying parts of the basin. Large areas of unused land are located in the northwest and northeast parts of the basin. The major citrus-growing areas are in Loma Linda, in the southern part of the basin; in Redlands; and in East Highlands. Urban land use in the upper Santa Ana River basin increased approximately 23 percent between 1975 and 1984; acreage used for agricultural purposes decreased approximately 31 percent (California Department of Water Resources, 1985, p. 9). A similar pattern of changing land use has existed in the Bunker Hill basin.
Prior to 1950, septic tanks were the primary method of sewage disposal in the Bunker Hill basin. Now virtually all the populated area is sewered. However, septic tanks still are used near Mentone in the eastern part of the basin and near Redlands. Currently (1986), six wastewater-discharge sites exist within the basin; three are sewage-discharge sites and three are industrial-discharge sites. One sewage percolation pond outside the northern part of the basin may discharge to the basin. Six former wastewater-discharge sites are no longer operated in the basin; three were sewage-discharge sites and three were industrial-discharge sites. The location of both active and inactive wastewater-discharge sites is shown in figure 6.
17

R. 5W. 117° 20'
34° 12'|
HGURE 6.~Land use, 1984.

6 MILES
6 KILOMETERS
R3W 117° 10'
EXPLANATION
BOUNDARY OF STUDY AREA
LAND USE --
Urban
Unused
Agriculture (citrus)
Agriculture (other)
WASTEWATER-DISCHARGE SITES --
Inactive -
Sewage
Industrial
' i SjAN MANUFL
~7 INDIA*; RE£
Land-use data modified from California Department of Water Resources (1985)
19

METHODS OF DATA COLLECTION
Site Selection
Water-quality data were collected for this study from 47 agricultural, industrial, or municipal production wells (fig. 7). Physical data for the wells sampled are shown in table 1. Several criteria were considered impor tant in the selection of wells. These include:
1. Information on well construction;2. Perforation intervals contained entirely within a single aquifer;3. The need to obtain adequate areal coverage in both aquifers;4. Availability of historical water-quality data; and5. Existence of wells within known contaminated areas, as well as
upgradient and downgradient of suspected sources.
Data from wells sampled by other agencies were used where additional data were needed to define the areal distribution of dissolved solids and the extent of nitrate, PCE, and TCE contamination. Other agencies that currently collect or have collected ground-water-quality data in the Bunker Hill basin include the California Regional Water Quality Control Board (Santa Ana Region), California Department of Health Services, East Valley Water District, Patton State Hospital, Gage (Canal Company, San Bernardino Valley Municipal Water District, and the cities of San Bernardino, Redlands, Loma Linda, Riverside, Rialto, and Colton.
IWater samples were collected by the U.S. Geological Survey during April-
August 1986. Thirteen wells were resampled during that period to verify inorganic chemical, nitrogen, or volatile-organic-compound concentrations. The water-quality data from other agencies includes data collected since 1984. The historical water-quality data used in this study includes data obtained by the U.S. Geological Survey between 1955 and 1980 and stored in the WATSTORE computerized data-base system and data collected by other agencies between 1976 and 1978.
20

Table 1.--Wells used for water-quality sampling
[USGS; U.S. Geological Survey. USGS well-identification number: First six digits are latitude, the next seven digits are longitude, and final two digits are sequence numbers to uniquely identify each site. Altitude of land surface is given in feet above sea level. Perforation interval and depth of well are given in feet below land surface. --, no data avail able]
State wellNo.
001N003W27N02S001N003W29M01S001N003W29N01S001N003W30J05S
001N003W31Q02S
001N004W08P01S001N004W16E01S001N004W16E04S001N004W25A01S
001N004W25C02S001N004W26E02S 1
001N004W27G01S001N004W32D03S
001N004W34G01S
001S002W16F01S001S002W18R01S001S002W30B02S
001S003W01H01S001S003W03R01S
001S003W06H04S
001S003W09E02S
001S003W15G01S001S003W16A01S001S003W17C03S
001S003W17H08S001S003W17L01S
USGS well- identification
No.
340819117111601340830117133001340814117132701340830117133801
340722117135801
341052117191801341023117183901341024117184501340857117144601
340858117152002340846117160501
340846117171001340757117193801
340746117170501
340515117053901340442117074501340334117073201
340649117082901340632117102201
340659117133501
340605117122401
340509117105101340518117112501340527117130601
340506117123001340453117130101
Altitude of land surface
1,4911,3451,2911,340
1,120
1,4771,4121,4131,296
1,2461,236
1,2271,231
1,142
2,0711,7631,706
1,5411,302
1,140
1,190
1,3001,2931,176
1,2151,189
Perforation interval
56-128238-337,347-396235-319,330-3823 perforations
from 485-798
3 perforationsfrom 90-185186-351186-406300-404
5 perforationsfrom 188-546
378-5693 perforations
from 320-660390-502
7 perforationsfrom 150-658
494-572,577-670
90-147187-240,254-3905 perforations
from 120-228250-308,326-414
23-559
3 perforationsfrom 173-415
3 perforationsfrom 211-385152-338105-395105-255
--
Depth of well, total
150.00408.00409.00820.00
201.00
380.00415.00441.00551.00
606.00689.00
502.00685.00
700.00
160.00401.00250.00
414.00575.00
421.00
401.00
354.00418.00296.00
188.00
See footnote at end of table.
21
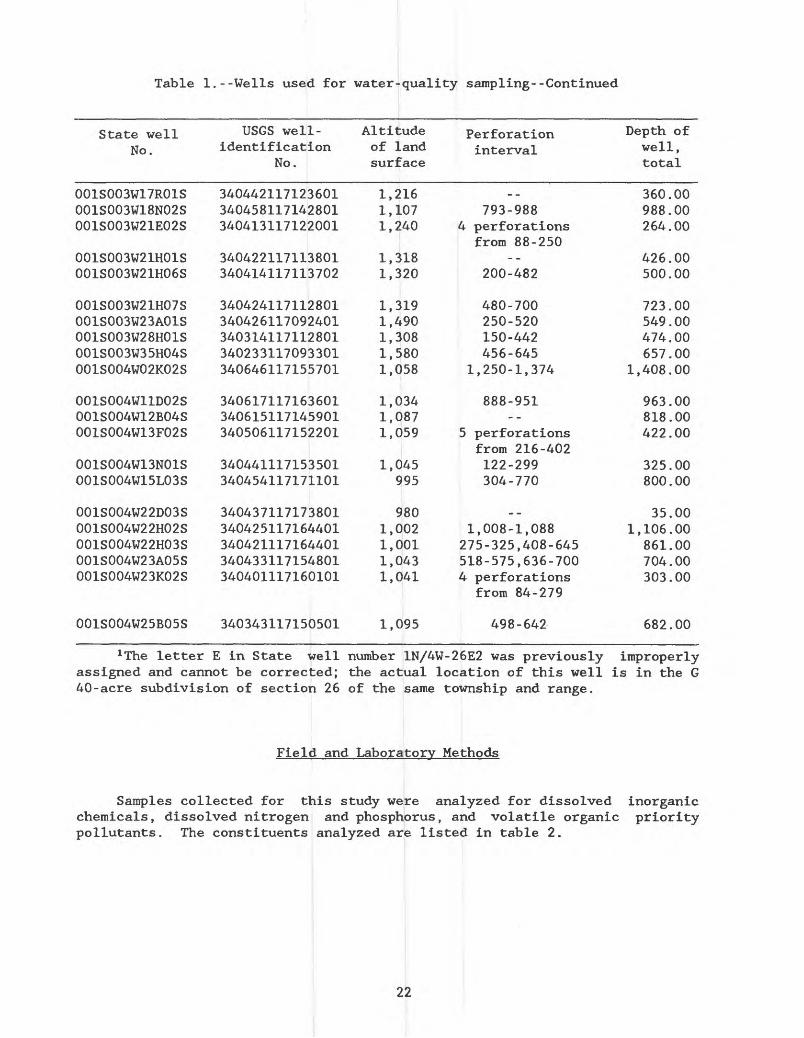
Table 1.--Wells used for water-quality sampling--Continued
State well No.
001S003W17R01S001S003W18N02S001S003W21E02S
001S003W21H01S001S003W21H06S
001S003W21H07S001S003W23A01S001S003W28H01S001S003W35H04S001S004W02K02S
001S004W11D02S001S004W12B04S001S004W13F02S
001S004W13N01S001S004W15L03S
001S004W22D03S001S004W22H02S001S004W22H03S001S004W23A05S001S004W23K02S
USGS well- identification
No.
340442117123601340458117142801340413117122001
340422117113801340414117113702
340424117112801340426117092401340314117112801340233117093301340646117155701
340617117163601340615117145901340506117152201
340441117153501340454117171101
340437117173801340425117164401340421117164401340433117154801340401117160101
Altitude of land surface
1,2161,1071,240
1,3181,320
1,3191,4901,3081,5801,058
1,0341,0871,059
1,045995
9801,0021,0011,0431,041
Perforation interval
793-9884 perforations
from 88-250--
200-482
480-700250-520150-442456-645
1,250-1,374
888-951
5 perforationsfrom 216-402122-299304-770
_ _1,008-1,088
275-325,408-645518-575,636-7004 perforations
Depth of well, total
360.00988.00264.00
426.00500.00
723.00549.00474.00657.00
1,408.00
963.00818.00422.00
325.00800.00
35.001,106.00
861.00704.00303.00
001S004W25B05S 340343117150501 1,095
from 84-279
498-642 682.00
x The letter E in State well number 1N/4W-26E2 was previously improperly assigned and cannot be corrected; the actual location of this well is in the G 40-acre subdivision of section 26 of the same township and range.
Field and Laboratory Methods
Samples collected for this study were analyzed for dissolved inorganic chemicals, dissolved nitrogen and phosphorus, and volatile organic priority pollutants. The constituents analyzed are listed in table 2.
22

Table 2.--Water-quality constituents analyzed for this study
Specific conductance PH
Calcium (Ca) Magnesium (Mg) Sodium (Na) Potassium (K)
Nitrite + nitrate (N02+N03) as nitrogen (N)
FIELD MEASUREMENTS Water temperature Alkalinity
DISSOLVED INORGANIC CONSTITUENTS Carbon dioxide (C02) Silica (Si02) Sulfate (804) Boron (B) Chloride (Cl) Iron (Fe) Fluoride (F) Manganese (Mn)
DISSOLVED NITROGEN AND PHOSPHORUS Ammonia (NH^) as N Phosphorus (P)
+ organic N as N Orthophosphorus as P
VOLATILE ORGANIC COMPOUNDSBenzeneBromoformCarbon tetrachlorideChlorobenzeneChlorodibromomethaneChloroethaneChloroformDichlorobromomethaneDichlorodifluoromethaneEthylbenzeneMethyl bromide
Methyl chlorideMethylene chlorideTetrachloroethyleneTolueneTrichloroethyleneTrichlorofluoromethaneVinyl chloride1,1-Dichloroethylene1,1-Dichloroethane1.1.1-Trichloroethane1.1.2-Trichloroethane
(total)1,1,2,2-Tetrachloroethane 1,2-Dichlorobenzene 1,2-Dichloroethane1.2-Dichloropropane1.3-Dichloropropene 1,3-Dichlorobenzene 1,2-transdichloroethene 2-Chloroethyl vinyl ether 1,4-Dichlorobenzene trans-1,3 -Dichloropropene cis-1,3-Dichloropropene
Specific conductance and pH were measured in the field using portable meters. Alkalinity also was determined in the field by titrating the water sample with 1.6N 1 sulfuric acid to an end point of pH 4.5. Water-temperature measurements were made in the field with a hand-held mercury-filled thermome ter having a full-scale precision of 0.5 °C. Accuracy of the thermometer was assured by comparison to an American Society for Testing and Materials 2 standard laboratory thermometer.
x The normality (N) of a solution is the number of gram-equivalent weights of solute per liter of solution.
2The use of firm and trade names in this report is for identification only and does not constitute endorsement by the U.S. Geological Survey.
23

R. 5W. 117° 20' R. 4W.
34° 12
fy I : JIii «ik ̂ K (jU j ' L-ILlJ p,. ^^U:| ̂ jC4
FIGURE 7.--Location of wells sampled.
24

6 MILES
6 KILOMETERS
R3 W 117° 10
EXPLANATION
UNCONSOLJDATED DEPOSITS
PARTLY CONSOLIDATED DEPOSITS
CONSOLIDATED ROCKS
CONTACT
FAULT
BOUNDARY OF UPPER CONFINING LAYER
BOUNDARY OF STUDY AREA
GROUND-WATER BARRIER
WELL AND NUMBER
Upper aquifer
Lower aquifer
Upper and lower aquifers
With no confinement
Well perforation unknown
Geology modified from Dibblee (1963, 1968) and Dutcher and Garrett (1963)
25

Flowing wells were sampled from small spigots at the well head. Before samples were collected from idle wells, at least 3 times the casing volume was pumped from the wells; samples were collected when water temperatures and specific conductance remained constant.
Samples analyzed for dissolved constituents were filtered in the field through a membrane filter having nominal pore openings of 0.45 /un. Cations were stabilized by acidification with nitric acid to a pH of less than 2. Changes in nitrogen and phosphorous concentrations were minimized by the addition of mercuric chloride as a biocide, chilling at 4 °C, and storage in an amber bottle to eliminate photosynthetic processes. Samples for analysis of volatile organic compounds were collected in 40-mL glass vials with Teflon- lined septum caps. Care was taken to avoid air bubbles in the filled vials. Before the vials were capped, a known volume of a solution containing three surrogate compounds (discussed in next section) was added.
Laboratory methods used by the U.S. Geological Survey for analysis of dissolved constituents are given in Skougstad and others (1979). For histori cal data found in WATSTORE, laboratory analyses were done by the U.S. Geologi cal Survey using methods given in Skougstad and others (1979) and Brown and others (1970). Analysis of volatile organic compounds was done using electron-impact gas chromatography/mass spectrometry. Detection limits were either 0.2 or 3.0 A*g/L, depending on the sensitivity requested. Chemical analyses for supplemental wells sampled by other agencies and included in this report were done by Clinical Laboratory of San Bernardino, Inc.; Edward S. Bobcock and Sons, Inc.; and Montgomery Engineering, Inc. These laboratories were certified by the State of California at the time samples were analyzed.
Quality Assurance
Several quality-assurance procedures were used to ensure the validity of ground-water-quality data collected for this study. Duplicate samples were collected at one well for analysis of general inorganic chemicals and at three wells for analysis of organic compounds. Triplicate samples were collected at seven wells for analysis of nitrates. Six wells sampled for PCE and TCE by other agencies were sampled at the same time by the U.S. Geological Survey.
For analysis of volatile organic compounds, a "trip blank" consisting of distilled water from the laboratory was transported in the field and shipped to the laboratory in the same manner as samples from the wells. This proce dure gives an indication of contamination from handling of samples in the field and in the laboratory.
26

In addition, a small volume of a solution containing known concentrations of bromochloromethane, 1-bromo-2-chloroethane, and 1,4-dichlorobutane was injected with a hypodermic syringe into each sample before capping the vial in the field. These three compounds, which span the range in chemical character istics of the volatile organic compounds analyzed, acted as "surrogates" and were used to compute percent recoveries. A fourth surrogate compound, 4-bromofluorobenzene, was added in the laboratory. Differences in the percent recovery between the surrogate added in the laboratory and the three surro gates added in the field can be used to evaluate the relative significance of losses incurred from handling in the field in comparison with losses incurred in the laboratory. As an internal standard, and to calibrate the instrument, fluorobenzene was added prior to analysis. All surrogates and the internal standard were added in amounts sufficient to produce a concentration of 20 /jg/L in the samples.
APPRAISAL OF GROUND-WATER QUALITY
Ground-water-quality data in the Bunker Hill basin are evaluated in this section by three methods:
1. Comparison with water-quality standards,2. Correlation of relations between chemical composition and
land-use patterns or perforated interval in wells, and3. Determination of historical changes in chemical concentrations.
The California Department of Health Services has established specific water-quality standards, including maximum contaminant levels (MCLs), for domestic drinking waters. MCLs for constituents determined in this study are given in table 3. These levels are the maximum permissible concentrations of contaminants in water that is delivered to a public water system. All ground- water-quality data collected for this study are given in the supplemental data section at the end of this report; these data indicate that MCLs (or "action levels") are exceeded in some wells for fluoride, nitrate, PCE, and (or) TCE. (An action level is the current recommended permissible level while the MCL is being determined.)
Helsel and Ragone (1984) discussed three statistical inference procedures that are useful in testing whether various factors can be correlated with differences in regional ground-water quality. These procedures use parametric analysis of variance, nonparametric methods for comparison of groups of data, and contingency-table analysis of frequency data. For this study, the nonparametric Kruskal-Wallis test and contingency table for frequency of detection were used, along with qualitative comparisons and graphical methods. Both statistical methods are described briefly below, and in greater detail in Conover (1980) and Helsel and Ragone (1984).
27

Table 3.--Maximum contaminant levels for domestic drinking water
[Source: California Department of Health, 1977]
Constituent Maximum contaminant level
Iron (Fe)................Manganese (Mn)...........Tetrachloroethylene (PCE) Trichloroethylene (TCE)..
Micrograms per liter
30050
I Milligrams per liter
Chloride (Cl).................................... 2 250-500Dissolved solids................................. 2 500-1,000Fluoride (F)..................................... 3 1.4-2.4Nitrate-nitrogen (N03 -N) ......................... 10Sulfate (S04 ) .................................... 2 250-500
Microsiemens per centimeter at 25 °C
Specific conductance............................. 900-1,600
111 Action level," the current recommended permissible level while a maximum contaminant level is being determined.
2No fixed consumer acceptance contaminant level has been established. The lower constituent concentrations are recom mended and the higher levels are acceptable if it is neither reasonable nor feasible to provide more suitable waters.
3Depends on annual average of maximum daily air temperature.
The Kruskal-Wallis test is analogous to a one-factor parametric analysis of variance (Conover, 1980). Concentration data are numerically ranked from lowest to highest for this test. The hypothesis that all subgroups of the ranked data produce (statistically) similar data then is tested against the alternative hypothesis that some subgroups produce dissimilar data. Confi dence in the test is assigned a probability, or significance level (a), which also can be expressed as a percentage (100-lOOcr). The a used for this study is 0.05 unless otherwise indicated. For this study, the data in table 4 for major-ion chemical composition, nitrate concentration, and dissolved-solids concentration were categorized into subgroups on the basis of predominant land use at the sampled well during 1984 and 1975-76 and of perforation intervals in the well casing (table 4).
28

Table
4. Selected data for
statistical
analysis,
1988
[Abb
revi
ations:
Predominant
land us
e:
UN,
unus
ed;
CA,
citrus agriculture; UC
, urban
commercial or in
dust
rial
; UR
, ur
ban
resi
dential; and
OA,
othe
r agricultur
e.
--,
no data av
aila
ble.
De
scri
ptio
n of aquifer
perforated:
NC,
no co
nfin
emen
t; U, up
per
aquifer;
L, lo
wer
aqui
fer;
and
BA,
both aquifers.
NO,-N, ni
trat
e as
ni
trog
en;
mg/L,
mill
igra
ms per
liter; Ug
/L,
micr
ogra
ms per
lite
r; ND
, not
dete
cted
]
to
State
well
No.
1N/3
W-27
N21N/3W-29M1
1N/3W-29N1
1N/3
W-30
J51N
/3W-
31Q2
1N/4W-08P1
1N/4W-16E1
1N/4W-16E4
1N/4W-25A1
1N/4W-25C2
1N/4
W-26
E21N/4W-27G1
1N/4
W-32
D31N/4W-34G1
1S/2
W-16
F11S/2W-18R1
1S/2W-30B2
1S/3
W-03
R11S/3W-06H4
1S/3
W-09
E21S/3W-15G1
1S/3
W-16
A11S
/3W-
17C3
1S/3W-18N2
1S/3
W-21
E21S
/3W-
21H6
1S/3W-21H7
1S/3W-23A1
1S/3W-28H1
1S/3W-35H4
1S/4W-02K2
1S/4W-11D2
1S/4W-13F2
1S/4
W-13
N11S
/4W-
15L3
1S/4W-22H2
1S/4
W-22
H31S
/4W-
23A5
1S/4
W-23
K21S
/4W-
25B5
Perforation
interval,
in feet
below
land
surf
ace
56-128
238-
396
235-382
485-798
90-185
186-351
186-406
300-404
188-546
378-569
320-660
390-
502
150-658
494-670
90-147
187-390
120-228
23-559
173-415
211-
385
152-338
105-395
105-
255
793-
988
88-2
5020
0-48
2480-700
250-520
150-442
456-645
1,25
0-1,
374
888-951
216-402
122-299
304-770
1,008-1,088
275-
645
518-700
84-279
498-642
Pred
omin
ant
land u
se,
in1984 UN CA UC UR UC OA UN UN UR UR UR UR UR UR CA UC CA CA UR UC UN CA CA UC CA OA CA CA UC UR UC UC UC UC UC OA OA UC UC UR
1975
-76
UN CA UR UR UR -- -- -- UR UR -- -- -- -- -- UC CA CA UR UN UN CA CA OA CA CA CA CA UR CA UR -- -- OA -- -- -- OA OA UR
Desc
ript
ion
of a
quif
er
perf
orat
ed
NC NC NC NC U NC NC NC NC NC NC NC NC L NC NC NC NC BA BA BA BA U L U NC NC NC NC NC L L BA U L L BA L U L
Ca 23 23 21 8 17 33 36 36 19 19 21 34 31 34 35 33 29 28 29 29 31 28 21 11 32 34 33 34 25 24 20 22 22 30 6 8 32 34 24 22
Perc
enta
ge of equivalents
per
lite
rMg 9 12 9 4 4 10 11 11 8 8 10 11 10 10 10 10 13 9 8 9 9 9 7 1 8 8 9 9 7 9 3 4 4 7 0 1 7 7 13 8
Na+K 18 16 20 37 30 8 6 5 22 23 18 5 7 6 6 7 8 14 12 13 11 15 21 38 9 8 8 9 17 16 28 23 23 13 42 41 10 10 14 18
HC03 25 34 22 20 22 35 38 40 22 22 28 34 37 30 34 42 30 32 30 37 36 37 35 39 30 32 35 35 30 28 35 33 33 26 31 28 28 30 26 29
S04
Cl
N03-
N
13 8 15 24 12 8 5 4 19 19 15 8 11 8 9 5 10 6 9 5 7 6 7 6 10 9 9 7 10 11 18 12 12 14 6 11 17 9 11 11
7 4 6 7 5 3 3 2 5 5 6 3 2 9 2 2 3 5 5 4 5 4 4 4 3 3 2 2 4 3 6 5 5 3 15 10 4 3 7 7
5 3 7 0 10 3 3 2 5 4 2 5 2 3 4 1 7 6 7 3 1 1 5 1 8 6 4 4 7 9 0 1 1 7 0 1 2 7 5 5
Soli
ds,
sum
of
constit
uents,
dis
solv
ed
(mg/L)
360
270
310
370
430
220
370
440
400
400
310
330
290
310
300
150
320
190
210
150
160
150
330
200
280
290
220
220
360
330
240
220
200
400
240
240
390
220
520
460
Nitr
o
gen,
N02+N0
3 ,
dis
solv
ed
(mg/
L as
N)
8.10
3.60
10.0 .2
823.0 3.20
4.0
4.90
10.0 7.10
2.40
8.50
3.20
4.60
5.70 .39
12.0 6.20
7.60
2.50 .87
.84
8.10 .49
11.0 8.90
4.40
4.20
13.0
16.0 .3
4.8
93.
5013
.0 .27
.58
3.20
7.40
15.0
11.0
Tetr
a-
chloro-
ethy
l-
ene,
tota
l (ug/D
ND ND ND ND ND ND150
220 ND ND ND.7
3.6 .4
ND ND ND ND 1.8
1.0
ND ND ND ND ND ND ND.2
1.1
ND ND ND.2 .4 -- ND.2 .4
ND ND
Tri-
chloro-
ethy
l-
ene,
tota
l (wg/D
0.2
ND ND ND.2
ND 33.0
43.0 ND ND.5
2.4
11.0 .6
ND ND ND ND ND 3.0
ND ND ND ND.7
28.0 2.9
36.0 7.5
ND ND ND.2 .2 ND.6
ND ND.2

Helsel and Ragone (1984, p. 28) noted that rank-transform statistical tests, such as Kruskal-Wallis, should not be applied to data sets in which more than 20 percent of the values are less than the detection limit. There fore, a categorical or nominal method that uses the frequency of exceeding the detection limit, rather than concentration itself, was used to evaluate volatile-organic-compound data in this study. Only PCE and TCE (table 4) were statistically tested with their concentration data segregated in two catego ries (detected or not detected) against subgroups based on land use and aquifer perforated (the same subgroups used in the Kruskal-Wallis test de scribed above). These two compounds were selected from the list of 33 vola tile organic priority pollutants in table 2 because they were among the more commonly found volatile organic compounds in this study and because the State of California has established "action levels," or recommended permissible concentrations, for these compounds while MCLs are being determined. In addition to the statistical test, all volatile-organic-compound data are summarized in tabular form giving frequency of detection and maximum concentration measured.
Data (collected by the U.S. Geological Survey) for 40 wells used for the statistical tests are in table 4. The monovalent alkali metals, sodium and potassium, are combined because potassium concentration usually is much lower than sodium concentration. Nitrate and dissolved-solids concentrations are in milligrams per liter, and PCE and TCE concentrations are in micrograms per liter. Only one set of concentrations was used for wells sampled more than once. Analyses from six wells sampled for this study were not included (data are given in the supplemental data section at the end of this report but are omitted from table 4) because their perforation intervals were not known. In addition, data from well 1S/3W-1H1 were not used because organic data were not available and, for the inorganic data, the total cation concentration was 14 percent less than the total anion concentration, indicating possible analyti cal error. Perforation intervals given in table 4 are for the top and bottom openings and do not include the more detailed subintervals given in table 1. Predominant land use within a radius of one-half mile around each well was determined for 1984 from land-use maps furnished by the California Department of Water Resources and for 1975-76 from land-use maps in Eccles and Klein (1978) and Klein and Bradford (1979). The aquifer in which the well perfora tion interval is located was determined from geologic sections of Hardt and Hutchinson (1980).
Inorganic Chemistry
Inorganic-Constituent Concentrations
Methods of sampling and analysis for inorganic constituents were the same as those in routine use for many years; therefore, only a single "duplicate" (well immediately resampled) sample was obtained--from well 1S/3W-18N2. Results, given in the supplemental data section at the end of this report, indicate that differences are no greater than a few percent for the major inorganic constituents.
30

The inorganic quality of ground water in the Bunker Hill basin generally is suitable for most uses. In 46 wells sampled for this study, specific conductance and the concentrations of chloride, dissolved solids, and sulfate (supplemental data section) were found to be less than the higher (acceptable) MCLs shown in table 3. Concentrations of iron and manganese were less than the MCL in all wells except well 1S/4W-22D3, which is located in the former swampland (fig. 7). Although its perforated interval is not known, this well was drilled to a depth of approximately 35 feet and therefore does not penetrate the clay layer above the upper aquifer (San Bernardino Valley Municipal Water District, written commun., 1986). This well is used only periodically (mostly in the summer) for local dewatering of the shallow aquifer in the former swampland. The probable cause of high iron and manganese concentrations in the water from this well is the anoxic conditions in the shallow aquifer, or anoxic conditions in the well because of its infrequent use.
Ground water from five wells sampled for this study contained fluoride concentrations that exceeded the MCL for this area. MCLs for fluoride are based on the annual average of maximum daily air temperature. For the study area, the annual average of maximum daily air temperature is about 27 °C; therefore, the MCL for fluoride is 1.4 mg/L. Samples that exceeded this level (see supplemental data section) were from wells that are deeper than 400 feet and located north of fault K or near the San Jacinto fault. The high fluoride concentration in these wells may be associated with deeper water moving upward along the faults or barriers, as suggested by Eccles and Klein (1978, p. 21).
Surface water entering the basin shows differences in concentrations of dissolved inorganic chemicals that are a result of differences in the composition of the rocks in which each stream originates (Dutcher and Garrett, 1963). Chemical concentrations in ground water from the vicinity of the streams are, in turn, influenced by the chemical composition of the recharging surface water. Differences in chemical composition commonly are expressed in an abbreviated way by designating the principal cations and anions (on an equivalents basis). For example, a calcium sodium bicarbonate water type is one in which calcium is the most abundant cation, sodium is the second most abundant cation, and bicarbonate is the most abundant anion.
Cajon, Waterman Canyon, East Twin, and San Timoteo Creeks originate in continental deposits of Tertiary and Quaternary age, and water in these streams generally has a dissolved-solids concentration greater than 400 mg/L (Dutcher and Garrett, 1963, p. 92). Lytle Creek, City Creek, Plunge Creek, Mill Creek, and the Santa Ana River drain areas in which the principal exposed rocks are the basement complex of Precambrian age, and water in these streams generally has a dissolved-solids concentration less than 300 mg/L (Dutcher and Garrett, 1963, p. 93). Furthermore, they found that water in East Twin Creek and in Waterman Canyon Creek (which join near the study area boundary) is of a sodium sulfate type. Water from San Timoteo Creek on the south side of the basin and City Creek and Plunge Creek on the east side generally is of a calcium sodium bicarbonate type. Water from Cajon Creek, Lytle Creek, Mill Creek, and the Santa Ana River is of a calcium bicarbonate type.
31

Dissolved-solids concentration in ground water (1984-86) from the upper aquifer (including areas of no confinement) and from the lower aquifer is shown in figure 8. Lowest concentrations in the basin are found near the Santa Ana River, and concentrations generally increase in the direction (westward) of ground-water movement. Highest dissolved-solids concentrations in ground water are in the areas of Waterman Canyon-East Twin Creeks and San Timoteo Creek; concentrations generally decrease in the direction of ground-water movement as the water mixes with ground water that has been recharged along the Santa Ana River.
Differences in inorganic chemical composition of ground water from selected wells are illustrated with Stiff diagrams in figure 9. For each well, concentrations (in milliequivalents per liter) of four cations were plotted, one on each horizontal axis to the left of a vertical zero axis; likewise, concentrations of three anions were plotted, one on each axis to the right of the zero axis. The resulting points were connected to give an irregular polygonal shape. The width of each diagram is an approximate indication of total ionic content.
Ground water from well 1N/4W-25C2 is of a sodium calcium bicarbonate sulfate type, indicating the influence of recharge of sodium sulfate surface water from the Waterman Canyon-East Twin Creeks area and of mixing with calcium bicarbonate water from other areas. At well 1N/4W-34G1, southwest and downgradient from well 1N/4W-25C2, the ground water is lower in dissolved solids and is of a calcium bicarbonate type, reflecting further dilution with calcium bicarbonate ground water that predominates in much of the basin (fig. 9).
Relation to Land Use and Aquifer
No effect of land use on the inorganic composition of ground water in the Bunker Hill basin could be discerned for 1984 or for 1975-76 using the Kruskal-Wallis statistical test. The test was applied by using the inorganic - chemical data and the five subgroups of land use that are given in table 4. Because the effects of land use on ground-water chemistry presumably decline with increasing depth, the test also was applied to subsets of the data from which deeper wells had been removed. However, even when wells for which the top of the perforated interval is deeper than 300 feet (also deeper than 200 feet) below land surface were excluded, the test showed no difference in the inorganic chemistry of the ground water for the subgroups of land use.
No significant differences in chemical composition between the aquifers were found--except for nitrate, which is discussed in a later section. The absence of a statistically significant difference is caused in part by the rather wide range in chemical composition within each aquifer. Mean concen tration and range in concentration of selected inorganic constituents in wells in the upper and lower aquifers are summarized in table 5. However, dissolved-solids concentrations were substantially higher in the upper than in the lower aquifer in the confined area (aquifers designated U and L in table 4). Wells penetrating both aquifers and wells outside the boundary of
32

the upper confining layer (fig. 7) (wells designated BA and NC in table 4) were not used in the statistical test. When well 1S/4W-25B5 in the lower aquifer is excluded from the test, the statistical significance increases from a=0.05 to a=0.01. The high dissolved-solids concentration in this well implies that its perforated interval (table 4) may be incorrect and that either the perforation interval actually extends into the upper aquifer or downward leakage around the well casing is occurring.
Wells 1N/4W-34G1, 1S/4W-15L3, 1S/4W-23A5, and 1S/4W-25B5 are perforated entirely within what is referred to as the "middle aquifer" by Dutcher and Garrett (1963), and wells 1S/3W-18N2, 1S/4W-02K2, 1S/4W-11D2, and 1S/4W-22H2 are perforated entirely within Dutcher and Garrett's "lower aquifer." (See discussion on page 9 in the "Geohydrology" section of this report.) Statistical testing of these data (excluding well 1S/4W-25B5 for reasons given in the preceding paragraph) reveals no significant difference in the inorganic chemistry of the lower and middle aquifers. This result supports the combining of the middle and lower aquifers into a single aquifer as defined by Hardt and Hutchinson (1980) and as used in this study, although it must be noted that this conclusion is based on data from a small number of wells.
Table 5.--Concentration of selected inorganic constituents in samples from wells in the upper and lower aquifers, 1988
Number Concentration, inof samples Calcium Magnesium
5 Mean 25 8 Range 17-32 4-13
8 Mean 20 4 Range 6-34 0-10
percentageSodium + potassium
Wells17
9-30
Wells26
6-42
of total ion equivalentsBicar
bonate
completed28
22-35
completed32
28-39
Sulfate
in upper11
7-14
in lower10
6-18
Chloride
aquifer4
3-7
acruifer7
3-15
Concentration , in milligrams
per literNitrate as N
14.0 8.1-23.0
3.2 0.34-11.0
Dissolved solids
392 280-520
266 200-460
Historical Trends
Eccles (1979, p. 15) found that dissolved-solids concentration decreased between 1968-69 and 1977-78 in ground water from the upper Santa Ana River basin. The decrease was attributed to increased artificial recharge and restrictions on wastewater discharge, changing water use, and above-normal rainfall since 1976. However, comparison of current (1986) to historical ground-water-chemical data given in the U.S. Geological Survey computer data base (WATSTORE) indicates that concentrations of dissolved inorganic chemicals have changed little in the Bunker Hill basin since 1960. Used to make this comparison were wells 1N/4W-27G1 and 1N/4W-32D3, which are upgradient of confining layers in the basin; wells 1S/4W-2K2, 1S/4W-13F2, and 1S/4W-22H2, which are perforated in the lower aquifer; and wells 1S/4W-13N1 and 1S/4W- 23K2, which are perforated in the upper aquifer.
33

R.5W
34° 12'
jw-g-..y<^V--'[ : ^ f^
- i'l C< rfrrfLrmr J -,^-^?« nrTBsr t-ur^^ ; I'^^Kr:^-!^,,
ir*^Jha"' r ',j^iiffii-u 1 *!*11!.. . H
i! , ' I i ' i i '-f' M ! ',. > ". ' ;:jr4q7rt- ^Ef i^^--^--^^^--^^ LM 7" f '" " ''^t^-x^^'l' /^ !
U.:. (i^-^;- -: --~tvpJ-*^'{ ..^'^""-""'ryiX
I»i__ _______!_» ___.^iil>__«>_»»^^ l__xU-i>^S
£- -it- . -'- .^iU- ;4-^i »-t-MffiSSB/fj " 1^ g=L,_i|: : ;.t^I=ifeJlSti /J^---
:'- ' ^''~'/^~^r.'
VK . '.T"^-^^ MarigtffcP,J»*c« r - , _^_'_ ^r-~~^i -i*
34° 06
520 ., O Upper aquifer
J280 . ., Lower aquifer200
0 Upper and lower aquifers
290- - With no confinement
240Well perforation unknown
FIGURE 8.~Distribution of dissolved solids in ground water, 1984-86.
34

6 MILES
6 KILOMETERS
R3W 117° 10'
EXPLANATIONUNCONSOLIDATED DEPOSITS
PARTLY CONSOLIDATED DEPOSITS
CONSOLIDATED ROCKS
CONTACT
FAULT
BOUNDARY OF STUDY AREA
GROUND-WATER BARRIER
300 LINE OF EQUAL DISSQLVED-SOLIDSCONCENTRATION-- In the upper aquifer or where there is no confinement of the lower aquifer. Interval 50 and 100 milli grams per liter
750 LINE OF EQUAL DISSOLVED-SOLIDSCONCENTRATION- In the lower aquifer. Interval 50 and 100 milligrams per liter
Geology modified from Dibblee (1963, 1968) and Butcher and Garrett (1963)
35

R.5W.
° '34° 12
^SSrajt
EXPLANATION (Continued)
WELL--Upper number is well number. Lower number is dissolved-solidsconcentration, in milligrams per liter
13N1O Upper aquifer
23A5 220 Lower aquifer
34° 06'
9E2© 150 Upper and lower aquifers
25C2- - 400 With no confinement
FIGURE 9.--Chemical quality of water from selected wells.
36

6 MILES
6 KILOMETERS
R3W 117° 10
EXPLANATION
UNCONSOLIDATED DEPOSITS
PARTLY CONSOLIDATED DEPOSITS
CONSOLIDATED ROCKS
CONTACT
FAULT
BOUNDARY OF STUDY AREA
......... GROUND-WATER BARRIER
STIFF DIAGRAM AND WELL NUMBER- Constitu ents in milliequivalents per liter. Differences in configuration reflect difference in chemical character. The area of the diagram is an in dication of dissolved-solids concentration. The larger the area of the diagram, the greater the dissolved-solids concentration
1S/3W-9E2Sodium I
plus potassium
Calcium
Geology modified from Dibblee (1963, 1968) and Dutcher and Garrett (1963)
37
Nitrate
Nitrogen exists in nature as several inorganic and organic forms, and transformations between these various forms are caused by a variety of biochemical processes. A brief discussion of these processes as they pertain to the study area is given by Klein and Bradford (1979). Because the current (1986) study found that by far the dominant form of nitrogen in ground water from the Bunker Hill basin is nitrate (supplemental data section at the end of this report), the following sections are limited almost entirely to the discussion of nitrate. Also, Klein and Bradford (1979, 1980) reported that nitrate was the predominant form of water-leachable inorganic nitrogen from the unsaturated zone in the parts of the basin studied by them. Furthermore, they showed that nitrite concentrations are low.
Nitrate concentrations were found to be virtually identical in three successively collected (triplicate) samples from seven wells (supplemental data section at the end of this report). Furthermore, little difference was observed for several wells sampled in spring 1986 and resampled in summer 1986. Nitrate concentrations in samples collected and analyzed by other agencies at the same time that samples were collected for this study also were in close agreement (difference less than 10 percent); therefore, data from other agencies are used in part of the discussion that follows. *
Nitrate Concentration
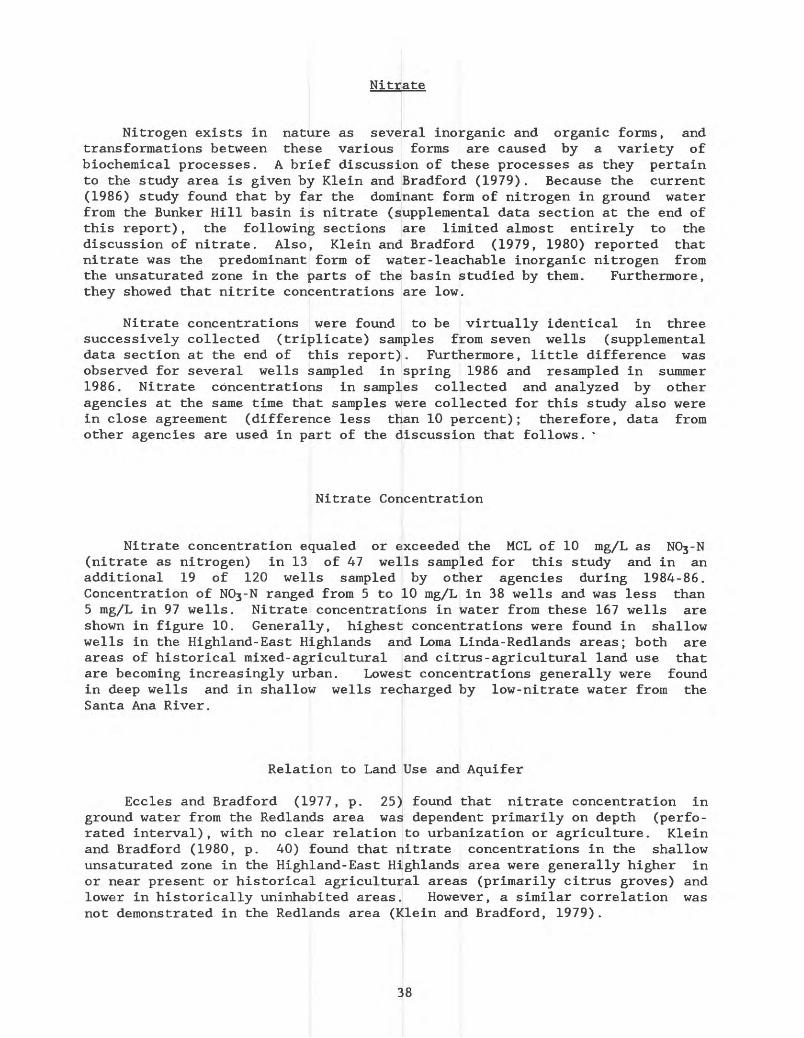
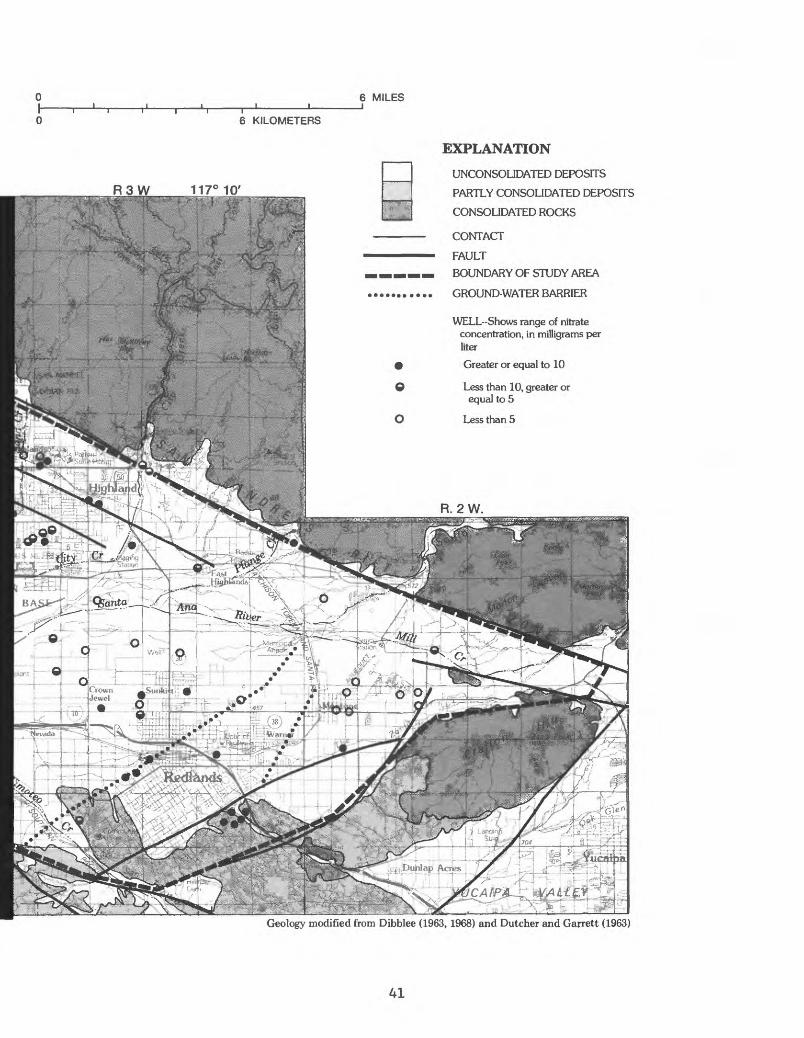
Nitrate concentration equaled or exceeded the MCL of 10 mg/L as N03 -N (nitrate as nitrogen) in 13 of 47 wells sampled for this study and in an additional 19 of 120 wells sampled by other agencies during 1984-86. Concentration of NC^-N ranged from 5 to 10 mg/L in 38 wells and was less than 5 mg/L in 97 wells. Nitrate concentrations in water from these 167 wells are shown in figure 10. Generally, highest concentrations were found in shallow wells in the Highland-East Highlands and Loma Linda-Redlands areas; both are areas of historical mixed-agricultural and citrus-agricultural land use that are becoming increasingly urban. Lowest concentrations generally were found in deep wells and in shallow wells recharged by low-nitrate water from the Santa Ana River.
Relation to Land Use and Aquifer
Eccles and Bradford (1977, p. 25) found that nitrate concentration in ground water from the Redlands area was dependent primarily on depth (perfo rated interval), with no clear relation to urbanization or agriculture. Klein and Bradford (1980, p. 40) found that nitrate concentrations in the shallow unsaturated zone in the Highland-East Highlands area were generally higher in or near present or historical agricultural areas (primarily citrus groves) and lower in historically uninhabited areas. However, a similar correlation was not demonstrated in the Redlands area (Klein and Bradford, 1979).
38
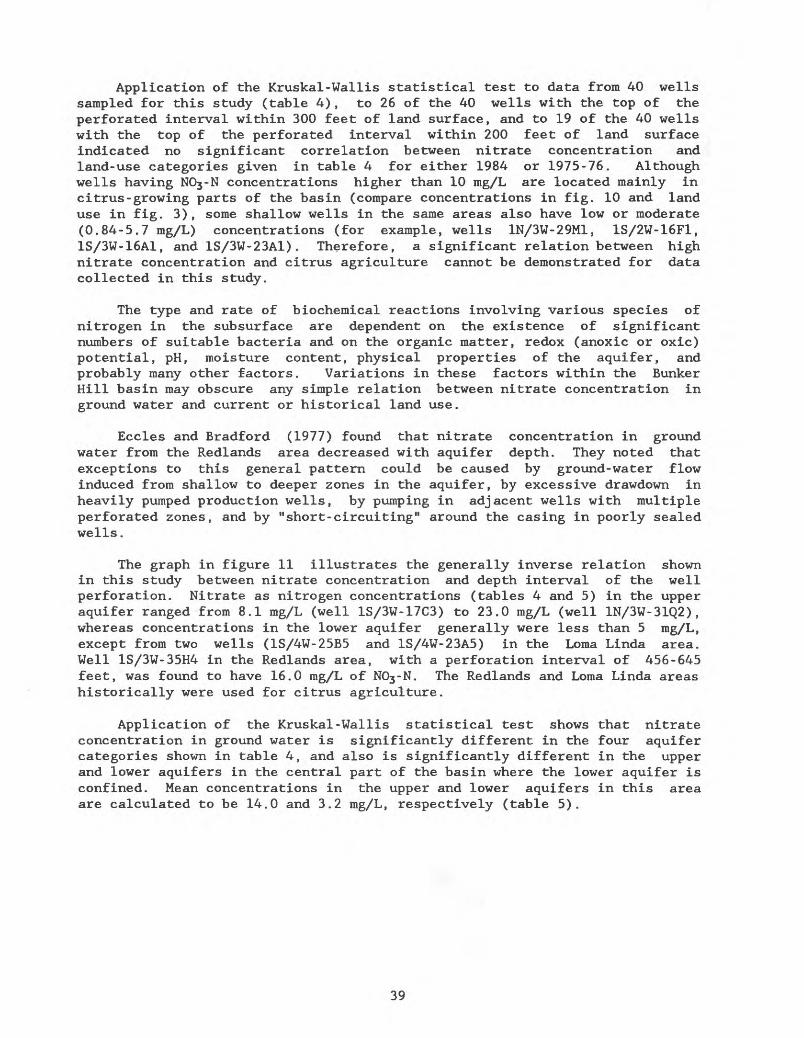
Application of the Kruskal-Wallis statistical test to data from 40 wells sampled for this study (table 4), to 26 of the 40 wells with the top of the perforated interval within 300 feet of land surface, and to 19 of the 40 wells with the top of the perforated interval within 200 feet of land surface indicated no significant correlation between nitrate concentration and land-use categories given in table 4 for either 1984 or 1975-76. Although wells having N03 -N concentrations higher than 10 mg/L are located mainly in citrus-growing parts of the basin (compare concentrations in fig. 10 and land use in fig. 3), some shallow wells in the same areas also have low or moderate (0.84-5.7 mg/L) concentrations (for example, wells 1N/3W-29M1, 1S/2W-16F1, 1S/3W-16A1, and 1S/3W-23A1). Therefore, a significant relation between high nitrate concentration and citrus agriculture cannot be demonstrated for data collected in this study.
The type and rate of biochemical reactions involving various species of nitrogen in the subsurface are dependent on the existence of significant numbers of suitable bacteria and on the organic matter, redox (anoxic or oxic) potential, pH, moisture content, physical properties of the aquifer, and probably many other factors. Variations in these factors within the Bunker Hill basin may obscure any simple relation between nitrate concentration in ground water and current or historical land use.
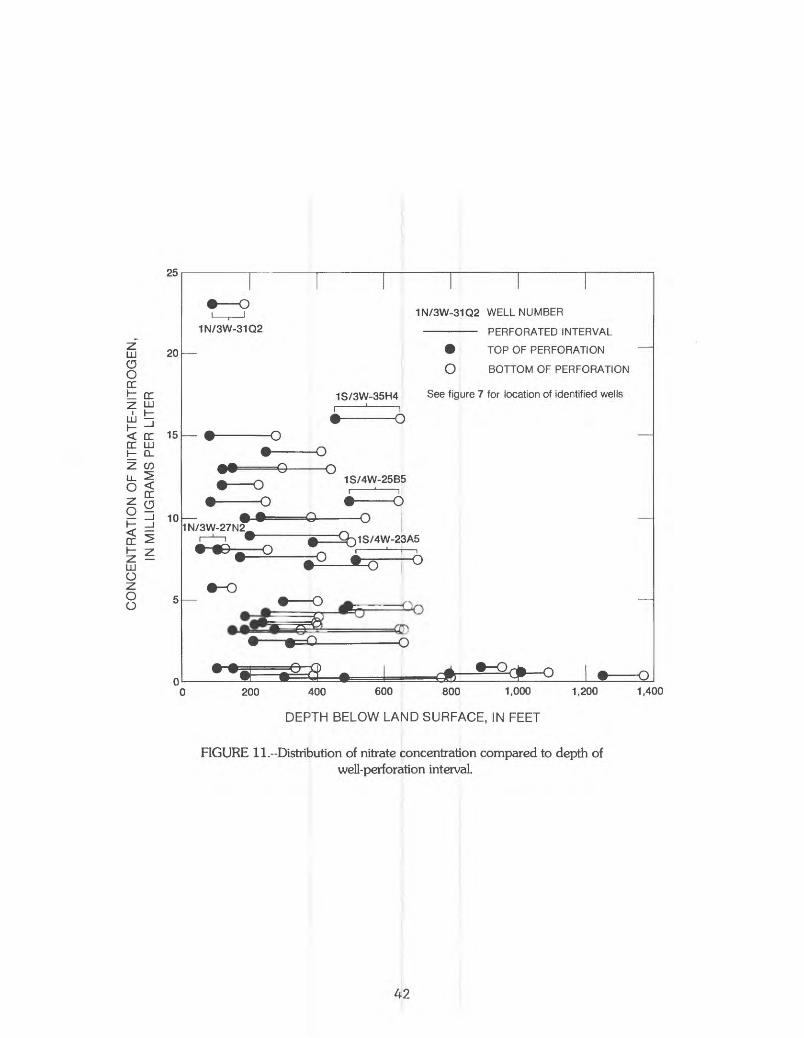
Eccles and Bradford (1977) found that nitrate concentration in ground water from the Redlands area decreased with aquifer depth. They noted that exceptions to this general pattern could be caused by ground-water flow induced from shallow to deeper zones in the aquifer, by excessive drawdown in heavily pumped production wells, by pumping in adjacent wells with multiple perforated zones, and by "short-circuiting" around the casing in poorly sealed wells.
The graph in figure 11 illustrates the generally inverse relation shown in this study between nitrate concentration and depth interval of the well perforation. Nitrate as nitrogen concentrations (tables 4 and 5) in the upper aquifer ranged from 8.1 mg/L (well 1S/3W-17C3) to 23.0 mg/L (well 1N/3W-31Q2), whereas concentrations in the lower aquifer generally were less than 5 mg/L, except from two wells (1S/4W-25B5 and 1S/4W-23A5) in the Loma Linda area. Well 1S/3W-35H4 in the Redlands area, with a perforation interval of 456-645 feet, was found to have 16.0 mg/L of N03 -N. The Redlands and Loma Linda areas historically were used for citrus agriculture.
Application of the Kruskal-Wallis statistical test shows that nitrate concentration in ground water is significantly different in the four aquifer categories shown in table 4, and also is significantly different in the upper and lower aquifers in the central part of the basin where the lower aquifer is confined. Mean concentrations in the upper and lower aquifers in this area are calculated to be 14.0 and 3.2 mg/L, respectively (table 5).
39

34° 12'
34° 06'
FIGURE 10.--Nitrate concentration in water from selected wells, 1984-86.
40
6 MILES
6 KILOMETERS
EXPLANATION
UNCONSOLJDATED DEPOSITS
PARTLY CONSOLIDATED DEPOSITS
CONSOLIDATED ROCKS
CONTACT
FAULT
BOUNDARY OF STUDY AREA
GROUND-WATER BARRIER
WELL-Shows range of nitrate concentration, in milligrams per liter
Greater or equal to 10
Less than 10, greater or equal to 5
Geology modified from Dibblee (1963, 1968) and Dutcher and Garrett (1963)
41
z"LJJ 20 O O DCb DCZ LLJ
ON OF NITRATE JGRAMS PER L 3 in
< ^DC ^1- zCONCEr* 1
D 01
i
! t i 1N/3W-31Q2 WELL NUMBER
1N/3W-31Q2 PERFORATED INTERVAL
_ TOP OF PERFORATION
O BOTTOM OF PERFORATION
1S/3W-35H4 See figure 7 for location of identified wells
0 ___ /^\U 0
^ ___ Q ! 1S/4W-25B5
O 0 o o
1N/3W-27N2^ ^r " i ^__Q-^1S/4W-23Ab " 0 O ̂o ^ o
-0
a if>L ^ ffi /7JN
^^^ ^. n r^
. .,, ,n ,rp t ^o^ 0200 400 600 800 1,000
DEPTH BELOW LAND SURFACE, IN FEET
1,200 1,400
FIGURE 11. -Distribution of nitrate concentration compared to depth of well-perforation interval.
Historical Trends
A few analyses of ground water from the Redlands area show a much higher nitrate concentration in the 1970's than in the 1930's (Eccles and Bradford, 1977, p. 13). Analyses from several wells in the same area also indicated an increase in nitrate concentration immediately after a period of heavy rain in 1968-69. Klein and Bradford (1979, 1980), following their finding of high nitrate concentration in the unsaturated zone in parts of the Bunker Hill basin, proposed a conceptual model in which a one-time rise in ground-water level with the water intercepting nitrate in the unsaturated zone could result in nitrate concentrations at the water table exceeding the MCL by severalfold. However, they noted that such high concentrations would be markedly reduced if there were significant vertical mixing and lateral transport. It would be desirable, given the limited information on which to base the choice of a realistic model, that periodic surveys such as this one be done to assess ground-water-quality conditions in the Bunker Hill basin.
Nitrate concentrations from as long ago as 1955 to the present (1986) for 17 wells are depicted graphically in figure 12. An areawide trend in concen tration is not apparent. When earliest data are compared to the most recent data, nitrate concentrations are seen to have increased in seven wells, decreased in five wells, and remained about the same in five wells. In the central part of the basin where the lower aquifer is confined, nitrate concen tration has increased in three wells perforated in the upper aquifer and decreased in one.
The N03 -N concentration in well 1S/3W-17C3, just downgradient of the Redlands sewage-treatment plant that was abandoned in 1963, was reported to be 28 mg/L in the fall of 1974 (Eccles and Bradford, 1977, p. 21). The concen tration in this well had decreased to 8.1 mg/L in spring 1986 (table 4).
Volatile Organic Compounds
The existence of ground-water contamination in the basin by volatile (purgeable) organic priority pollutants has been known for several years, although an assessment of changes with time is not possible because data were not collected prior to 1980. The URS Corporation (1986) found significant concentrations of PCE and TCE in soil-pore gas throughout the northwest part of the city of San Bernardino. Although unable to identify specific sources responsible for the contamination, URS listed businesses and activities in the area that are potential users of solvents containing PCE or TCE. As a result of ground-water contamination by PCE and TCE, pumping from 14 municipal water-supply wells in the area was discontinued as early as 1981. Pumping from five wells in the Redlands area was discontinued for the same reason.
Dibromochloropropane (DBCP), a soil fumigant whose use has been discon tinued, also has been found in ground water from the Redlands area (California Department of Health Services and California Regional Water Quality Control Board, written commun., 1986). However, samples were not analyzed for DBCP in this study.
43
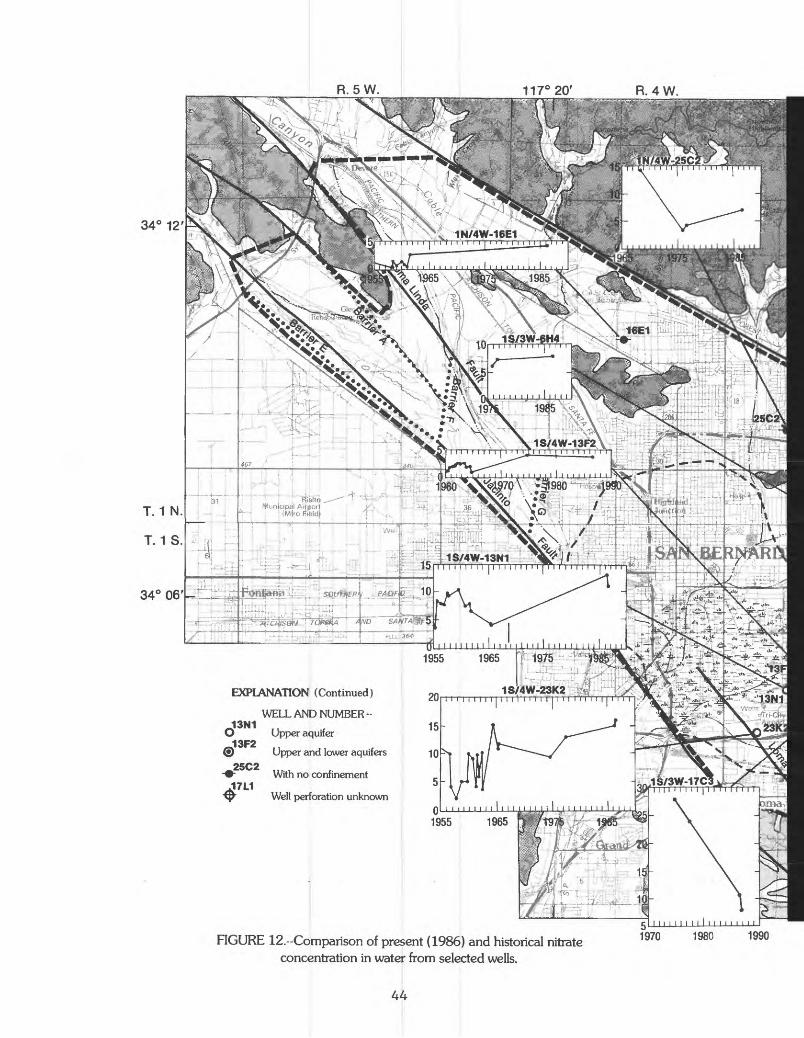
34° 12
Wunlcipal Aifporl (Miro Rifeldi
EXPLANATION (Continued)
WELL AND NUMBER--~ ,,O Upper aquifer
13F2Upper and lower aquifers
25C2- With no confinement
17L1Well perforation unknown
FIGURE 12.--Comparison of present (1986) and historical nitrate concentration in water from selected wells.
C I I I M I I M I I I I I I I I I I
1970 1980 1990
44

6 MILES
6 KILOMETERS EXPLANATION
UNCONSOLJDATED DEPOSITS
PARTLY CONSOLIDATED DEPOSITS
CONSOLIDATED ROCKS
CONTACT
- - FAULT
------ BOUNDARY OF UPPER CONFININGLAYER
BOUNDARY OF STUDY AREA
GROUND-WATER BARRIER
FORMER SWAMPLAND
4 c /quf 1 ut GRAPH AND WELL NUMBER-- 15|MMiiiM|Mii| Shows nitrate-nitrogen
concentration (vertical axis), in milligrams per liter, as a function of calendar year (horizontal axis)
1975 1985
1975
Geology modified from Dibblee (1963, j_ 1968) and Dutcher and Garrett (1963)
1985
45
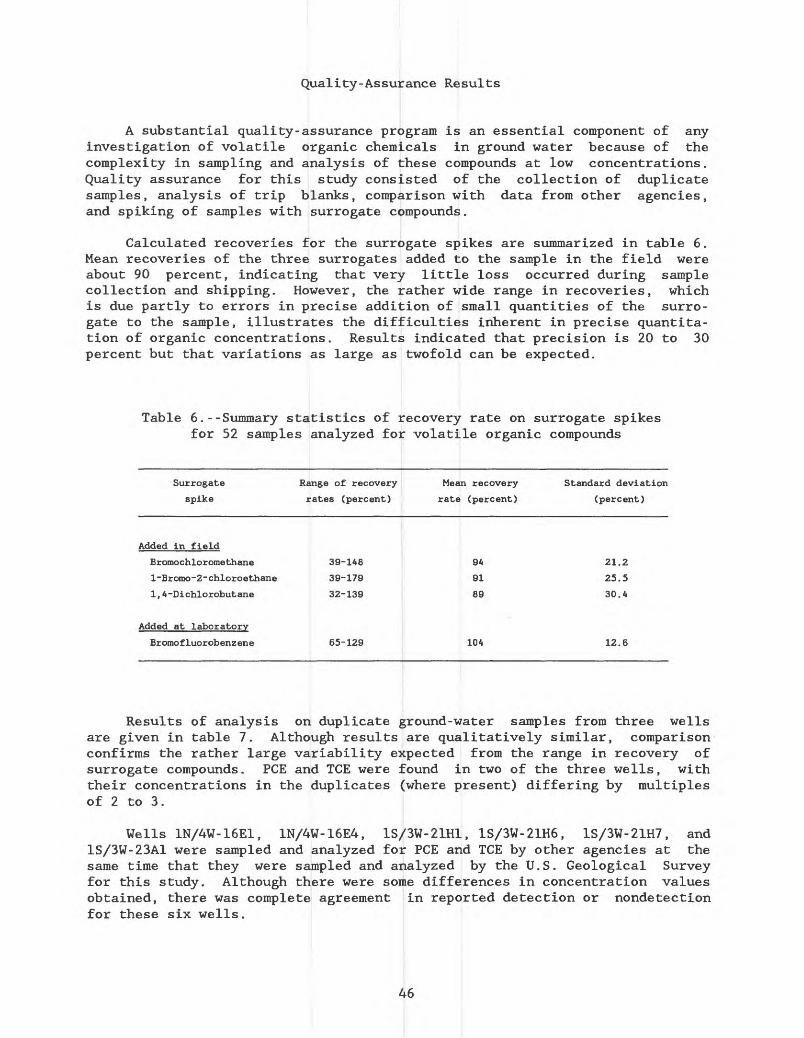
Quality-Assurance Results
A substantial quality-assurance program is an essential component of any investigation of volatile organic chemicals in ground water because of the complexity in sampling and analysis of these compounds at low concentrations. Quality assurance for this study consisted of the collection of duplicate samples, analysis of trip blanks, comparison with data from other agencies, and spiking of samples with surrogate compounds.
Calculated recoveries for the surrogate spikes are summarized in table 6. Mean recoveries of the three surrogates added to the sample in the field were about 90 percent, indicating that very little loss occurred during sample collection and shipping. However, the rather wide range in recoveries, which is due partly to errors in precise addition of small quantities of the surro gate to the sample, illustrates the difficulties inherent in precise quantita- tion of organic concentrations. Results indicated that precision is 20 to 30 percent but that variations as large as twofold can be expected.
Table 6.--Summary statistics of recovery rate on surrogate spikes for 52 samples analyzed for volatile organic compounds
Surrogate
spike
Range of recovery
rates (percent)
Mean recovery
rate (percent)
Standard deviation
(percent)
Added in field
Bromochloromethane
l-Bromo-2-chloroethane
1,4-Dichlorobutane
Added at laboratory
Bromofluorobenzene
39-148
39-179
32-139
65-129
94
91
89
104
21.2
25.5
30.4
12.6
Results of analysis on duplicate ground-water samples from three wells are given in table 7. Although results are qualitatively similar, comparison confirms the rather large variability expected from the range in recovery of surrogate compounds. PCE and TCE were found in two of the three wells, with their concentrations in the duplicates (where present) differing by multiples of 2 to 3.
Wells 1N/4W-16E1, 1N/4W-16E4, 1S/3W-21H1, 1S/3W-21H6, 1S/3W-21H7, and 1S/3W-23A1 were sampled and analyzed for PCE and TCE by other agencies at the same time that they were sampled and analyzed by the U.S. Geological Survey for this study. Although there were some differences in concentration values obtained, there was complete agreement in reported detection or nondetection for these six wells.
46

Table 7.--Volatile-organic-compound concentrations in duplicate samples, 1988
[Concentrations are in micrograms per liter; <, actual value is less than shown; ND, not detected; --, no data available]
Compound
(total)
Benzene
Bromoform
Carbon tetrachloride
Chlorobenzene
Chlorodibromomethane
Chloroethane
Chloroform
Dichlorobromome thane
Dichlorodifluoromethane
Ethylbenzene
Methyl bromide
Methyl chloride
Methylene chloride
Tetrachloroethylene
Toluene
Trichloroethylene
Trichlorofluorome thane
Vinyl chloride
1 , 1-Dichloroethylene
1 , 1-Dichloroethane
1,1, 1-Trichloroethane
1,1, 2-Trichloroethane
1,1,2, 2-Tetr achloroethane
1 , 2-Dichlorobenzene
1 , 2-Dichloroethane
1 , 2-Dichloropropane
1 , 3-Dichloropropene
1 , 3-Dichlorobenzene
1 , 2-tr ansdichloroethene
2-Chloroethyl vinyl ether
1 , 4-Dichlorobenzene
trans-1, 3-Dichloropropene
cis-1, 3-Dichloropropene
Well 1N/4W-16E4
ND
ND
ND
ND
ND
ND
4.6
ND
ND
ND
ND
ND
A. 3
220
ND
43.0
ND
ND
ND
9.0
ND
ND
ND
ND
ND
ND
ND
ND
35
ND
ND
ND
ND
ND
Well 1S/3W-9E2
ND
ND ND
ND ND
ND ND
ND ND
ND
ND
ND ND
ND 0.4
ND ND
ND ND
ND ND
7.0 <1.0
600 ND
ND
86.0
ND
ND
ND ND
ND ND
ND
25 ND
ND
ND ND
ND ND
ND
ND ND
ND
ND ND
ND
22 ND
ND ND
ND
ND ND
ND ND
1 ND
ND
ND
ND
I ND
ND
ND
ND
0.9
ND
ND
ND<2.0
ND
ND
ND
ND
ND
ND
ND
ND
ND
ND
ND
ND
ND
ND
ND
ND
ND
ND
ND
ND
Well
ND
ND
ND
ND
ND
ND
0.5
ND
.2
ND
ND
ND
ND
.4
ND
19.0
ND
ND
ND
ND
ND
ND
.5
ND
ND
ND
ND
ND
.4
ND
ND
ND
ND
1S/3W-28H1
0.6
ND
ND
ND
ND
ND
4.3
ND
.5
1.9
ND
ND
100
1.1
9.2
7.5
3.8
ND
.6
.4
.4
ND
2.0
ND
ND
ND
ND
ND
2.9
ND
ND
ND
ND
47
Analysis of five distilled-water trip blanks by the U.S. Geological Survey showed instances of concentrations higher than the detection limit of 0.2 ^g/L, but less than 2 ^g/L, for chloroform, dichlorodifluoromethane, methylene chloride, toluene, 1,1-dichloroethylene, 1,1,1-trichloroethane, 1,2-dichloroethane, and 1,2-dichloropropane. Methylene chloride was detected in four of the five trip blanks, but the other seven compounds were detected only once. These results show that low-level contamination is possible in the field, in transit, or in the laboratory. The high incidence of methylene chloride detection probably can be attributed to its widespread use in the laboratory, which leads to its absorption from the laboratory atmosphere.
Volatile-Organic-Compound Concentrations
Volatile-organic-compound concentrations in 57 samples from 45 wells are included in the supplemental data section at the end of this report. Frequency of detection and highest concentration for these compounds are summarized in table 8. Methylene chloride was the most frequently detected contaminant, but its actual presence in the ground water is questionable, for reasons noted in the preceding section. Its variable detection limit, which ranged from less than 1 ^g/L to less than 30 ^g/L as determined by the laboratory, is a consequence of day-to-day variations in the level of laboratory contamination. Twenty-three other volatile organic compounds were detected in at least one sample; PCE and TCE, detected in about half the samples, were among the more commonly detected contaminants.
Results of PCE analyses on water from 134 wells and TCE analyses on water from 138 wells are shown in figures 13 and 14, respectively. The analyses were done during 1984-86. Eleven wells in the northwest part of the city of San Bernardino had PCE concentrations equal to or greater than the 4-/*g/L action level designated by the State (fig. 13). Twenty-five additional wells throughout the basin had concentrations that exceed the detection limit for PCE but are less than the action level. Eleven wells in northwest San Bernardino and in central Redlands had TCE concentrations equal to or greater than the 5-/*g/L action level (fig. 14). Thirty-eight additional wells throughout the basin had concentrations of TCE that exceed the detection limit. No particular pattern of contamination is apparent, other than in the northwest San Bernardino and central Redlands areas.
48

Table 8.--Frequency of detection, highest concentration, and well having the highest concentration of volatile organic compounds
[/zg/L, micrograms per liter; ND, not detected; --, no datai available]
Compound (Total)
Number of wells Highest in which concentra-
constituent tion was detected detected,
(/*g/L)
Benzene 10Bromoform 3Carbon tetrachloride 9Chlorobenzene 1Chlorodibromomethane 1Chloroe thaneChloroformDichlorobromome thaneDichlorodifluorome thaneEthylbenzeneMethyl bromideMethyl chlorideMethylene chloride 1TetrachloroethyleneToluene
4252
12811
291714
Trichloroethylene 25Trichlorofluoromethane 13Vinyl chloride 01, 1-Dichloroethylene 51 ,1-Dichloroethane 71,1,1-Trichloroethane 61,1,2-Trichloroethane 01,1,2,2-Tetrachloroethane 21 ,2-Dichlorobenzene 01, 2-Dichloroethane1 , 2 - Dichloropropane1 , 3-Dichloropropene1, 3-Dichlorobenzene1,2- transdichloroethene2-Chloroethyl vinyl ether1 , 4 - Dichlorobenzene
4200
2200
trans-1, 3-Dichloropropene 0cis-1, 3-Dichloropropene 0
1.718.13.
i 4 - 413.
| 2.212.11.3.4
: 4.i ., _! 1-2
0.4100.600.
9.286.12.ND3.4
25.23.ND2.
ND3.4.5
NDND35.NDNDNDND
Well in which
highest concentra tion was detected
1N/4W-32D31N/4W-16E11N/4W-16E11N/4W-16E11N/4W-16E11N/4W-32D31N/4W-32D31N/4W-16E11N/4W-27G11N/4W-32D31S/3W-17C31N/4W-8P11S/3W-28H11N/4W-16E41S/3W-28H11N/4W-16E41N/4W-27G1
--1S/3W-23A11N/4W-16E41N/4W-16E1
--1S/3W-28H1
--1N/4W-32D31N/4W-16E1
----
1N/4W-16E1------
1 Significant concentrations of methylene chloride probably are attributable to laboratory contamination.
49
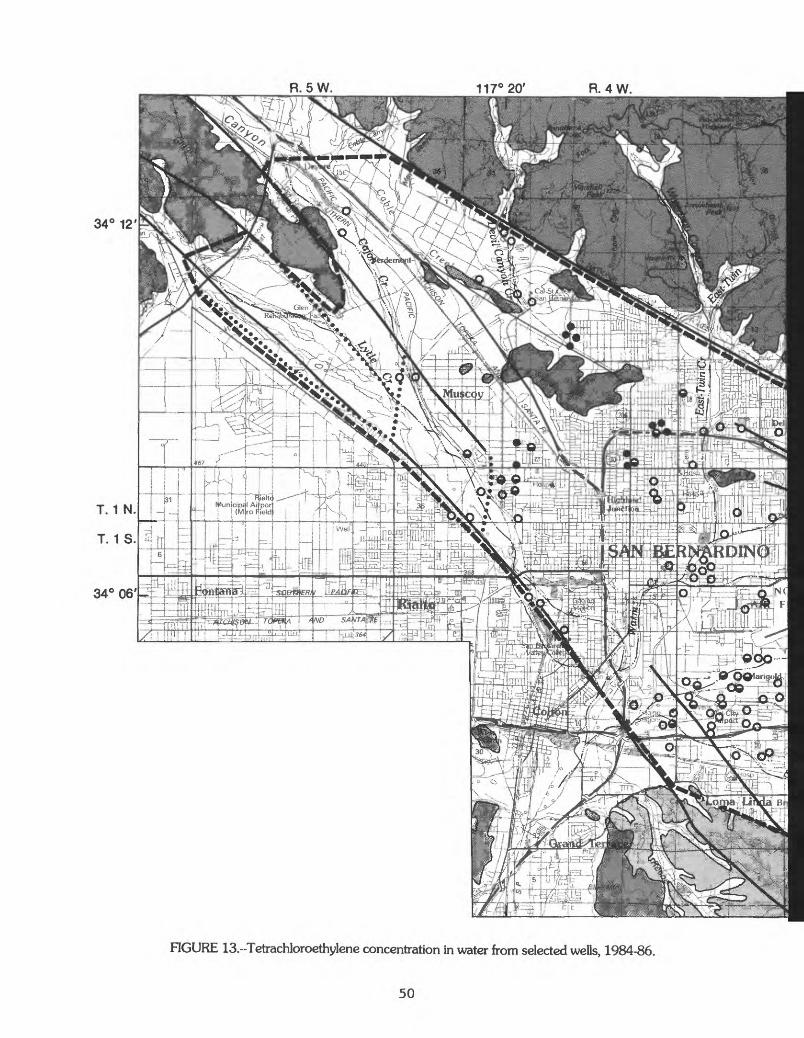
R. 5W. 117° 20' R. 4W.
34° 12'
T. 1 N.
T. 1S.
34° 06
RGURE 13.--Tetrachloroethylene concentration in water from selected wells, 1984-86.
50

1_______I
6 KILOMETERS
6 MILESi
EXPLANATION
UNCONSOLIDATED DEPOSITS
PARTLY CONSOLIDATED DEPOSITS
CONSOLIDATED ROCKS
CONTACT
FAULT
BOUNDARY OF STUDY AREA
GROUND-WATER BARRIER
---Shows range of tetrachloroethyler :entration, in micrograms per liter
Greater than or equal to 4
Less than 4, greater than detection limit
Not detected
.. -^i, . - -JWffX >&Geology modified from Dibblee (1963
- ^Yiri v'frb. ' J-^^i-l«) and Dutcher and Garrett (1963)
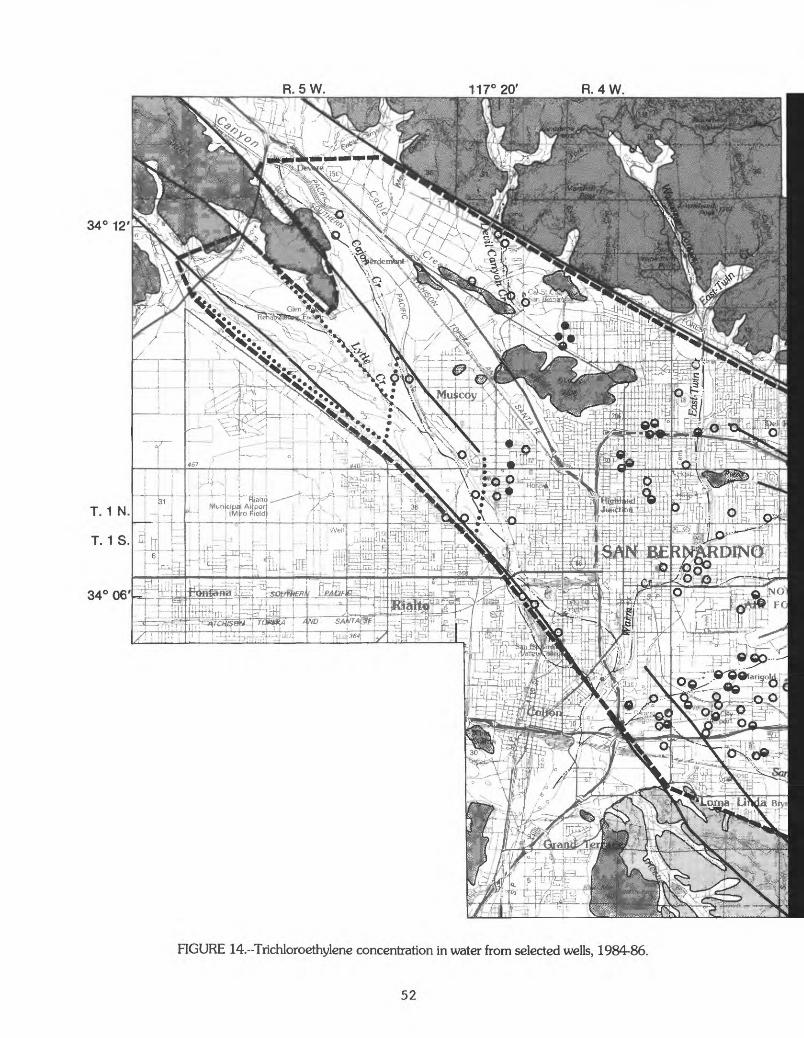
R. 5W. 117° 20' R. 4W.
34° 12'
T. 1 N,
T. 1 s. a
Tr 340 06'^*:- 7 '-UrfP
+_T7gf Trrl
FIGURE 14.--Trichloroethylene concentration in water from selected wells, 1984-86.
52
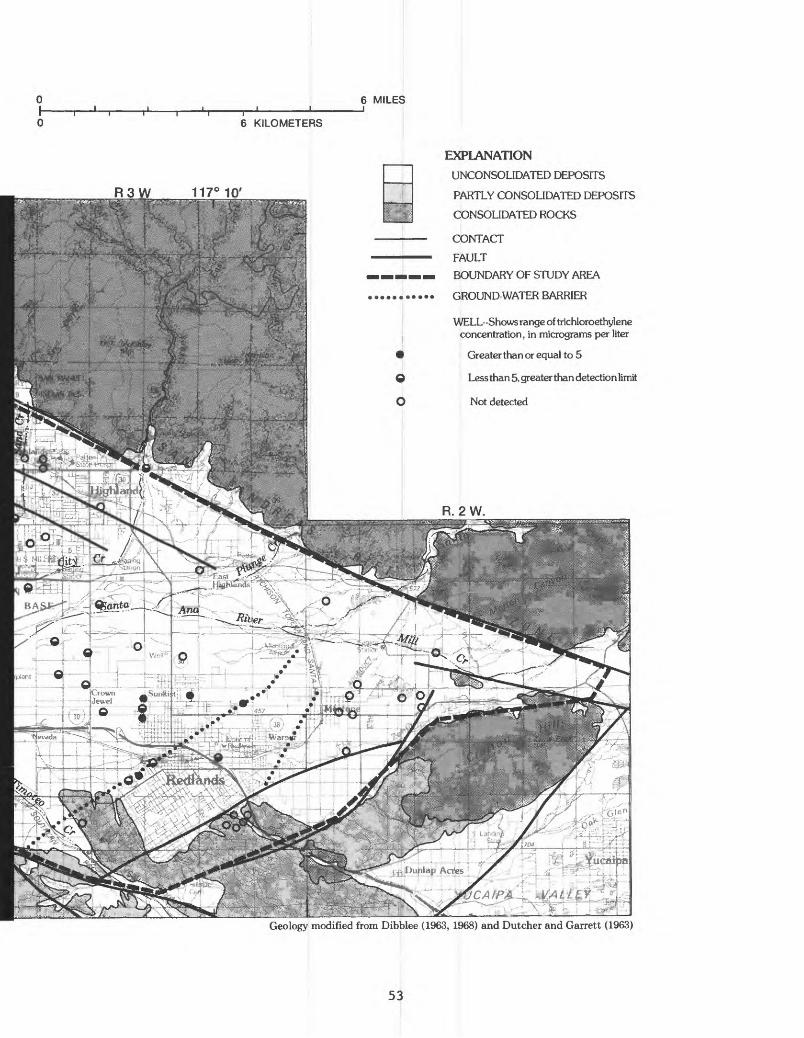
6 MILES
6 KILOMETERS
EXPLANATIONUNCONSOLIDATED DEPOSITS
PARTLY CONSOLIDATED DEPOSITS
CONSOLIDATED ROCKS
CONTACT
FAULT
BOUNDARY OF STUDY AREA
GROUND-WATER BARRIER
WELL-Shows range of trichloroethylene concentration, in micrograms per liter
Greater than or equal to 5
Less than 5, greater than detection limit
Not detected
Geology modified from Dibblee (1963, 1968) and Dutcher and Garrett (1963)
53

Relation to Land Use and Aquifer
The contingency table of frequency-distribution statistical procedure described in a preceding section was used to test for a relation between PCE and TCE concentrations and land use or aquifer (table 4) in ground water from 39 wells sampled by the U.S. Geological Survey. A binary system was used to classify concentration data as either present (greater than detection limit) or not present (less than detection limit). The detection limit was 0.2 /ig/L--except for the samples from eight wells, for which it was 3.0 Mg/L. Of these eight wells, three were resampled and analyzed at the lower limit, three showed the detection of PCE or TCE at the higher limit, and two showed no detection of PCE or TCE at the higher limit. Land use and aquifer open to perforations (sampled) are given in table 4. Results of the statistical test showed no significant correlation between the presence of PCE or TCE and land use or the aquifer sampled. Absence of a correlation with land use is consis tent with the existence of many small point sources. Absence of correlation with the aquifer perforated was not expected and is not easily explained. It suggests that contaminants may reach deeper zones through cross-contamination between aquifers in wells with long perforation intervals or through downward leakage around the well casing as a result of poorly constructed seals. However, it also is possible that the number of adequately characterized wells may be too small to yield a reliable conclusion.
NEED FOR OBSERVATION-WELL NETWORK
On the basis of results of this study and published information from previous studies, a network of observation wells that could be used to monitor changes in ground-water quality of the Bunker Hill basin is described. Location of wells in the network and the basis for their selection are given in table 9. Existing wells were chosen wherever possible because of the cost involved in drilling and installing new wells. In two areas of the basin, however, suitable wells are not known to exist. The 40-acre subdivision (specified by township, range, and section) where these wells could be located is given in table 9.
A total of 11 wells, 9 of which already exist, are in the observation- well network. Wells could be sampled every 6 months, preferably in early autumn after the dry season and in early spring after the wet season, and analyzed for the same constituents that were determined in this study (listed in table 2); sampling for analysis for DBCP could be included. Operation of this network would provide a timely mechanism for monitoring trends in the quality of ground water in the basin. In addition, if the 47 wells sampled for this study were resampled once approximately every 5 years, the results could be used to provide information about any possible adverse changes of the resource and to optimize management of ground water in the basin.
54

Table 9.--Wells and locations for potential ground-water qualityobservation-well network
Well No.or
location
Perforation interval, Description Recnargein feet of aquifer SOUrce
below land perforatedsurface
Reason to monitor
1N/4W-22B 350-400 No confine- Northwest (suggested ment location)
1N/4W-25C2 378-569 No confine ment
1N/4W-34G1 494-572, Lower 577-670
1S/3W-9E2
1S/3W-17C3
211-288, Both 315-320, aquifers 355-385
105-255 Upper
1S/3W-17M 200-250 Upper (suggested location)
1S/3W-18N2 793-988 Lower
1S/4W-11D2 888-951 Lower
1S/4W-13N1 122-299 Upper
1S/4W-22H2 1,008-1,088 Lower
1S/4W-23A5 518-575, Lower 636-700
North and northwest
Northwest
East
East and south
East and south
East
North
East and north
To determine if PCE and TCE are present in the ground water. To detect movement of PCE and TCE from the northwest.
To detect movement of PCE and TCE from the northwest and nitrate-nitrogen from the surrounding areas.
To detect movement of PCE and TCE from the north and northwest. Represents water recharging the lower aquifer.
Represents water from the Santa Ana River recharging the upper and lower aquifers. PCE and TCE previously detected.
To detect movement of PCE, TCE, and nitrate- nitrogen from the southeast.
To determine if PCE and TCE are found in the upper aquifer in this area. To detect movement of PCE and TCE from the east.
To detect movement of PCE, TCE, or nitrate- nitrogen into the lower aquifer from the east.
To detect movement of PCE, TCE, or nitrate- nitrogen into the lower aquifer from the north.
To detect changes occurring to the upper aquifer.
Northeast To detect changes occurring to the deeperand north part of the lower aquifer.
East and To detect changes occurring to the uppernorth part of the lower aquifer.
SUMMARY AND CONCLUSIONS
Land use in the 120-square-mile Bunker Hill basin is rapidly changing from agriculture to urban, and ground-water-quality problems have become an important concern to the residents and to water-supply agencies. Nitrate and purgeable (volatile) organic priority pollutants are contaminants that have been detected previously in the basin's ground water. To address this con cern, 47 wells were sampled for this study, and samples of water from 46 of the wells were analyzed for major inorganic ions, samples from all 47 wells were analyzed for nitrogen species, and samples from 45 were analyzed for volatile organic compounds. Nitrate, PCE, and TCE data collected by other agencies from additional wells were used to supplement the data obtained in this study.
55

The inorganic quality of ground water in the basin generally is suitable for most uses. The water generally is of a sodium calcium bicarbonate type, containing about equal amounts (on an equivalents basis) of sodium and calcium in water near the surface and an increasing predominance of sodium in water of the lower aquifer. Mean dissolved-solids concentration was about 400 mg/L in the upper aquifer and about 200 mg/L in the lower aquifer in the central part of the basin where the lower aquifer is confined. Fluoride concentrations that exceed California's public drinking-water standard of 1.4 mg/L were detected in water from five wells; the maximum concentration that was measured is 3 mg/L.
Nitrate as nitrogen (NC^-N) concentration equaled or exceeded the public drinking-water standard of 10 mg/L in water from 13 of 47 wells sampled for this study, and in an additional 19 of 120 wells when wells sampled by other agencies since 1984 are included. No correlation between constituent concentration and land use was apparent; however, concentrations generally decreased with increasing depth below land surface. In the central part of the basin where the lower aquifer is confined, mean N03-N concentration was 14 mg/L in the upper aquifer and 3.2 mg/L in the lower aquifer. No basinwide trend was discerned from a comparison between current and historical nitrate concentrations (dating back as far as 1955) in water from 17 wells.
Twenty-four of the 33 purgeable organic priority pollutants were detected (detection limit of 0.2 or 3.0 Mg/L) in the water from at least 1 of the 45 wells sampled. California has established interim standards (action levels) of 4 Mg/L for PCE and 5 Mg/L for TCE. PCE and TCE, which are two of the most commonly found organic contaminants in the Bunker Hill basin ground-water system, were detected in water from 20 (for PCE) and 32 (for TCE) of the 45 wells sampled during this study. Water-quality results obtained in this study, in combination with those obtained by other agencies, indicate that PCE concentration exceeded the California interim standard in water from 36 of 134 wells, and TCE concentration exceeded the California interim standard in water from 49 of 138 wells. No obvious basinwide pattern of contamination by these two chemicals was apparent, other than their relatively common occurrence in concentrations higher than the California interim standard in the northwest San Bernardino and central Redlands areas.
Water-quality results obtained in this study and published information from other studies were used to describe a potential ground-water-quality observation-well network. The network consists of 11 wells that could be sampled every 6 months. In addition, 47 of the wells sampled in this study could be resampled every 5 years. The water-quality information obtained from the network could be used to determine trends and to identify changes in ground-water quality in the Bunker Hill basin.
REFERENCES CITED
Brown, D.M., Skougstad, M.W. , and Fishman, M.J., 1970, Methods for collection and analysis of water samples for dissolved minerals and gases: U.S. Geological Survey Techniques of Water-Resources Investigations, Book 5, Chapter Al, 160 p. (superseded by Skougstad and others, 1979).
56

Burnham, W.L., and Dutcher, L.C., I960, Geology and ground-water hydrology of the Redlands-Beaumont area, California, with special reference to ground-water outflow: U.S. Geological Survey Open-File Report, 352 p.
California Department of Health, 1977, California domestic water quality and monitoring regulations [Excerpts from the California Health and Safety Code and the California Administrative Code, Title 22], 23 p.
California Department of Water Resources, 1985, Upper Santa Ana River drainage area land-use survey, 1984: Southern District, 19 p.
Conover, W.J., 1980, Practical nonparametric statistics, 2d edition: New York, John Wiley, 493 p.
Dibblee, T.W., Jr., 1963, Geologic map of the San Bernardino quadrangle: U.S. Geological Survey Open-File Map, scale 1:62,500.
----- 1968, Geologic map of the Redlands quadrangle: U.S. Geological SurveyOpen-File Map, scale 1:62,500.
Dutcher, L.C., and Garrett, A.A., 1963, Geologic and hydrologic features ofthe San Bernardino area, California, with special reference to underflowacross the San Jacinto fault: U.S. Geological Survey Water-Supply Paper1419, 114 p.
Eccles, L.A., 1979, Ground-water quality in the upper Santa Ana River basin,southern California: U.S. Geological Survey Water-Resources Investiga tions Report 79-113, 51 p.
Eccles, L.A., and Bradford, W.L., 1977, Distribution of nitrate in groundwater, Redlands, California: U.S. Geological Survey Water-ResourcesInvestigations Report 76-117, 38 p.
Eccles, L.A., and Klein, J.M., 1978, Distribution of dissolved nitrate andfluoride in ground water, Highland-East Highlands, San Bernardino County,California: U.S. Geological Survey Water-Resources Investigations Report78-14, 42 p.
Hardt, W.F., and Freckleton, J.R., 1987, Aquifer response to recharge andpumping, San Bernardino ground-water basin, California: U.S. GeologicalSurvey Water-Resources Investigations Report 86-4140, 69 p.
Hardt, W.F., and Hutchinson, C.B., 1980, Development and use of a mathematicalmodel of the San Bernardino Valley ground-water basin, California: U.S.Geological Survey Open-File Report 80-576, 80 p.
Helsel, D.R., and Ragone, S.E., 1984, Evaluation of regional ground-waterquality in relation to land use: U.S. Geological Survey Water-ResourcesInvestigations Report 84-4217, 33 p.
Klein, J.M., and Bradford, W.L., 1979, Distribution of nitrate and relatednitrogen species in the unsaturated zone, Redlands and vicinity, SanBernardino County, California: U.S. Geological Survey Water-ResourcesInvestigations Report 79-60, 81 p.
----- 1980, Distribution of nitrate in the unsaturated zone, Highland-East Highlands area, San Bernardino County, California: U.S. Geological Survey Water-Resources Investigations Report 80-48, 70 p.
Skougstad, M.W., Fishman, M.J., Friedman, L.C., Erdmann, D.E., and Duncan, S.S., 1979, Methods for determination of inorganic substances in water and fluvial sediments: U.S. Geological Survey Techniques of Water-Resources Investigations, Book 5, Chapter Al, 626 p.
URS Corporation, 1986, Investigation of sources of TCE and PCE contamination in the Bunker Hill ground water basin: submitted to California Regional Water Quality Control Board, Santa Ana Region, 108 p.
57

SUPP
LEME
NTAL
DATA:
PHYSICAL AND
CHEMICAL DA
TA FOR
WELLS
[Complete
analys
es d
ispl
ayed
on
one
line
on
six
cons
ecut
ive
pages.
MS/c
m, mi
cros
ieme
ns p
er c
entimeter
at 2
5 °C;
°C,
degr
ees
Cels
ius;
mg/L
, milligrams
per liter; jtg/L, mi
crog
rams
per
liter; <,
actual value
less t
han value
shown; --
, no
data
avai
labl
e]
Stat
e we
ll
No.
001N
003U
27N0
2S00
1N003U29M01S
001N003U29N01S
001N
003U
30J0
5S00
1N00
3U31
Q02S
001N
004U
08P0
1S00
1N00
4U16
E01S
001N
004U
16E0
4S
001N
004U
25A0
1S00
1N004U25C02S
u,
001N004U26E02S
00
001N
004U
27G0
1S00
1N00
4U32
D03S
001N
004U
34G0
1S
001S
002U
16F0
1S
001S
002U
18R0
1S00
1S002U30B02S
001S
003U
01H0
1S00
1S00
3U03
R01S
001S003U06H04S
001S003U09E02S
001S003U15G01S
001S003U16A01S
001S003U17C03S
Dept
h of
well
, to
tal
(fee
t)
150.00
408.
0040
9.00
820.
00201.00
201.00
201.00
201.
00201.00
380.
0041
5.00
441.
0044
1.00
551.
0060
6.00
689.
0068
9.00
502.
0068
5.00
700.
0070
0.00
160.00
160.00
160.00
160.00
401.
0025
0.00
414.
0057
5.00
575.
0042
1.00
401.
0040
1.00
401.
0040
1.00
354.
0035
4.00
418.
0041
8.00
296.
00296.00
296.00
Depth
to b
ot
tom
of
samp
le
inte
r
val
(feet) 128
396
382
798
185
185
185
185
185
351
406
404
404
546
569
660
660
502
658
670
670
147
147
147
147
390
228
414
559
559
415
385
385
385
385
338
338
395
395
255
255
255
Dept
h to to
p of
samp
le
inte
r
val
(fee
t) 56 238
235
485 90 90 90 90 90 186
186
300
300
188
378
320
320
390
150
494
494 90 90 90 90 187
120
250 23 23 173
211
211
211
211
152
152
105
105
105
105
105
Alti
tude
of land
surface
datu
m (feet
abov
e sea
leve
l)
1,49
11,345
1,29
11,
340
1,12
01,
120
1,12
01,
120
1,12
01,
477
1,41
21,
413
1,41
31,
296
1,24
61,236
1,23
61,
227
1,23
11,
142
1,14
22,
071
2,07
12,
071
2,07
11,
763
1,70
61,541
1,30
21,
302
1,14
01,190
1,19
01,190
1,19
01,
300
1,300
1,29
31,
293
1,17
61,176
1,176
Date
05-13-86
08-05-86
05-13-86
08-0
6-86
05-01-86
05-07-86
08-0
7-86
08-0
7-86
08-0
7-86
05-1
4-86
05-1
4-86
05-1
4-86
05-1
4-86
08-06-86
08-0
6-86
05-1
4-86
08-06-86
08-07-86
05-14-86
05-14-86
08-06-86
05-01-86
05-01-86
05-0
1-86
05-0
6-86
05-0
1-86
05-06-86
04-2
9-86
04-2
9-86
05-0
6-86
08-0
6-86
04-3
0-86
05-06-86
08-0
7-86
08-0
7-86
04-2
9-86
05-0
6-86
04-3
0-86
05-1
6-86
04-29-86
05-0
6-86
08-0
7-86
Spe
cifi
c co
n
duct
ance
(jiS
/cm)
641
442
566
618
834
850
845 -- --
399
661
768 --
700
660
508
516
590
505
562
566
554 -- --
430
259
614
244
332
310
358
249
260
270 -- 281
277
238
240
647
655
600
PH
(stand
ard
units)
7.40
8.10
7.50
8.00
7.80 --
8.30 -- --
7.90
7.60
7.65 --
7.50
7.60
7.50
7.80
8.20
8.20
7.80
7.90
7.70 -- -- --
7.80
8.00
7.40
7.15 --
7.60
7.90 --
8.00 --
7.60 --
7.55 --
7.40 --
7.80
Temper
atur
e (°
C) 20.0
18.5
25.0
24.0
25.0 --
26.0 -- --
17.5
17.5
18.5 --
21.0
22.5
15.5
17.5
19.5
18.0
19.0
19.5
17.0 -- -- --
15.5 --
15.5
19.0 --
20.0
17.5 --
17.5 --
18.5 --
17.5 --
20.0 --
21.5
Hard
ness
(mg/L
as
CaCOj)
200
160
160 70 170 -- -- -- -- 170
320
390 -- 180
170
130
160
280
220
240 --
250 -- -- -- 120
260 74 120 -- 140 98 -- -- -- 110 -- 91 --
210 -- 170
Hardness
nonc
arb.
, to
tal
field
(mg/L
as
CaCOj) 44 0 43 0 0 -- -- -- -- 31 54 53 -- 32 25 13 16 72 27 78 -- 64 -- -- -- 4 76 0 14 -- 28 3 -- -- -- 12 -- 0 -- 30 -- 0
Calc
ium,
dis
solv
ed
(mg/L
as Ca) 57 42 45 19 56 -- -- -- -- 52 99 120 -- 50 49 35 44 86 65 75 -- 79 -- -- -- 36 71 22 37 -- 43 30 -- -- -- 34 -- 28 -- 63 -- 52

SUPPLEMENTAL DA
TA:
PHYS
ICAL
AND
CHEMICAL DA
TA FO
R WE
LLS-
-Con
tinu
ed
Ln
Stat
e well
No.
001N003U27N02S
001N
003U
29M0
1S00
1N00
3U29
N01S
001N003U30J05S
001N
003U
31Q0
2S
001N004U08P01S
001N004U16E01S
001N004U16E04S
001N
004W
25A0
1S00
1N00
4U25
C02S
001N
004U
26E0
2S
001N004W27G01S
001N004U32D03S
001N
004U
34G0
1S
001S002U16F01S
001S
002U
18R0
1S00
1S002U30B02S
001S003U01H01S
001S003U03R01S
001S003U06H04S
001S
003U
09E0
2S
001S003U15G01S
001S003U16A01S
001S003U17C03S
See
foot
note
s at
Magn
e
sium
, di
s
solved
(mg/
L as M
g)
14 13 12 5.5
7.9 --
10 18 22 13 12 9.9
12 16 13 13--
13 6.7
20 4.7
7.0
7.1
5.5 --
6.3
5.2
12 9.5
end
of t
able.
Sodi
um,
dis
solved
(mg/L
as N
a)
50 33 48 94 110 -- 13 17 19 68 70 53 42 13 15 12 -- 13 6.5
22 18 20 19 14 -- 12 14 59 54
Percent
sodium 35 31 39 74 58 -- 14 10 9 45 47 47 36 9 13 10 -- 10 10 15 34 26 23 23 -- 19 25 38 40
Sodi
um
adso
rp
tion
ratio
2 1 2 5 4
-- 0.5 .4 .4
2 2 2 2.4 .5 .4 -- .4 .3 .6 .9 .8 .7 .6 -- .5 .7
2 2
Pota
s
sium
, di
s
solved
(mg/L
as K
)
2.4
1.3
1.6
1.4
2.1 --
2.5
3.7
3.7
1.0
2.0
2.6
2.3
3.7
3.0
3.4 --
2.3
2.6
1.7
1.6
1.9
2.3
2.2 --
2.4
1.9
5.1
5.5
Alka
lini
ty,
total
fiel
d (mg/L
as
156
160
119
114
175
207
140
267
337
146
147
115
143
209
189
163
178
187
1113 184
180
1107 109 95 94 199 -- 177
209
Carb
on
diox
ide,
di
s
solv
ed
(mg/
L as C02>
12 2.4
7.3
2.2
5.4
2.0
3.4
13 15 8.9
7.1
7.0
4.4
2.5
2.3
5.0
4.3
7.2
3.5
3.5
0 15 5.3
2.3
1.8
4.8
5.1
14 6.4
Sulfate,
dis
solv
ed
(mg/L
as $
04)
81 35 76 130 97 -- 30 35 34 120
120 88 74 45 55 45 -- 51 14 57 12 19 31 13 -- 17 14 57 42
Chlo
ride,
dis
solved
(mg/L
as C
l)
31 14 23 26 30
--
8.7
8.4
8.9
24 22 29 21 15 8.0
36--
9.5
4.0
11 9.1
11 12 6.9 --
10 7.0
31 18
Fluo
- ri
de,
dis
so
lved
(m
g/L
as F) 1.2
1.3
1.1
3.0 .7 -- .3 .3 .3
2.0
1.5
1.1 .7 .4 .5 .4 -- .6 .9 .5 .4 .3 .4 .3 -- .4 .4 .5 .5
Silica,
dis
solved
(mg/L
as
Si02
)
32 32 29 24 24 -- 23 25 26 35 34 32 31 25 19 23 -- 20 16 30 24 31 28 25 -- 20 26 24 25

SUPP
LEME
NTAL
DA
TA:
PHYSICAL AND
CHEM
ICAL
DAT
A FOR
WELLS--Continued
Stat
e we
ll
No.
001N
003W
27N0
2S00
1N00
3W29
M01S
001N
003W
29N0
1S001 N003W30 JOSS
001N
003W
31Q0
2S
001N
004W
08P0
1S00
1N00
4W16
E01S
001N004W16E04S
001N004U25A01S
001N
004U
25C0
2S00
1N004W26E02S
001N004W27601S
001N004W32D03
001N004W34G01S
001S002W16F01S
001S002W18R01S
001S
002U
30B0
2S00
1S00
3W01
H01S
001S003W03R01S
001S
003W
06H0
4S001S003W09E02S
001S003W15G01S
001S
003W
16A0
1S
001S
003U
17C0
3S
Solids,
sum
of
consti
tuents,
dis
so
lved
(mg/L)
360
270
310
370
430 .. -- --
220
370
440
400
400
320
310
330
290
310
300 -- -- 150
320
140
190 --
210
150
160
150
360
330
Nitr
o
gen,
N02+
N03,
di
s
solv
ed
(mg/L
as N) 8.10
3.60
10.0 0.28
23.0
21.0
22.0
22.0 3.20
4.00
4.90
10.0 7.10
1.40
2.40
8.50
3.20
4.60
5.70
5.80
5.70 .39
12.0
14.0 6.20 --
7.60
2.50 -- .87
.84
11.0 8.10
Nitro
gen,
ammonia,
dis
solved
(mg/L
as N) 0.02 .03
<.01 .03
.07 __ -- --
<.01
<.01 .05
.02
.03
.01
.03
.03
.02
.01
.05
.04
.05
.02
.01
.02
.02 -- .04
.04 -- .06
.02
.01
.04
Nitro
gen, am
monia
+ or
gani
c,
dis.
(mg/L
as N
) 0.3 .6 .3
<.2 .4 .. -- -- .2 .3 .4 <.2
<.2 .4 .2 .8 .4 .3 .3 .6 .5 .3 .4 .5 .6 -- .5 .6 . . .6 .3 .4 .5
Phos
phorus,
dis
solv
ed
(mg/
L as P
)
0.04 .04
.05
.03
.04 .. -- -- .02
.02
.02
.05
.03
.03
.02
.02
<.01 .01
<.oi !oi .01
.01
.03
.01
.01 -- .02
.04
.02
.02
<.oi .02
Phos
ph
orus
, ortho,
dis
solv
ed
(mg/
L as
P)
0.04 .03
.03
.03
.01 .. -- -- .02
.02
.03
.05
.03
.03
.02
.02
<.01 .02
<.oi
<.01
<.01
<.oi .03
.01
.01 -- .02
.02
-- .03
<.oi
<.oi .01
Boro
n,
dis
solv
ed
as B
)
140
140
110
580
110 .. -- -- 20 30 40 560
600
380
280 30 50 30 20 -- -- 30 30 40 30 -- 80 60 -- 20 40 350
350
Iron,
dis
solved
as F
e) 7 15 37 18 8 .. -- -- 65 10 7 16 26 6 4 10 7 7 5 -- -- 13 10 18 6 -- 10 4
. 8 82 15 22
Mang
a
nese
, di
s
solv
ed
as M
n) <1 2 <1 4 <1 .. -- -- <1 <1 <1 2 12 <1 <1 2 <1 <1 <i -- -- i 12 <1 <1 -- 2 <1 ^ _ ;; 2 7 4
Benz
ene,
total 0.2
<.2
<.2
<.2 -- __ -- -- <.2
<3.0
<3.0 <.l
<.2 .3 <.2
<.2
1.7 .2 <m.. -- --
<s!o <.2 -- -- .2 <.2 -- .3 ":? --
<3.'
o <;2See
footnotes
at e
nd o
f ta
ble.

SUPPLEMENTAL DATA:
PHYSICAL AND
CHEMICAL DATA FOR
WELL
S--C
onti
nued
Carbon-
Chloro-
tetra-
di-
Brom
o-
chlo
- Chloro-
bromo-
Stat
e fo
rm,
ride,
benz
ene,
methane,
well
to
tal
total
tota
l to
tal
No.
(M9/
L)
(M9/L)
(M9/
L)
<M9/L)
001N
003W
27N0
2S
<0.2
<0.2
<0.2
<0
.200
1N00
3W29
M01S
<.
2 <.
2 <.
2 <.
2001N003W29N01S
<.2
<.2
<.2
<.2
001 N003W30 JO
SS
<.2
<-2
<.2
<.2
001N
003W
31Q0
2S<.
2 .3
<.2
<-2
001N
004W
08P0
1S
<.2
<.2
<.2
<.2
001N004W16E01S
18
13
4.4
13001N004U16E04S
<3.0
<3.0
<3.0
<3.0
001N004W25A01S
<!2
<\2
<\2
<.2
001N004W25C02S
<.2
<-2
<-2
<-2
001N004W26E02S
<.2
<.2
<.2
<-2
<.2
<.2
<.2
<.2
001N004W27G01S
<.2
.8
<.2
<.2
001N004W32D03
<.2
3.1
<.2
<.2
001N
004W
34G0
1S
<.2
<.2
<.2
<.2
001S002W16F01S
--
--
--
-
,;
<;
<;
<; 00
1S00
2W18
R01S
<s
!o
<s!o
<s!o
<s!o
001S
002W
30B0
2S
<.2
<.2
<.2
<.2
001S
003W
01H0
1S00
1S00
3W03
R01S
<.2
<.2
<.2
<.2
001S
003W
06H0
4S
<.2
<.2
<.2
<.2
001S003W09E02S
<.2
1.1
<.2
<-2
<.2
<.2
<.2
<.2
<.2
<.2
<.2
<-2
001S003W15G01S
<.2
<.2
<.2
<.2
001S
003W
16A0
1S
001S
003W
17C0
3S
<s!o
<s!o
<s!o
<3.0
<-2
<.2
<.2
<.2
<.2
<.2
<.2
Chloro-
ethane,
tota
l (M9/D
<0.2 <.2
<.2
<.2 -- ":2 <\2
<3.0
<3.0 <^2
<.2
<.2
<.2
<.2
2.2
<.2 -- .3
<3.0 .3 -- -- .2
<.2 -- <.2
<.2
<.2 -- <.2 --
<s!o <.2
<.2
Di-
chloro-
Chloro-
brom
o-
form,
meth
ane,
to
tal
total
(M9/
I-)
(M9/
L)
2.2
<0.2
<0.2
<.2
.4
<.2
<.2
<.2
._ .2
<.2
<!2
<^2
8.2
114.
6 <3.0
<.2
<2<.2
<.2
<.2
.4
<-2
.3
<.2
.7
<.2
12
<.2
.5
<.2
-- .5
<.2
<3.0
<3.0
.6
<.2
._ .. .4
<.2
<.2
<.2
._2.0
<.2
<.2
<.2
<.2
<.2
.. .4
<.2
--
<s!o
<3
.0<.
2 <.
2.2
<.2
Di-
chloro-
di-
f lu
oro-
methane,
total
(M9/L) <0.2 .7<.2
<.2 -- ":2 <^2
<3.0
<3.0 <;2 <.2
<.2
<.2
3.4
<.2
<.2 -- <!2
<s!o <.2 -- -- <.2 .7 -- <.2 .4 .9 -- <.2 --
<3.0 <.2 .3
Ethyl-
Meth
yl
benzene,
brom
ide,
total
total
(M9/D
(M9/D
<0.2
<0.2
<.2
<.2
<.2
<.2
<.2
<.2
.. ":2
<:?
<^2
<!2
3.2
<3.0
<3.0
<3.0
<;2
<;2<.
2 <.
2<.
2 <.
2.5
<.
2<.
2 <.
24.0
<.2
<-2
<.2
-- <!2
<^2
<s!o
<s!o
<.2
<.2
.. .. <.2
<.2
<.2
<.2
.. .6
<.2
<.2
<.2
<.2
<.2
-- <.2
<.2
--
<s!o
<s!o
<.2
1.2
<.2
<.2
See
foot
note
s at
end
of
tabl
e.

SUPPLEMENTAL DATA:
PHYS
ICAL
AND
CHEMICAL DA
TA FOR
WELLS--Continued
State
well No.
001N
003W
27N0
2S00
1N00
3W29
M01S
001N
003W
29N0
1S00
1N00
3W30
J05S
001N
003W
31Q0
2S
001N
004W
08P0
1S00
1N00
4W16
E01S
001N
004W
16E0
4S
001N
004W
25A0
1S00
1N00
4W25
C02S
001N
004W
26E0
2S
001N
004W
27G0
1S00
1N00
4W32
D03
001N
004U
34G0
1S
Methyl
chlo
rid
e.to
tal
(P9/
D
<0.2 <.2
<.2 -- <m2. .4
<3.0
<3.0 <.2
<.2
<.2
<.2
<.2
<.2
<.2
<.2
<.2
Meth
yl-
ene
chlo
ride
.to
tal
(M9/
L) <0.2
2<2.0
<.2
2<20
-- <:2. 2<;5 sis
4.3
7.0
2<16 2<2.0
1.7
2<30 3.
749 <-
22<
4.0
Tetra-
chloro-
ethy
l-ene.
tota
l(/tg/L)
<0.2 <.2
<-2
<.2 -- ':? <~.~2
150
220
600 <.
2<.
2<.
2 .73.
61.1 .4
Tolu
ene,
tota
l(/tg/D <0.2 <.2
<.2
<.2 -- *:?
<^2
4^1
<3.0 <.2
<.2
<.2 .3 1.1 .2
8.8 .2 .3
Tri-
chloro-
ethy
l-en
e.to
tal
(Mg/D 0.2
<.2
<.2
<.2 -- .2
<^2
33!o
43.0
86.0 <.2 .3 .5
2.4
11.0 2.3 .6
Tri-
chlo
ro-
fluo
ro-
meth
ane,
tota
l(Mg/D
<0.2 .2<.2 !s -- *:? <^2
<3.0
<3.0 <.2 .2
<.2
<.2
2.9
12 <.2
<.2
<-2
1,1-Di-
Vinyl
chloro-
chlo-
ethy
l-ride,
ene.
tota
l total
(M9/
D (M
g/D
<0.2
<0
.2<.
2 <.
2<-2
<.2
<.2
<.2
-- ^?
<:2.
<2
^2
<s!o
<s
!o<3
.0
<3.0
<.2
<.2
<.2
<.2
<.2
<.2
<.2
<.2
<.2
<.2
<.2
<.2
.4<.
2 <.2
<.2
<.2
1,1-
Di-
chlo
ro-
etha
ne.
tota
l(M
g/D
<0.2 <.2
<.2
<.2 -- "*:? <^2
s!s
9.0
25 <.2
<.2
<.2
<.2 .2 .3
<.2
<.2
1.1.1-
Tri-
chloro-
ethane.
tota
l(Mg/D
<0.2 <.2
<-2
<.2 -- *:? ,; 23 <3
.0 -- <.2
<.2
<.2
<.2
<.2 .8 .2
<.2
001S
002W
16F0
1S
001S
002W
18R0
1S
001S
002W
30B0
2S
001S
003W
01H0
1S
001S
003W
03R0
1S
001S
003W
06H0
4S
001S
003W
09E0
2S
001S
003W
15G0
1S
001S
003W
16A0
1S
001S
003W
17C0
3S
<3.0
<3.0
2<18 18 2<
1.0
2<2.
0
2<.5
<
3.0
-<2.0
<3.
0
K8
1.0
<3.0
.4
<3.
0 \2
1.6
<3.0
<3.
0 .4
3.0
<3.
0 1
.2
<3.0 .7
<3.0
<3.0
<3.0
<3.
0
<3.0
<3.0
<3.0
.2
<3.
0 1
.4<
3.0 .3
See
footnotes
at e
nd o
f ta
ble.

SUPPLEMENTAL DATA:
PHYSICAL AND
CHEMICAL DA
TA FOR
WELL
S--C
onti
nued
State
well No.
001N003W27N02S
001N003W29M01S
001N
003W
29N0
1S001 N003W30 JO
SS00
1N00
3W31
Q02S
1,1,
2-Tri-
chloro-
ethane,
total
(M9/L) <0.2 <.2
<.2
<.2 --
1,1,
2,2
Tetra-
chloro-
etha
ne,
total
(M9/D
<0.2 <.2
<.2
<-2 --
1,2-Di-
chlo
ro-
benz
ene,
total
(M9/D
<0.2 <.2
<.2
<-2 --
1,2-
Di-
chloro-
etha
ne,
tota
l(M9/D
<0.2 <-2
<.2
<.2 --
1,2-Di-
chloro-
prop
ane,
tota
l(M9/D
<0.2 <.2
<.2
<.2 --
1,3-Di-
chlo
ro-
prop
ene,
tota
l(M9/D
<0.2 <.2
<.2
<.2 --
1,3-
Di-
chlo
ro-
benz
ene,
tota
l(M9/D
<0.2 <.2
<.2
<.2 --
1,2-
tran
s-di
chlo
ro-
ethe
ne,
total
(M9/D
<0.2 .2 <.2 .2 --
2-Chloro-
ethyl
vinyl
ether,
total
(M9/D
<0.2 <.2
<-2
<-2 --
1,4-
Di-
chloro-
benzene,
total
(M9/
D
<0.2 <.2
<.2
<.2 --
trans-
1,3-Di-
chloro-
propene,
tota
l(M
9/D
<0.2 <.2
<.2
<.2 --
cis-
1,3-Di-
chloro-
propene.
total
(M9/D
<0.2 <.2
<.2
<.2 --
001N004W08P01S
001N
004W
16E0
1S
001N004W16E04S
001N004W25A01S
001N004W25C02S
001N
004W
26E0
2S
001N004W27G01S
001N004W32D03
001N
004W
34G0
1S
001S
002W
16F0
1S
<3.0
<3.0
<3.0
<3.0 .7
<3.0
<3.0
.3<3.0
<3.0 .2
3.0
4.5
<3.0
<3.0
<3.0
<3.0
<3
.032 35 22
.2 .2 ".5
1.8
7.6 .3
<3.0
<3.0
<3.0
<3.0
<3.0
<3.0
<3.0
<3.0
001S
002U
18R0
1S
001S
002U
30B0
2S
001S
003U
01H0
1S
001S003W03R01S
001S
003W
06H0
4S
001S
003U
09E0
2S
<3.0
<3.0
<3.0
<3.0
<3.0
<3.0
<3.0
<3.0 .8
<3.0
<3.0
<3.0
<3.0
001S003W15G01S
001S
003W
16A0
1S
001S
003W
17C0
3S
<3.0
<3.0
<.2
.4
<.2
<3.0
<3.0
<3.0
<3.0
<3.0
<3.0
<3.0
<3.0
<3.0
<3.0
See
foot
note
s at
end
of
table.

SUPP
LEME
NTAL
DA
TA:
PHYSICAL AND
CHEMICAL DATA FO
R WE
LLS-
-Con
tinu
ed
State
well
No.
001S003W17H08S
001S003W17L01S
001S003W17R01S
001S003W18N02S
001S003W21E02S
001S003W21H01S
001S003W21H063
001S003W21H07S
001S003W23A01S
001S003W28H01S
001S003W35H04S
001S004W02K02S
001S004W11D02S
001S
004W
12B0
4S00
1S00
4W13
F02S
001S004W13N01S
001S004W15L03S
001S004W22D03S
001S004W22H02S
001S004W22H03S
001S004W23A05S
001S004W23K02S
001S004W25B05S
See
foot
note
s at
Dept
h of
well,
tota
l (f
eet)
m m --188.00
360.
0098
8.00
988.
0026
4.00
264.
0026
4.00
264.
0026
4.00
426.
0050
0.00
723.
0054
9.00
474.
0047
4.00
474.
0047
4.00
657.
001,408.00
963.
0081
8.00
422.
0032
5.00
325.
0032
5.00
325.
0080
0.00
35.0
035.00
35.00
1,106.00
861.
0070
4.00
704.
0070
4.00
704.
0030
3.00
303.
0030
3.00
303.
0068
2.00
end
of table.
Dept
h to
bot
tom
of
sample
inte
r
val
(fee
t) -- -- -- -- 988
988
250
250
250
250
250 -- 482
700
520
442
442
442
442
645
1,374
951 -- 402
299
299
299
299
770 -- -- --
1,088
645
700
700
700
700
279
279
279
279
642
Dept
h Altitude
to t
op
of la
nd-
of
surf
ace
samp
le
datum
inter-
(feet
val
above
sea
(feet)
level)
_ m -- -- --79
379
3 88 88 88 88 88 --20
048
025
015
015
015
015
0456
,215
,2
15,2
15,189
,216
,107
,107
,240
,240
,240
,240
,240
,318
,320
,319
,490
,308
,308
,308
,308
,580
1,250
1,058
888
1,03
41,
087
216
1,059
122
1,045
122
1,04
512
2 1,045
122
1,04
530
4 995
980
980
980
1,00
8 1,
002
275
1,001
518
1,043
518
1,04
351
8 1,
043
518
1,04
384
1,041
84
1,04
184
1,
041
84
1,05
1498
1,09
5
Date
04-2
9-86
05
-06-
8608
-05-
8608
-07-
8608
-07-
8605-01-86
05-0
1-86
04-2
9-86
05-0
6-86
08-07-86
08-0
7-86
08-0
7-86
06-1
3-86
06-1
3-86
08-2
6-86
08-2
6-86
04-2
9-86
08-0
4-86
08-04-86
08-0
4-86
06-1
3-86
08-06-86
08-05-86
04-3
0-86
08-0
5-86
05-1
2-86
08-05-86
08-0
5-86
08-0
5-86
05-1
2-86
05-0
1-86
05-0
7-86
08-0
7-86
08-0
5-86
08-0
5-86
05-12-86
08-05-86
08-0
5-86
08-0
5-86
05-12-86
08-0
5-86
08-0
5-86
08-0
5-86
08-0
7-86
Spe
ci
fic
con
duct
an
ce
(/iS
/cm)
277
294
285
446
363
330
330
519
528
528 -- --
531
530
382
391
660
680 -- --
623
394
370
259
358
740
760 -- --
447
660
658
764
427
637
422
436 -- --
956
1,02
0 -- --815
pH
(sta
nd
ard
unit
s)
7.60
7.
707.
908.
008.
108.
208.
207.
80 --8.
30 -- --8.
107.
707.
707.
807.
608.
10 -- --7.
908.
308.
107.
808.
107.
907.
80 -- --8.
607.
00 --7.
808.
407.
908.
008.
00 -- --7.
807.
90 -- --8.
10
Temp
er
atur
e 17.5
17.0
17.5
17.5
20.0
21.5
21.5
22.5 --
23.0 -- --
20.0
20.5
19.0
19.0
25.0
24.5 -- --
20.0
24.0
22.5
17.5
18.0
19.0
19.0 -- --
41.0
21.0 --
21.5
28.5
19.0
17.5
17.5 -- --
19.5
20.0 -- --
22.0
Hard
ness
(mg/L
as
CaCOs)
120 -- 190 -- 38 39 210 -- -- -- -- 230
230
170
170
210 -- -- -- 210 89 93 95 130
270 -- -- -- 24 300 -- 360 37 260
170 -- -- -- 360 -- -- -- 250
Hardness
nonc
arb.
, to
tal
field
mg/L
as
CaCO
}) 6 -- 56 -- 0 0 52 -- -- -- -- 68 55 27 28 15 -- -- -- 31 0 0 0 4 82 -- -- -- 0120 -- 150 0 79 45 -- -- -- 110 -- -- -- 4
Calc
ium,
di
s
solved
(mg/L
as C
a) 37 -- 62 -- 14 14 67 -- -- -- -- 73 74 52 53 66 -- -- -- 60 31 32 32 41 88 -- -- -- 9.2 94 -- 110 14 85 56 -- -- -- 95 -- -- -- 73
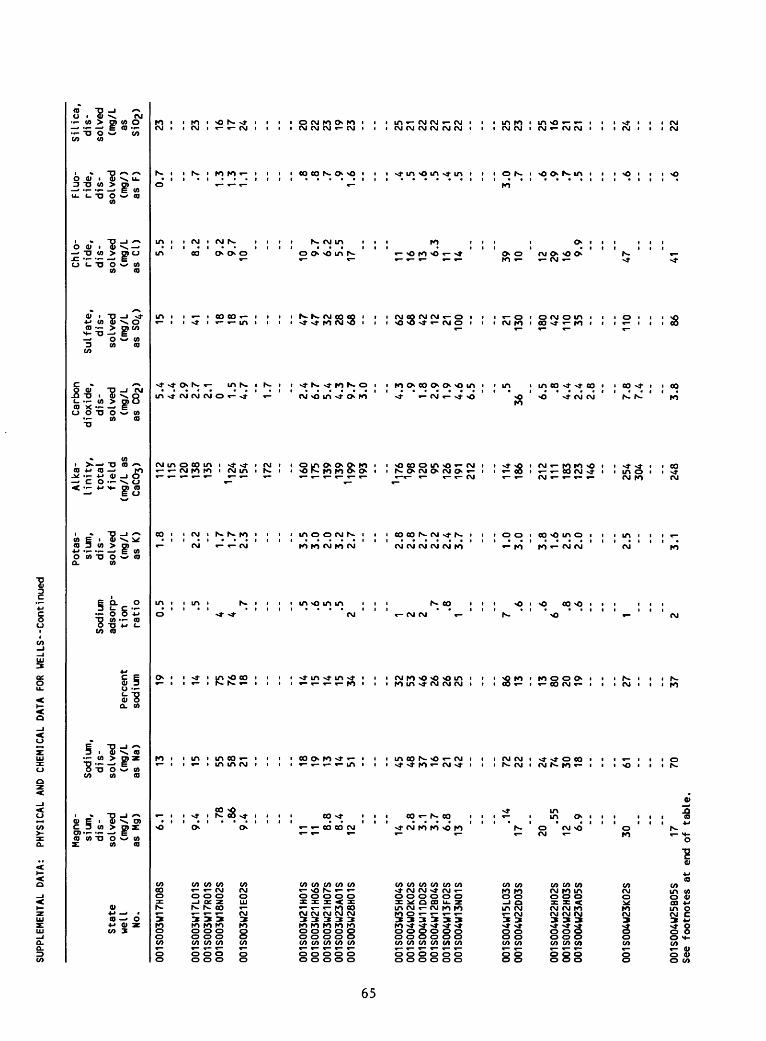
SUPP
LEME
NTAL
DATA:
PHYS
ICAL
AND
CHEMICAL D
ATA
FOR
WELLS--Continued
Stat
e we
ll
No.
001S
003U
17H0
8S
001S
003W
17L0
1S00
1S00
3U17
R01S
001S
003U
18N0
2S
001S
003U
21E0
2S
001S
003W
21H0
1S00
1S00
3W21
H06S
001S
003W
21H0
7S00
1S00
3W23
A01S
001S
003W
28H0
1S
001S
003U
35H0
4S00
1S00
4W02
K02S
001S
004W
11D0
2S00
1S00
4U12
B04S
001S
004U
13F0
2S00
1S00
4U13
N01S
001S
004U
15L0
3S00
1S00
4W22
D03S
001S004W22H02S
001S
004U
22H0
3S00
1S00
4U23
A05S
001S004W23K02S
Magn
e
sium
, di
s
solved
(mg/L
as M
g) 6.1 -- --
9.4 -- .78
.86
9.4 --
11 11 8.8
8.4
12
. .
14 2.8
3.1
3.7
6.8
13
.14
17 20.5
512 6.
9
30--
Sodium,
dis
solved
(mg/L
as N
a)
13 -- -- 15 -- 55 58 21 -- 18 19 13 14 51 _ _ 45 48 37 16 21 42 72 22 24 74 30 18 . . 61 --
Perc
ent
sodium 19 -- -- 14 -- 75 76 18 -- 14 15 14 15 34 32 53 46 26 26 25 86 13 13 80 20 19 27 --
Sodium
adso
rp
tion
ra
tio
0.5 -- -- .5 -- 4 4.7 -- .5 .6 .5 .5
2 -- 1 2 2.7 .8 1 7.6 .6
6.8 .6
1 --
Pota
s
sium
, di
s
solved
(mg/L
as K
)
1.8 -- -- 2.2 -- 1.7
1.7
2.3 --
3.5
3.0
2.0
3.2
2.7
. .
2.8
2.8
2.7
2.2
2.4
3.7
1.0
3.0
3.8
1.6
2.5
2.0 2.5 --
Alka
li
nity
, total
fiel
d (mg/L
as
CaCO
j) 112
115
120
138
135 ..
1124 154
172
160
175
139
139
1199 193
1176 198
120 95 126
191
212
114
186
212
111
183
123
146
254
304
Carbon
diox
ide,
di
s
solved
(mg/
L as
C02
)
5.4
4.4
2.9
2.7
2.1
0 1.5
4.7
1.7
2.4
6.7
5.4
4.3
9.7
3.0
4.3 .9 1.8
2.9
1.9
4.6
6.5 .5
36 6.5 .8
4.4
2.4
2.8
7.8
7.4
Sulf
ate,
di
s
solved
(mg/L
as $0
4) 15 -- -- 41 -- 18 18 51 -- 47 47 32 28 68 62 68 42 12 21 100 21 130
180 42 110 35 m _
110 --
Chlo
ride
, di
s
solv
ed
(mg/L
as Cl)
5.5 -- --
8.2 --
9.2
9.7
10
--
10 9.7
6.2
5.5
17
_ m
11 16 13 6.3
11 14--
39 10 12 29 16 9.9
_ _
47--
Fluo
- ri
de,
dis
solved
(mg/>
as F) 0.7 -- -- .7 -- 1.3
1.3
1.1 -- .8 .8 .7 .9 1.6 .4 .5 .6 .5 .4 .5 -
3.0 .7 .6 .9 .7 .5 _ _ .6 --
Sili
ca,
dis
solved
(mg/L
as
Si02
)
23 -- -- 23 -- 16 17 24 -- 20 22 23 19 23 25 21 22 22 21 22 25 23 25 16 21 21 24 --
001S004W25B05S
17Se
e footnotes
at e
nd o
f ta
ble.
7037
3.1
248
3.8
8641
22

SUPPLEMENTAL DATA:
PHYSICAL AN
D CH
EMIC
AL DA
TA FOR
WELL
S--C
onti
nued
State
well
No.
001S
003W
17H0
8S
001S
003W
17L0
1S00
1S00
3W17
R01S
001S
003W
18N0
2S
001S
003W
21E0
2S
001 S003W21 HOIS
001S
003W
21H0
6S00
1S00
3W21
H07S
001S
003W
23A0
1S00
1S00
3W28
H01S
001S
003U
35H0
4S00
1S00
4W02
K02S
001S
004W
11D0
2S00
1S00
4W12
B04S
001S
004W
13F0
2S00
1S00
4W13
N01S
001S
004W
15L0
3S00
1S00
4W22
D03S
001S
004W
22H0
2S00
1S00
4W22
H03S
001S
004W
23A0
5S
001S
004W
23K0
2S
001S
004W
25B0
5S
Soli
ds,
sum
of
cons
ti
tuen
ts,
dis
solved
(mg/L)
170 -- 240 -- -- 200
280 -- -- -- -- 280
290
220
220
360 -- -- --
330
240
220
150
200
400 -- -- -- 240
410 --
500
240
390
220 -- -- -- 520 -- -- --
460
Nitr
o
gen,
N02+N03,
dis
solved
(mg/L
as N
)
1.60 --
8.60
4.80 .49
.50
11.0 --
11.0
11.0
11.0
10.0 8.90
4.40
4.20 --
13.0
14.0
14.0
16.0 .3
4.8
92.
403.
5013
.011
.011
.012
.0 .27
.20 -- .11
.58
3.20
7.40
7.50
7.40
7.40
15.0
16.0
15.0
16.0
11.0
Nitr
o
gen,
am
moni
a,
dis
so
lved
(m
g/L
as N) 0.01 -- .04 -- .02
.03
.04 -- -- -- -- .03
.02
<.01
<.01 .02 -- -- -- .02
.02
.03
.02
.03
.05 -- -- -- .07
.09 -- .06
.02
.04
.03 -- -- -. .05 -- -- -- .02
Nitr
o
gen, am
monia
+ or
gani
c,
dis.
(m
g/L
as N) 0.
3 -- 1.0 -- <.2 .3 .6 -- -- -- -- .3 .2 .3
<.2 .3 -- -- -- .3 .2 .2 .4 .4 .4 -- -- -- .3 .3 -- <.2 .6 .5 .4 -- -- -- .4 -- -- -- .4
Phos
phorus,
dis
solved
(mg/L
as P
)
0.01 -- .02 -- .02
.02
.01 -- -- -- -- .02
.02
.01
.02
.02 -- -- -- .02
.02
.02
.01
.02
.01 -- -- -- .01
.01 -- .01
.01
.01
.03 -- -- -- .04 -- -- -- .02
Phos
phor
us,
ortho,
dis
solved
(mg/L
as P
)
<0.0
1 --
<.oi ..
<.01 .01
.01 -- -- -- -- .01
.01
.01
.01
.02 -- .- -- .01
.02
.02
<.01 .01
<.01 -- -- -- .01
<.01 --
<.01
<.01 .01
.01 -- -- -- .03 -- -- -- .02
Boro
n,
dis
solved
(/tg/L
as B
)
30 -- 30 -. 60 60 50 -- -- -- -- 30 30 20 30 100 -- -- -- 20 30 40 20 210
110 -- -- --
1,00
0100 -. 120 90 100 30 -- -- -- 70 -- -- -- 80
Iron
, di
s
solved
(/tg/L
as Fe) 6 -- 7 -- 7 14 14 -- -- -- -- 5 4 18 40 35 -- -- -- 7 11 90 10 8 8 -- -- -- 10 24
0 --430 9 15 4 -- -- -- 19 -- -- -- 12
Mang
a
nese
, dis
solved
(/tg/L
as M
n) <1 -- <i -- <1 <1 <1 -- -- -- -- <1 2 <1 <1 <1 -- -- -- 2 1 <1 <1 2 <1 -- -- -- 228
0 --330 2 2 <1 -- -- -- <1 -- -- -- 1
Benzene,
tota
l (M
9/D -- 0.3
<'.l
<.2
<.2 -- -- .6
<.2 -- --
<3.0
<3.0 <.2
<.2
<3.0 <.2 .6 --
<3.0 <-2
<.2
<.2
<.2
<.2 -- -- -- -- -- .6
<.2
<.2
<.2
<.2 -- -- -- <.2 -- -- -- <.2
See
footnotes
at end
of table.

SUPP
LEME
NTAL
DA
TA:
PHYS
ICAL
AND
CHEMICAL DA
TA FO
R WE
LLS-
-Con
tinu
ed
Carbon-
Chloro-
tetr
a-
di-
Bromo-
chlo
- Chloro-
bromo-
Stat
e fo
rm,
ride
, benzene,
methane,
well
total
total
total
total
No.
Otg/
L)
(M9/
L)
(ftg
/L)
(M9/L)
001S003W17H08S
<0.2
1.2
<0.2
<0.2
<.2
<.2
<.2
<.2
001S
003W
17L0
1S
<.2
.4
<.2
<-2
001S003W17R01S
<.2
<.2
<.2
<-2
001S003W18N02S
<.2
<-2
<.2
<.2
001S003W21E02S
.7
1.1
<.2
<.2
*:?
*:?
*:?
*:?001S003W21H01S
<3.0
<3
.0
<3.0
<3.0
001S003W21H06S
<3.0
<3
.0
<3.0
<3.0
001S003W21H07S
<.2
<.2
<.2
<.2
001S003W23A01S
<.2
<.2
<.2
<.2
001S003W28H01S
<3.0
<3.0
<3.0
<3.0
ON
<.2
<.2
<.2
<.2
^
<.2
<.2
<.2
<.2
001S
003W
35H0
4S
<3.0
<3.0
<3.0
<3.0
001S004W02K02S
<.2
<-2
<.2
<.2
001S
004W
11D0
2S
<.2
<.2
<.2
<-2
001S
004W
12B0
4S
<.2
<-2
<.2
<.2
001S
004W
13F0
2S
<.2
<.2
<.2
<.2
001S004W13N01S
<.2
<-2
<.2
<.2
001S004W15L03S
001S
004W
22D0
3S2.
7 .4
<.2
<.2
001S004W22H02S
<.2
<-2
<.2
<.2
001S004W22H03S
<.2
<-2
<.2
<-2
001S
004W
23A0
5S
<.2
<.2
<.2
<.2
001S004W23A05S
001S
004W
23K0
2S
<.2
<.2
<.2
<.2
Chlo
ro-
Chlo
ro-
etha
ne,
form
, to
tal
tota
l (f
tg/L
) (pg/L)
..<0.2
2.2
<.2
<.2
<.2
.5<.2
<.2
<.2
<.2
.. <.2
2.7
<.2
.2
<3.0
<3.0
<3.0
<3.0
<.2
<.2
<.2
.3<3.0
<3.0
<.2
.5<.2
4.3
<3.0
<3.0
<.2
<.2
<.2
<.2
<.2
.2<.2
<.2
<.2
.5
.. .. <.2
1.7
<;2
<;2<.2
<.2
<.2
.4
- - <.2
.4
Di-
Di-
chlo
ro-
chlo
ro-
di-
brom
o-
fluo
ro-
meth
ane,
me
than
e,
tota
l total
..<0.2
<0.2
<.2
<.2
<.2
1.5
<.2
.8<-
2 <.
2
._ <.2
<.2
*:?
*:?<3.0
<3.0
<3.0
<3.0
<.2
<.2
<.2
<.2
<3.0
<3.0
<.2
.2<.
2 .5
<3.0
<3.0
<.2
<.2
<.2
.8<.
2 <.
2<.
2 .5
*:?
*:?-- .. .5
<.
2
<.2
!6<.
2 .4
*:?
*:?..
. _<.
2 <.
2
Ethy
l-
Methyl
benz
ene,
br
omid
e,
total
total
(M9/D
(M9/L)
.. 0.3
<0.2
.2
<.2
.3
<-2
<.2
<.2
<.2
<.2
._ .9
<.2
*:?
*:?<3
.0
<3.0
<3.0
<3
.0<.
2 <.
2<.
2 <.
2<3
.0
<3.0
<.2
<.2
1.9
<.2
<3.0
<3
.0<.
2 <.
2<.
2 <.
2<.
2 <.
2<.
2 <.
2
<:?
K:?.. .. <.2
<.2
<J2
<!2
<.2
<.2
':?
':?~ ~
- -<.
2 <.
2
001S
004W
25B0
5S
<-2
See
footnotes
at en
d of ta
ble.

SUPPLEMENTAL DATA:
PHYSICAL AN
D CHEMICAL DA
TA FOR
WELL
S--C
onti
nued
ON
00
State
well
No.
001S
003W
17H0
8S
001S
003W
17L0
1S00
1S00
3W17
R01S
001S003W18N02S
001S
003W
21E0
2S
001S003W21H01S
001S003W21H06S
001S003W21H07S
001S
003W
23A0
1S00
1S00
3W28
H01S
001S003W35H04S
001S004W02K02S
001S004W11D02S
001S004W12B04S
001S004W13F02S
001S004W13N01S
001S004W15L03S
001S004W22D03S
001S004W22H02S
001S004W22H03S
001S004W23A05S
Methyl -
Meth
yl
ene
chlo
r-
chlo
- id
e,
ride
, to
tal
tota
l Oi
g/L)
Oi
g/L)
-.<0.2
18<.
2 2<
20<.
2 1.9
<.2
2<2.0
<.2
<0.2
_. <.2
8.1
*:?
*:?<3
.0
<3.0
<3.0
<3
.0<.
2 2<
1.0
<.2
2<1.0
<3.0
23.0
<.2
2<2.0
<.2
100
<3.0
<3
.0<.
2 2<
16<.
2 2<
3.0
<.2
<.2
<!2
2<2!
o':*
*:?
-- .. <.2
3.0
<.2
2<1.
0<.
2 2<
2.0
<.2
2<2.0
<.2
<.2
Tetr
a-
chlo
ro-
ethy
l-
ene,
total -- 1.0 .2
<.2 .7 K:2 <3
.0<3
.0 .2<3
.0 .4 1.1
<3.0 <.2
<.2 !2 .4 -- -- <.2
<.2
<.2 !2 .4
Tolu
ene,
to
tal
Oig/L) .. 1.
6 .3 1.0
<.2 .. <.2 *:? <3
.0<3
.0 <.2
<s!o 9!2
<3.0 .2 .2 *:? -- -- .3
<-2
<.2
<-2
Tri-
chloro-
ethy
l-
ene,
total
(/ig/L) --
3.6 .3 .7 .3
<.2 ..
4.3 .7
56.0
28.0 2.9
36.0
44.0
19.0 7.5
<3.0 <.2 .8 .2 .2 -- -- 1.5
<.2 !6
<.2
Tri-
chloro-
f luoro-
me th
ane,
tota
l (/
ig/D
--<0
.2 s!i <-2 __ <.2 *:? <3
.0<3
.0 <-2
<.2
<3io <.2
3.8
<3.0 !2
<.2 .2 ':? -- -- <.2 .2 .2 .5
<.2
Vinyl
chlo
ride
, total
</ig
/L) .-
<0.2 <.2
<.2
<.2 .. <.2 *:? <3
.0<3.0 <.2
<s!o
<.2
<3.0 <.2
<.2
<.2 *:? -- -- .. <.2
<.2
<.2
<.2
1,1-Di-
chloro-
1,1-
Di-
ethy
l-
chloro-
ene,
etha
ne,
tota
l to
tal
(pg/L)
Oig/
L)
-.<0
.2
0.2
.2
<\2
<.2
<.2
_. <-2
<-2
*:?
*:?<3
.0
<3.0
<3.0
<3
.0.9
<.2
3.4
<.2
<3.0
<3.0
<.2
<-2
.6
.4
<3.0
<3
.0<.
2 <.
2<.
2 <.
2<.
2 <.
2<.
2 <.
2
*:?
*:?-- .. <.2
<.2
<.2
<.2
<.2
<.2
<.2
<.2
<.2
<.2
1,1,1-
Tri-
chloro-
etha
ne,
tota
l --<0
.2 <.2
<.2
<.2 .. -- *:? <3
.0<3
.0 <.2 i!s <3
.0 <.2 .4
<3.0 <.2
<.2
<.2
<.2 *:? -- -- .. <.2
<.2
<.2
<.2
001S
004W
23K0
2S
001S004W25B05S
<.2
See
foot
note
s at
end
of ta
ble.
2<1.
0.2