applying lcca in pavement selection€¦ · a pavement design or rehabilitation alternative will...
TRANSCRIPT

How LCCA Works
Applying LCCA in Pavement Selection
June 24, 2014
Robert Rodden, P.E.
Senior Director of Pavement Technology
Acknowledgements + THANK YOU!
ACPA Staff Author – Robert Rodden, P.E. Contributing Technical Author - Katie Hall, Ph.D., P.E. LCCA TF Members and Document Reviewers:
Scott Ashmore John Becker, P.E. Stephen Bullock Paul Corr Peter Deem Dan DeGraaf, P.E. Tim Duit John Eisenhour Michael Evangelista Martin Holt Paul Jaworski
Allen Johnson Kevin McMullen, P.E. James Mack, P.E. Jan Prusinski, P.E. Randy Riley, P.E. Rich Rogers, P.E. Matthew Ross, P.E. Mark Snyder, Ph.D., P.E. Mark Swanlund David Swanson Tom VanDam, Ph.D., P.E.
Gerald Voigt, P.E. Leif Wathne, P.E. Matt Zeller, P.E. Ronald Zinc
…Disponible en Español
PDF available soon in ACPA bookstore Translated by the Chilean Cement and Concrete Institute
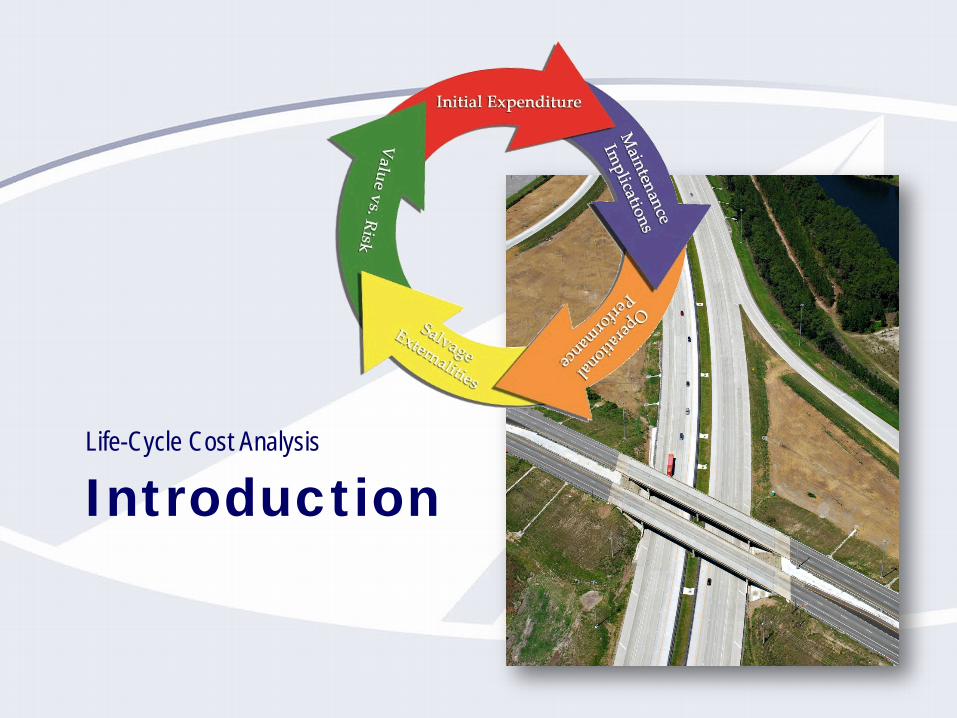
Introduction Life-Cycle Cost Analysis

What is Life-Cycle Cost Analysis?
Life-cycle cost analysis (LCCA): An analysis technique used to evaluate the overall long-term economic efficiency between competing alternate investment options (e.g., pavements). Based on well-founded economic principles. Identifies the strategy that will yield the best value by providing the expected performance at the lowest cost over the analysis period. Is not an engineering tool for determining how long a pavement design or rehabilitation alternative will last or how well it will perform.

Why Bother with an LCCA?
Pavement types perform differently over time. Equivalent designs are not always achievable. LCCA compares the total discounted cost of each design over a specific analysis period to minimize the financial burden of the roadway on taxpayers.
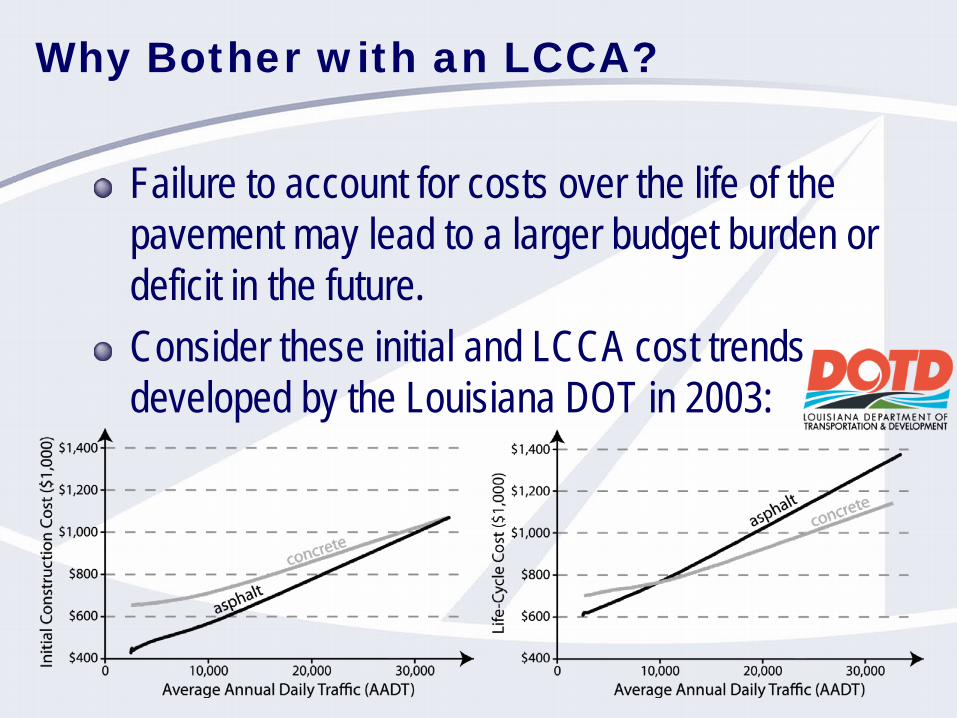
Why Bother with an LCCA?
Failure to account for costs over the life of the pavement may lead to a larger budget burden or deficit in the future. Consider these initial and LCCA cost trends developed by the Louisiana DOT in 2003:

We Must Consider Life Cycle Costs!
“Economic principles tell us that if we want to minimize the cost of a durable good that requires repair, maintenance and replacement over time, we must minimize present value of those costs, not minimize initial costs. If the myopic strategy is adopted to accept the lower up-front price despite higher [present value], the buyers are actually made worse off.”
- Dr. William Holahan Chair and Professor Department of Economics University of Wisconsin - Milwaukee

Basic Steps in a Single Project LCCA
Life-Cycle Cost Analysis

Step 1 – Select the Analysis Period
Life-Cycle Cost Analysis

LCCA Analysis Period
The analysis period is the timeframe over which the alternative strategies/treatments are compared.
Must encompass the initial performance period and at least one major follow-up preservation/ rehabilitation activity for each strategy.
FHWA recommends an analysis period of at least 35 years for all pavement projects. ACPA recommends an analysis period of 45-50+ years because common practice in many states is to design the concrete pavement alternate for 30+ years.

Agency Practices: Analysis Period
Analysis Period (yrs)
Percent of Responding
Agencies
State Agency
< 30 4% AL
30 11% NC, SC, WY
35 18% AK, AR, ID, MT, OH
40 39% CO, FL, GA, IA, IN, KS, KY, LA, MD, MS, SD
45 7% IL, MO
50+ 21% MN, NE, NY, VA, WA, WI

Agency Practices: Analysis Period
Analysis Period (yrs)
Percent of Responding
Agencies
< 30 4%
30 11%
35 18%
40 39%
45 7%
50+ 21%
Analysis Period (yrs)
Percent of Responding
Agencies Agency
< 30 3% AL
30 8% NC, TN, WY
35 16% AK, AR, ID, MT, NV, OH
40 34% AZ, BC, CO, FL, GA, IN, IA, KS, KY, LA, MD, MS, SD, WV
45 5% IL, MO
50+ 29% MB, PA, QC, SC, MN, NE, NY, VA, WA, WI
Varies 5% HI, MI
December 2013 ACPA Survey (38) 2012 ACPA LCCA EB (28)

Step 2 – Select a Discount Rate
Life-Cycle Cost Analysis

LCCA Discount Rate
The real discount rate (also known as the real interest rate) is used in pavement LCCAs.
Accounts for fluctuations in both investment interest rates and the rate of inflation. Today’s costs can be used as proxies for future costs.
d = 1 + 𝑖𝑖𝑖𝑖𝑖𝑖𝑖𝑖1 + 𝑖𝑖𝑖𝑖𝑖𝑖𝑖𝑖
− 1
d = the real discount rate, % iint = the interest rate, % iinf = the inflation rate, %

Selecting an Interest Rate
Funds for paving projects are obtained by: 1. Levying taxes, 2. Borrowing money (i.e., selling bonds), and/or 3. Charging users for services (e.g., toll revenue).
The interest rate assumed for the LCCA of a project should reflect the type of entity raising the money and the method(s) used to raise it.

Selecting an Inflation Rate
The inflation rate may be: 1. A single value if it is assumed that all components of
future costs inflate at a uniform rate OR 2. Several different values for various cost components
when there are significant differences in inflation among the cost components.
Several general inflation indices are compiled regularly by the Bureau of Labor Statistics (BLS) in the U.S. Department of Labor.

Selecting an Inflation Rate

Calculating the Real Discount Rate
Calculating the Real Discount Rate
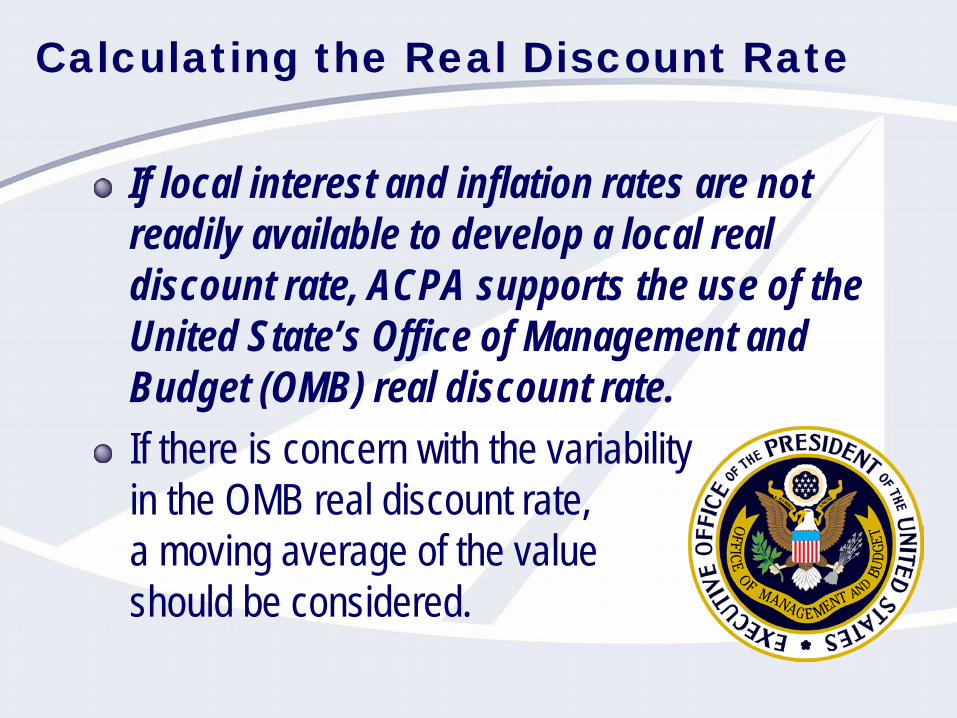
If local interest and inflation rates are not readily available to develop a local real discount rate, ACPA supports the use of the United State’s Office of Management and Budget (OMB) real discount rate. If there is concern with the variability in the OMB real discount rate, a moving average of the value should be considered.

Calculating the Real Discount Rate

High vs Low Discount Rate
Low Discount Rate • Present worth of
future expenditure is closer to current cost
• Favors high initial cost and low future cost options
High Discount Rate • Present worth of
future expenditure is greatly reduced
• Favors low initial cost and high future cost options

Agency Practices: Discount Rate Real Discount
Rate (%) Percent of
Responding Agencies
State Agency
< 3 18% MI*, MN*, MO*, NV*, OH*, SC*, WV*
3 15% GA, IA, IL, KS, MD, MT
3 to 4 10% AR, CO*, FL, NE
4 49% AK, AL, CA, CT, DE, ID, IN, LA, MS, NC, NJ, NM, NY, PA, TN, UT, VA, WA, WY
4 to 5 3% SD
5 5% KY, WI
* Denotes a state whose real discount rate is based either on the OMB or a moving average of the OMB.
OMB Circular A-94, App. C 2014 1.9% 2013 1.1%
5-yr avg 2.0%

Agency Practices: Discount Rate
Real Discount Rate (%)
Percent of Responding
Agencies
< 3 18%
3 15%
3 to 4 10%
4 49%
4 to 5 3%
5 5%
* Denotes a state whose real discount rate is based either on the OMB or a moving average of the OMB.
Real Discount Rate (%)
Percent of Responding
Agencies Agency
< 3 23% CO*, KS, MI*, MN*, MO*, NV*, OH*, PA*, SC*, WV*
3 14% GA, IL, IA, MD, MT, NY
3 to 4 9% AR, FL, NE, SD
4 42% AL, AK, AZ, CA, CT, DE, ID, IN, LA, MS, NJ, NM, NC, TN, UT, VA, WA, WY
4 to 5 0% -
5 or more 12% BC, KY, MB, QC, WI
December 2013 ACPA Survey (43) 2012 ACPA LCCA EB (39)
Step 3 – Estimate Initial Agency Costs (A)
Life-Cycle Cost Analysis

Initial Agency Costs
Only those initial agency costs that are different among the various alternatives need to be considered for reasonably similar alternates. Pavement costs include items such as subgrade preparation; base, subbase, and surface material; associated labor and equipment; etc. When historical bid prices are used as estimates, consider the impact of material price escalators, payment practices, and bidding practices.

Step 4 – Estimate User Costs (B)
Life-Cycle Cost Analysis

User Costs
Costs that are incurred by users of the roadway over the analysis period.
Work zone costs: Incurred during lane closures and other periods of construction, preservation/rehabilitation, and maintenance work. Vehicle operating costs: Incurred during the normal use of the roadway. Delays due to capacity issues: Primarily a function of demand for use of the roadway with respect to roadway capacity (not likely to vary between alternates). Accidents: Damage to the user’s/other’s vehicle and/or public or private property; injury costs.

Agency Practices: User Costs
User Costs Considered
Percent of Responding
Agencies
State Agency
Yes 42% AK, AZ, CA, CO, CT, DE, GA, KS, KY, LA, MD, MI, NM, PA, SC, VT, WA
No 58% AL, AR, FL, IA, ID, IL, IN, MN, MO, MS, MT, NC, NE, NJ, NV, NY, OH, SD, TN, UT, WI, WV, WY

Agency Practices: User Costs
User Costs Considered
Percent of Responding
Agencies Agency
Yes 43% AK, CA, CO, CT, DE, GA, KS, KY, LA, MD, MI, NV, NM, QC, SC, VT, VA, WA
No 55%
AL, AZ, AR, FL, ID, IL, IN, IA, MN, MO, MS, MT, NE, NJ, NY, NC, OH, SD, TN, UT, WV, WI, WY
Sometimes 2% PA
December 2013 ACPA Survey (42) 2012 ACPA LCCA EB (40)
User Costs Considered
Percent of Responding
Agencies
Yes 42%
No 58%

Step 5 – Estimate Future Agency Costs (C)
Life-Cycle Cost Analysis
Future Agency Costs
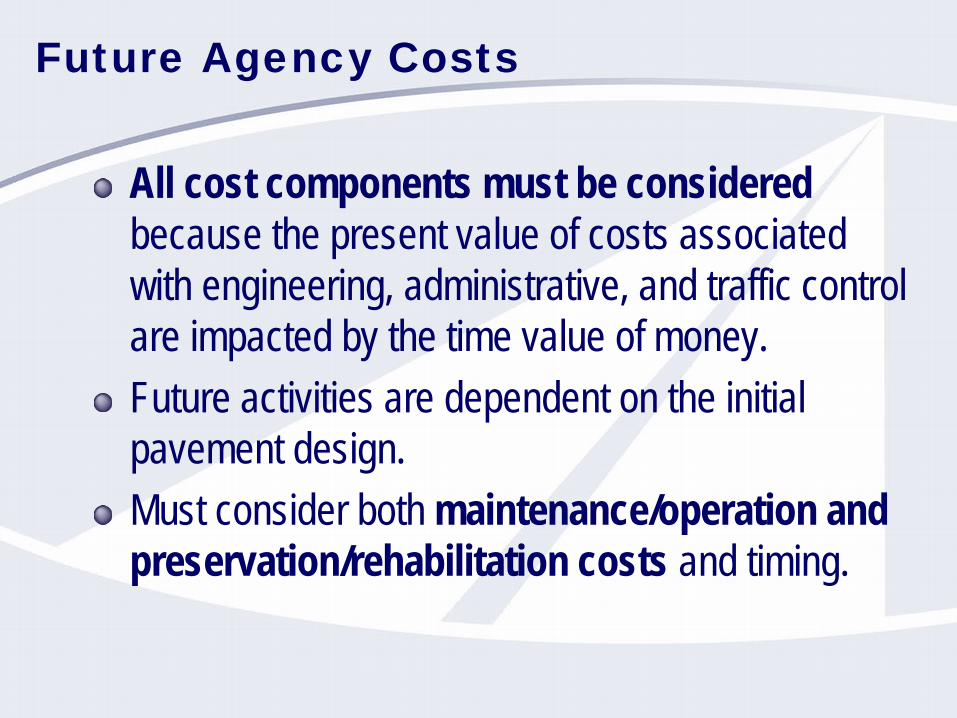
All cost components must be considered because the present value of costs associated with engineering, administrative, and traffic control are impacted by the time value of money. Future activities are dependent on the initial pavement design. Must consider both maintenance/operation and preservation/rehabilitation costs and timing.

Maintenance and Operation Costs
Daily costs associated with keeping the pavement at a given level of service. Several billion dollars are spent each year on pavement maintenance by highway agencies in the U.S. Short-term solutions typically have significantly larger maintenance requirements than long-life solutions, regardless of the size of the project.

Agency Practices: Maint. Costs
Maint. Costs Considered
Percent of Responding
Agencies
State Agency
Yes 77% AK, AR, CA, CO, DE, GA, ID, IL, IN, KS, LA, MI, MN, MT, NC, NE, NM, NV, PA, TN, UT, VT, WI, WV
No 23% AL, IA, MD, MO, OH, SC, WA

Agency Practices: Maint. Costs
Maint. Costs
Considered
Percent of Responding
Agencies Agency
Yes 78%
AK, AZ, AR, BC, CA, CO, DE, GA, ID, IL, IN, LA, MB, MI, MN, MT, NE, NV, NM, NY, NC, PA, QC, SD, TN, UT, VT, VA, WV, WI, WY
No 22% AL, IA, KS, MD, MO, OH, SC, WA
December 2013 ACPA Survey (40) 2012 ACPA LCCA EB (31)
Maint. Costs Considered
Percent of Responding
Agencies
Yes 77%
No 23%

Preservation and Rehab. Costs
Large future agency costs associated with improving the condition of the pavement or extending its service life. Preservation and rehabilitation activities and their timing should be based on the distresses that are predicted to develop in the pavement. Best to develop pavement performance predictions based on local performance history data; otherwise, Pavement ME can be used.

Agency Practices: Rehab. Costs
Rehab. Costs Considered
Percent of Responding
Agencies
State Agency
Yes 97% AK, AL, AR, CA, CO, DE, GA, IA, ID, IL, IN, KS, LA, MD, MN, MO, MS, NC, NE, NM, NV, OH, PA, SC, TN, UT, VT, WA, WI, WV
No 3% MI

Agency Practices: Rehab. Costs
Rehab. Costs
Considered
Percent of Responding
Agencies Agency
Yes 98%
AL, AK, AZ, AR, BC, CA, CO, DE, FL, GA, HI, ID, IL, IN, IA, KS, LA, MB, MD, MN, MO, MS, MT, NE, NV, NM, NY, NC, OH, PA, QC, PA, SC, SD, TN, UT, VA, WA, WV, WI, WY
No 2% MI
December 2013 ACPA Survey (41) 2012 ACPA LCCA EB (31)
Rehab. Costs Considered
Percent of Responding
Agencies
Yes 97%
No 3%

Agency Practices: Pres. Programs
Age of Pavement
Preservation Program
Percent of Responding
Agencies
State Agency
1-10 Years 46% AK, AR, IL, MD, MN, MO, MS, NY, OR, PA, WV
10-20 Years 29% CO, IN, LA, MI, NM, NJ, TX
> 20 Years 25% CA, FL, KS, ME, UT, WA

Step 6 – Estimate Residual or Salvage Value
Life-Cycle Cost Analysis

Residual or Salvage Value
Defined in one of three ways: The net value that the pavement would have in the marketplace if it is recycled at the end of its life, The value of the remaining service life (RSL) at the end of the analysis, OR The value of the existing pavement as a support layer for an overlay at the end of the analysis period.
Residual or salvage value must be defined the same way for all alternatives. Always in final year, so Δ$ is what is important.

Agency Practices: Residual Value
Residual Value Considered
Percent of Responding
Agencies
State Agency
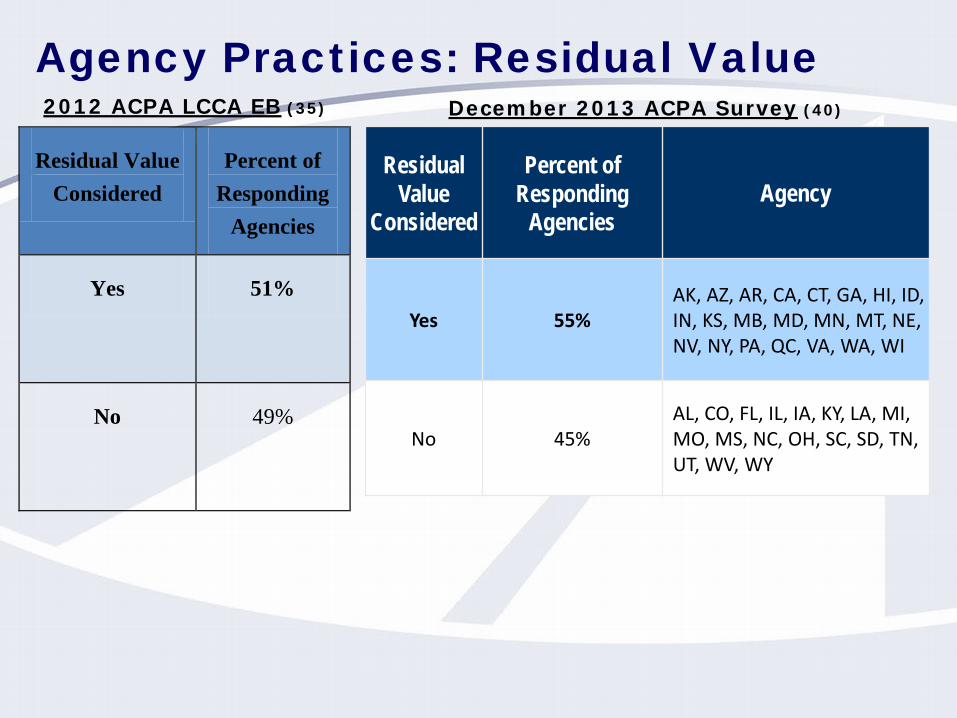
Yes 51% AK, AR, CA, CO, CT, GA, HI, ID, IN, KS, MD, MN, NE, NV, NY, VA, WI , WA
No 49% AL, FL, IA, IL, KY, LA, MI, MO, MS, NC, OH, SC, SD, TN, UT, WV, WY
Agency Practices: Residual Value
Residual Value
Considered
Percent of Responding
Agencies Agency
Yes 55% AK, AZ, AR, CA, CT, GA, HI, ID, IN, KS, MB, MD, MN, MT, NE, NV, NY, PA, QC, VA, WA, WI
No 45% AL, CO, FL, IL, IA, KY, LA, MI, MO, MS, NC, OH, SC, SD, TN, UT, WV, WY
December 2013 ACPA Survey (40) 2012 ACPA LCCA EB (35)
Residual Value Considered
Percent of Responding
Agencies
Yes 51%
No 49%

Beware NAPA/NCAT False Definition
Source: “Life Cycle Cost Analysis for Pavements” NCAT/NAPA Webinar – 6/4/14
This approach results in a
salvage value near (or even higher than)
the initial construction
cost…
Actual value is EITHER from continued use
OR from sale of
scrap material as it is
recycled

…Think about Your Last Car
Value at the end of your ownership was EITHER
Trade in or private party sale value because it will be
continued to be used
Scrap value because it is not drivable due to
age or accident OR
… and NOT the sum of these.

Step 7 – Compare Alternatives
Life-Cycle Cost Analysis
Pavement Management Plan from City of Leawood, Kansas

Compare Alternatives
Alternatives considered must be compared using a common measure of economic worth. Investment alternatives such as pavement strategies are most commonly compared on the basis of:
Present worth (also called net present value [NPV]) Annual worth (also called equivalent uniform annual cost [EUAC])
NPV and EUAC provide the same ranking
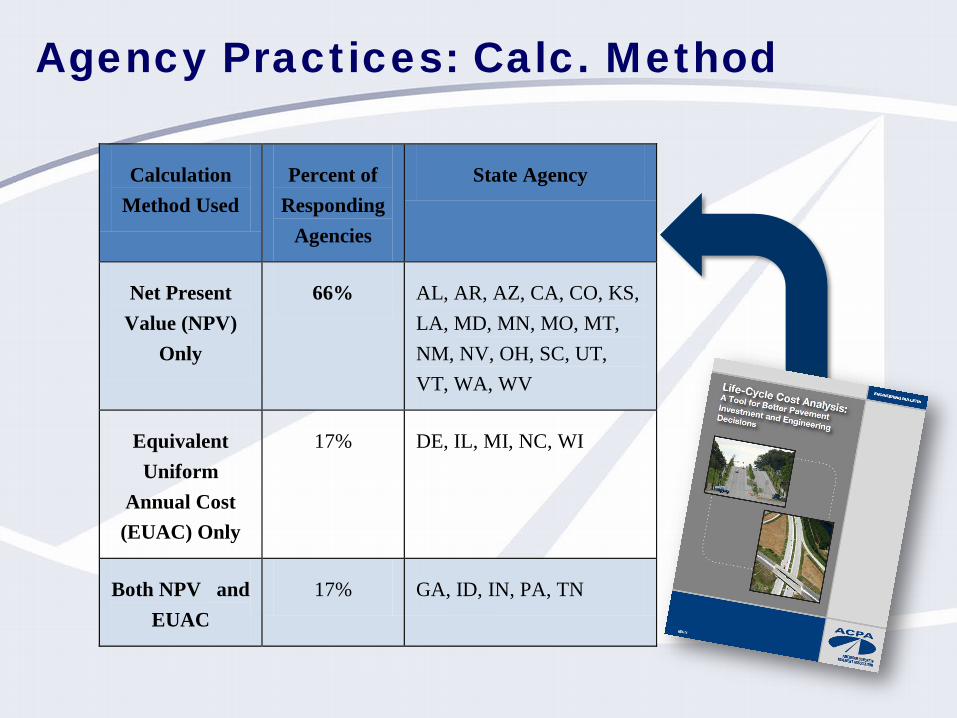
Agency Practices: Calc. Method
Calculation Method Used
Percent of Responding
Agencies
State Agency
Net Present Value (NPV)
Only
66% AL, AR, AZ, CA, CO, KS, LA, MD, MN, MO, MT, NM, NV, OH, SC, UT, VT, WA, WV
Equivalent Uniform
Annual Cost (EUAC) Only
17% DE, IL, MI, NC, WI
Both NPV and EUAC
17% GA, ID, IN, PA, TN

Agency Practices: Calc. Method
Calc. Method Used
Percent of Responding
Agencies Agency
NPV 65% AL, AR, CA, CO, KS, LA, MD, MN, MO, MN, NV, NM, OH, PA, SC, UT, VT, WA, WV, WY
EUAC 19% DE, IL, MI, NC, SD, WI
NPV + EUAC 16% AZ, GA, ID, IN, TN
December 2013 ACPA Survey (31) 2012 ACPA LCCA EB (29)
Calculation Method Used
Percent of Responding
Agencies
Net Present Value (NPV)
Only
66%
Equivalent Uniform
Annual Cost (EUAC) Only
17%
Both NPV and EUAC
17%

Net Present Value (NPV)
NPV analyses are directly applicable only to mutually exclusive alternates each with the same analysis period. The formula for the present value or worth ($P) of a one-time future cost or benefit ($F) is:
$𝑃𝑃 = $𝐹𝐹 × � 1
(1 + d)t �
d = the real discount rate, % t = the year in which the one-time future cost or benefit occurs

Accounting for Material Inflation
Material-specific real discount rates OR Escalating the future value of an item before calculating its present or annual worth.
MIT has proposed “real price” escalators that are dependent on the year in the LCCA in which the activity is conducted.
PennDOT uses an Asphalt Adjustment Multiplier (AAM) to adjust asphalt bid prices; at print of LCCA EB, AAM was 1.7419, effectively escalating asphalt prices 74%... at 1.0044 in 6/14

MIT Real Price Escalators
Used previous price indices for concrete, asphalt, steel and lumber + Monte Carlo analyses to provide a means of accounting for material price inflation and volatility in an LCCA framework
Conc.
Asph.

Analysis Methods
Deterministic approach – a single defined value is assumed and used for each activity. Probabilistic approach – variability of each input is accounted for and used to generate a probability distribution for the calculated life-cycle cost.

Agency Practices: Analysis Method
Analysis Method Used
Percent of Responding
Agencies
State Agency
Deterministic 80% AL, AR, AZ, CA, GA, ID, IL, KS, LA, MI, MN, MO, MT, NC, NM, NV, OH, PA, TN, UT, VT, WI, WV
Probabilistic 10% CO, IN, MD
Both Det. and Prob.
10% DE, SC, WA

Agency Practices: Analysis Method
Analysis Method Used
Percent of Responding
Agencies Agency
Deterministic 78%
AL, AR, CA, GA, ID, IL, KS, LA, MI, MN, MO, MT, NV, NM, NY, NC, OH, PA, SD, TN, UT, VT, WV, WI, WY
Probabilistic 13% AZ, CO, IN, MD
Both 9% DE, SC, WA
December 2013 ACPA Survey (32) 2012 ACPA LCCA EB (29)
Analysis Method Used
Percent of Responding
Agencies
Deterministic 80%
Probabilistic 10%
Both Det. and Prob.
10%

Analysis Tools
Most modern spreadsheet software include standard functions for calculating the present worth and annual worth. Proprietary software to compute LCCAs include:
AASHTOWare Pavement ME (deterministic) FHWA’s RealCost (deterministic and probabilistic) ACPA’s StreetPave & WinPAS (both deterministic) CAC’s CANPave (deterministic) Asphalt Pavement Alliance’s (APA’s) LCCA Original and LCCA Express (both deterministic)

Agency Practices: Analysis Tools
LCCA Tool Used
Percent of Responding
Agencies
State Agency
State-Developed Tool
62% AR, GA, ID, IL, KS, MI, MN, MO, MT, NC, NM, NV, OH, PA, SC, TN, UT, WI
RealCost 41% AZ, CA, CO, DE, IN, LA, MD, SC, TN, UT, VT, WA
DARWinMETM 17% AL, CO, TN, VT, WV

Agency Practices: Analysis Tools
LCCA Tool Used
Percent of Responding
Agencies Agency
State-Developed
Tool 65%
AR, GA, ID, IL, KS, MI, MN, MO, MT, NV, NM, NY, NC, OH, PA, SC, SD, TN, UT, WI
RealCost 39% AZ, CA, CO, DE, IN, LA, MD, SC, TN, UT, VT, WA
Pavement ME 16% AL, CO, TN, VT, WV
December 2013 ACPA Survey (31) 2012 ACPA LCCA EB (29)
LCCA Tool Used
Percent of Responding
Agencies
State-Developed Tool
62%
RealCost 41%
DARWinMETM 17%

Compare Results
Because different components of the LCCA indicate different things about the alternates, the components typically are viewed separately and together to aid in interpretation/evaluation. When two alternatives have very similar net present values over the analysis period, it is advisable to choose the less risky alternative (i.e., the one with the higher proportion of the net present value attributable to initial costs).

Example of Single-Project LCCA in Whitefish Bay, WI
Life-Cycle Cost Analysis
Existing 80-yr old concrete pavement Existing 34-yr old
asphalt pavement

Local Road Example
Agency/Owner: Village of Whitefish Bay, WI Location: Diversey Boulevard Street Year of LCCA: 2008 Roadway Classification: Residential Project Scope: Reconstruction of approximately 10,000 SY (8,360 m2) of pavement. Other Project Details: Existing 80-yr old concrete pavement is still in good condition with no scheduled maintenance, rehabilitation or reconstruction planned. Existing 34-yr old asphalt pavement has significant structural and material durability distresses.
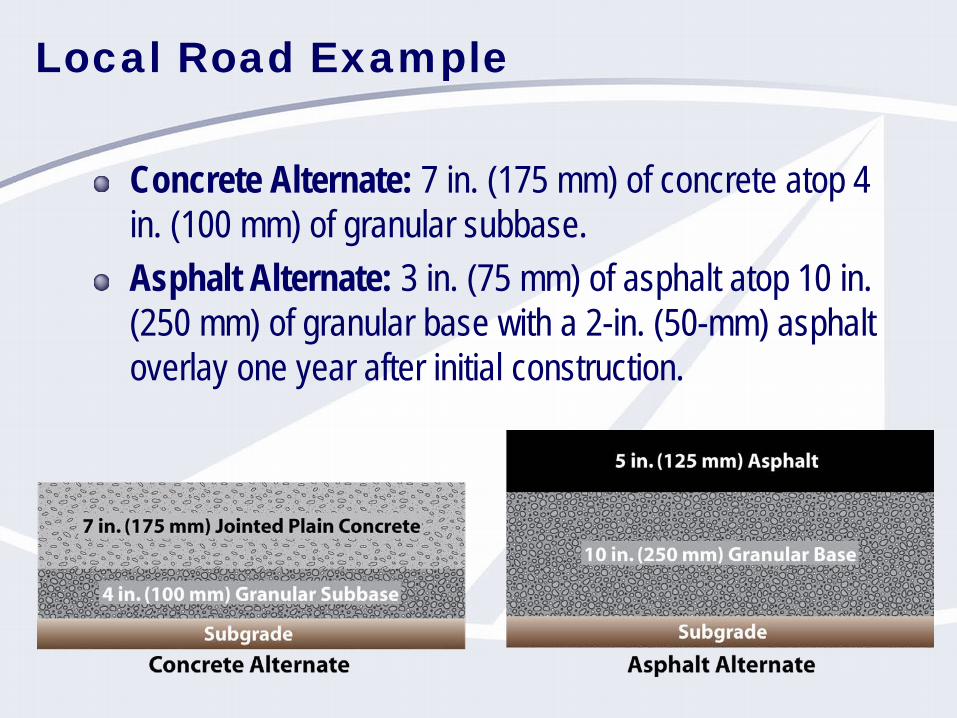
Local Road Example
Concrete Alternate: 7 in. (175 mm) of concrete atop 4 in. (100 mm) of granular subbase. Asphalt Alternate: 3 in. (75 mm) of asphalt atop 10 in. (250 mm) of granular base with a 2-in. (50-mm) asphalt overlay one year after initial construction.

Local Road Example
Step 1 – Select Analysis Period: 90 years Step 2 – Select Real Discount Rate: 3% Step 3 – Estimate Initial Agency Costs:
Concrete Alternate: $373,940 Asphalt Alternate: $318,068
Step 4 – Estimate User Costs: User costs were not considered.
As bid, user costs for the staged asphalt construction would have been significantly more than those of concrete or an asphalt pavement placed in a single construction phase. Based on activity timings in the next step, future user costs likely also are more for the asphalt alternate.

Local Road Example
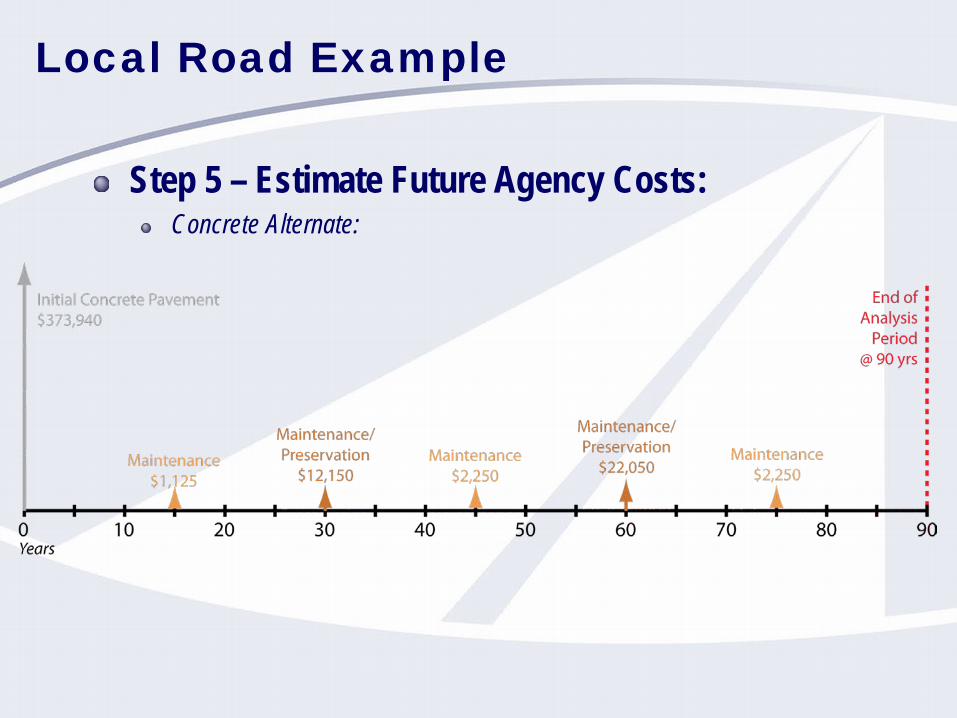
Step 5 – Estimate Future Agency Costs: Concrete Alternate:
Year Type of Work Description of Work Quantity Unit Price Total Cost 15 Maintenance Joint Sealing (15%) 2,250 LF $0.50/LF $1,125 30 Maintenance Joint Sealing (30%) 4,500 LF $0.50/LF $2,250
30 Preservation Full Depth Repair (2% Panels @ 6 ft Repair) 40 CY $180/CY $7,200
30 Preservation Partial Depth Repair (3% Joint Repaired) 180 LF $15.00/LF $2,700
45 Maintenance Joint Sealing (30%) 4,500 LF $0.50/LF $2,250 60 Maintenance Joint Sealing (30%) 4,500 LF $0.50/LF $2,250
60 Preservation Full Depth Repair (4% Panels @ 6 ft Repair) 80 CY $180/CY $14,400
60 Preservation Partial Depth Repair (6% Joint Repaired) 360 LF $15.00/LF $5,400
75 Maintenance Joint Sealing (30%) 4,500 LF $0.50/LF $2,250
Local Road Example
Step 5 – Estimate Future Agency Costs: Concrete Alternate:
Local Road Example
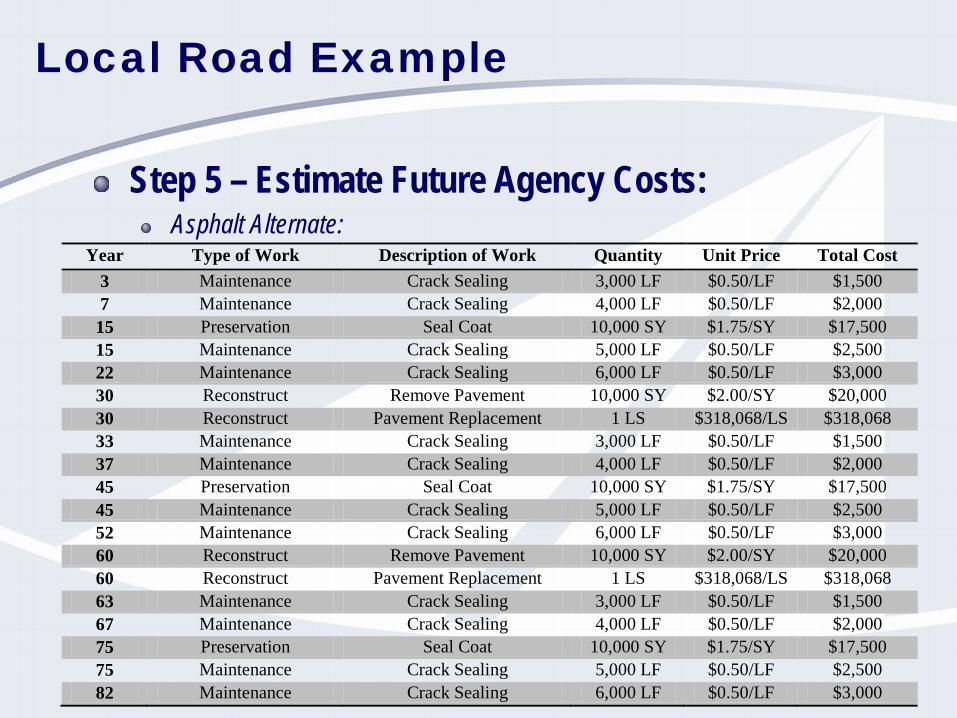
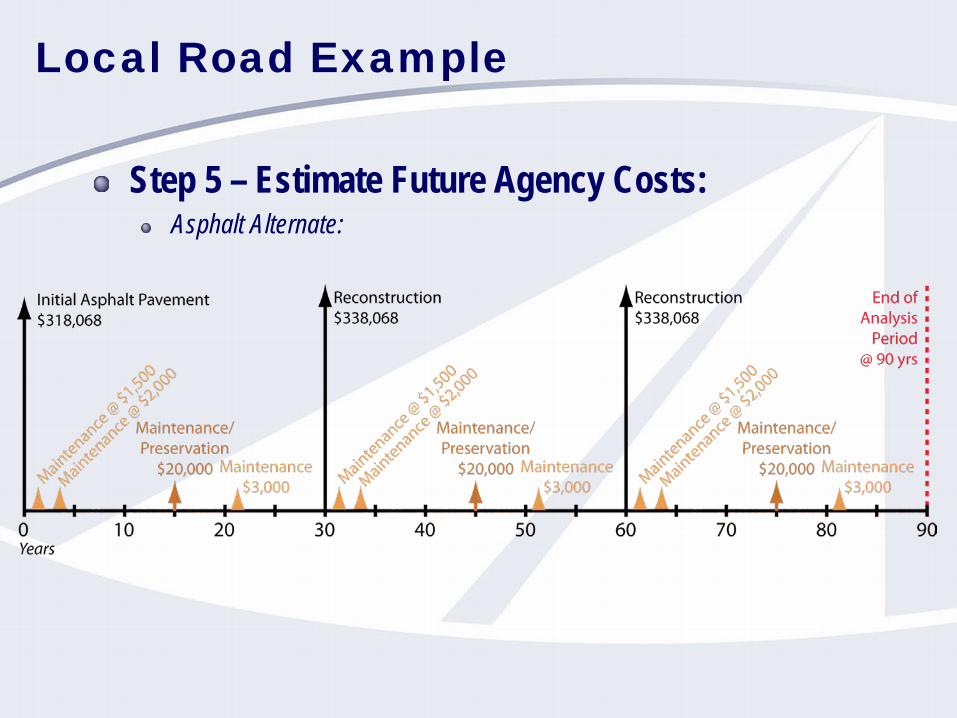
Step 5 – Estimate Future Agency Costs: Asphalt Alternate:
Year Type of Work Description of Work Quantity Unit Price Total Cost 3 Maintenance Crack Sealing 3,000 LF $0.50/LF $1,500 7 Maintenance Crack Sealing 4,000 LF $0.50/LF $2,000
15 Preservation Seal Coat 10,000 SY $1.75/SY $17,500 15 Maintenance Crack Sealing 5,000 LF $0.50/LF $2,500 22 Maintenance Crack Sealing 6,000 LF $0.50/LF $3,000 30 Reconstruct Remove Pavement 10,000 SY $2.00/SY $20,000 30 Reconstruct Pavement Replacement 1 LS $318,068/LS $318,068 33 Maintenance Crack Sealing 3,000 LF $0.50/LF $1,500 37 Maintenance Crack Sealing 4,000 LF $0.50/LF $2,000 45 Preservation Seal Coat 10,000 SY $1.75/SY $17,500 45 Maintenance Crack Sealing 5,000 LF $0.50/LF $2,500 52 Maintenance Crack Sealing 6,000 LF $0.50/LF $3,000 60 Reconstruct Remove Pavement 10,000 SY $2.00/SY $20,000 60 Reconstruct Pavement Replacement 1 LS $318,068/LS $318,068 63 Maintenance Crack Sealing 3,000 LF $0.50/LF $1,500 67 Maintenance Crack Sealing 4,000 LF $0.50/LF $2,000 75 Preservation Seal Coat 10,000 SY $1.75/SY $17,500 75 Maintenance Crack Sealing 5,000 LF $0.50/LF $2,500 82 Maintenance Crack Sealing 6,000 LF $0.50/LF $3,000
Local Road Example
Step 5 – Estimate Future Agency Costs: Asphalt Alternate:
Local Road Example
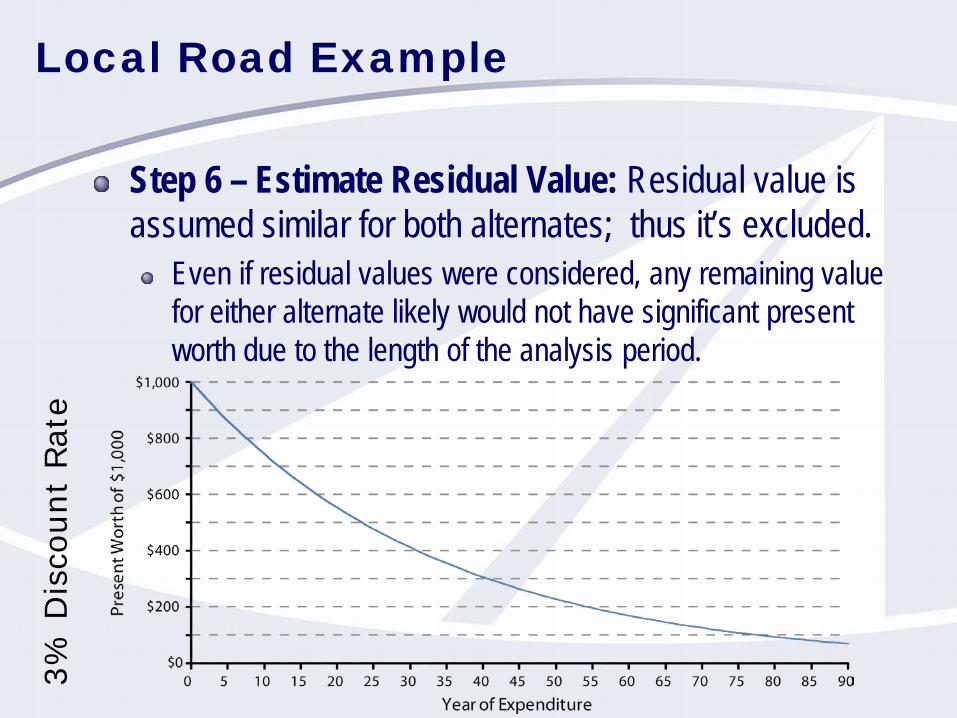
Step 6 – Estimate Residual Value: Residual value is assumed similar for both alternates; thus it’s excluded.
Even if residual values were considered, any remaining value for either alternate likely would not have significant present worth due to the length of the analysis period.
3% D
isco
unt
Rate

Local Road Example
Step 7 – Compare Alternatives:
CO
NC
RET
E A
SP
HA
LT

Local Road Example
Step 7 – Compare Alternatives: Concrete Alternate:
Year Type of Work Total Cost Present Worth 0 Initial Construction $373,940 $ 373,940
15 Maintenance $1,125 $ 722 30 Maintenance/Preservation $12,150 $ 5,006 45 Maintenance $2,250 $ 595 60 Maintenance/Preservation $22,050 $ 3,743 75 Maintenance $2,250 $ 245
TOTAL NET PRESENT VALUE: $ 384,250
$𝑃𝑃 = $𝐹𝐹 × � 1
(1 + d)t �
Discount Rate = 3% Present Worth
Future Cost Time of
Expenditure

Local Road Example Step 7 – Compare Alternatives:
Asphalt Alternate:
Year Type of Work Total Cost Present Worth 0 Initial Construction $318,068 $ 318,068 3 Maintenance $1,500 $ 1,373 7 Maintenance $2,000 $ 1,626
15 Maintenance/Preservation $20,000 $ 12,837 22 Maintenance $3,000 $ 1,566 30 Reconstruction $338,068 $ 139,280 33 Maintenance $1,500 $ 566 37 Maintenance $2,000 $ 670 45 Maintenance/Preservation $20,000 $ 5,289 52 Maintenance $3,000 $ 645 60 Reconstruction $338,068 $ 57,381 63 Maintenance $1,500 $ 233 67 Maintenance $2,000 $ 276 75 Maintenance/Preservation $20,000 $ 2,179 82 Maintenance $3,000 $ 266
TOTAL NET PRESENT VALUE: $ 542,254

Local Road Example
Step 7 – Compare Alternatives: Concrete Alternative Initial Cost: $373,940 NPV: $384,250 Asphalt Alternative Initial Cost: $318,068 NPV: $542,254
Initial agency cost for the asphalt alternate is 15% less than that of the concrete alternate. The concrete alternate will cost 29% less (in constant dollars) than the asphalt alternate over the analysis period investigated. 97% of Conc Alt is initial cost, whereas only 59% of Asphalt Alt is initial cost… Conc Alt has a much lower risk of higher-than-expected costs

Impact of Analysis Period
What if analysis period was 30 years or less?

Impact of Time Value of Money
These were both $338k
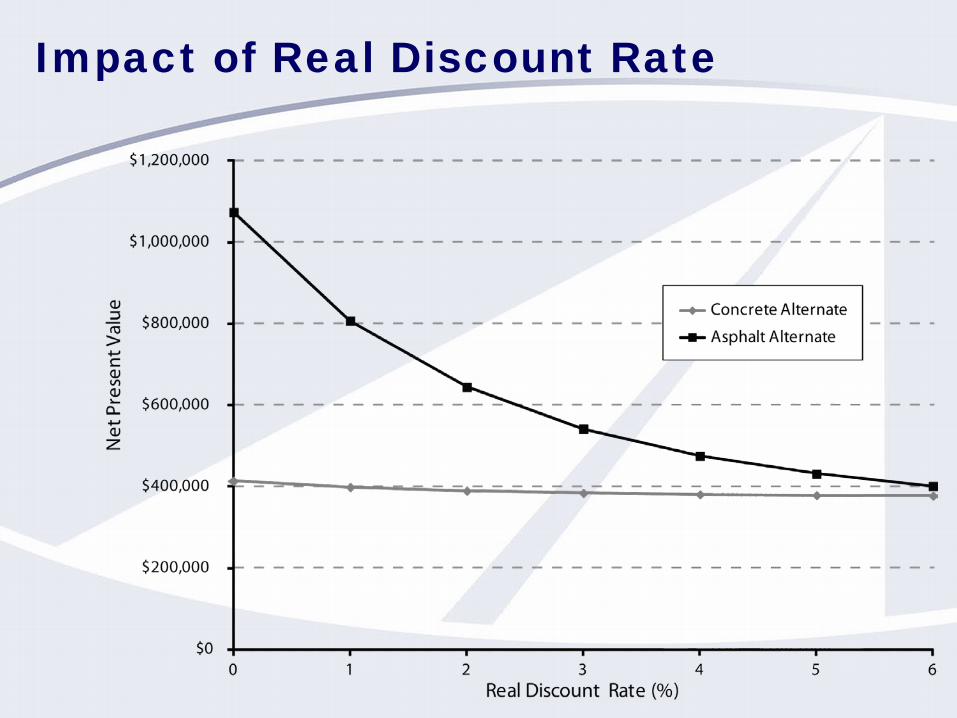
Impact of Real Discount Rate

Impact of Material Inflation
Using MIT escalation factors applied to 40% of the reconstruction (e.g., the pavement portion of the reconstruction cost) of the asphalt alternative at years 30 and 60
The asphalt alternative NPV increases by 9.7% to $594,659, up from the NPV of $542,254 without the material inflation accounting.
Total Cost of Ownership
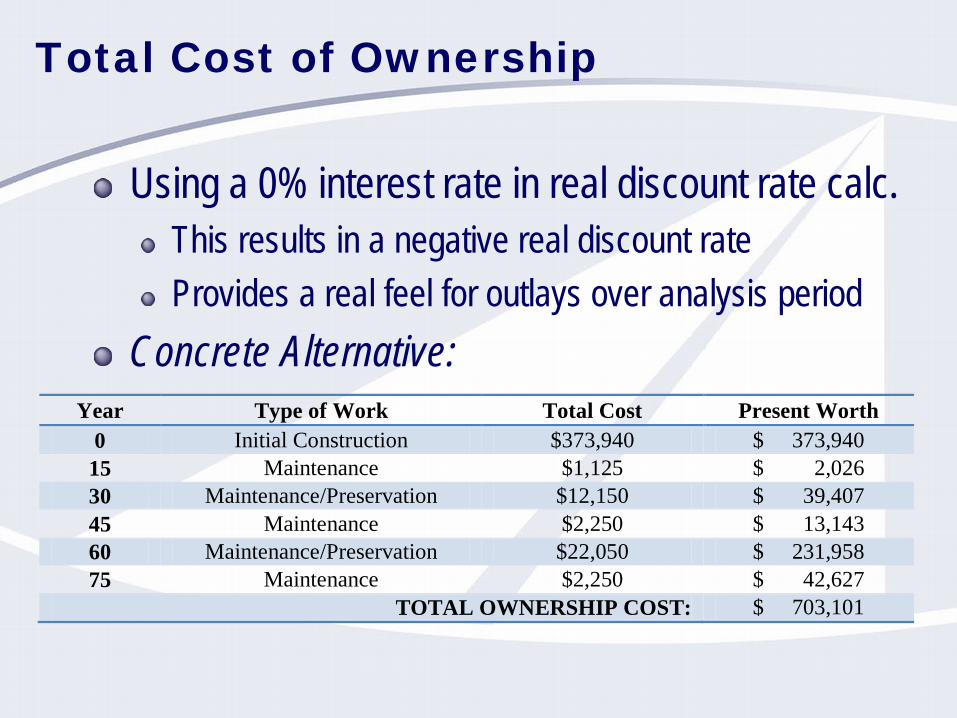
Using a 0% interest rate in real discount rate calc. This results in a negative real discount rate Provides a real feel for outlays over analysis period
Concrete Alternative: Year Type of Work Total Cost Present Worth
0 Initial Construction $373,940 $ 373,940 15 Maintenance $1,125 $ 2,026 30 Maintenance/Preservation $12,150 $ 39,407 45 Maintenance $2,250 $ 13,143 60 Maintenance/Preservation $22,050 $ 231,958 75 Maintenance $2,250 $ 42,627
TOTAL OWNERSHIP COST: $ 703,101

Total Cost of Ownership
Asphalt Alternative: Year Type of Work Total Cost Present Worth
0 Initial Construction $318,068 $ 318,068 3 Maintenance $1,500 $ 1,687 7 Maintenance $2,000 $ 2,632
15 Maintenance/Preservation $20,000 $ 36,019 22 Maintenance $3,000 $ 7.110 30 60% Reconstruction – Non-asphalt $209,763 $ 680,353 30 40% Reconst. – Asphalt @ -5.2% $128,306 $ 639,474 33 Maintenance $1,500 $ 5,473 37 Maintenance $2,000 $ 8,536 45 Maintenance/Preservation $20,000 $ 116,826 52 Maintenance $3,000 $ 23,060 60 60% Reconstruction – Non-asphalt $209,763 $ 2,206,687 60 40% Reconst. – Asphalt @ -5.2% $128,306 $ 3,187,139 63 Maintenance $1,500 $ 17,750 67 Maintenance $2,000 $ 27,687 75 Maintenance/Preservation $20,000 $ 378,919 82 Maintenance $3,000 $ 74,795
TOTAL NET PRESENT VALUE: $ 7,732,216

Impact of Activity Timing Estimate
1%
3%
5%

What Else is in ACPA’s LCCA Engineering Bulletin?
Life-Cycle Cost Analysis

LCCA Examples
Document also contains: Highway and Airport examples Probabilistic analysis results

Applications/Extensions and Appendices
Network-Level Service Life and Economic Analyses Sustainability in the Context of a Life-Cycle Cost Analysis The Role of LCCA in Pavement Type Selection Total Cost of Ownership Example – Mississippi Network of 36 Pavements The Potential Impact of Material Quantity Specifications on LCCA Results Present Worth Calculations and Deterministic Analysis Worksheet Historic Oil Price Trends and Volatility Federal Policy on Pavement Type Selection

Please Visit cshub.mit.edu

Thank you. Questions? FEEDBACK!
Main Website | acpa.org Concrete Wiki | wiki.acpa.org
App Library | apps.acpa.org Desktop Software | software.acpa.org
Resources | resources.acpa.org On-Demand Training | ondemand.acpa.org
Live Online Training | webinars.acpa.org Your Local Contact | local.acpa.org
Robert Rodden, P.E. Senior Director of Pavement Technology
American Concrete Pavement Association [email protected] | 847.423.8706