applying data fusion techniques for benthic habitat mapping and
TRANSCRIPT

ISPRS Journal of Photogrammetry and Remote Sensing 104 (2015) 213–223
Contents lists available at ScienceDirect
ISPRS Journal of Photogrammetry and Remote Sensing
journal homepage: www.elsevier .com/ locate/ isprs jprs
Applying data fusion techniques for benthic habitat mappingand monitoring in a coral reef ecosystem
http://dx.doi.org/10.1016/j.isprsjprs.2014.06.0050924-2716/� 2014 International Society for Photogrammetry and Remote Sensing, Inc. (ISPRS). Published by Elsevier B.V. All rights reserved.
⇑ Tel.: +1 561 297 2648.E-mail address: [email protected]
Caiyun Zhang ⇑Department of Geosciences, Florida Atlantic University, Boca Raton, FL 33431, United States
a r t i c l e i n f o
Article history:Available online 27 June 2014
Keywords:Data fusionMachine learningBenthic habitat mappingHyperspectral imageryObject-based image analysisCoral reef ecosystem
a b s t r a c t
Accurate mapping and effective monitoring of benthic habitat in the Florida Keys are critical in develop-ing management strategies for this valuable coral reef ecosystem. For this study, a framework wasdesigned for automated benthic habitat mapping by combining multiple data sources (hyperspectral, aer-ial photography, and bathymetry data) and four contemporary imagery processing techniques (datafusion, Object-based Image Analysis (OBIA), machine learning, and ensemble analysis). In the framework,1-m digital aerial photograph was first merged with 17-m hyperspectral imagery and 10-m bathymetrydata using a pixel/feature-level fusion strategy. The fused dataset was then preclassified by threemachine learning algorithms (Random Forest, Support Vector Machines, and k-Nearest Neighbor). Finalobject-based habitat maps were produced through ensemble analysis of outcomes from three classifiers.The framework was tested for classifying a group-level (3-class) and code-level (9-class) habitats in aportion of the Florida Keys. Informative and accurate habitat maps were achieved with an overall accu-racy of 88.5% and 83.5% for the group-level and code-level classifications, respectively.� 2014 International Society for Photogrammetry and Remote Sensing, Inc. (ISPRS). Published by Elsevier
B.V. All rights reserved.
1. Introduction
1.1. Importance of Florida Keys and benthic habitat mapping
The Florida Keys, a delicate chain of islands extending from thesouthern tip of Florida, are the third largest barrier reef ecosystemin the world. The keys and their marine environment support a ser-ies of natural habitats including coral reefs, seagrass, and man-groves, which attract many recreational, commercial, andscientific activities. The ecosystem in the Florida Keys has long beenthreatened by global climate change (e.g., ocean warming), humanactivities (e.g., fishing and pollution), hurricanes, and tropicalstorms (Rohmann and Monaco, 2005). The preservation of the Flor-ida Keys ecosystem has become a national priority (Rohmann andMonaco, 2005).
Benthic habitats are places on or near the sea floor where aquaticorganisms live. These beds of seagrass, coral reef, areas of mud, andsand provide shelters to a rich array of animals. It is widely recog-nized the need to map benthic habitats for the reef environmentin order to provide rapid assessment of health and stress responseof these vulnerable ecosystems. A range of research projects has
been conducted in the conservation and management of the FloridaKeys (Florida Keys National Marine Sanctuary, <http://florida-keys.noaa.gov/>), many of which need the benthic habitat informa-tion of this area. Precise mapping of benthic habitats in the FloridaKeys is critical for developing management strategies that balancethe protection of these habitats with their use (Rohmann andMonaco, 2005).
1.2. Application of hyperspectral systems in benthic habitat mapping
Major mapping efforts of benthos in the Florida Keys havefocused on the visual interpretation of fine scale aerial imagerywith assistance from other data sources such as bathymetry data(Rohmann and Monaco, 2005). With the emergence of hyperspec-tral systems, it has been anticipated that this procedure can besuperseded by automated digital image analysis. Hyperspectralsensors collect data in hundreds of relatively narrow spectralbands throughout the visible and infrared portions of the electro-magnetic spectrum. They are more powerful than traditional mul-tispectral sensors in habitat discrimination due to their richradiometric contents. The application of hyperspectral systemshas become an important area of research in characterizing ben-thos in the past decade (e.g., Mishra et al., 2007; Lesser andMobley, 2007; Phinn et al., 2008; Bertels et al., 2008; Fearns
214 C. Zhang / ISPRS Journal of Photogrammetry and Remote Sensing 104 (2015) 213–223
et al., 2011; Pu et al., 2012; Botha et al., 2013; Zhang et al., 2013).However, most of the available hyperspectral sensors such as EO-1/Hyperion and Airborne Visible/InfraRed Imaging Spectrometer(AVIRIS) collect data with a relatively coarse spatial resolution(i.e. 4 m or larger). This may limit their broad applications overregions where the distribution of benthos is highly heterogeneousor communities are present in the form of small patches or linear/narrow shapes (Zhang et al., 2013). Such limitations may be over-come by data fusion techniques, which integrate data and informa-tion from multiple data sources to achieve refined/improvedinformation. With the increasing availability of multi-sensor andmulti-resolution images, data fusion has become a valuable toolin image interpretation (Solberg, 2006; Zhang, 2010). Manyresearchers have combined hyperspectral imagery with LightDetection and Ranging (LiDAR) or Synthetic Aperture Radar (SAR)data to improve land characterization (Zhang and Xie, 2013a).However a synergy of hyperspectral data with fine spatial resolu-tion optical imagery has not been well explored for the same pur-pose. Fusion of hyperspectral imagery, fine spatial resolution aerialphotography, and bathymetry data for mapping and monitoringhabitats in an aquatic environment is even scarcer.
1.3. Classification algorithms in benthic habitat mapping
Image classification is a crucial stage in remote sensing imageanalysis and the selection of classifiers may largely impact the finalresult (Benfield et al., 2007). Previous benthic habitat mappingstudies most commonly applied the traditional image classifierssuch as Maximum Likelihood (ML) (e.g., Mumby and Edwards,2002; Andréfouët et al., 2003; Benfield et al., 2007; Pu et al.,2012; Zapata-Ramírez et al., 2013). ML method requires the spec-tral response of each class to follow a Gaussian distribution, whichis not guaranteed for hyperspectral data. Contemporary machinelearning techniques have received little attention in benthic habi-tat mapping, although they can produce higher accuracies thanML classifier, especially in classifying hyperspectral data (Zhangand Xie, 2012; 2013a,b). There is a need to expand machine leaningtechniques into benthic habitat mapping as an alternative to MLalgorithm.
Previous studies have shown that three machine learning algo-rithms Random Forest (RF), Support Vector Machines (SVMs), andk-Nearest Neighbor (k-NN) are promising in classifying hyperspec-tral imagery (e.g., Ham et al., 2005; Chan and Paelinckx, 2008;Waske et al., 2009; Mountrakis et al., 2010; Zhang and Xie,2013a,b; Zhang et al. 2013). For this study, the performance ofRF, SVMs, and k-NN was evaluated to classify a fused dataset fromhyperspectral imagery, aerial photography, and bathymetry data.The classification results from RF, SVMs, and k-NN may be differentfor each class. A combination of the strengths of each classifier mayhave the potential to achieve a better mapping result throughensemble analysis techniques. Thus, classifier ensemble tech-niques were also evaluated.
1.4. Mapping methods
Most researchers mapped the benthos at the pixel level, whichmay lead to the ‘‘salt-and pepper’’ effect if the mapping area hasdiverse habitats with high spatial heterogeneity. It has been welldocumented that this issue can be overcome by Object-BasedImage Analysis (OBIA) techniques which first decompose an imagescene into relatively homogeneous areas and then classify theseareas instead of pixels. OBIA has been well developed and appliedin terrestrial studies, as evidenced by a review paper from Blaschke(2010). However, such methods have not been utilized sufficientlyin benthic habitat mapping. Benfield et al. (2007) compared theobject- and pixel-based methods in mapping coral reefs and
associated sublittoral habitats using multispectral imagery. Theyfound that object-based classifications can produce more accurateresults than pixel-based approaches. Phinn et al. (2012) applied theOBIA techniques for mapping geomorphic and ecological zones ofcoral reefs. They found that OBIA is effective to explicitly mapregional scale benthic community composition from fine spatialresolution satellite imagery. To produce informative (i.e. withoutsalt-and-pepper effect) habitat maps, the object-based mappingmethods are desirable.
1.5. Objectives of this study
Data fusion, OBIA, machine learning algorithms, and ensembleanalysis have been extensively applied in terrestrial remote sens-ing studies (Waske et al., 2009; Zhang, 2010; Blaschke, 2010; Duet al., 2012), but a combination of these techniques for habitatcharacterization in aquatic environments are limited. For thisstudy, a framework was designed to combine these techniquesfor object-based benthic habitat mapping in the Florida Keys. Inthis framework, a pixel/feature-level fusion strategy was devel-oped to merge 1-m aerial photograph, 17-m AVIRIS imagery, and10-m bathymetry data. Three popular machine learning classifiersRF, SVMs, and k-NN were examined to pre-classify the fused data-set. Final classified habitat maps were produced through ensembleanalysis of outcomes from three machine learning classifiers. Themain objective of this study is to explore whether data fusion tech-niques can improve benthic habitat classification accuracy in acoral reef ecosystem the Florida Keys.
2. Study site and data
2.1. Study site
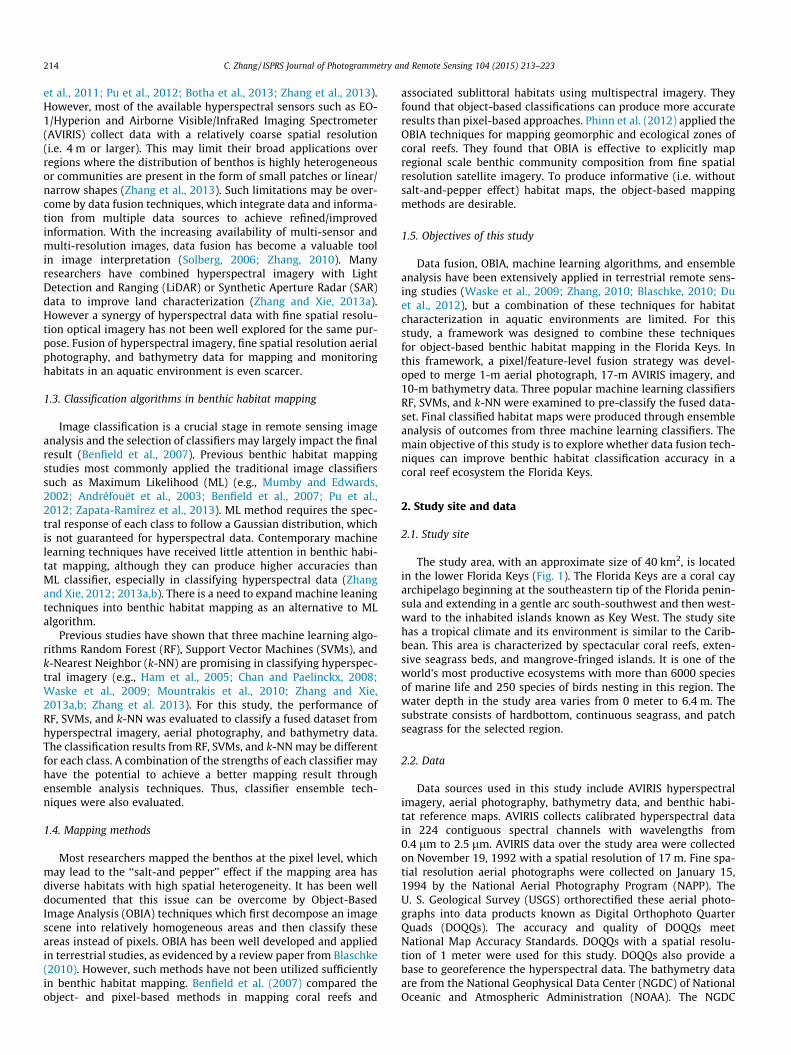
The study area, with an approximate size of 40 km2, is locatedin the lower Florida Keys (Fig. 1). The Florida Keys are a coral cayarchipelago beginning at the southeastern tip of the Florida penin-sula and extending in a gentle arc south-southwest and then west-ward to the inhabited islands known as Key West. The study sitehas a tropical climate and its environment is similar to the Carib-bean. This area is characterized by spectacular coral reefs, exten-sive seagrass beds, and mangrove-fringed islands. It is one of theworld’s most productive ecosystems with more than 6000 speciesof marine life and 250 species of birds nesting in this region. Thewater depth in the study area varies from 0 meter to 6.4 m. Thesubstrate consists of hardbottom, continuous seagrass, and patchseagrass for the selected region.
2.2. Data
Data sources used in this study include AVIRIS hyperspectralimagery, aerial photography, bathymetry data, and benthic habi-tat reference maps. AVIRIS collects calibrated hyperspectral datain 224 contiguous spectral channels with wavelengths from0.4 lm to 2.5 lm. AVIRIS data over the study area were collectedon November 19, 1992 with a spatial resolution of 17 m. Fine spa-tial resolution aerial photographs were collected on January 15,1994 by the National Aerial Photography Program (NAPP). TheU. S. Geological Survey (USGS) orthorectified these aerial photo-graphs into data products known as Digital Orthophoto QuarterQuads (DOQQs). The accuracy and quality of DOQQs meetNational Map Accuracy Standards. DOQQs with a spatial resolu-tion of 1 meter were used for this study. DOQQs also provide abase to georeference the hyperspectral data. The bathymetry dataare from the National Geophysical Data Center (NGDC) of NationalOceanic and Atmospheric Administration (NOAA). The NGDC

Fig. 1. Maps of the Florida Keys and study area shown in a color composite generated from AVIRIS data.
C. Zhang / ISPRS Journal of Photogrammetry and Remote Sensing 104 (2015) 213–223 215
produced a Digital Elevation Model (DEM) with a spatial resolu-tion of 1/3 arc-second (�10 m) for the Florida Keys by combiningmany available elevation data sources (Grothe et al., 2011). Thebenthic habitat reference data were produced through a seven-year project cooperatively conducted by the National OceanzService of NOAA and the Florida Fish and Wildlife Research Insti-tute. In this project benthic habitats were visually interpretedusing stereo analytical plotters from a series of aerial photographscollected between December 1991 and April 1992. Final benthichabitat maps were produced and calibrated through extensivefield data. This dataset was released to the public in 1998(Benthic Habitats of the Florida Keys, <http://flkeysbenthicm-aps.noaa.gov/>). Habitats were classified into 4 major categories(referred to as the group-level classes) and 24 subcategories(referred to as the code-level classes) based on a classificationscheme developed in the project. This dataset is currently servingas the baseline in the management of Florida Keys. Updating thesemaps is difficult because manual interpretation procedure is timeconsuming and labor intensive.
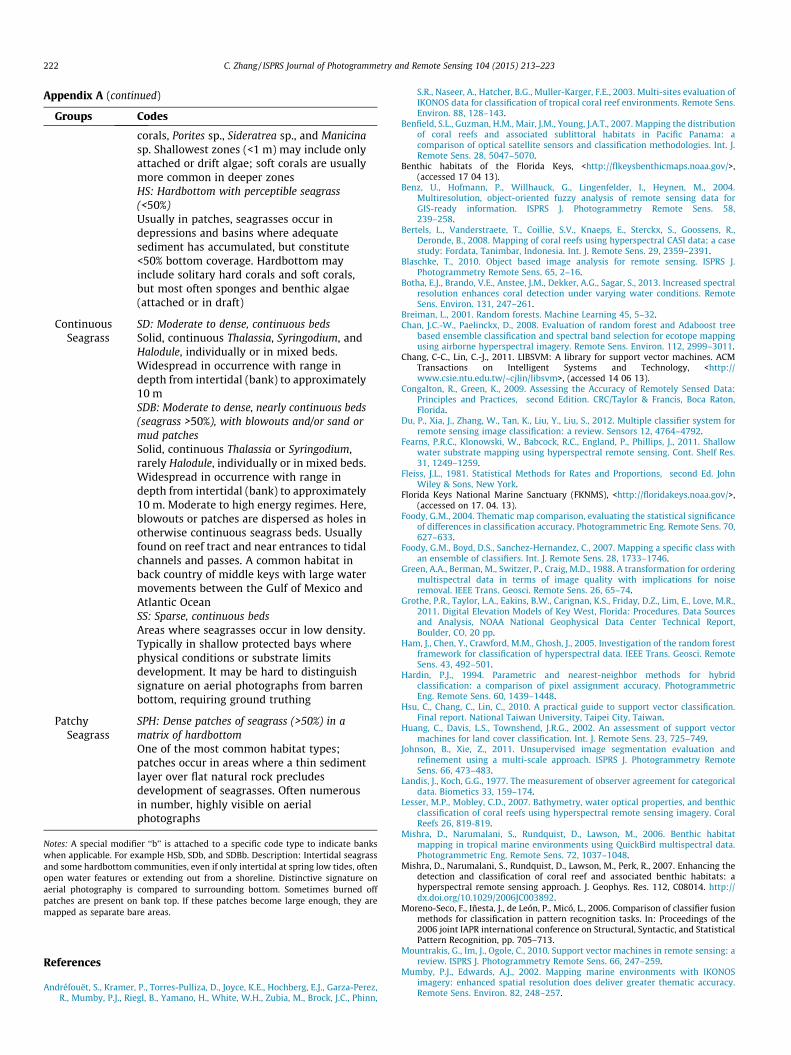
Fig. 3a (top two panels) shows the group- and code-level refer-ence maps for the study site. Three group-level communities werefound: hardbottom, continuous seagrass, and patchy seagrass. Sixcode-level habitats were observed: HC (soft coral, hard coral,sponge, and algae hardbottom), HS (hardbottom with perceptibleseagrass (<50%)), SD (moderate to dense, continuous beds of sea-grass), SDB (moderate to dense nearly continuous beds (sea-grass > 50%), with blowouts and/or sand or mud patches), SPH(dense patches of seagrass (>50%) in a matrix of hardbottom), andSS (sparse continuous beds of seagrass). The code-level habitatslocated over the banks have distinctive signatures on the aerialphotographs, thus they were separately denoted in the referencemap, resulting in three extra codes: HSb, SDb, and SDBb. Descrip-tions of these habitats in the project are listed in the AppendixTable. A total of 786 sample objects were spatially randomlyselected by following a stratified random sampling strategy inwhich a fixed percentage of samples are selected for each class.The number of samples for each class was roughly estimatedbased on the image segmentation result and reference maps.
The image segmentation procedure is detailed in the Methodologysection. The selected sample data were split into two halves withone used for calibration (training) and the other used for valida-tion (testing).
3. Methodology
3.1. Data preprocessing
Spectral channels with a low signal-to-noise ratio and strongwater absorption were dropped from the AVIRIS imagery, leadingto 30 visible bands for further analysis. An image to image rectifi-cation was employed to georeference AVIRIS data with the use ofthe aerial photograph. Non-water areas were masked out usingthe bathymetry data. Hyperspectral data contains a tremendousamount of redundant spectral information. The Minimum NoiseFraction (MNF) method (Green et al., 1988) is commonly used toreduce the high dimensionality and inherent noise of hyperspectraldata. It applies two cascaded principal component analyses, withthe first transformation decorrelating and rescaling noise in thedata, and the second transformation creating coherent eigenimag-es that contain useful information and generating noise-dominatedeigenimages. The transformation generates the eigenvalues andcorresponding eigenimages, both of which are used to determinethe true dimensionality of the data. The MNF transformation wasconducted in ENVI 4.7 and the most useful and spatially coherenteigenimages were selected. Recent study from Zhang et al.(2013) shows that the MNF transformed data of hyperspectralimagery can significantly increase accuracy of benthic habitat clas-sification. Thus only the MNF imagery was considered in furtheranalysis. In benthic habitat mapping, researchers most commonlyconducted three image preprocessing procedures (atmospheric,sun-glint, and water-column corrections) to predict the reflectancefrom the water bottom. Zhang et al. (2013) systematically evalu-ated the impact of three corrections on benthic habitat classifica-tion in the Florida Keys. They found that these threepreprocessing procedures are unnecessary for benthic habitat

Fig. 2. The designed framework to combine hyperspectral imagery, aerial photography, and bathymetry data for benthic habitat mapping.
216 C. Zhang / ISPRS Journal of Photogrammetry and Remote Sensing 104 (2015) 213–223
mapping in the Florida Keys. Thus for this study, three correctionswere not carried out.
3.2. A framework to fuse hyperspectral imagery, aerial photograph,and bathymetry data
Data fusion methods can be grouped into three categories:pixel-level fusion, feature-level fusion, and decision-level fusion(Zhang, 2010). Pixel-level fusion combines raw data from multiplesources into single resolution data to improve the performance ofimage processing tasks. Information may be lost during the dataresampling procedure if the spatial resolution of input data sourcesis different (Solberg, 2006). Feature-level fusion extracts features(e.g., edges, corners, lines, and textures) from each individual datasource and merges these features into one or more feature mapsfor further processing. Combination of these features consists ofcomplex procedures. Decision-level fusion commonly conducts apreliminary classification for each individual data source first,
and then combines the classification results into one outcomebased on a decision fusion strategy.
For this study a framework is designed to combine all three datafusion methods to fuse three data sources, as shown in Fig. 2. In theframework, 1-m aerial photograph is segmented first to generateimage objects and extract object features (i.e. textures). Theextracted features are then combined with pixel-level values ofhyperspectral data to generate a fused dataset. This is achievedby calculating a mean spectrum of hyperspectral pixels whichare geographically within an image object. The mean spectrum isthen integrated with the extracted aerial textures of this imageobject. For the bathymetry data, descriptive statistics (minimum,maximum, mean, and standard deviation) of water depth are cal-culated for each image object. All the derived bathymetric featuresare then combined with textures of aerial photograph and meanspectrum of hyperspectral imagery, leading to a final fused datasetfrom three data sources. The entire fusion procedure is conductedat the object level. Since the final fused dataset is from features ofaerial photography (i.e. textures), bathymetry data (i.e. descriptive

Fig. 3. Habitat maps from (a) reference data and (b) classification results of the fused dataset (hyperspectral imagery, aerial photography, and bathymetry data) and ensembleanalysis of RF, SVM and k-NN.
C. Zhang / ISPRS Journal of Photogrammetry and Remote Sensing 104 (2015) 213–223 217
statistics), and pixels of hyperspectral imagery, the fusion strategyis referred to as a pixel/feature-level fusion scheme. Four advanta-ges are expected from this scheme: (1) no information is lost tocombine three data sources because there is no data resamplingin the procedure; (2) additional object-based texture informationcan be extracted from the aerial photography, which is useful inhabitat classification; (3) small patches and linear/narrow shapehabitats may be delineated due to the fine spatial resolution of aer-ial photography; and (4) classification uncertainties caused by theerrors in the georeference procedure can be reduced. Uncertaintiesand errors in the georeference procedure are unavoidable, whichmay impact the classification results if the pixel-level data fusionscheme is adopted and classification is carried out pixel by pixel.
When the object-based fusion scheme is used here, misalignedhyperspectral pixels occur at the boundary of each object. Thiscan help reduce the classification errors because the informationfrom the entire object is used in the classification, rather thanany individual pixel. Three machine learning algorithms (RF,SVM, and k-NN) are used to pre-classify the final fused dataset.The ultimate outcome is derived through ensemble analysis ofthree classification results using a decision-level fusion strategy.Note that the decision-level fusion strategy is based on classifica-tion results of the fused dataset, rather than making a decisionfrom classification results of the individual data sources. Conse-quently, an object-based habitat map is generated and evaluatedbased on conventional accuracy assessment approaches.

218 C. Zhang / ISPRS Journal of Photogrammetry and Remote Sensing 104 (2015) 213–223
3.3. Image segmentation
Image segmentation is an important step in the framework. Themultiresolution segmentation algorithm in eCognition Developer8.64.1 (Trimble, 2011) was used to generate image objects fromthe aerial photograph. The segmentation algorithm starts withone-pixel image segments, and merges neighboring segmentstogether until a heterogeneity threshold is reached (Benz et al.,2004). The heterogeneity threshold is determined by a user-defined scale parameter, as well as color/shape and smoothness/compactness weights. The image segmentation is scale-dependent,and the quality of segmentation and overall classification are lar-gely dependent on the scale of the segmentation. In order to findan optimal scale for image segmentation, an unsupervised imagesegmentation evaluation approach (Johnson and Xie, 2011) wasused. It begins with a series of segmentations using different scaleparameters, and then identifies the optimal scale using an unsu-pervised evaluation method that takes into account global intra-segment and inter-segment heterogeneity measures. A global scorecombining a normalized weighted variance and Moran’s I value isused to determine the optimal scale for the segmentation. A seriesof segmentations were thus carried out with the scale parameterranging from 2 to 20, at an interval of 2. A scale parameter of 12was found to be optimal for the study site. The weights of theMNF layers were set based on their eigenvalues. Color and shapeweights were set to 0.9 and 1.0 so that spectral information wouldbe considered more heavily for segmentation. Smoothness andcompactness weights were set to 0.5 and 0.5 so as to not favoreither compact or non-compact segments.
Following segmentation, object-based texture features wereextracted. Object-based texture measures from fine spatial resolu-tion imagery have been proved valuable for habitat classification(Andréfouët et al., 2003). Conventional kernel-based texture meth-ods often utilize a fixed-size moving window over which to calcu-late texture measures for each pixel. It is challenging to determinethe appropriate window size. OBIA offers the capability for identi-fying relatively homogeneous regions of varying shapes and sizesin an image. Texture extraction from image objects is more reason-able (Warner, 2011). Such object-based texture measures werethus used in this study. Both first-order and second-order metricsfor each band of the aerial photography were extracted includingmean, standard deviation, contrast, dissimilarity, homogeneity,entropy, and angular second moment. The Grey Level Co-occur-rence Matrix (GLCM) algorithm was used to extract thesecond-order texture measures. The directionally invariant texturemeasures were produced by calculating the mean of the textureresults in all four directions (0�, 45�, 90�, and 135�). Detailed calcu-lations of these texture measures can be found in Trimble (2011).
3.4. Classification algorithms: RF, SVM, and k-NN
RF, SVM, and k-NN algorithms were employed to pre-classifythe fused dataset. RF is a decision tree based ensemble classifier.To understand this algorithm, it is helpful to first know the deci-sion tree approach. The decision tree splits training samples intosmaller subdivisions at ‘‘nodes’’ using decision rules. For each node,tests are performed on the training data to find the most usefulvariables and variable values for split. The RF consists of a combi-nation of decision trees where each decision tree contributes a sin-gle vote for assigning the most frequent class to an input vector. RFincreases the diversity of decision trees to make them grow bychanging the training set using the bagging aggregating(Breiman, 2001). Bagging creates training data by randomly resam-pling the original dataset with replacement. Data selected from theinput sample for generating the next subset is not deleted. Differ-ent algorithms can be used to generate the decision trees. The RF
often adopts the Gini Index (Breiman, 2001) to measure the bestsplit selection. More descriptions of RF can be found in Breiman(2001) and in remote sensing context in Chan and Paelinckx(2008). Two parameters need to be defined in RF: the number ofdecision trees to create (k) and the number of randomly selectedvariables (m) considered for splitting each node in a tree.
SVM is a non-parametric supervised learning classifier. The aimof SVMs is to find a hyperplane that can separate the input datasetinto a discrete predefined number of classes in a fashion consistentwith the training samples (Vapnik, 1995). Research of SVMs inremote sensing has increased in the past decade, as evidenced bya review in Mountrakis et al. (2010). Detailed descriptions of SVMswere given by Huang et al. (2002) in the context of remote sensing.Kernel based SVMs are commonly used for remote sensing imageclassification, among which the radial basis function (RBF) andthe polynomial kernels are frequently employed. RBF needs toset the kernel width (c), and polynomial kernel needs to set thedegree (p). Both kernels need to define a penalty parameter (C) thatcontrols the degree of acceptable misclassification. The setting ofthese parameters can be determined by a grid search strategywhich tests possible combinations of them in a user-defined range(Hsu et al., 2010). The SVM classifier was implemented using aSVM library (LIBSVM) developed by Chang and Lin (2011). Bothkernels were tested to find the best model for the fused dataset.
k-NN is another supervised classifier which identifies objectsbased on the closest training samples in the feature space. Itsearches away from the unknown object to be classified in alldirection until it encounters k user-specified training objects. Itthen assigns the object to the class with the majority vote of theencountered objects. The algorithm requires all the training dataparticipate in each classification, thus has a slow speed of execu-tion for pixel-based classification (Hardin, 1994). However, forthe object-based classification used in this study image objectsare minimum classification units, i.e., classification primitives,instead of individual pixels. The amount of classification primitivesis greatly reduced through the segmentation process. Thereforecomputation complexity is not a problem for implementing thisalgorithm.
3.5. Ensemble analysis
The final classification was conducted through an ensembleanalysis of the outputs from RF, SVM, and k-NN. An ensemble anal-ysis approach is a multiple classification system with the aim toobtain better classification by combining the outputs of severalclassifiers. The classifiers in the system generally should produceaccurate results but show some differences in classification accu-racy (Du et al., 2012). A range of strategies have been developedto combine the outputs from multiple classifiers, such as themajority vote, Bayesian average method, and fuzzy integralapproach. Among these strategies, the majority vote (each individ-ual classifier votes for an unknown input object) is straightforward.The final class label for an input object is determined by the major-ity votes of classifiers. A key problem of the majority vote is that allthe classifiers have equal rights to vote without considering theirperformances on each individual class. A weighting strategy maymitigate this problem by weighting the decision from each classi-fier based on their accuracies obtained from the reference data(Moreno-Seco et al., 2006). In the framework, the majority voteand the weighting strategy is combined to fuse the outputs fromthree classifiers. If three votes are different, then the unknownobject will be assigned to the class which has the highest accuracyamong the classifiers. If two or three classifiers vote the same classfor an input object, then the object will be assigned to the samevoted class.
C. Zhang / ISPRS Journal of Photogrammetry and Remote Sensing 104 (2015) 213–223 219
3.6. Accuracy assessment
The error matrix and Kappa statistic (Congalton and Green,2009) has served as the standard approaches in accuracy assess-ment. I constructed the error matrix and calculated the Kappa sta-tistics for the classifications. The error matrix can be summarizedas an overall accuracy and Kappa value. The overall accuracy isdefined as the ratio of the number of validation samples that areclassified correctly to the total number of validation samples irre-spective of the class. The Kappa value describes the proportion ofcorrectly classified validation samples after random agreement isremoved. To evaluate the statistical significance of differences inaccuracy between different classifications, the nonparametricMcNemar test (Foody, 2004) was adopted. The difference in accu-racy of a pair of classifications is viewed as being statistically sig-nificant at a confidence of 95% if z-score is larger than 1.96.
4. Results
4.1. Results from experimental analysis
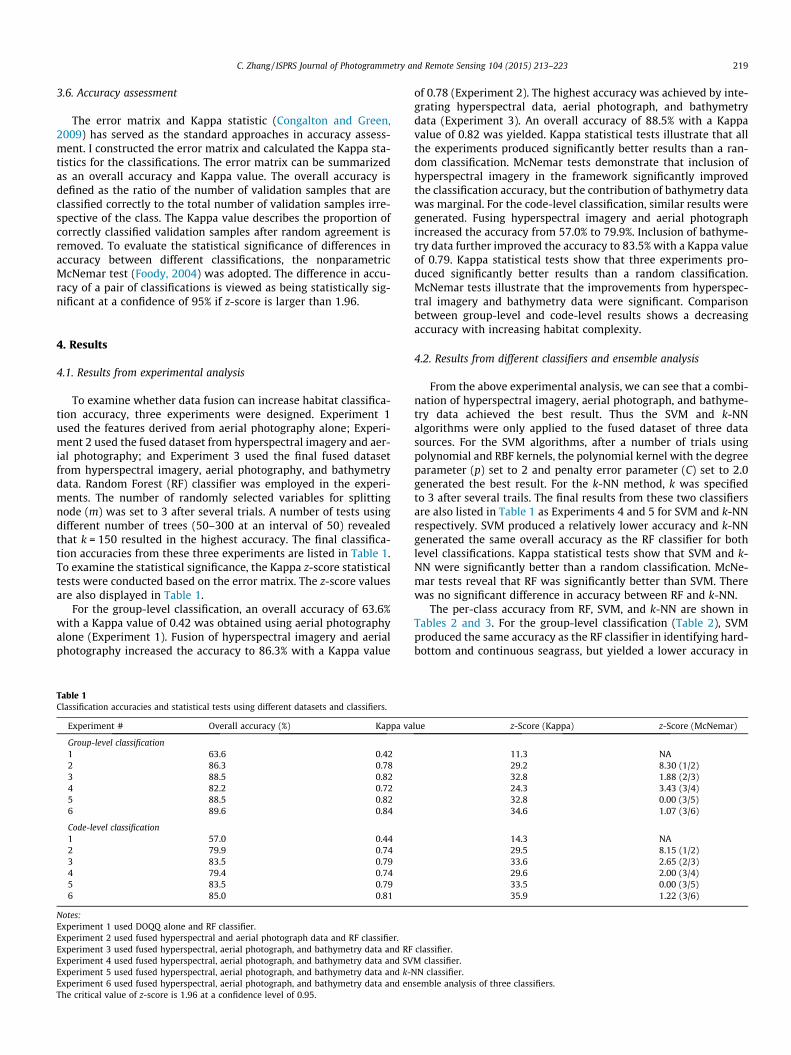
To examine whether data fusion can increase habitat classifica-tion accuracy, three experiments were designed. Experiment 1used the features derived from aerial photography alone; Experi-ment 2 used the fused dataset from hyperspectral imagery and aer-ial photography; and Experiment 3 used the final fused datasetfrom hyperspectral imagery, aerial photography, and bathymetrydata. Random Forest (RF) classifier was employed in the experi-ments. The number of randomly selected variables for splittingnode (m) was set to 3 after several trials. A number of tests usingdifferent number of trees (50–300 at an interval of 50) revealedthat k = 150 resulted in the highest accuracy. The final classifica-tion accuracies from these three experiments are listed in Table 1.To examine the statistical significance, the Kappa z-score statisticaltests were conducted based on the error matrix. The z-score valuesare also displayed in Table 1.
For the group-level classification, an overall accuracy of 63.6%with a Kappa value of 0.42 was obtained using aerial photographyalone (Experiment 1). Fusion of hyperspectral imagery and aerialphotography increased the accuracy to 86.3% with a Kappa value
Table 1Classification accuracies and statistical tests using different datasets and classifiers.
Experiment # Overall accuracy (%) Kappa va
Group-level classification1 63.6 0.422 86.3 0.783 88.5 0.824 82.2 0.725 88.5 0.826 89.6 0.84
Code-level classification1 57.0 0.442 79.9 0.743 83.5 0.794 79.4 0.745 83.5 0.796 85.0 0.81
Notes:Experiment 1 used DOQQ alone and RF classifier.Experiment 2 used fused hyperspectral and aerial photograph data and RF classifier.Experiment 3 used fused hyperspectral, aerial photograph, and bathymetry data and RFExperiment 4 used fused hyperspectral, aerial photograph, and bathymetry data and SVExperiment 5 used fused hyperspectral, aerial photograph, and bathymetry data and k-NExperiment 6 used fused hyperspectral, aerial photograph, and bathymetry data and enThe critical value of z-score is 1.96 at a confidence level of 0.95.
of 0.78 (Experiment 2). The highest accuracy was achieved by inte-grating hyperspectral data, aerial photograph, and bathymetrydata (Experiment 3). An overall accuracy of 88.5% with a Kappavalue of 0.82 was yielded. Kappa statistical tests illustrate that allthe experiments produced significantly better results than a ran-dom classification. McNemar tests demonstrate that inclusion ofhyperspectral imagery in the framework significantly improvedthe classification accuracy, but the contribution of bathymetry datawas marginal. For the code-level classification, similar results weregenerated. Fusing hyperspectral imagery and aerial photographincreased the accuracy from 57.0% to 79.9%. Inclusion of bathyme-try data further improved the accuracy to 83.5% with a Kappa valueof 0.79. Kappa statistical tests show that three experiments pro-duced significantly better results than a random classification.McNemar tests illustrate that the improvements from hyperspec-tral imagery and bathymetry data were significant. Comparisonbetween group-level and code-level results shows a decreasingaccuracy with increasing habitat complexity.
4.2. Results from different classifiers and ensemble analysis
From the above experimental analysis, we can see that a combi-nation of hyperspectral imagery, aerial photograph, and bathyme-try data achieved the best result. Thus the SVM and k-NNalgorithms were only applied to the fused dataset of three datasources. For the SVM algorithms, after a number of trials usingpolynomial and RBF kernels, the polynomial kernel with the degreeparameter (p) set to 2 and penalty error parameter (C) set to 2.0generated the best result. For the k-NN method, k was specifiedto 3 after several trails. The final results from these two classifiersare also listed in Table 1 as Experiments 4 and 5 for SVM and k-NNrespectively. SVM produced a relatively lower accuracy and k-NNgenerated the same overall accuracy as the RF classifier for bothlevel classifications. Kappa statistical tests show that SVM and k-NN were significantly better than a random classification. McNe-mar tests reveal that RF was significantly better than SVM. Therewas no significant difference in accuracy between RF and k-NN.
The per-class accuracy from RF, SVM, and k-NN are shown inTables 2 and 3. For the group-level classification (Table 2), SVMproduced the same accuracy as the RF classifier in identifying hard-bottom and continuous seagrass, but yielded a lower accuracy in
lue z-Score (Kappa) z-Score (McNemar)
11.3 NA29.2 8.30 (1/2)32.8 1.88 (2/3)24.3 3.43 (3/4)32.8 0.00 (3/5)34.6 1.07 (3/6)
14.3 NA29.5 8.15 (1/2)33.6 2.65 (2/3)29.6 2.00 (3/4)33.5 0.00 (3/5)35.9 1.22 (3/6)
classifier.M classifier.N classifier.
semble analysis of three classifiers.

Table 2Group-level per-class accuracy from different classifiers.
Group Accuracy (%)
RF SVM k-NN
Hardbottom 95.6 95.6 95.4Continuous seagrass 77.6 77.6 80.4Patchy seagrass 87.6 63.8 86.7
Table 3Code-level per-class accuracy from different classifiers.
Code Accuracy (%)
RF SVM k-NN
HC 88.9 94.4 88.9HS 92.0 86.2 92.0HSb 76.0 60.0 56.0SD 89.9 86.1 87.3SDb 50.0 57.7 61.5SDB 25.0 62.5 62.5SDBb 92.9 89.3 92.9SPH 67.5 55.0 70.0SS 33.3 33.3 33.3
Table 4Error matrix for the group-level classification.
Group # 1 2 3 Row total PA (%)
1 177 3 1 181 97.82 14 86 7 107 80.43 9 7 89 105 84.8Col. Total 200 96 97 Overall accuracy: 89.6%UA (%) 88.5 89.6 91.6 Kappa value: 0.84
UA: User’s Accuracy; PA: Producer’s Accuracy.Classification result is displayed in row, and the reference data is displayed incolumn.Groups 1–3 represent for hardbottom, continuous seagrass, and patchy seagrassrespectively.
220 C. Zhang / ISPRS Journal of Photogrammetry and Remote Sensing 104 (2015) 213–223
discriminating patchy seagrass. RF produced a higher accuracythan k-NN in discriminating hardbottom and patchy seagrass, butgenerated a lower accuracy in classifying continuous seagrass.Similarly, the accuracies were different among three classifiersfor the code-level classification (Table 3). SVM produced a higheraccuracy than RF in classifying HC and SDB. k-NN yielded a higheraccuracy than RF in identifying SDb and SPH. This suggests thatcombining three methods may improve the classification for theircomplementary strength in classifying different habitats. In fact,the difference in outputs from multiple classifiers is an assumptionof classifier ensemble techniques. The ensemble analysis result isshown as Experiment 6 in Table 1. It indeed increased the accuracyfor both level classifications, although the improvements weremarginal. For the group-level classification, the overall accuracywas increased from 88.5% to 89.6% with a Kappa value of 0.84,while for the code-level classification the overall accuracy wasincreased from 83.5% to 85.0% with a Kappa value of 0.81. ButMcNemar tests show that these improvements were not significantwith a z-score of 1.07 and 1.22 for group-level and code-level clas-sification respectively.
4.3. Object-based habitat mapping
According to Fleiss (1981) Kappa values larger than 0.75 suggeststrong agreement. Landis and Koch (1977) suggest that Kappa val-ues larger than 0.81 indicate an almost perfect agreement. Thedesigned framework produced the Kappa values of 0.84 and 0.81for the group-level and code-level classifications respectively, indi-cating it is effective for benthic habitat mapping in the FloridaKeys. Object-based habitat maps were thus produced using thefinal fused dataset and ensemble analysis of RF, SVM, and k-NN,as shown in Fig. 3b (bottom panels). The object-based habitat mapsare more informative and useful than a traditional pixel-based onethat may be noisy if the study area has a high degree of spatial andspectral heterogeneity. For comparison, the reference maps areshown as Fig. 3a (top panels). There is a general agreement onthe spatial distribution of habitat types between the referenceand classified maps, with many regions accurately denoted. Fur-ther examination reveals some areas were misclassified, such asthe southeast corner in the code-level maps (right panels). It is dif-ficult to determine which map is better given the fact that the ref-erence map was generated by manual interpretation and
compilation of aerial photos. Errors and uncertainties are alsounavoidable in the interpretation procedure. The error matrixesfor the classified maps are displayed in Tables 4 and 5. For thegroup-level classification, the producer’s accuracies (PA) changedfrom 80.4% to 97.8% and the user’s accuracies (UA) varied from88.5% to 91.6% (Table 4). For the code-level classification, the PAvaried from 33.3% to 94.4% and the UA changed from 58.8% to100% (Table 5).
5. Discussion and summary
5.1. Benefits of data fusion in benthic habitat mapping
Most benthic habitat mapping studies examine single datasource or compared the applicability of multiple data sources.Examples include the application of fine spatial resolution satelliteimagery collected from IKONOS or QuickBird (e.g., Mumby andEdwards, 2002; Andréfouët et al., 2003; Mishra et al., 2006;Phinn et al., 2012; Zapata-Ramírez et al., 2013). Few attempts havebeen made to combine multiple data sources in the mappingefforts. Using very high spatial resolution aerial imagery (4 m orsmaller) alone could not produce adequate accuracy for a finedescriptive detail (Benfield et al., 2007). This is also confirmed bythis study. High spectral resolution hyperspectral imagery is usefulin discriminating habitat communities at a finer detail, but itsmoderate spatial resolution may limit its broader application. Tomitigate this problem, a combination of two data sources wasexamined. Hyperspectral imaging relies primarily on spectral fea-tures to discriminate covers, whereas very fine spatial resolutionimagery relies more on spatially invariant features to identify tar-gets (Shaw and Burke, 2003). A combination of two sources shouldhave better performance in habitat mapping. The study illustratesthat the integration of very high spatial resolution aerial imageryand hyperspectral data has a good performance in habitat classifi-cation. Water depth is believed to be an important factor that influ-ences benthic covers in a reef environment (Bertels et al., 2008)and has been frequently included in the manual mapping proce-dure (e.g., Rohmann and Monaco, 2005). This drives the inclusionof bathymetry data in the framework. The study indicates thatthe contribution of bathymetry data is statistically significant forthe code-level classification, but not significant for the group-levelclassification. The fused dataset from three data sources has beenproved more powerful for habitat classification. The designed datafusion scheme is able to complement the shortages and takeadvantage of the benefits of each individual data source. The devel-oped pixel/feature-level fusion strategy successfully combines thespatial features of aerial photograph, spectral contents of hyper-spectral imagery, and elevation information of bathymetry dataat the object level. Small patches and habitat types with linear/narrow shapes could be better discerned with the fused data.

Table 5Error matrix for the code-level classification.
Code HC HS HSb SD SDb SDB SDBb SPH SS Row Total PA (%)
HC 17 1 18 94.4HS 1 127 7 2 1 138 92.0HSb 1 3 20 1 25 80.0SD 5 71 2 1 79 89.9SDb 2 5 3 15 1 26 57.7SDB 3 3 2 8 37.5SDBb 2 1 53 56 94.6SPH 7 2 3 1 27 40 67.5SS 1 1 1 3 33.3Col. Total 20 145 34 82 19 3 60 29 1 Overall accuracy: 85.0%UA (%) 85.0 87.6 58.8 86.6 79.0 100.0 88.3 93.1 100.0 Kappa value: 0.81
UA: User’s Accuracy; PA: Producer’s Accuracy.Classification result is displayed in row, and the reference data is displayed in column.
C. Zhang / ISPRS Journal of Photogrammetry and Remote Sensing 104 (2015) 213–223 221
5.2. Advantages of machine learning classifiers and ensemble analysis
Previous benthic habitat mapping research focuses on the appli-cation of Maximum Likelihood method which could not producehigh accuracy, especially in classifying the fused dataset from mul-tiple data sources. A recent study from Zhang et al. (2013) illus-trates that RF is able to produce higher classification accuracythan Maximum Likelihood in benthic habitat mapping usinghyperspectral imagery. The RF classifier was adopted for this studyto further examine its performance. Another two machine learningalgorithms, SVM and k-NN, was also explored here. All three clas-sifiers had a good performance. The RF and k-NN achieved thesame classification accuracy and the SVM present a comparableresult with RF and k-NN. Three classifiers showed a diversity inper-class accuracy, which is primarily caused by the discrepanciesin concepts of three methods. RF looks for optimal decision trees togroup data, whereas SVMs look for the optimal hyperplane to cat-egorize data and k-NN searches for the best match to denoteinputs. Note that the classification diversity is the basic assump-tion of ensemble systems, which drives me to explore the potentialof an ensemble analysis. Indeed the ensemble approach achievedhigher classification accuracy than three classifiers used. Theimprovement, however, was marginal and insignificant. Althoughthe difference in accuracy was not statistically significant, theensemble approach can provide some complementary informationto the error matrix of the classified maps (Zhang, 2014). An indexof classification uncertainty can be derived based on the votes ofthe classifiers. For example, if three votes are same for an inputimage object, a value of 3 will be assigned to this object. Converselya value of 2 or 1 will be assigned to an input image object whentwo votes are same or three votes are completely different. Thistype of uncertainty maps is useful when there is a desire to mini-mize the omission or commission errors. It also can be used toguide the post-classification fieldwork (Foody et al., 2007).
5.3. Summary
In summary, a framework was designed to combine three datasources (hyperspectral, aerial photography, and bathymetry data)and four data processing techniques (data fusion, Object-basedImage Analysis, machine learning, and ensemble analysis) for ben-thic habitat mapping in a coral reef ecosystem. A pixel/feature-level fusion strategy was developed to integrate three data sources.The framework was applied to map the benthic habitats in theFlorida Keys. An overall accuracy of 89.6% and 85.0% was achievedat the group-level (3 classes) and code-level (9 classes) classifica-tions. The designed framework has potential to map habitats overlarger areas, because the spaceborne hyperspectral sensors (e.g.,
EO-1/Hyperion) and very fine spatial resolution multispectral sen-sors (e.g., QuickBird and IKONOS) have similar spatial and spectralcharacteristics as the data used in this study (i.e. AVIRIS and aerialphotography). Bathymetry data is also available for the FloridaKeys as well as many other coral reef areas. The in-orbit EO-1/Hyperion is providing 30-m hyperspectral imagery with 220 bandsto the public at no cost. NAPP collects fine spatial resolution aerialphotos at the national level with an approximate time frequency offive years, and also provides free high quality DOQQ data to thepublic. Local government agencies frequently collect large-scaleaerial photography in the Florida Keys for coral reef protectionand conservation. The framework is assumed to be useful for mon-itoring coral reefs, building or updating benthic habitat maps atreduced expenses using multiple data sources.
The framework can be also applied for the land cover classifica-tion with minor modifications to combine very high spatial resolu-tion aerial photography, high spatial resolution (20–30 m)hyperspectral imagery and other data sources such as LiDAR,DEM, and geo-environmental data. A recent study from Zhangand Xie (2013a) finds that fusing hyperspectral imagery withDOQQ data can increase mapping accuracy of vegetation in a het-erogeneous wetland environment. For benthic habitat mapping,inclusion of water quality parameters in the framework may fur-ther improve the classification accuracy. Similarly, combiningmore advanced classifiers such as neural networks may be helpfulas well. In addition, considerable additional work is needed toinvestigate whether the developed framework can be used in othershallow waters. These will be major dedications in the future work.It is anticipated that this study can benefit the global coral reefmonitoring and mapping in general, and the Florida Keys inparticular.
Appendix A
Descriptions of the habitats found in the selected study area (fromBenthic Habitats of the Florida Keys, <http://flkeysbenthicm-aps.noaa.gov/>).
Groups
CodesHardbottom
HC: Soft coral, hard coral, sponge, algaeBenthic community (no perceptible seagrass)is variable and typically a function ofsediment, water, depth, and exposure to windand current. It may also include solitary hard(continued on next page)
222 C. Zhang / ISPRS Journal of Photogrammetry and Remote Sensing 104 (2015) 213–223
Appendix A (continued)
Groups
Codescorals, Porites sp., Sideratrea sp., and Manicinasp. Shallowest zones (<1 m) may include onlyattached or drift algae; soft corals are usuallymore common in deeper zonesHS: Hardbottom with perceptible seagrass(<50%)Usually in patches, seagrasses occur indepressions and basins where adequatesediment has accumulated, but constitute<50% bottom coverage. Hardbottom mayinclude solitary hard corals and soft corals,but most often sponges and benthic algae(attached or in draft)
Continuous SD: Moderate to dense, continuous beds
Seagrass Solid, continuous Thalassia, Syringodium, andHalodule, individually or in mixed beds.Widespread in occurrence with range indepth from intertidal (bank) to approximately10 mSDB: Moderate to dense, nearly continuous beds(seagrass >50%), with blowouts and/or sand ormud patchesSolid, continuous Thalassia or Syringodium,rarely Halodule, individually or in mixed beds.Widespread in occurrence with range indepth from intertidal (bank) to approximately10 m. Moderate to high energy regimes. Here,blowouts or patches are dispersed as holes inotherwise continuous seagrass beds. Usuallyfound on reef tract and near entrances to tidalchannels and passes. A common habitat inback country of middle keys with large watermovements between the Gulf of Mexico andAtlantic OceanSS: Sparse, continuous bedsAreas where seagrasses occur in low density.Typically in shallow protected bays wherephysical conditions or substrate limitsdevelopment. It may be hard to distinguishsignature on aerial photographs from barrenbottom, requiring ground truthing
PatchySeagrass
SPH: Dense patches of seagrass (>50%) in amatrix of hardbottomOne of the most common habitat types;patches occur in areas where a thin sedimentlayer over flat natural rock precludesdevelopment of seagrasses. Often numerousin number, highly visible on aerialphotographs
Notes: A special modifier ‘‘b’’ is attached to a specific code type to indicate bankswhen applicable. For example HSb, SDb, and SDBb. Description: Intertidal seagrassand some hardbottom communities, even if only intertidal at spring low tides, oftenopen water features or extending out from a shoreline. Distinctive signature onaerial photography is compared to surrounding bottom. Sometimes burned offpatches are present on bank top. If these patches become large enough, they aremapped as separate bare areas.
References
Andréfouët, S., Kramer, P., Torres-Pulliza, D., Joyce, K.E., Hochberg, E.J., Garza-Perez,R., Mumby, P.J., Riegl, B., Yamano, H., White, W.H., Zubia, M., Brock, J.C., Phinn,
S.R., Naseer, A., Hatcher, B.G., Muller-Karger, F.E., 2003. Multi-sites evaluation ofIKONOS data for classification of tropical coral reef environments. Remote Sens.Environ. 88, 128–143.
Benfield, S.L., Guzman, H.M., Mair, J.M., Young, J.A.T., 2007. Mapping the distributionof coral reefs and associated sublittoral habitats in Pacific Panama: acomparison of optical satellite sensors and classification methodologies. Int. J.Remote Sens. 28, 5047–5070.
Benthic habitats of the Florida Keys, <http://flkeysbenthicmaps.noaa.gov/>,(accessed 17 04 13).
Benz, U., Hofmann, P., Willhauck, G., Lingenfelder, I., Heynen, M., 2004.Multiresolution, object-oriented fuzzy analysis of remote sensing data forGIS-ready information. ISPRS J. Photogrammetry Remote Sens. 58,239–258.
Bertels, L., Vanderstraete, T., Coillie, S.V., Knaeps, E., Sterckx, S., Goossens, R.,Deronde, B., 2008. Mapping of coral reefs using hyperspectral CASI data; a casestudy: Fordata, Tanimbar, Indonesia. Int. J. Remote Sens. 29, 2359–2391.
Blaschke, T., 2010. Object based image analysis for remote sensing. ISPRS J.Photogrammetry Remote Sens. 65, 2–16.
Botha, E.J., Brando, V.E., Anstee, J.M., Dekker, A.G., Sagar, S., 2013. Increased spectralresolution enhances coral detection under varying water conditions. RemoteSens. Environ. 131, 247–261.
Breiman, L., 2001. Random forests. Machine Learning 45, 5–32.Chan, J.C.-W., Paelinckx, D., 2008. Evaluation of random forest and Adaboost tree
based ensemble classification and spectral band selection for ecotope mappingusing airborne hyperspectral imagery. Remote Sens. Environ. 112, 2999–3011.
Chang, C-C., Lin, C.-J., 2011. LIBSVM: A library for support vector machines. ACMTransactions on Intelligent Systems and Technology, <http://www.csie.ntu.edu.tw/~cjlin/libsvm>, (accessed 14 06 13).
Congalton, R., Green, K., 2009. Assessing the Accuracy of Remotely Sensed Data:Principles and Practices, second Edition. CRC/Taylor & Francis, Boca Raton,Florida.
Du, P., Xia, J., Zhang, W., Tan, K., Liu, Y., Liu, S., 2012. Multiple classifier system forremote sensing image classification: a review. Sensors 12, 4764–4792.
Fearns, P.R.C., Klonowski, W., Babcock, R.C., England, P., Phillips, J., 2011. Shallowwater substrate mapping using hyperspectral remote sensing. Cont. Shelf Res.31, 1249–1259.
Fleiss, J.L., 1981. Statistical Methods for Rates and Proportions, second Ed. JohnWiley & Sons, New York.
Florida Keys National Marine Sanctuary (FKNMS), <http://floridakeys.noaa.gov/>,(accessed on 17. 04. 13).
Foody, G.M., 2004. Thematic map comparison, evaluating the statistical significanceof differences in classification accuracy. Photogrammetric Eng. Remote Sens. 70,627–633.
Foody, G.M., Boyd, D.S., Sanchez-Hernandez, C., 2007. Mapping a specific class withan ensemble of classifiers. Int. J. Remote Sens. 28, 1733–1746.
Green, A.A., Berman, M., Switzer, P., Craig, M.D., 1988. A transformation for orderingmultispectral data in terms of image quality with implications for noiseremoval. IEEE Trans. Geosci. Remote Sens. 26, 65–74.
Grothe, P.R., Taylor, L.A., Eakins, B.W., Carignan, K.S., Friday, D.Z., Lim, E., Love, M.R.,2011. Digital Elevation Models of Key West, Florida: Procedures. Data Sourcesand Analysis, NOAA National Geophysical Data Center Technical Report,Boulder, CO, 20 pp.
Ham, J., Chen, Y., Crawford, M.M., Ghosh, J., 2005. Investigation of the random forestframework for classification of hyperspectral data. IEEE Trans. Geosci. RemoteSens. 43, 492–501.
Hardin, P.J., 1994. Parametric and nearest-neighbor methods for hybridclassification: a comparison of pixel assignment accuracy. PhotogrammetricEng. Remote Sens. 60, 1439–1448.
Hsu, C., Chang, C., Lin, C., 2010. A practical guide to support vector classification.Final report. National Taiwan University, Taipei City, Taiwan.
Huang, C., Davis, L.S., Townshend, J.R.G., 2002. An assessment of support vectormachines for land cover classification. Int. J. Remote Sens. 23, 725–749.
Johnson, B., Xie, Z., 2011. Unsupervised image segmentation evaluation andrefinement using a multi-scale approach. ISPRS J. Photogrammetry RemoteSens. 66, 473–483.
Landis, J., Koch, G.G., 1977. The measurement of observer agreement for categoricaldata. Biometics 33, 159–174.
Lesser, M.P., Mobley, C.D., 2007. Bathymetry, water optical properties, and benthicclassification of coral reefs using hyperspectral remote sensing imagery. CoralReefs 26, 819-819.
Mishra, D., Narumalani, S., Rundquist, D., Lawson, M., 2006. Benthic habitatmapping in tropical marine environments using QuickBird multispectral data.Photogrammetric Eng. Remote Sens. 72, 1037–1048.
Mishra, D., Narumalani, S., Rundquist, D., Lawson, M., Perk, R., 2007. Enhancing thedetection and classification of coral reef and associated benthic habitats: ahyperspectral remote sensing approach. J. Geophys. Res. 112, C08014. http://dx.doi.org/10.1029/2006JC003892.
Moreno-Seco, F., Iñesta, J., de León, P., Micó, L., 2006. Comparison of classifier fusionmethods for classification in pattern recognition tasks. In: Proceedings of the2006 joint IAPR international conference on Structural, Syntactic, and StatisticalPattern Recognition, pp. 705–713.
Mountrakis, G., Im, J., Ogole, C., 2010. Support vector machines in remote sensing: areview. ISPRS J. Photogrammetry Remote Sens. 66, 247–259.
Mumby, P.J., Edwards, A.J., 2002. Mapping marine environments with IKONOSimagery: enhanced spatial resolution does deliver greater thematic accuracy.Remote Sens. Environ. 82, 248–257.

C. Zhang / ISPRS Journal of Photogrammetry and Remote Sensing 104 (2015) 213–223 223
Phinn, S., Roelfsema, C., Dekker, A., Brando, V., Anstee, J., 2008. Mapping seagrassspecies, cover and biomass in shallow waters: an assessment of satellitemultispectral and airborne hyper-spectral imaging systems in Moreton Bay(Australia). Remote Sens. Environ. 112, 3413–3425.
Phinn, S.R., Roelfsema, C.M., Mumby, P.J., 2012. Multi-scale, object-based imageanalysis for mapping geomorphic and ecological zones on coral reefs. Int. J.Remote Sens. 33, 3768–3797.
Pu, R., Bell, S., Meyer, C., Baggett, L., Zhao, Y., 2012. Mapping and assessing seagrassalong the western coast of Florida using Landsat TM and EO-1 ALI/Hyperionimagery. Estuar. Coast. Shelf Sci. 115, 234–245.
Rohmann, S. O., Monaco, M. E., 2005. Mapping Southern Florida’s Shallow-waterCoral Ecosystems: An Implementation Plan. NOAA Technical MemorandumNOS NCCOS 19. NOAA/NOS/NCCOS/CCMA. Silver Spring, MD.
Shaw, G.A., Burke, H.K., 2003. Spectral imaging for remote sensing. Lincoln Lab. J. 14,3–28.
Solberg, A.H.S., 2006. Data fusion for remote sensing applications. In: Chen, C.H.(Ed.), Signal and Image Processing for Remote Sensing. CRC Press, Boca Raton,FL, pp. 515–537.
Trimble, 2011. eCognition Developer 8.64.1 reference book.Vapnik, V.N., 1995. The Nature of Statistical Learning Theory. Springer-Verlag, New
York.Warner, T., 2011. Kernel-based texture in remote sensing image classification.
Geography Compass 5, 781–798.Waske, B., Benediktsson, J.A., Árnason, K., Sveinsson, J.R., 2009. Mapping of
hyperspectral AVIRIS data using machine-learning algorithms. Can. J. RemoteSens. 35, S106–S116.
Waske, B., Fauvel, M., Benediktsson, J. A., Chanussot, J., 2009. Machine learningtechniques in remote sensing data analysis. In: G. Camps-Valls and L. Bruzzone(Eds.), Kernel Methods for Remote Sensing Data Analysis, John Wiley & Sons Ltd,Chichester, UK. doi:10.1002/9780470748992.ch1.
Zapata-Ramírez, P.A., Blanchon, P., Olioso, A., Hernandez-Nuñez, H., Sobrino, J.A.,2013. Accuracy of IKONOS for mapping benthic coral-reef habitats: a case studyfrom the Puerto Morelos Reef National Park, Mexico. Int. J. Remote Sens. 34,3671–3687.
Zhang, J., 2010. Multi-source remote sensing data fusion: status and trends. Int. J.Image Data Fusion 1, 5–24.
Zhang, C., 2014. Combining hyperspectral and LiDAR data for vegetation mapping inthe Florida Everglades. Photogrammetric Engineering & Remote Sensing 80, 21–31.
Zhang, C., Xie, Z., 2012. Combining object-based texture measures with a neuralnetwork for vegetation mapping in the Everglades from hyperspectral imagery.Remote Sens. Environ. 124, 310–320.
Zhang, C., Xie, Z., 2013a. Data fusion and classifier ensemble techniques forvegetation mapping in the coastal Everglades. Geocarto Int. http://dx.doi.org/10.1080/10106049.2012.756940.
Zhang, C., Xie, Z., 2013b. Object-based vegetation mapping in the Kissimmee Riverwatershed using HyMap data and machine learning techniques. Wetlands 33,233–244.
Zhang, C., Selch, D., Xie, Z., Roberts, C., Cooper, H., Chen, G., 2013. Object-basedbenthic habitat mapping in the Florida Keys from hyperspectral imagery.Estuar. Coast. Shelf Sci. 134, 88–97.