applied spectroscopy broadband optical properties of … 0from different raw milk samples, ......
TRANSCRIPT

Broadband optical properties of milkApplied SpectroscopyXX(X):1–14c©The Authors 2016
Reprints and permission:sagepub.co.uk/journalsPermissions.navDOI: 10.1177/ToBeAssignedwww.sagepub.com/
Sabrina Stocker1, Florian Foschum1, Philipp Krauter1, Florian Bergmann1,Ansgar Hohmann1, Claudia Scalfi Happ1 and Alwin Kienle1
AbstractDairy products play an important role in our daily nutrition. As a turbid scattering medium with different kinds of particlesand droplets, each alteration of these components changes the scattering properties of milk. The goal of this work is thedetermination of the amount of main scattering components, the fat droplets and the casein micelles, by understandingthe light propagation in homogenized milk and in raw milk. To provide the absolute impact of these milk components,the geometrical and optical properties such as the size distribution and the refractive index of the components have tobe examined.We determined the reduced scattering coefficient µ′s and the absorption coefficient µa from integrating spheremeasurements. By use of a collimated transmission setup, the scattering coefficient µs was measured. Sizemeasurements were performed to validate the influence of the fat droplet size on the results of the scattering properties,also the refractive index of both components was determined by the said coefficients. These results were used todetermine the absolute impact of the milk components on the scattering behavior. By fitting Mie theory calculations onscattering spectra µs and µ′s from different raw milk samples, it was possible to get reliable values for the concentrationsof fat and casein and for the size of the fat droplets. By destroying the casein micelles, it was possible to separate theinfluence of the different scattering components on scattering behavior.
Keywordsmilk, refractive index, scattering, reduced scattering, absorption, casein micelles, Mie theory
IntroductionMilk and other dairy products are some of the mostimportant ingredients in everyday foods and beverages.Although the components of milk are well known, there isno regularly used technique to determine the constituentsof raw milk samples on-line at the farms. Commercialdevices to determine the fat and protein content via Fouriertransform infrared measurements exist, however, they cannotbe used to measure the milk components on-line during e.g. amilking process, because separating of the samples fromthe storage vessel and a calibration of the device by thecompany are necessary. Nevertheless, by determination ofthe constituents in process monitoring and quality assurancein dairy industries and at the farms, the health of cows andthe economical value of the milk could be analyzed.A lot of examinations of milk products via opticalmeasurements were performed in the preceding years.The number of publications concerning milk ascendedespecially with the focus on sensing the concentrationsof fat and protein. For best use of resources, an opticalsensor should be implemented to determine the compositionof milk in every step from the farmers raw milk to thebottling of homogenized ultra high temperature (UHT) milkwithout dilution or separation of a sample and withoutthe need for calibration. Recently, a lot of effort wasput into investigating commercial or homogenized milkusing different methods, using hyperspectral imaging,1 laserlight scattering ,2,3 olique incidence reflectometry,4 spatiallyresolved diffuse reflectance spectroscopy,5,6 transmission
mode spectroscopy,7 Photon Time-Of-Flight Spectroscopy8
or using diluted milk samples in an angular resolved setup.9
All these techniques showed correlations of the fat contentand the scattering properties of milk. Tsenkova10 measuredraw milk without any homogenization just as Aernouts11
and Bogomolov,12 but in their methods a statisticalclassification is necessary to determine the fat and proteincontent. Aernouts13 published similar integrating spheremeasurements as presented here where they determined thereduced scattering coefficient, the scattering coefficient andthe absorption coefficient of different undiluted raw milksamples and found correlations of these coefficients andthe fat and protein content. In Aernouts,14 they add thetheoretical description of the light propagation using Mietheory to present µs, µ′s and µa as well as the size distributionof the scatterers. Lately, Abildgaard15 published diffusereflectance measurements to estimate particle sizes of fatemulsions. Similar to our work, they used a fitting procedureon the reduced scattering coefficient based on Mie theory.In our work, the refractive indices of both milk fat dropletsand casein micelles were determined to make the theoreticaldescription of the light propagation more reliable. Further
1Institut fur Lasertechnologien in der Medizin und Meßtechnik,Helmholtzstr. 12, D-89081 Ulm, Germany
Corresponding author:Sabrina StockerEmail: [email protected]
Prepared using sagej.cls [Version: 2015/06/09 v1.01]
2 Applied Spectroscopy XX(X)
we provide a more sophisticated analysis of the lightpropagation by fitting Mie theory to the measured datain order to determine the concentrations of fat and caseinand the size of the fat droplets of different milk samplesabsolutely. The examined milk samples differ from the onesused in Aernouts14 with regard to the kind of milk samples,since we investigated raw milk samples from differentcows and at different times during the milking process.The raw milk samples were special treated to destroy thecasein micelles, so the influence of the casein micelles onthe scattering behavior could be investigated. Furthermore,raw milk samples after different homogenization steps areregarded.The geometrical and optical parameters of the componentsof milk, such as the particle size distribution (PSD) of thescatterers, their refractive indices (RI) and the concentrationsof the scatterers, have to be known to describe the lightpropagation in milk by Mie theory assuming the scatteringparticles to be spherical. However, some of these parametersvary in each sample of milk. We examined the influenceof all parameters relevant for Mie theory to identify theconstant properties and the changing determinants to reducethe fit parameters. We found that the remaining numberof fit parameters for the Mie theory calculations are theconcentrations of fat and protein as well as the mean sizeof the fat globules for raw milk.At first, an introduction to milk and published values ofdifferent parameters are given in Sec. Materials and Methodstogether with the used materials, the applied setups and theused Mie theory algorithm. In the results section, we show atfirst the examination of the particle sizes of the fat dropletsand the casein micelles. In the next subsection we presentthe determination of the refractive index of both, the resultswere used in the following Mie theory calculations. Then, themeasurements of the scattering coefficient µs are presented.Different samples of raw milk were measured as well assamples of raw milk after different homogenization times.Mie theory was fitted to the measurement data to estimatethe absolute impact of the changing parameters. At the endof this section, the influence of the casein micelles on µsis shown. Subsequently, the reduced scattering coefficientsof different milk sample series are presented: Raw milkafter different homogenization times was measured, Mietheory was again fitted to the results. The effect of thecasein micelles on µ′s is also shown in this subsection.The absorption coefficient of milk in the wavelength rangefrom 400 nm to 1300 nm was measured and the results arediscussed in the last section. The discussion is included inthe results section, because some of the discussed results areused in later evaluations.
Materials and Methods
The three main components of milk beside water are lipids,protein and lactose. They form a specific mixture of asolution (lactose, whey protein), a dispersion (casein protein)and an emulsion (lipids). To simulate light propagationin milk correctly, the shape, the size distribution, and therefractive index of the scatterers and the surrounded mediumhave to be known. The particles which are responsible forthe turbidity of milk are mainly the lipid droplets and the
insoluble part of the proteins, the casein micelles. The latterrepresent about 80% of the proteins in milk.16 Besides, thereare whey proteins, which are fully dissolved, just like lactose.They form the milk serum, which is a clear transparentmedium with a RI of 1.342 (589.3 nm).17 To simulate thelight propagation, the interaction of optical radiation withhomogeneous spheres can be calculated using Mie theory.18
It is applied for the fat droplets and the casein micelles withmilk serum as a surrounding medium (with the RI of 1.342and the dispersion of the RI of water.19)
Lipids Lipids are important nutrients for humans. The milkfat forms spherical droplets with sizes of a few hundrednanometers20 up to 10 µm.21 In raw milk, the size of thedroplets differs between different cows, time in milkingprocess or lactation state. Also the concentration of milkfat in raw milk varies ranging from 2% up to 8%. Thisdepends on the cattle breed (typically: cow, buffalo, goat orsheep),22,23 the health of the animals24,25,11 or the lactationstate.26
The fat globules form a fairly stable emulsion, one of thereasons for that is the thin protein layer around each globule,acting as emulsifier.27 An emulsifier has a hydrophilic partand a lipophilic part. To reduce the diameter of these globulesan ultrasonic treatment can be applied. Since a change in sizeof the fat droplets comes along with a change of the surfacearea of the fat droplets, the effect of homogenization may notonly depend on the homogenization power and the time, butalso on the concentration of the emulsifier.
Casein The casein protein, which comprises about 80%of the protein in milk, consists of four main types, namelyα1-, α2-, β- and κ-casein. These four proteins togetherform a solid spherical formation, which is called a micelle.Shape, structure and size of these micelles are describedin the literature,16,28,29,30,31,32 but some of the data arecontradictory. However, whether the micelles consist ofsmall spherical sub-micelles or if they form a radiallysymmetric structure has not been shown yet. As alreadyshown in literature, the diameters of the casein micellesvary in a wide range from 50 nm31 to 680 nm.33 The meandiameter differs between 120 nm31 up to 230 nm.29 Themicelle structure subsists only in liquids. By drying thedispersion the micelles change their geometry.
Sample and preparation’Non-fat’ milk To determine the RI of the casein micelles andto examine the scattering properties of the micelles in milk,deep-frozen milk samples were used. These standards with afat content of 0.03% and a protein content of 3.15% wereextracted by QSE GmbH, Germany.
Extracted milk fat For the determination of the RI of milkfat, commercial butter was heated up to 60 ◦C to separate thefat phase from the water phase and to get a liquid sample. Themeasurements were done on the liquid sample just beforeit stiffed. In modern manufacturing, the fat for commercialbutter is separated by a centrifuge and heat-treated. This cancause a small error in the RI compared to the RI of milkfat from untreated milk. The fat could also be separatedfrom milk by chemical methods, but since the chemicalsdissolve in the fat phase, this will change the refractive index
Prepared using sagej.cls
Stocker et al. 3
more considerable. Remaining ingredients in the fat phaseof butter are β-carotene or riboflavin, which occurs in a lowconcentration and this conforms to the ingredients in the fatphase of cow milk.
Raw milk Raw milk from dairy cows was used. In onemeasurement series, the milk from three cows was measured.Two samples were taken from each cow, one at the beginningand one at the end of the milking process. For anothermeasurement series with raw milk, a mixture from the milkstorage vessel was used. The milk was not older than 3days. The fat content was determined by the Rose-Gottliebmethod.34 For homogenization experiments, the milk wastreated by a Sonifier 450 homogenizer (Branson, Germany).Samples of 400 g each were treated for times from 0minto 25min. During the sonification, the milk container wassurrounded by an ice-water bath to reduce heating of thesample.For some measurements, raw milk was mixed withethylenediaminetetraacetic acid (EDTA) to denaturate thecasein micelles. EDTA destroys the calcium phosphatenanoclusters inside the casein micelles, whereby the caseinmicelles denaturate. Thereby one EDTA molecule acts asa chelating agent for one Ca2+,35 so the amount of therequired EDTA was calculated through the known amountof substances of casein in the milk samples. Afterwards,the casein proteins are dissolved and do not give rise to thescattering anymore.
Experimental methodsCollimated transmission setup The extinction coeffi-cient µt is determined by measuring the collimated transmis-sion in a setup similar to that already published.36 The setupnow consists of a halogen light source, two lenses and twodiaphragms to create a collimated beam. This beam passesa cuvette with the thickness D (changeable with regard tothe scattering properties of the sample), which is filled withthe liquid sample. One enhancement compared to the setupof36 is a small integrating sphere with an aperture of 5mmand an attached spectrometer which collects the unscatteredlight. The integrating sphere is located in a distance of420mm from the sample to make sure mostly unscatteredlight is detected by the spectrometer. The effect of stronglyforward scattered light was examined by simulations with theexact geometry of our setup. Assuming a Henyey-Greensteinphase function, for high anisotropy factors (where the effectshould be relevant) about 0.98 (e.g. for the large milk fatdroplets) the error is below 5%. For an anisotropy factor of0.9 the error is already 0.03%. We measure the intensities ofthe collimated transmitted light and calculate the extinctioncoefficient
µt(λ) = −1
Dln
(Isample
Ireference
), (1)
which combines the loss of the intensity caused byabsorption and scattering. The raw milk samples were dilutedwith an EDTA solution. The milk concentration of thesamples was 0.1% or 0.2%. For the measurements a cuvettewith a thickness of 10mm was used. ’Non-fat’ milk sampleswere measured undiluted with a cuvette thickness of 0.1mm.
Integrating sphere setup A single integrating spheresystem consisting of a halogen lamp (Osram, Germany),a commercial sphere (Labsphere, US) with a diameter of25.4 cm and two spectrometers (Maya2000 Pro, OceanOptics, US, from 180 nm to 1100 nm and NIRQuest512,Ocean Optics, US, from 900 nm to 1700 nm) were appliedto determine the total transmittance and the total reflectanceof the sample slice. Two adjacent ports (each 2.54 cm indiameter) are utilized to align sample and reference (SRS99,Spectralon, US) in equatorial plane to perform measurementswith a comparison method without using any correctionfactors.We use a baffle between sample and reference to preventthe direct interactions between both. The total transmittanceand the total reflectance were obtained by illuminatingsubsequently the sample and the reference by an imagedbeam. The signal of the hemispherical intensity is detectedusing an optical fiber (numerical aperture NA = 0.22) atthe north pole of the sphere connected to the spectrometers.For evaluation of the optical properties, namely the reducedscattering coefficient µ′s = µs(1− g) with the anisotropyfactor g and the absorption coefficient µa, an inverse addingdoubling (IAD) program37 as well as Monte Carlo (MC)simulations can be used. The former is an approximationwith idealized irradiation geometry and infinite lateralsample extension. For the milk measurements, the results ofthe IAD program and the MC simulations differ marginally,so the IAD program was used for the evaluation becauseit is faster. To determine µ′s and µa from the measureddata, which is the remission and transmission spectra of theintegrating sphere, we need to use the refractive index of thesample (we used for milk 1.34 calculated from Walstra38
with the wavelength dispersion of water19) and the usedcuvette, the thickness of both, the beam diameter and thegeometry and reflectance properties of the used integratingsphere including the port diameters.
Fit of Mie theory The Mie theory algorithm used isimplemented in Delphi (Embarcadero Technologies, Inc.,US). The algorithm handles polydispersity by dividing thePSD in nine discrete sampling points for particle size valuesfor which the scattering coefficient is calculated and summedup. The parameters necessary for the calculation of thescattering coefficient by Mie theory are the mean diameterand the width of a log-normal size distribution (which isused for milk), the volume concentration and the complexrefractive index of the scatterers. The complex part of therefractive index indicates the absorption coefficient. Sincethe complex part is by the factor of 10−5 smaller than thereal part, the complex part is neglected.For the measurements of the collimated transmission themilk samples were diluted, hence, no dependent scatteringwas considered. For the integrating sphere measurements,dependent scattering can influence the results and has notbeen considered in our calculations. It is reported thatdependent scattering can decrease the scattering coefficientby about 5% comparing a two-fold dilution to the purestate.14 However, the occurrence does not only dependon the concentration of the scatterers, Voit39 found thatderivations due to dependent scattering remain small, evenfor concentrations up to 20% for particle size of 2 µm and
Prepared using sagej.cls

4 Applied Spectroscopy XX(X)
a refractive index of 1.59. We expect dependent scatteringbecause of the small particles in milk, like the caseinmicelles or homogenized fat droplets, hence, the influenceof dependent scattering on the scattering coefficient shouldlead to a greater variance at small wavelengths. This effecthas to be examined in further studies.For the fit the ’lsqcurvefit’ nonlinear least-square solver fromthe optimization toolbox in Matlab (The Mathworks, Inc.,US) is used. For numerical calculation of finite-differencegradients a minimum change in variables of 10−4 has beenchosen. Depending on the goal of the measurement differentfit parameters were used like the Cauchy coefficients of theRI, the PSD or the volume concentration.
Results
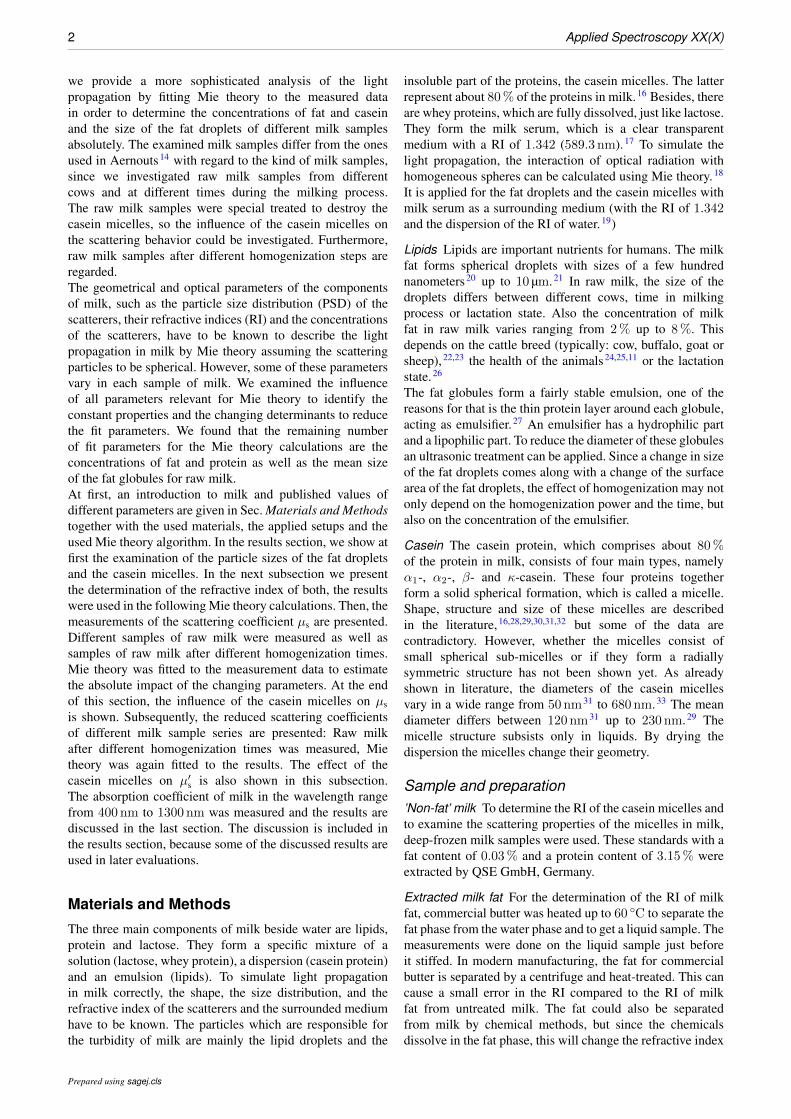
Particle sizesMilk fat droplets Firstly, we regard the size of the milk fatdroplets that is measured with a Mastersizer (Malvern, UK).The refractive index was chosen in the Mastersizer softwareto be 1.4564 for the particles and 1.33 for the dispersant.We used the default refractive index of this software,because it differs negligible from the value we determined(see next section: n = 1.459 (633 nm)). The ’polydispers’analysis model in the software of the Mastersizer wasadjusted. The results of milk samples during an ultrasonichomogenization process and the results of milk samplesfrom three cows at the beginning and at the end of themilking process are shown in Fig. 1. All samples weretreated with EDTA. We found that the size distribution ofthe fat droplets in fresh raw milk has the shape of a log-normal distribution. During the homogenization process,the Gaussian peak does not shift to smaller sizes with afixed width, but a second peak arises at small sizes. So, abimodal distribution describes the results properly duringthe whole homogenization process. For untreated milk thesmaller peak seems to be an artifact of the measured data,since the milk was treated by EDTA which destroys thecasein micelles and the size distribution is calculated by thescattered light based on laser diffraction analysis, particlessmaller than the size range of the Mastersizer can affect thesize distribution. This assumption is affirmed by the fit ofthe scattering spectra, which is shown later, where the peakof smaller sizes vanishes for untreated milk. However, themeasurements show that bigger fat droplets directly reduceto smaller sizes, so the mean diameter do not decreaselinearly with the homogenization time. The PSD of the fatdroplets for different cows can also be described with a log-normal distribution. The mean diameter of the smaller fatdroplets (left peak) stayed almost constant, which solidifiesthe assumption of an artifact. The mean diameter of the largerfat droplets (right peak) varied in a range of about 1 µm. Thewidth of the log-normal size distribution of the right peakand the mean diameter of the droplets stayed approximatelythe same for each cow from the beginning to the end ofthe milking process. These results are later used to compareand discuss the results of the fit procedures on the scatteringmeasurements.
Casein micelles For determining the PSD of the caseinmicelles, we applied a Zetasizer Nano (Malvern, UK).
Figure 2. Measured RI values (crosses) of milk fat extractedfrom butter at seven different wavelengths. The parameters Ifat,Jfat and Kfat were fitted such that Cauchy’s equation (solid line)matches the results. For comparison, literature data are plotted.
It detects the backscattered light and uses Mie theoryto generate the size distribution assuming spheres. Forthis experiment we used commercial skim milk. For thedetermination of the PSD of the casein micelles, the defaultRI values from the Zetasizer software were used as therewere for the continuous medium (1.33) and for the scatteringmaterial (1.45). From this measurement we got a meandiameter of 189 nm. The validity of the assumption of amonomodal distribution is shown through the polydispersityindex of 0.072, which shows that we have a narrowdistribution. In the case the polydispersity index is above 0.1,it is no longer called a monomodal distribution.For an exact value, the shape of the distribution and theRI of the particles should be fully variable and the sampleshould only consist of casein micelles. Here, commercialskim milk was used, which contained remaining milk fatdroplets. These droplets were expected to have a similar sizeto the casein micelles, because commercial milk is usuallyskimmed using a centrifuge, so fat droplets with similarweights and sizes to the casein micelles will remain inthe skim milk. As a consequence, it cannot be guaranteedthat the result was not distorted by the fat droplets.To verify this value, we used the mean diameter later,see subsection Refractive index, as a fit parameter whilematching Mie calculations with µs and µ′s concurrently ofthe same sample. Therewith, we determined the PSD of thecasein micelles with the mean diameter dm = 211 nm andthe width of the log-normal distribution of σ = 0.201. Theseresults are similar to the ones of the Zetasizer, but there weused a different skim milk sample.
Refractive index
Milk fat To determine the RI of milk fat, the method recentlydescribed was used.40 The result of the measurement and thefit are shown in Fig. 2. The Cauchy’s equation
n(λ) = Ifat + Jfat ·10−3 nm2
λ2+Kfat ·
10−4 nm4
λ4(2)
Prepared using sagej.cls
Stocker et al. 5
Figure 1. Size distribution of milk fat droplets measured with the Malvern Mastersizer. The solid line connecting the data pointsshall serve as a guide to the eye. The size distributions can be described by a bimodal log-normal distribution. a. During ahomogenization process after the homogenization steps of 0min (circles), 3min (squares), 6min (diamonds), 8min (triangles)and 20min (stars). b. For different cows each one sample from the beginning of the milking process (circles) and one from the end(diamonds).
with the parameters Ifat, Jfat and Kfat was used to describethe RI dispersion of the milk fat. In the used method, therefractive angle is measured. The large errorbars at thewavelengths 420 nm and 450 nm were caused by the highabsorption at these wavelengths, so the intensity of thelight beam is attenuated and an exact determination of theangle was not as reliable as for the longer wavelengths.For the other wavelengths up to 700 nm, Cauchy’s equationdescribes the data well. The results for the fit parametersare Ifat = 1.4505, Jfat = 3.157 and Kfat = 1.0654. Thepresented values are consistent with those given in theliterature.21,41,20 However, no data for the dispersion of theRI could be found. Here, we note that the RI dispersiondescribed with the Cauchy’s equation is an approximation.However, since the absorption of fat is sufficiently low in theNIR range and because of the Kramers-Kronig relation, thechange of the RI is assumed to be low. Hence, we assume theextrapolation of the RI formula to be a good approximationand use it for wavelengths up to 1300 nm.
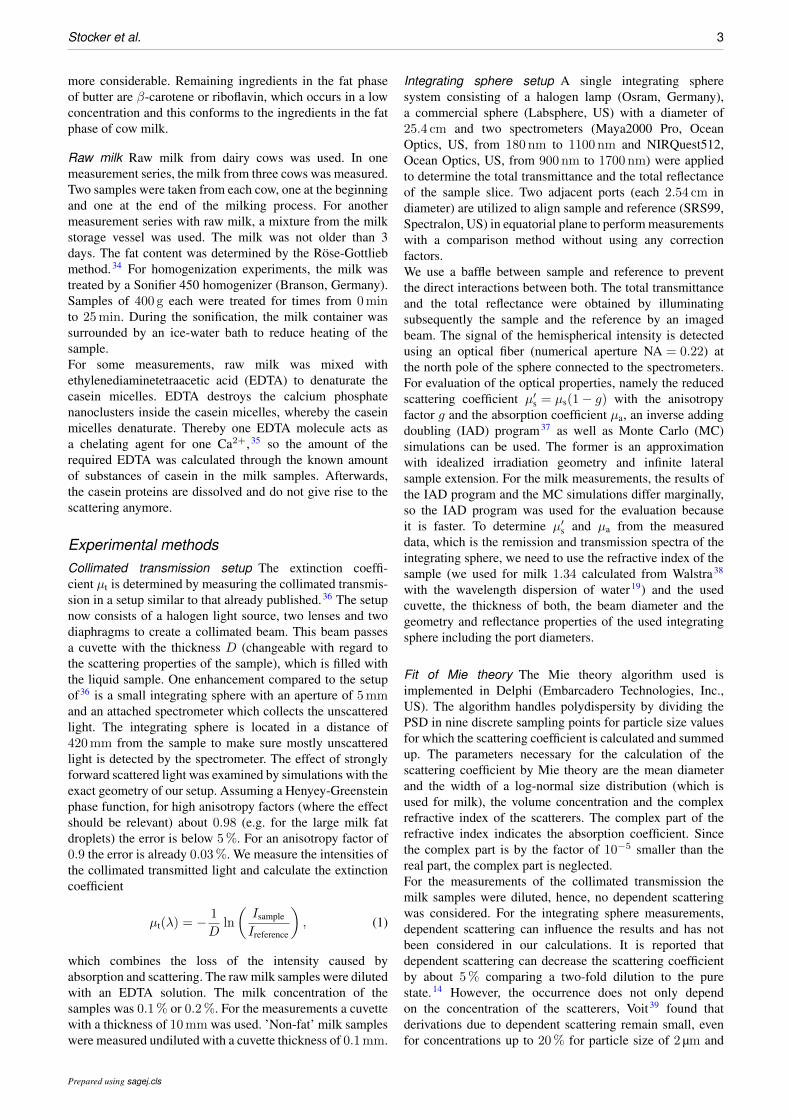
Casein micelles In order to determine the RI of caseinmicelles, we used ’non-fat’ milk samples. The collimatedtransmission of the ’non-fat’ milk samples was measured toget the scattering coefficient µs since we assume µa � µs.The integrating sphere setup was used to get the reducedscattering coefficient µ′s. Scattering coefficients calculatedby Mie theory are fitted concurrent to the data from theintegrating sphere and the collimated transmission assumingcasein micelles and the remaining lipids as scatterers. Thiswas done to involve the information of the particle size bythe anisotropy factor. For the fat concentration, the valuegiven by QSE, Germany, was applied. For the lipids, weused a log-normal distribution of the droplets with thesmall mean diameter dm,fat = 300 nm and the logarithmicwidth σfat = 0.05, since we assume that mainly the smalldroplets will remain when skimming milk by a centrifuge,however, the influence will be low because of the small fatconcentration. The scattering coefficient is calculated by theweighted sum of all impacts of the different particle sizes.
Figure 3. Measured scattering coefficient µs (circles) with fittedMie theory (solid line) and measured reduced scatteringcoefficient µ′
s (diamonds) with fitted Mie theory (dashed line) ofnon-fat milk (upper part). Resulting Cauchy distribution obtainedfrom the µs-values with the parameters Icasein = 1.38,Jcasein = 6.83 and Kcasein = − 0.33 (solid line) and from theµ′
s-values with the parameters Icasein = 1.36, Jcasein = 24.59and Kcasein = − 18.39 (dashed line) (lower part). Here, noliterature data is plotted because of wide discrepancy.
The RI of milk fat as described above was used and the RIof the milk serum was taken from the literature.38 The RI ofthe casein micelles is described by the Cauchy coefficientsIcasein, Jcasein and Kcasein defined as
n(λ) = Icasein + Jcasein ·103 nm2
λ2+Kcasein ·
108 nm4
λ4(3)
In Fig. 3, µs and µ′s are presented as well as the results of thefitted Mie theory. The results for the RI obtained from bothcoefficients are shown in the lower part. The casein micellesare assumed to be spherical particles with a homogeneous RI.This assumption is feasible as long as the regarded particles
Prepared using sagej.cls

6 Applied Spectroscopy XX(X)
are smaller than the wavelength of the light, since in thiscase light cannot resolve the exact structure of the particles.For the measurements of µs a thin cuvette with a thicknessof 0.1mm and undiluted ’non-fat’ skimmed milk was used,since we observed that the scattering coefficient changesand hence presumably the structure of casein micelles isaffected when diluting the sample to milk concentrationsbelow 5%, which was not the case for measurements of othersuspensions e.g. polystyrene or silica colloids. The resultsshown for µs are the measured extinction coefficients, sincewe assume µa � µs. For the measurement, integrationtimes of 500ms were used and each measurement wasaveraged over 100 repetitions. For the measurements of µ′s,the sample was also undiluted. The data shown is the averageof 10 repetitions.Since the size distribution of the casein micelles could notbe determined reliably by the Zetasizer, the mean diameterdm and the width σ were also used as fit parametersassuming a log-normal distribution. The PSD of the caseinmicelles was the same in both samples, so we combinedboth measurements and calculated µs and µ′s mutually withMie theory. For both scattering coefficients, the same dmand σ was assumed. To get information on the reliabilityof the results of the RI, the Cauchy parameters Icasein,1,Jcasein,1 and Kcasein,1 as analogous defined in Eq. 3 werecalculated using the values of µs and µ′s separately. Theconfidence intervals of the parameters Icasein,1 and Icasein,2are below 1%. Although the results of Jcasein and Kcasein areless reliable, the result of the refractive index is still valuablesince the absolute value is substantial and it differs clearlyfrom the published value.The fit yields dm = 211 nm and σ = 0.201 for the caseinmicelles. The resulting diameter is within the reportedinterval of 120 nm31 to 230 nm.29 The width shows acomparative broad distribution as expected and presentedbefore.31,33 The results for the RI of both scatteringexperiments agree quite well. For short wavelengths, thevalues show differences up to 0.04. For longer wavelengths,the difference is reduced. Thus, the dispersion of the RI donot fit exactly, this could be explained by the spectral shapeof the scattering coefficient. Because of the small sizes of thecasein micelles, the scattering coefficient at low wavelengthsis comparatively high, so the signal is low and stray light inthe spectrometer could affect the signal in this region.As a result, a mean dispersion of the RI of the casein micellescan be given as:
n(λ) = 1.372 + 15.71 · 103 nm2
λ2− 9.36 · 10
8 nm4
λ4. (4)
This result differs clearly from the only found measuredvalue for casein micelles reported in Griffin42 (1.57 at600 nm). In Attaie22 a value of 1.503 (at 589 nm) for the RIof casein micelles was determined, which is distinctly lowerthan the value of Griffin42 and closer to our result. In a laterpublication a value of 1.462 at 589 nm is assumed,5 but notverified. According to the explanation in the section on the RIof milk fat, we use this result in the following calculations ofMie theory in a wavelength range of 400 nm to 1300 nm.
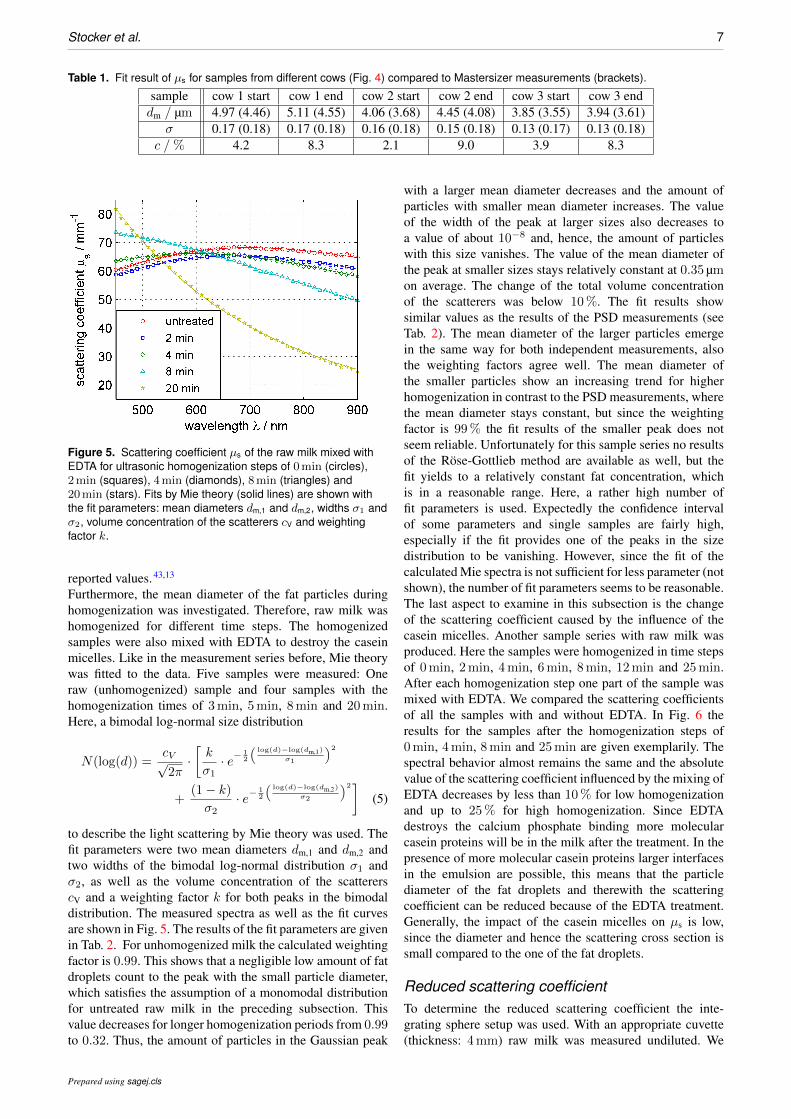
Figure 4. Scattering coefficient µs of the raw milk mixed withEDTA of three different cows (circles, squares, diamonds). Foreach cow one sample at the beginning (unfilled symbols) andone sample at the end (filled symbols) of the milking process isgiven. Fits of Mie theory (solid lines) are shown with the fitparameters: mean diameter dm, width σ and concentration cV.
Scattering coefficient
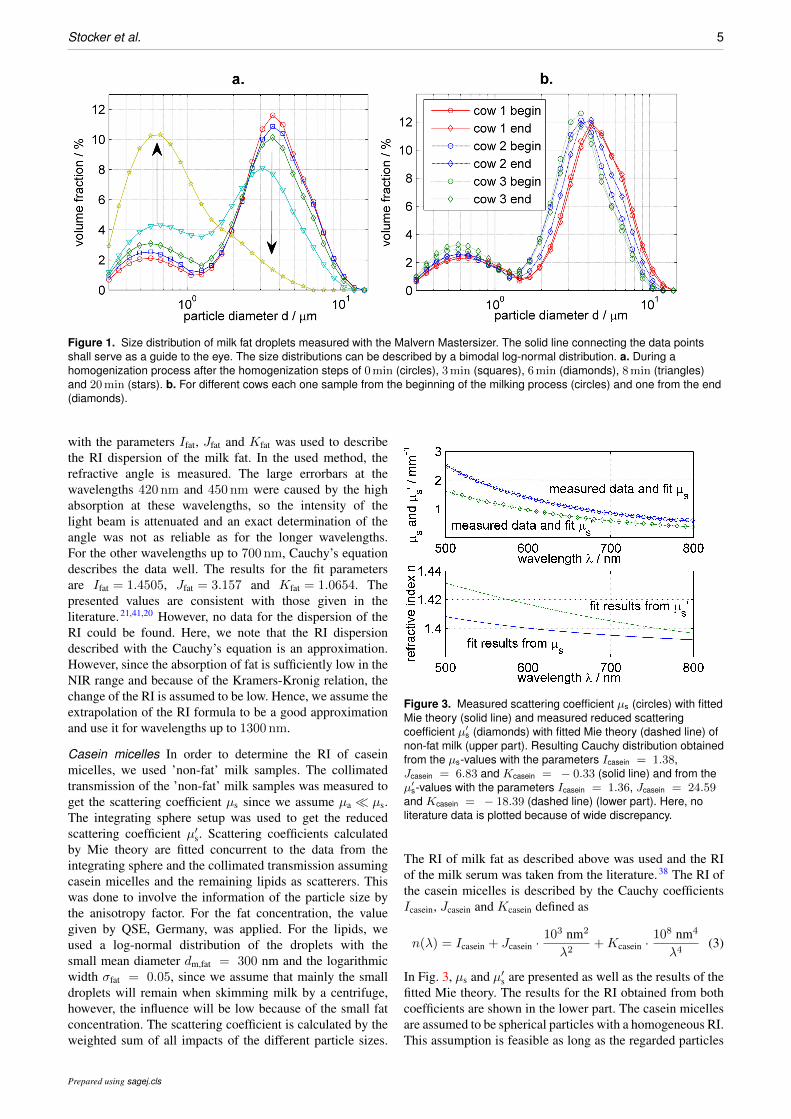
The results of the raw milk samples of different cows(samples already discussed in the section Particle sizes)are presented first. We focused on the change of the fatglobules size, so the samples were mixed with EDTA. Theresult of µs and the fitted Mie spectra are shown in Fig. 4.The resulting fit parameter are given in Tab. 1. To quantifythe change of the fat globule sizes for different cows weused a monomodal log-normal size distribution to describethe scattering coefficient with Mie theory. The trial of amonomodal distribution is motivated, because of the leftpeak in the size measurements to be an artifact and fit resultsof a bimodal distribution to µs from raw milk samples whichis described later. The fit parameters were the mean diameterof the size distribution dm, the dimensionless width σ and theconcentration of the scatterers cV. The confidence intervalsof the fit parameters are below 3%. This is not shownin Fig. 4 for better readability. The mean diameter affectsthe light propagation immensely. A small variation of themean diameter changes the spectral scattering behavior in asimilar way as a large change of the particle concentrationdoes. This means that a small change for example about5% in dm cannot be separated from a change in cV by thefit algorithm. Only larger variations of the mean diametercompare cow 1 and cow 3 (change of about 25%) changethe shape of the scattering coefficient discernible. The resultsof the mean diameter emerge in the same way as expectedfrom the PSD measurements (see Tab. 1). The fit as wellas the PSD measurements show that the mean diameter andthe width of the size distribution of the fat particles staywithin 10% for each particular cow. The fat content in themilk during the milking process changes strongly. At thebeginning of each milking process it was lower than thefat content at the end for each cow, at least by a factor oftwo. The fitted fat concentrations change between 2.1% and9%. Unfortunately this fit result cannot be verified by valuesof the Rose-Gottlieb method, but the range coincides with
Prepared using sagej.cls
Stocker et al. 7
Table 1. Fit result of µs for samples from different cows (Fig. 4) compared to Mastersizer measurements (brackets).
sample cow 1 start cow 1 end cow 2 start cow 2 end cow 3 start cow 3 enddm / µm 4.97 (4.46) 5.11 (4.55) 4.06 (3.68) 4.45 (4.08) 3.85 (3.55) 3.94 (3.61)
σ 0.17 (0.18) 0.17 (0.18) 0.16 (0.18) 0.15 (0.18) 0.13 (0.17) 0.13 (0.18)c /% 4.2 8.3 2.1 9.0 3.9 8.3
Figure 5. Scattering coefficient µs of the raw milk mixed withEDTA for ultrasonic homogenization steps of 0min (circles),2min (squares), 4min (diamonds), 8min (triangles) and20min (stars). Fits by Mie theory (solid lines) are shown withthe fit parameters: mean diameters dm,1 and dm,2, widths σ1 andσ2, volume concentration of the scatterers cV and weightingfactor k.
reported values.43,13
Furthermore, the mean diameter of the fat particles duringhomogenization was investigated. Therefore, raw milk washomogenized for different time steps. The homogenizedsamples were also mixed with EDTA to destroy the caseinmicelles. Like in the measurement series before, Mie theorywas fitted to the data. Five samples were measured: Oneraw (unhomogenized) sample and four samples with thehomogenization times of 3min, 5min, 8min and 20min.Here, a bimodal log-normal size distribution
N(log(d)) =cV√2π·[k
σ1· e−
12
(log(d)−log(dm,1)
σ1
)2
+(1− k)σ2
· e−12
(log(d)−log(dm,2)
σ2
)2]
(5)
to describe the light scattering by Mie theory was used. Thefit parameters were two mean diameters dm,1 and dm,2 andtwo widths of the bimodal log-normal distribution σ1 andσ2, as well as the volume concentration of the scattererscV and a weighting factor k for both peaks in the bimodaldistribution. The measured spectra as well as the fit curvesare shown in Fig. 5. The results of the fit parameters are givenin Tab. 2. For unhomogenized milk the calculated weightingfactor is 0.99. This shows that a negligible low amount of fatdroplets count to the peak with the small particle diameter,which satisfies the assumption of a monomodal distributionfor untreated raw milk in the preceding subsection. Thisvalue decreases for longer homogenization periods from 0.99to 0.32. Thus, the amount of particles in the Gaussian peak
with a larger mean diameter decreases and the amount ofparticles with smaller mean diameter increases. The valueof the width of the peak at larger sizes also decreases toa value of about 10−8 and, hence, the amount of particleswith this size vanishes. The value of the mean diameter ofthe peak at smaller sizes stays relatively constant at 0.35 µmon average. The change of the total volume concentrationof the scatterers was below 10%. The fit results showsimilar values as the results of the PSD measurements (seeTab. 2). The mean diameter of the larger particles emergein the same way for both independent measurements, alsothe weighting factors agree well. The mean diameter ofthe smaller particles show an increasing trend for higherhomogenization in contrast to the PSD measurements, wherethe mean diameter stays constant, but since the weightingfactor is 99% the fit results of the smaller peak does notseem reliable. Unfortunately for this sample series no resultsof the Rose-Gottlieb method are available as well, but thefit yields to a relatively constant fat concentration, whichis in a reasonable range. Here, a rather high number offit parameters is used. Expectedly the confidence intervalof some parameters and single samples are fairly high,especially if the fit provides one of the peaks in the sizedistribution to be vanishing. However, since the fit of thecalculated Mie spectra is not sufficient for less parameter (notshown), the number of fit parameters seems to be reasonable.The last aspect to examine in this subsection is the changeof the scattering coefficient caused by the influence of thecasein micelles. Another sample series with raw milk wasproduced. Here the samples were homogenized in time stepsof 0min, 2min, 4min, 6min, 8min, 12min and 25min.After each homogenization step one part of the sample wasmixed with EDTA. We compared the scattering coefficientsof all the samples with and without EDTA. In Fig. 6 theresults for the samples after the homogenization steps of0min, 4min, 8min and 25min are given exemplarily. Thespectral behavior almost remains the same and the absolutevalue of the scattering coefficient influenced by the mixing ofEDTA decreases by less than 10% for low homogenizationand up to 25% for high homogenization. Since EDTAdestroys the calcium phosphate binding more molecularcasein proteins will be in the milk after the treatment. In thepresence of more molecular casein proteins larger interfacesin the emulsion are possible, this means that the particlediameter of the fat droplets and therewith the scatteringcoefficient can be reduced because of the EDTA treatment.Generally, the impact of the casein micelles on µs is low,since the diameter and hence the scattering cross section issmall compared to the one of the fat droplets.
Reduced scattering coefficientTo determine the reduced scattering coefficient the inte-grating sphere setup was used. With an appropriate cuvette(thickness: 4mm) raw milk was measured undiluted. We
Prepared using sagej.cls

8 Applied Spectroscopy XX(X)
Table 2. Fit results of µs for raw milk samples with different homogenization steps (Fig. 5) compared to Mastersizer measurements(brackets).
homogenization 0min 2min 4min 8min 20mindm,1 / µm 4.14 (3.77) 3.96 (3.78) 3.70 (3.61) 3.11 (3.11) 1.96 (1.59)
σ1 0.17 (0.20) 0.17 (0.21) 0.16 (0.21) 0.145 (0.22) 10−8 (0.25)dm,2 / µm 0.10 (0.57) 0.25 (0.57) 0.37 (0.59) 0.62 (0.65) 0.43 (0.59)
σ2 0.10 (0.18) 0.13 (0.19) 0.25 (0.20) 0.25 (0.22) 0.05 (0.19)c /% 6.3 5.7 6.0 5.2 5.6k 0.99 (0.86) 0.99 (0.83) 0.85 (0.77) 0.73 (0.66) 0.32 (0.34)
Figure 7. Reduced scattering coefficient µ′s of raw milk for different homogenization times. Fits by Mie theory (solid lines) are
shown using the fit parameters: mean diameters dm,1 and dm,2, widths σ1 and σ2 and weighting factor k. a. Raw milk samples mixedwith EDTA after different homogenization steps. b. Raw milk samples with homogenization treatment of 0 (circles), 4 (diamonds),8 (triangles) and 25min (stars). Both sample series with the same treatment. One series was pure raw milk (unfilled symbols) andthe other was mixed with EDTA to destroy the casein micelles (filled symbols).
Table 3. Fit results of µ′s for raw milk samples with different homogenization steps (Fig. 7).
homogenization 0min 2min 4min 6min 8min 12min 25mindm,1 / µm 9.366 9.087 7.667 6.945 6.891 7.877 8.405
σ1 0.021 0.016 0.021 0.007 0.018 0.013 0.04dm,2 / µm 1.44 0.38 0.24 0.21 0.19 0.16 0.10
σ2 0.64 0.64 0.25 0.23 0.21 0.18 0.36k 0.90 0.87 0.75 0.69 0.65 0.58 0.27
used the same series of raw milk as shown above withhomogenization steps of 0, 2, 4, 6, 8, 12 and 25min. Thesamples were also mixed with EDTA to destroy the caseinmicelles. The results for the reduced scattering coefficient aswell as the associated fitted curves are shown in Fig. 7 a..The fit results are given in Tab. 3. To quantify the change inµ′s a bimodal log-normal distribution (Eq. (5)) was used tocalculate the spectra using Mie theory calculations as scat-tering functions. The main difference to the µs examinationsis that the concentration of fat was determined by the RoseGottlieb method and so we fixed this value in the calculationto reduce the number of fit parameters.The mean diameters of the peak of larger particles in the sizedistribution stayed relatively constant about 8 µm and thepeak of smaller particles shifts to smaller sizes from 1.44 µmto 0.10 µm, but the weighting factor shifted from 0.90 to0.27 , so the main volume of scatterers was getting smaller.The systematics of these results agree mainly with them ofthe PSD measurement of the other homogenization sampleseries though the absolute values can not be compared,
because different raw milk samples were used. Althoughagain a lot of fit parameters are used the confidence intervalsof all parameters stay below 5%. Obviously the mean diam-eter of the larger fat droplets is rather high. Unfortunatelywe cannot compare the results with size measurements doneon this specific sample. At this point we cannot exclude thepossibility that dependent scattering occurs, because this isa measurement in which raw milk was measured undilutedwith all scatterers (fat and casein) in it. It is likely thatthe scattering coefficient in the small wavelength regime isinfluenced by dependent scattering of the small scattererslike the casein micelles. However, the results of the smallermean diameter peak during the homogenization seems to bequestionable.To get aware of the influence of the casein micelles, wecompare the raw milk samples mixed with EDTA andwithout EDTA after the same homogenization steps. Thecomparison of the measurement series are shown in Fig. 7 b.,where the results for only 4 homogenization steps of 0min,4min, 8min and 25min are shown for better readability.
Prepared using sagej.cls

Stocker et al. 9
Figure 6. Scattering coefficient µs of raw milk for thehomogenization steps 0min (circles), 4min (diamonds), 8min(triangles) and 25min (stars). One sample series was pure rawmilk (unfilled symbols) and the other was mixed with EDTA(filled symbols).
The change in the reduced scattering coefficient is between50% (longer wavelengths) and up to 200% (short wave-lengths) for the samples with and without EDTA. Thisdiffers from the results of the scattering coefficient. Thedifference between µ′s with and without casein micelles islarger than the difference in µs. Since µ′s = µs(1− g), thiseffect can be maintained by calculations. Due to the smallsize of the casein micelles and therewith due to the loweranisotropy factor compared to that of the fat droplets, µ′s ofboth constituents converges compared to µs. Both influencesshould be perceivable although the change in µs was small,which means that the influence of the casein micelles cannotbe detected for µs but for µ′s. We see that particles smallerthan the wavelength were destroyed because the slope in theshort wavelength regime decreases. This measurement showsthat the reduced scattering coefficient is the more suitableparameter to examine both the fat and protein content of milkthan the scattering coefficient, because a separation of theinfluences of both scatterers is possible.
Absorption coefficientThe absorption coefficient of a commercial milk sample with1.5% fat was determined exemplarily using the integratingsphere setup. The spectrum is shown in Fig. 8. In addition,the absorption coefficients of water,44 fat, β-carotene45 andriboflavin46 are given. The fat absorption is a combinationof measurement results from soybean oil, palm oil andlard. These three different kinds of fat differ barely inabsorption, so a combination of them is shown. Regardingthe fat absorption in the NIR wavelength regime, there aretwo characteristic peaks in the spectrum at 930 nm and1200 nm. At wavelengths below 600 nm, the fat absorptionincreases as well. For the absorption coefficient of milk,it can be found that in the wavelengths above 800 nm thewater absorption dominates. The shape of the absorptioncoefficient below 700 nm differs from the absorptioncoefficient of fat and water. At first sight the absorptionbelow 500 nm seems to be similar to the fat absorption, but
Figure 8. Spectral behavior of the absorption coefficient µa of acommercial milk sample (green). For comparison the absorptioncoefficients of water 44 (black), fat (red), β-carotene 45 (blue) andriboflavin 46 (purple) are given.
this might be due to dissolved organic substances. In thisrange, a lot of organic substances exhibit high absorptioncoefficients such as riboflavin, hemoglobin and β-carotene,the concentration of which are strongly affected by thehealth or food of the cow. The main effect is expectedfrom the absorption of the β-carotene, which is dissolvedin the fat droplets, and from riboflavin, which is dissolvedin the milk serum. This means that the absolute absorptionin this wavelength range does not only depend on the fatconcentration, but also on the concentration of the organicsubstances, which varies for different cows.
Conclusion
In this work we determined geometrical and opticalproperties of the ingredients of milk, which are responsiblefor its turbidity. Examinations of the particle sizes, therefractive indices, the scattering as well as the reducedscattering coefficient and the absorption coefficient fordifferent raw milk samples and after different treatments ofthe raw milk were presented. The turbidity measurementswere performed using a collimated transmission and anintegrating sphere setup.The size distributions of the fat droplets of raw milk weremeasured with a Mastersizer. The size distribution can bedescribed with a log-normal distribution. This distributioncan be used for raw milk (monomodal) and during ahomogenization process (bimodal). The PSD of the fatdroplets in milk from different cows at different times duringthe milking process showed that the fat concentration differsimmensely during the milking process. The fat concentrationat the beginning of the milking process was much loweras at the end of the milking process. Unexpectedly, themean diameter of the fat droplets stayed almost constantfor each cow and varies just about 1 µm for the differentcows. The PSD of the casein micelles was determined with aZetasizer which provided a mean diameter of 189 nm and byfitting Mie theory to the measured data of the scattering and
Prepared using sagej.cls

10 Applied Spectroscopy XX(X)
the reduced scattering coefficient which yielded to a meandiameter of 211 nm with a broad width of 0.201.RI dispersions of milk fat and casein micelles weredetermined with the Cauchy dispersion. For both scatterersonly values of single wavelengths could be found in theliterature. Our result of the milk fat agree with the publishedvalues.21,41,20 For the casein micelles, the published value of1.57 at 600 nm42 could not be supported.The scattering coefficients of different raw milk samples, rawmilk during the homogenization process and raw milk afterEDTA treatments were determined. We could show how thespectral shape of the scattering coefficient changes for thedifferent samples. Mie theory was fitted to the measureddata. The resulting fit parameters of the PSD showed thesame changes as the results of the size measurements ofthe Mastersizer. This was valid for the raw milk samples ofdifferent cows as well as for the raw milk samples during thehomogenization process, although the results for the volumeconcentration could not be verified. We could show that theinfluence of the casein micelles on the scattering coefficientis small, because the scattering is dominated by the larger fatdroplets.The change in the reduced scattering coefficient of rawmilk samples during a homogenization process was shown.Calculations by Mie theory showed that µ′s can be describedby a bimodal log-normal PSD, which was the result ofthe Mastersizer measurements. The influence of the caseinmicelles was also examined. We found that the caseinmicelles affect the reduced scattering coefficient more thanthe scattering coefficient relative to the fat droplets becauseof their smaller anisotropy factor. Thereby µ′s seems tobe the more promising parameter for future developmentsto implement an optical milk sensor without the need forcalibration, especially since it is possible to determine µ′sof undiluted samples. With this guess, we already examinedthe correlation of the fat and protein concentration on theµ′s and we found clearly separable spectral change of µ′sby changing one of these concentrations. These correlationswill be shown in-depth in a future work. To make suchresults more reliable and suitable for future applications, thepotential effect of dependent scattering of the small scatterershas to be examined further.The absorption coefficient of milk samples was measuredand compared to the absorption coefficients of the mainlypresent components of milk. The next step is to optimizethe signal to noise ratio in the NIR regime to determinethe fat and water content out of the absorption coefficient.One goal is to examine the wavelength regime around thefat absorption peak at 930 nm, because detectors suitable forthis wavelength regime are based on silicon and thus arecheaper than those based on InGaAs for the NIR regime.Initial calculations showed that a determination of the fatcontent by regarding the first and second derivative at thiswavelength regime is possible.In our work, we showed that the influence of a lot of differentparameters in milk can be detected through scatteringmeasurements. To build an optical sensor based on thesefundamental examinations to determine the absolute contentsof fat and protein without the need for calibration orstatistical classification, further investigations are necessary.One challenge will be the determination of all parameters at a
time with one setup. Our goal is to perform the measurementswith raw and undiluted milk, therefore the possible effect ofdependent scattering has to be examined further.
Acknowledgements
We acknowledge the financial support from the CentralInnovation Program for SMEs (ZIM) of the Federal Ministryfor Economic Affairs and Energy, Germany. We thank AndreaBohmler for the raw milk samples and Wolfgang Weirather fromZSW, Germany, for his help with the Mastersizer and Zetasizermeasurements.
References
References
[1] J. Qin and R. Lu. “Measurement of the absorption andscattering properties of turbid liquid foods using hyperspectralimaging,”. Appl. Spectrosc., 2007, 61(4): 388–396.
[2] Q. Xin, H. Zhi Ling, T. Jian Long, and Y. Zhu. “The rapiddetermination of fat and protein content in fresh raw milkusing the laser light scattering technology,”. Opt. Laser. Eng.,2006, 44(8): 858–869.
[3] R. H. Tromp, A. Liemert, and M. B. J. Meinders. “Analysisof light scattered by turbid media in cylindrical geometry,”.Langmuir, 2014, 30(28): 8276–8282.
[4] F. Kamran and P. E. Andersen. “Sensitivity analysisfor oblique incidence reflectometry using monte carlosimulations,”. Appl. Opt., 2015, 54(23): 7099–7105.
[5] C. L. Crofcheck, F. A. Payne, and M. P. Meng. “Characteriza-tion of milk properties with a radiative transfer model,”. Appl.Opt., 2002, 41(10): 2028–2037.
[6] O. H. A. Abildgaard, F. Kamran, A. B. Dahl, J. L. Skytte, F. D.Nielsen, C. L. Thomsen, P. E. Andersen, R.s Larsen, and J. R.Frisvad. “Non-invasive assessment of dairy products usingspatially resolved diffuse reflectance spectroscopy,”. Appl.Spectrosc., 2015, 69(9): 1096–1105.
[7] A. Bogomolov, S. Dietrich, B. Boldrini, and R. W. Kessler.“Quantitative determination of fat and total protein in milkbased on visible light scatter,”. Food Chemistry, 2012, 134(1): 412–418.
[8] O. H. A. Nielsen, A. A. Subash, F. D. Nielsen, A. B. Dahl, J. L.Skytte, and D. Andersson-Engels, S.and Khoptyar. “Spectralcharacterisation of dairy products using photon time-of-flightspectroscopy,”. Journal of Near Infrared Spectroscopy, 2013,21(5): 375–383.
[9] S. Leyre, F. B. Leloup, J. Audenaert, G. Durinck, J. Hofkens,G. Deconinck, and P. Hanselaer. “Determination of the bulkscattering parameters of diffusing materials,”. Appl. Opt.,2013, 52(18): 4083–4090.
[10] R. Tsenkova, S. Atanassova, K. Toyoda, Y. Ozaki, K. Itoh, andT. Fearn. “Near-infrared spectroscopy for dairy management:measurement of unhomogenized milk composition,”. Journalof dairy science, 1999, 82(11): 2344–2351.
[11] B. Aernouts, E. Polshin, J. Lammertyn, and W. Saeys.“Visible and near-infrared spectroscopic analysis of raw milkfor cow health monitoring: Reflectance or transmittance?,”. J.Dairy Sci., 2011, 94(11): 5315–5329.
[12] A. Bogomolov and A. Melenteva. “Scatter-based quantitativespectroscopic analysis of milk fat and total protein in
Prepared using sagej.cls

Stocker et al. 11
the region 400–1100nm in the presence of fat globulesize variability,”. Chemometrics and Intelligent LaboratorySystems, 2013, 126: 129–139.
[13] B. Aernouts, R. Van Beers, R. Watte, T. Huybrechts,J. Lammertyn, and W. Saeys. “Visible and near-infrared bulkoptical properties of raw milk,”. J. Dairy Sci., 2015, 98(10):6727–6738.
[14] B. Aernouts, R. Van Beers, R. Watte, T. Huybrechts,J. Jordens, D. Vermeulen, T. Van Gerven, J. Lammertyn, andW. Saeys. “Effect of ultrasonic homogenization on the vis/nirbulk optical properties of milk,”. Colloids and Surfaces B:Biointerfaces, 2015, 126: 510–519.
[15] O. H. A. Abildgaard, J. R. Frisvad, V. Falster, A. Parker, N. J.Christensen, A. B. Dahl, and R. Larsen. “Noninvasive particlesizing using camera-based diffuse reflectance spectroscopy,”.Applied optics, 2016, 55(14): 3840–3846.
[16] D. G. Dalgleish. “On the structural models of bovine caseinmicelles - review and possible improvements,”. Soft Matter,2011, 7(6): 2265–2272.
[17] P. Walstra, T. J. Geurts, A. Noomen, A. Jellema, and M. A.J. S. van Boekel. “Dairy technology: principles of milkproperties and processes,”. New York US, Marcel Dekker,1999. ISBN 0-8247-0228-X.
[18] G. Mie. “Beitrage zur optik truber medien, speziell kolloidalermetallosungen,”. Ann. Phys., 1908, 4(25): 377–445.
[19] M. Daimon and A. Masumura. “Measurement of the refractiveindex of distilled water from the near-infrared region to theultraviolet region,”. Appl. Opt., 2007, 46(18): 3811–3820.
[20] A. I. Konokhova, A. A. Rodionov, K. V. Gilev, I. M.Mikhaelis, D. I. Strokotov, A. E. Moskalensky, M. A.Yurkin, A. V. Chernyshev, and V. P. Maltsev. “Enhancedcharacterisation of milk fat globules by their size, shape andrefractive index with scanning flow cytometry,”. Int. Dairy J.,2014, 39(2): 316–323.
[21] M.-C. Michalski, V. Briard, and F. Michel. “Opticalparameters of milk fat globules for laser light scatteringmeasurements,”. Lait, 2001, 81(6): 787–796.
[22] R. Attaie and R. L. Richter. “Size distribution of fat globulesin goat milk,”. J. Dairy Sci., 2000, 83(5): 940–944.
[23] H. Mulder and P. Walstra. “The milk fat globule: Emulsionscience as applied to milk products and comparable foods,”.Wallingford United Kingdom, Commonwealth AgriculturalBureaux, 1974.
[24] J. Hamann and V. Kromker. “Potential of specific milkcomposition variables for cow health management,”. Livest.Prod. Sci., 1997, 48(3): 201–208.
[25] F. J. Mulligan, L. O’Grady, D. A. Rice, and M. L. Doherty. “Aherd health approach to dairy cow nutrition and productiondiseases of the transition cow,”. Anim. Reprod. Sci., 2006, 96(3): 331–353.
[26] N.C. Friggens, P. Berg, P. Theilgaard, I. R. Korsgaard, K. L.Ingvartsen, P. Løvendahl, and J. Jensen. “Breed and parityeffects on energy balance profiles through lactation: Evidenceof genetically driven body energy change,”. J. Dairy Sci.,2007, 90(11): 5291–5305.
[27] D. G. Dalgleish. “Food emulsions - their structures andstructure-forming properties,”. Food Hydrocoll., 2006, 20(4):415–422.
[28] D. G. Dalgleish and M. Corredig. “The structure of the caseinmicelle of milk and its changes during processing,”. Annu.
Rev. Food Sci. Technol., 2012, 3(1): 449–467.[29] C. G. de Kruif and T. Huppertz. “Casein micelles: Size
distribution in milks from individual cows,”. J. Agric. FoodChem., 2012, 60(18): 4649–4655.
[30] C. G. de Kruif, T. Huppertz, V. S. Urban, and A. V. Petukhov.“Casein micelles and their internal structure,”. Adv. ColloidInterface Sci., 2012, 171-172(1): 36–52.
[31] C. Phadungath. “Casein micelle structure: a concise review,”.Songklanakarin J. Sci. Technol., 2004, 27(1): 201–212.
[32] P. Walstra. “Casein sub-micelles: do they exist?,”. Int. DairyJ., 1999, 9(3-6): 189–192.
[33] T. C. A. McGann, W. J. Donnelly, R. D. Kearney, andW. Buchhemm. “Composition and size distribution of bovinecasein micelles,”. BBA-Gen. Subjects, 1980, 630(2): 261–270.
[34] R. Matissek, G. Steiner, and M. Fischer. “Lebensmittelana-lytik,”. Berlin Heidelberg Germany, Springer Verlag, 2013.
[35] P. Udabage and M.-A. McKinnon, I.and Augustin. “Mineraland casein equilibria in milk: effects of added salts andcalcium-chelating agents,”. J. Dairy Res., 2000, 67(03): 361–370.
[36] R. Michels, F. Foschum, and A. Kienle. “Optical properties offat emulsions,”. Opt. Express, 2008, 16(8): 5907–5925.
[37] S. A. Prahl. “The adding-doubling method,”. In Optical-Thermal Response of Laser-Irradiated Tissue, pages 101–129.Springer Science + Business Media, 1995.
[38] P. Walstra, P. Walstra, J. T. M. Wouters, and T. J. Geurts.“Dairy science and technology, second edition,”. FoodScience and Technology. Boka Raton US, CRC Press, 2005.
[39] F. Voit, J. Schafer, and A. Kienle. “Light scattering bymultiple spheres: comparison between maxwell theory andradiative-transfer-theory calculations,”. Optics letters, 2009,34(17): 2593–2595.
[40] P. Krauter, S. Nothelfer, N. Bodenschatz, E. Simon,S. Stocker, F. Foschum, and A. Kienle. “Optical phantomswith adjustable subdiffusive scattering parameters,”. J.Biomed. Opt., 2015, 20(10): 105008–105008.
[41] F. C. Cheong, K. Xiao, and D. G. Grier. “Technical note:characterizing individual milk fat globules with holographicvideo microscopy,”. Journal of dairy science, 2009, 92(1):95–99.
[42] M. C. A. Griffin and W. G. Griffin. “A simple turbidimetricmethod for the determination of the refractive index of largecolloidal particles applied to casein micelles,”. J. ColloidInterface Sci., 1985, 104(2): 409–415.
[43] S. Łaic and Y. Ozaki. “Short-wave near-infrared spectroscopyof biological fluids. 1. quantitative analysis of fat, protein,and lactose in raw milk by partial least-squares regression andband assignment,”. Anal. Chem., Jan 2001, 73(1): 64–71.
[44] G. M. Hale and M. R. Querry. “Optical constants of water inthe 200-nm to 200-µm wavelength region,”. Appl. Opt., 1973,12(3): 555–563.
[45] L. Zechmeister and A. Polgar. “Cis-trans isomerizationand spectral characteristics of carotenoids and some relatedcompounds,”. Journal of the American Chemical Society,1943, 65(8): 1522–1528.
[46] J. Koziol. “Studies on flavins in organic solvents - i.spectral characteristics of riboflavin, riboflavin tetrabutyrateand lumichrome,”. Photochemistry and Photobiology, 1966, 5
Prepared using sagej.cls
12 Applied Spectroscopy XX(X)
(1): 41–54.
Prepared using sagej.cls