applied epidemiology in cambodia
TRANSCRIPT

Applied Epidemiology in Cambodia
A thesis submitted for the degree of Master of Philosophy
(Applied Epidemiology) of the Australian National
University
Srean Chhim
Epidemiology and Public Health Unit, Institut Pasteur du Cambodge
February 2021
Academic Supervisors: Tambri Housen, MPH&TM, MPhil, PhD Australian National University, Canberra, Australia Amy Elizabeth Parry, MPhil Australian National University, Canberra, Australia Field Supervisors: Patrice Piola, MD, PhD Institut Pasteur du Cambodge, Phnom Penh, Cambodia Vincent Herbreteau, PhD Espace-Dev, IRD, Univ. Antilles, Univ. Guyane, Univ. Montpellier, Univ. Réunion, Phnom Penh, Cambodia
© Copyright by Srean Chhim, 2021 All Rights Reserved

i
Declaration This thesis contains no material which has been accepted for the award of any other
degree or diploma in any university. To the best of the author’s knowledge, it contains no
material previously published or written by another person, except where due reference is
made in the text.
Srean Chhim
February 2021

This page has been intentionally left blank
iii
Acknowledgments I am enormously grateful to my academic supervisors, Dr. Tambri Housen and Amy Parry, and
field supervisors, Dr. Patrice Piola, and Dr. Vincent Herbreteau, for their continuous support
and patient guidance, encouragement, constructive and helpful comments to help me fulfill my
MAE competencies during the past two years.
Sincere thanks to Professor Ross Andrews, Dr. Philippa Binns, and Dr. Emma Field for
providing me an exceptional opportunity to be part of the MAE and provide fantastic training.
Profound thanks to other academic staff, Dr. Ben Polkinghorne, Associate Professor Stephen
Lambert, Dr. Florian Vogt, Dr. Davoud Pourmarzi, and all adjunct lecturers and professors who
provided great courses. I thank Hayley Primrose, Laura Vitle, and Sam Dissanayake for
providing excellent administrative support and trip arrangements.
I also want to express my gratitude to Dr. Ly Sovann, Director of Cambodian Communicable
Disease Control Department (CCDC), for allowing me to join an outbreak investigation team
and the COVID-19 response team. Also, he gave me permission to use CCDC’s data to fulfill
my MAE competencies.
I would like to extend my thanks to Dr. Laurence Baril, Director of the Institut Pasteur du
Cambodge, Dr. Megan Counahan, Health Adviser for the Department of Foreign Affairs and
Trade (DFAT) based in Cambodia, Dr. Michael Kinzer, the Division of Global Health Protection
(DGHP) program director, US CDC in Cambodia, for facilitating my deployment at CCDC to
support the COVID-19 response team.
A scholarship funded through the Australian Commonwealth Department of Foreign Affairs
and Trade {DFAT} Health Security Fellowship Program funded my MAE opportunity. I sincerely
thank DFAT and Australian Government for supporting Cambodia generously. Thanks to
Prudence Borthwick and Damian Facciolo for keeping me connected to the Indo-Pacific Centre
for Health Security.
I have learned from the past MAE students through their teaching in MAE, guest lectures, and
thesis. I thank them for sharing their experience.
Thanks to all my friends in MAE20 who are so supportive and share their thoughts on questions
I posed in the learning group.
Finally, I thank my wife, three-year-old son, and two-year-old daughter for their patience and
understanding.

This page has been intentionally left blank

v
Thesis abstract In meeting the Master of Philosophy in Applied Epidemiology (MAE)’s, I completed two of
my core projects at the Institute Pasteur of Cambodia (IPC), a non-governmental
organization. The other two core projects I completed at the Ministry of Health’s
Cambodian Communicable Disease Control Department (CCDC), where I was later
deployed to support Coronavirus Disease 2019 (COVID-19) contact tracing and
surveillance. In this thesis, I demonstrate how I met the core competencies of the MAE
program.
In late November and early December 2019, a provincial health department notified CCDC
about what they called a food poisoning event that had affected more than 200 people,
and resulted in two deaths in a residential facility in a province of Cambodia. We conducted
a case-control study. We found a strong association between eating cucumbers and
illness. However, laboratory analysis failed to detect a causative agent. Toxicology testing
was not conducted, and therefore we were unable to rule out contamination of the
cucumbers. This project is described in chapter two, “An outbreak of unknown etiology
associated with fresh cucumbers in a residential facility in Cambodia, 2019”.
We aimed at describing how malaria has evolved spatially from 2006 to 2019. We
undertook a secondary analysis of existing malaria data from all public health facilities in
Cambodia between 2006 and 2019 in combination with metadata. Overall, incidence
fluctuated between 1.5 and 7.4 cases/1000 inhabitants per year. Malaria clusters were
detected in seven northern provinces, along borders. We recommended that interventions
aimed at preventing new infections of Plasmodium vivax and relapses should be
prioritized. All confirmed malaria cases should be reported to Health Management
Information System to avoid misleading trends. This project is detailed in chapter
three, “Malaria in Cambodia: retrospective analysis of a changing epidemiology
2006-2019.”
I implemented and evaluated the RAI2 surveillance system as part of activities
associated with a funded malaria project. Nine attributes, adapted from the US CDC
guideline 2001, were used to assess the performance of the system. Usefulness was
described based on the outcome of the evaluation of the other eight attributes.
Simplicity, flexibility, acceptability, and stability were assessed using a short online
survey with health center staff. Sensitivity, positive predictive value, data quality, and
timeliness were assessed using document review and data from the RAI2 surveillance
system. Findings suggested

vi
that the RAI2 surveillance system was simple, flexible, stable, timely but did not meet its
primary objective. We recommended that the RAI2 surveillance system should be
integrated into the national malaria information system and moved to be a real-time data
collection. Additional exposure variables should be captured. I placed this project in
chapter four, “Using Kobo Toolbox as a malaria project-based surveillance system in
Cambodia: surveillance evaluation.”
My final project was to estimate the proportion of COVID-19 cases that were asymptomatic
and understand how the asymptomatic transmission may occur. I analyzed data from 22
cases as part of a cluster of returned travelers, with what was believed to be a common
exposure site. Their 491 uninfected contacts and ten infected contacts were also included
in the analysis. The findings suggested asymptomatic cases made up a larger proportion
of total cases within the cluster. This project is described in chapter five, “Coronavirus
Disease 2019 asymptomatic transmission: A cluster review in Cambodia, 2020.”
Finally, other required activities presented in this thesis include an oral presentation, a
scientific manuscript submitted to a peer-reviewed journal, a literature review, a summary
for a layperson, lessons learned from the field, and teaching.

vii
Table of Contents Declaration ........................................................................................................................ i Acknowledgments ......................................................................................................... iii Thesis abstract ................................................................................................................ v
Table of Contents .......................................................................................................... vii Chapter 1 Introduction .................................................................................................... 9
Field placement ........................................................................................................... 11
Requirements for MAE ................................................................................................ 15
Chapter 2 : An outbreak of unknown etiology associated with fresh cucumbers in a residential facility in Cambodia, 2019 ...................................................................... 17
Prologue ...................................................................................................................... 19
Abstract ....................................................................................................................... 23
Abbreviation ................................................................................................................ 24
Introduction ................................................................................................................. 25
Methods ...................................................................................................................... 26
Result .......................................................................................................................... 30
Case-control ................................................................................................................ 31
Incubation period ......................................................................................................... 32
Discussion ................................................................................................................... 36
Conclusion .................................................................................................................. 38
Recommendation ........................................................................................................ 39
Chapter 3 : Malaria in Cambodia: a retrospective analysis of a changing epidemiology 2006-2019 ............................................................................................... 43
Prologue ...................................................................................................................... 45
Abstract ....................................................................................................................... 48
Abbreviations .............................................................................................................. 49
Introduction ................................................................................................................. 50
Methods ...................................................................................................................... 52
Results ........................................................................................................................ 57
Discussion ................................................................................................................... 68
Conclusions ................................................................................................................. 73
Chapter 4 : Using Kobo Toolbox as a malaria project-based surveillance system in Cambodia: surveillance evaluation ............................................................................. 83
Prologue ...................................................................................................................... 85
Abstract ....................................................................................................................... 88
Abbreviation ................................................................................................................ 89
Introduction ................................................................................................................. 91
Purpose of the evaluation ......................................................................................... 103

viii
Scope of evaluation ................................................................................................... 103
Engaging stakeholders .............................................................................................. 105
Methodology .............................................................................................................. 105
Results ...................................................................................................................... 106
Discussion ................................................................................................................. 123
Conclusion ................................................................................................................ 125
Recommendation ...................................................................................................... 125
Annex 1: Quantitative questionnaire ......................................................................... 129
Annex 2: Malaria Information System (MIS) data collection form ............................. 131
Chapter 5 : Coronavirus Disease 2019 asymptomatic transmission: A cluster review in Cambodia, 2020 .......................................................................................... 133
Prologue .................................................................................................................... 135
Abstract ..................................................................................................................... 138
Abbreviation .............................................................................................................. 139
Introduction ............................................................................................................... 140
Methods .................................................................................................................... 142
Ethical Approvals ...................................................................................................... 147
Results ...................................................................................................................... 147
Discussion ................................................................................................................. 159
Conclusions ............................................................................................................... 161
Recommendations .................................................................................................... 161
Annex 1: Research summary for general public ....................................................... 165
Appendix 2: Case report form ................................................................................... 168
Annex 3: Questionnaire ............................................................................................. 171
Quantitative Interview with confirmed cases ............................................................. 171
Qualitative Interview with confirmed cases ............................................................... 171
Chapter 6 : Teaching ................................................................................................... 173
Prologue .................................................................................................................... 175
Annex 1: Slide presentation used for Lesson Learned from the field ........................ 182
Annex 2: Slide presentation used for teaching first-year MAE student ..................... 186
Annex 3: Teaching session outline ........................................................................... 193

9
Chapter 1 Introduction
“My journey during the Master of Philosophy in Applied Epidemiology”

Chapter 1
10
(This page has been intentionally left blank)
Introduction
11
Field placement
During my time on the Master of Philosophy in Applied Epidemiology (MAE), I was so
fortunate that I could get field epidemiology experience and learned from a large field
epidemiologist network including epidemiologists and staff at the Australian National
University (ANU), Institut Pasteur du Cambodge (IPC), Cambodian Communicable
Disease Control (CCDC), US Center for Disease Control (US CDC), and World Health
Organization (WHO).
In meeting the MAE’s competencies, I completed two core projects at IPC and the other
two core projects at CCDC.
The agreement between ANU and IPC at the beginning of MAE stated my primary field
placement was at IPC in Phnom Penh, Cambodia, between 18 March 2019 and 18
November 2020. It was the first time that IPC supervised a field epidemiology scholar with
ANU, and the first time, ANU had an MAE scholar from Southeast Asian countries. We
could say that a lot of things were in the experiment.
Although it was the IPC’s first experience with MAE, the IPC team is strong in epidemiology
and laboratory capacity related to infectious disease. Having a long history since the
1950s, IPC is a not-for-profit institute that has strong support from Cambodia’s Ministry of
Health (1). The IPC’s scope focuses on laboratory-based research and surveillance of
infectious diseases, promoting knowledge on infectious diseases through training to its
partners, laboratory service, and international vaccination services. IPC has the highest
medical laboratory qualification with its biosafety facilities (BSL2+ and BSL3). It is also the
first Cambodian medical laboratory which obtained accreditation under the recognized
international standard NF EN ISO 15189 by COFRAC in 2018. IPC provides a variety of
vaccinations such as Haemophilus influenza type-b infection, bacterium Bordetella
pertussis infection, Mycobacterium tuberculosis (MTB) bacterial infection, tetanus
bacterial infection, Japanese encephalitis virus infection, hepatitis B virus infection,
human papillomavirus infection, poliovirus infection, bacterium Neisseria meningitides
infection, rotavirus infection, yellow fever viral infection, typhoid fever, varicella virus
infection, influenza virus infection, and rabies virus infection rabies. On infectious disease
research, IPC conducts infectious disease-related research on pathogens including
respiratory virus’: seasonal influenza, and influenza, arbovirus disease: dengue,
chikungunya, and Zika, zoonosis: rabies, Japanese encephalitis, other zoonotic viruses,
and novel pathogens, neurotropic infection: meninges encephalitis, and enteroviruses.

Chapter 1
12
While placed at the IPC’s Epidemiology and Public Health Unit, my field supervisor was
Dr. Patrice Piola, a medical epidemiologist. Dr Piola is French and obtained his medical
degree and PhD in Epidemiology from a University in France. Patrice has worked in
several counties in Asia, Africa, and Europe with the Pasteur Institute, Oxford University
and Médecins Sans Frontières (Doctors without Borders).
When I arrived at IPC, my field supervisor had two research projects on malaria under his
direct supervision and several others under his senior staff’s supervision. At this point, I
learned that he had a strong interest in malaria. This drove me to choose malaria-related
projects.
My first project at IPC was the analysis of national malaria data. This project was selected
because I intended to learn new skills in spatial analysis and understand more about
malaria through national surveillance data analysis. However, at that time, the data I
needed was owned by the National Center for Parasitology, Entomology, and Malaria
Control. I was able to negotiate access to the data from the National Center for
Parasitology Entomology and Malaria Control. I learned skills in the geographic
information system (GIS), spatial Poisson scan statistic by Kulldorff M. (2), and R
programming software to complete this project. It was at this time that I got my secondary
supervisor, Dr. Vincent Herbreteau. My primary field supervisor invited Dr. Herbreteau to
be my secondary supervisor. Dr. Herbreteau was a researcher at the French National
Research Institute for Sustainable Development (IRD), based at Institut Pasteur du
Cambodge. He graduated with his PhD in Health Geography at Paris-X University and
Master of Engineering Geographic Information System and remote sensing at STAR
program (Space Technology Applications and Research), Asian Institute of Technology
(AIT) in Thailand. Dr. Herbreteau has expertise in spatial analysis (GIS, remote sensing,
geostatistics), spatial epidemiology, habitat modeling.
The second project was the evaluation of a surveillance system. When I started my
placement, I was part of one project called the “RIA2” project. Its objective was to eliminate
malaria transmissions in forested areas (and subsequently in surrounding villages) within
a year. The projects planned to do active screenings (Mass Screening and Treatments
with rapid diagnostic tests (RDTs)) and continuous passive detection to efficiently treat all
malaria infections and provide patients with a vector control kit. The study compared
malaria incidence trends from six health centers neighboring intervention forests and
compared these trends to the other 41 health centers neighboring non-intervention forests

Introduction
13
in Cambodia (control forests). A significant drop in malaria notifications among health
centers surrounding intervention forests compared to control forests would strongly
suggest the effectiveness of the interventions inside forests.
I was asked to set up a project-based surveillance system, I was responsible for selecting
the intervention and control health centers, defining inclusion criteria, designing the
surveillance system, and was responsible for overall project management, including
training staff and monitoring data quality. I met with people I knew to explore the existing
system, and later I established a surveillance system, the so-called “RAI2 surveillance
system”. It started running in late August 2019. After a five-month implementation, I
evaluated this surveillance system and used this as one of my four competencies.
I completed my outbreak investigation and epidemiology projects with CCDC. CCDC is
under the umbrella of the Ministry of Health (3). Its scope is broadly defined to prevent and
control infectious diseases in the country. CCDC actively works to prevent, detect and
control outbreaks of Avian Influenza, severe acute respiratory syndrome (SARS), Severe
Watery Diarrhea, Swine Influenza, Middle-East respiratory syndrome (MERS), other
diseases (e.g., mass fainting and food poisoning) (4), through its Cambodia Early Warning
System (CamEWARN). During the Coronavirus disease 2019 (COVID-19) pandemic,
CCDC worked closely with national and international agencies to respond to the COVID-
19 spread (5).
In terms of outbreak investigation, CCDC has a mandate to conduct outbreak
investigations. IPC provides technical support when it is invited. This means IPC had a
low chance of being able to provide an opportunity for me to conduct an outbreak
investigation. My supervisors at IPC agreed that I could join an outbreak investigation with
a third-party institution, either with the National Institute of Public Health (NIPH), my
previous workplace, or CCDC, the lead state institution in doing an outbreak investigation
in Cambodia. I communicated and kept in touch with people at CCDC, letting them know
that I was enthusiastic about an opportunity to participate in an outbreak investigation.
In late November 2019, there was an outbreak of an unknown illness in a residential
facility. The outbreak caused 237 people to fall ill, including two deaths, in two days. A
multi-sectoral investigation team was established on Monday, 2 December 2019, to
investigate the outbreak’s source. I was informed about the outbreak. After discussing with
my supervisors, I received permission from the CCDC director and joined the outbreak
investigation. I was not sure at the beginning whether I could use this for my outbreak
Chapter 1
14
investigation project. It depended on how much I could be involved and whether my
involvement met the outbreak investigation competency defined by ANU. I was fortunate
that my role ended up encompassing data collection and management, data analysis, the
presentation of findings to the local authorities, and construction of the outbreak report.
My academic supervisor advised that I could use this project for my outbreak investigation
project if CCDC allowed. My academic supervisor at ANU sent an official letter to the
CCDC’s director to request his approval to let me use the report written by me for my
project. I later received authorization to include the report in this thesis.
For the second project with CCDC, I reviewed a Coronavirus Disease 2019 (COVID-19)
cluster of returned travelers from abroad. This project aimed to estimate the proportion of
asymptomatic cases and compare the attack rate and basic reproduction number
generated by symptomatic primary cases and asymptomatic primary cases. This project
was initiated three months after I was deployed to support contact tracing at CCDC. I
started my involvement with contact tracing activities on 6 March 2020 when Cambodia
detected its second COVID-19 case. When the number of COVID-19 cases increased, I
travelled to different provinces to train contact tracers and participate in field investigations
from case notifications. When more and more provinces detected new cases, I was part
of the national team based in Phnom Penh and remotely supported the provincial teams.
After the 123rd case of COVID-19 was detected on 10 April, Cambodia had zero cases for
more than a month, until 29 May 2020. At the time I was less involved with contact tracing
activities since there were not many contact tracing activities, and I had to speed up my
projects for MAE. At that time, I have not yet identified my epidemiology project. With
consultation with my supervisors and other epidemiologists, I chose to review a COVID-
19 cluster with the purpose stated above. This project was special because it was like a
nature experiment. People went abroad to join a super-spreading event where we believed
all 22 cases were infected with severe acute respiratory syndrome coronavirus 2 (SARS-
CoV-2). They travelled back home and stayed with their family for more than ten days
without preventing their family members from SARS-CoV-2 infection. Some of the 22 index
cases developed symptoms, and some did not. These features possibly allowed us to
compare the attack rate and basic reproduction numbers of asymptomatic and
symptomatic cases even though we expected there would be limitation from a small
sample size.
CCDC had a strong collaboration with the WHO’s country office, US CDC in Cambodia,
and other government institutions. My involvement with both projects at CCDC allowed

Introduction
15
me to learn from experts and staff of CCDC’s partners, which experienced dealing with
outbreak and pandemic.
Requirements for MAE
Students must do four core competency projects in meeting the MAE’s competencies,
including an outbreak investigation, public health data analysis, surveillance data
evaluation, and epidemiology research study. Students are also required to do an oral
presentation in a national or international conference, demonstrate competency in
conducting a literature review, have written a late draft of a scientific manuscript for a peer-
review journal, a summary for a layperson, shared lessons learned from the field and
demonstrated competency in transferring knowledge and skills through teaching. This
thesis describes how I met these competencies and the additional required activities. The
projects and activities have been divided into six chapters, as summarized in Table 1.1
below.
Table 1.1: Summary of MAE projects and experiences fulfilling core degree requirements Requirement Chapter
1 2 3 4 5 6 Introduction √ Outbreak investigation √ Public health data analysis √ Surveillance data evaluation √ Epidemiology study √ Oral presentations √ Literature review √ Scientific manuscript for the peer-review journal
√
Summary for a layperson √ Sharing lessons learned from the field and teaching
√
To enable students to do their projects, MAE provided extensive training. Of those topics,
some were compulsory and must be passed. Those compulsory courses were
summarized in Table 1.2 below.
Chapter 1
16
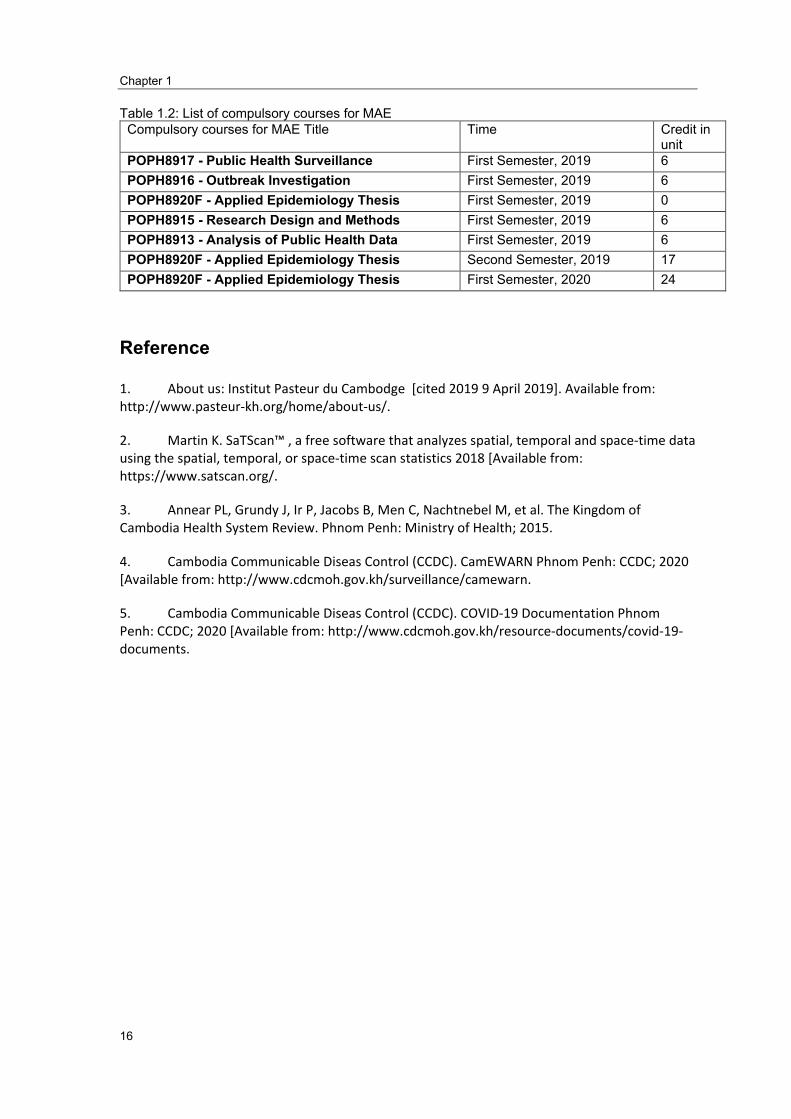
Table 1.2: List of compulsory courses for MAE Compulsory courses for MAE Title Time Credit in
unit POPH8917 - Public Health Surveillance First Semester, 2019 6 POPH8916 - Outbreak Investigation First Semester, 2019 6 POPH8920F - Applied Epidemiology Thesis First Semester, 2019 0 POPH8915 - Research Design and Methods First Semester, 2019 6 POPH8913 - Analysis of Public Health Data First Semester, 2019 6 POPH8920F - Applied Epidemiology Thesis Second Semester, 2019 17 POPH8920F - Applied Epidemiology Thesis First Semester, 2020 24
Reference
1. About us: Institut Pasteur du Cambodge [cited 2019 9 April 2019]. Available from:http://www.pasteur-kh.org/home/about-us/.
2. Martin K. SaTScan™ , a free software that analyzes spatial, temporal and space-time datausing the spatial, temporal, or space-time scan statistics 2018 [Available from:https://www.satscan.org/.
3. Annear PL, Grundy J, Ir P, Jacobs B, Men C, Nachtnebel M, et al. The Kingdom ofCambodia Health System Review. Phnom Penh: Ministry of Health; 2015.
4. Cambodia Communicable Diseas Control (CCDC). CamEWARN Phnom Penh: CCDC; 2020[Available from: http://www.cdcmoh.gov.kh/surveillance/camewarn.
5. Cambodia Communicable Diseas Control (CCDC). COVID-19 Documentation PhnomPenh: CCDC; 2020 [Available from: http://www.cdcmoh.gov.kh/resource-documents/covid-19-documents.

17
Chapter 2 : An outbreak of unknown etiology associated with fresh cucumbers in a residential facility in Cambodia, 2019

Chapter 2
18
(This page has been intentionally left blank)
An outbreak of unknown etiology associated with fresh cucumbers in a residential facility in Cambodia, 2019
19
Prologue
Rationale
This chapter presents an internal report of an outbreak of unknown etiology associated
with fresh cucumbers in a residential facility in Cambodia, in 2019. This outbreak
investigation is my first out of four projects to fulfill the competencies of the MAE program.
The investigation was led by Cambodia Communicable Disease Control Department
(CCDC) in collaboration with the Department of Drugs, Food Safety, Medical Equipment,
and Cosmetics, Ministry of Health; Department of Agro-Industry, Ministry of Agriculture,
Forestry and Fisheries; Banteay Mean Chey Provincial Health Department; Pursat
Provincial Health Deportment; US Centre for Disease Control, Cambodia; and World
Health Organization, Cambodia.
I received permission from Dr. Sovann Ly, Director of Cambodia’s CDC, to join the
investigation team for my learning purposes.
Roles
Dr. Chan Vuthy, principal investigator, allowed me to do the following tasks.
1. Interviewing the cases and controls
2. Creating a data entry frame using Epi-Data software
3. Performing data analysis
4. Present findings to the local authorities, and
5. Writing the outbreak report
Lessons Learnt
From my role in the outbreak investigation, I have gained significant knowledge, which will
help me to provide a better contribution to a similar outbreak in the future.
1. Coordination was key. An outbreak usually requires a rapid response. The principal
investigator needs to manage people from different institutes, which might have
limited or no previous experience in outbreak investigations. Giving the team

Chapter 2
20
members explicit instruction can reduce the risk of missing information, which is
helpful for data interpretation and conclusion.
2. Without human specimen collection, the investigation was incomplete.
Epidemiological investigation can help us to identify the risk factors but does not
necessarily help us to draw definitive conclusions about the source of acquisition.
Sample collection and pathogen isolation are essential to help us conclude our
investigation. In our case, we failed to collect human specimens. We relied on our
original hypothesis that the cause of illness would be associated with pesticide
detection from cucumbers, which were found to be a risk factor of the illness.
However, pesticides were not detected from the implicated cucumbers. Blood and
stool samples from ill individuals may have assisted in identifying an alternative
hypothesis for the cause of the outbreak.
3. The retrospective cohort design may only need similar resources compared to
case-control. However, it would give a better measurement than the case-control
design. In our case, we wanted to test whether the illness was associated with
eating fresh cucumbers. The population was in a residential facility where a list of
names of all people in the facility could be obtained. We knew through the
notification from the Provincial Health Department to CCDC that 29.3%
(n=237/810) of the residents in the facility were ill, suggesting a high attack rate
among residents. The well-defined population and high proportion of illness of the
population meant a cohort study design was possible. I re-calculated the sample
size if the cohort study design would have been chosen. We would have needed a
very similar sample size to the sample size of the case-control study. However, we
could have calculated absolute risk after exposure and the risk ratio from a cohort
study design. This is better than an odd ratio in estimating the strength of
association between exposure and outcome of interest.
4. The way that we asked cases to nominate controls led to a change in our design
unintentionally. This happened because cases nominated controls who were their
roommates. This means that they were in the same building and slept in the same
room. In this facility, men stayed in separate buildings to women. This led to men
inviting men and women inviting women to participate. On top of that, roommates
were of a similar age. This sampling methodology prevented us from controlling for
An outbreak of unknown etiology associated with fresh cucumbers in a residential facility in Cambodia, 2019
21
these three variables—building, sex, and age—in our analysis, all of which were
potential risk factors.
5. During a field investigation, the risk of recall bias cannot be ignored. During the
interviews, I observed that the majority of my interviewees could not remember
what they ate in the past three days. The other interviewers reported similar issues.
We addressed this by reviewing the vegetable and meat invoice and notebook of
the facility’s cook who prepared the food for all residents. All respondents had no
alternative for food in the residential facility, they all at the same food from the
facility’s cook. We then only asked if they ate the food prepared by the facility’s
cook if they were not able to remember details. If the answer was “Yes,” we used
the cooks record to identify specific details on what they have eaten.
Public Health Impact
The immediate impact of this investigation was that we were rapidly able to stop the
outbreak in the facility. However, the further impact on the community was not assessable.
Acknowledgments
My involvement in the project could not have happened without kindness from the CCDC
management team. I sincerely thank Dr. Ly Sovann, Director of CCDC, for this approval
to let me join the investigation team and Dr. Chan Vuthy, Deputy Director of CCDC, and
the principal investigator of the investigation, for allowing to do data analysis, present the
findings and write the report. These tasks were critical for me to meet the MAE
competencies for the outbreak project.
Profound thanks to the inputs from staff and experts of the Department of Drugs, Food
Safety, Medical Equipment, and Cosmetics, Ministry of Health; Department of Agro-
Industry, Ministry of Agriculture, Forestry and Fisheries; Banteay Mean Chey Provincial
Health Department; Pursat Provincial Health Deportment; US Centre for Disease Control,
Cambodia; and World Health Organization, Cambodia.
My sincere thanks to all study participants who kindly shared their personal information,
which is valuable to make the analysis more meaningful.

Chapter 2
22
Finally, profound thanks to all my supervisors—Patrice Piola, Tambri Housen, and Vincent
Herbreteau – for their constructive comments during the report writing. It was a great
learning opportunity to write an outbreak report.

An outbreak of unknown etiology associated with fresh cucumbers in a residential facility in Cambodia, 2019
23
Abstract
Background: Between 30 November and 2 December 2019, an outbreak of unknown
etiology affected more than 200 people, including two deaths in a residential facility in
Banteay Mean Chey province in Cambodia. We investigated the outbreak to identify the
cause, mode of transmission, and recommend appropriate control measures.
Method: A case-control study with 28 cases and 60 controls was conducted between 3-5
December 2019. The cucumbers, spinach, and water were transported for microbiological
testing of E. Coli, Salmonella, Clostridium perfringens, and Staphylococcus aureus at the
National Reference Medical Laboratory. In addition, pesticide residues testing by Gas
chromatography-mass spectrometry (GC-MS) machine against 999 pesticide types
provided by pesticide library software was done at the Industrial Laboratory Centre of
Cambodia.
Result: 810 residents lived in the affected facility at the time of the event. Two-hundred-
thirty-seven residents (n=237, 29.3%) became ill between 30 November and 2 December
2019. Of the 28 cases interviewed, symptoms included headache (n=24, 85.7%),
stomach-aches (n=19, 67.9%), dizziness (n=19, 67.9%), vomiting (n=17, 60.7%), fever
(n=17, 60.7%), nausea (n=16, 57.1%), chest oppression (n=16, 57.1%), diarrhea (n=13,
46.4%), neck pain (n=9, 32.1%), blurred vision (n=9, 32.1%), and seizure (n=1, 3.6%). Of
the meals and snacks consumed between 30 November and 1 December 2019, eating
cucumber was the only risk factor associated with illness. Of the cases, 85.7% (n=24/28)
had eaten cucumbers compared to 30.5% (n=18/60) of controls, OR = 13.7 (95% CI; 4.1,
45.1, P-value <0.001). Cases were 10.3 times (95% CI; 2.5, 42.4) and 16.4 times (95%
CI; 4.5, 59.9), more likely to have eaten cleaned and uncleaned cucumbers than controls.
However, laboratory analysis failed to detect pathogens and any pesticide residue from
cucumber samples.
Conclusion: Our epidemiological study suggests a strong association between eating
cucumbers and illness. However, laboratory analysis failed to detect a causative agent.
Toxicology testing was not conducted, and therefore we were unable to rule out
contamination of the cucumbers.

Chapter 2
24
Abbreviation
CamEWARN Cambodia Early Warning System
CDC Communicable Disease Control Department
DAI Investigation team members from the Department of Agro-Industry
GC-MS Gas chromatography-mass spectrometry
MAFF Ministry of Agriculture Forestry and Fisheries
MERS Middle East Respiratory Syndrome
MoH Ministry of Health
RRT Rapid Response Team
SARS Severe Acute Respiratory Syndrome
STEC Shiga toxin-producing Escherichia
US CDC US Centers for Disease Control and Prevention
An outbreak of unknown etiology associated with fresh cucumbers in a residential facility in Cambodia, 2019
25
Introduction
On the morning of 1 December 2019, the Communicable Disease Control Department
(CDC) of the Ministry of Health (MoH) of Cambodia declared an outbreak of unknown
etiology and source. The outbreak resulted in 237 cases, including two deaths, in a two-
day period, over Saturday 30 November and Sunday 1 December 2019. A multi-sectoral
investigation team was established on Monday, 2 December 2019, to investigate the
source of the outbreak.
The outbreak of unknown etiology occurred in a residential facility in Banteay Mean Chey
province of Cambodia. At the time of the outbreak of unknown etiology, the residential
facility had 810 residents. The majority (762 out of 810) of the residents were males. On
the premises, 48 female residents stayed in one building while the 762 male residents
lived in three buildings (over 200 people per building). As part of the residential facility’s
policy, residents were not allowed to go outside the premises. The residential facility’s
cook prepared the food. Without any alternative, all residents ate the same food, which
was a single type of food at every meal.
On Saturday, 30 November, in the evening (between 7-9 PM), three residents complained
they were ill with symptoms such as vomiting, diarrhea, abdominal pain, and dizziness. In
the meantime, other residents became ill with similar symptoms. Some 72 residents were
hospitalized on that day, 160 residents on Sunday 1 December, and five others on Monday
2 December. Two of the affected residents died on Sunday, 1 December 2019. One died
in a private clinic at around 2 PM or around 20 hours after symptom onset, and another
one died at the provincial referral hospital, at 7 PM or around 24 hours after symptom
onset.
Illness due to contaminated food is life-threatening and a public health concern around the
globe. According to the World Health Organization (WHO), globally, 1 in 10 people fell ill
after eating unsafe, contaminated food in 2015 (1). The same source suggested that 31
agents – bacteria, viruses, parasites, toxins, and chemicals—were identified as the source
of food poisoning or gastro-intestinal disease (1). Southeast Asian countries have the
highest prevalence of food poisoning events (1). According to Dewanti-Hariyadi, and
Gitapratiwi, Shigella flexneri, Salmonella, and Vibrio cholerae O1 are the most common
agents in the region (2). Pesticide-contaminated food outbreaks are also commonly
reported in the region (3).
Chapter 2
26
In Cambodia, food safety is a priority agenda for the Ministry of Health. However, illness
due to contaminated food remains common. Under the leadership of MoH’s CDC, with
technical and financial support from its partners, Cambodia has a weekly outbreak tracking
system, known as CamEWARN or Cambodia Early Warning System (4). CamEWARN
notifies seven epidemic diseases-- Avian Influenza, Severe Acute Respiratory Syndrome
(SARS), Severe Watery Diarrhea, Swine Influenza, Middle East Respiratory Syndrome
(MERS), and other Diseases (e.g., food poisoning, mass fainting) (4). This system enables
an early response by the Rapid Response Team (RRT) in each province and all relevant
institutions.
This chapter describes the process of investigation related to this outbreak and the attempt
to identify the cause, mode of transmission, and recommended appropriate control
measures.
Methods
As mentioned above, the outbreak occurred from 30 November to 2 December 2019. The
investigation started on 3 December and finished on 5 December 2019 after no more
cases were reported.
Case definition
We defined a person as a case if he/she was a resident in the affected facility, and had
ANY TWO of the following symptoms -- Diarrhea (including bloody diarrhea), vomiting,
dizziness, headache, seizure, difficulty breathing, chest oppression (tightness), mouth
numbness, and blurred vision-- between 30 November and 2 December 2019. The
definition was formulated based on the medical records of ill residents.
All ill residents were sent for treatment in two nearby referral hospitals and returned to the
residential facility when they felt better (some symptoms remained).
Epidemiologic Investigation
The local Rapid Response Team (RRT) team was informed by the residential facility
management that the residents fell hours after eating cucumbers. RRT team conducted a
short interview with the 207 residents who fell ill, using an unstructured questionnaire.
RRT team noted whether the affected residents ate fresh cucumbers, the number of
cucumbers they ate, when they ate cucumbers, and what else they ate. We did a
An outbreak of unknown etiology associated with fresh cucumbers in a residential facility in Cambodia, 2019
27
descriptive analysis from this unstructured RRT’s notes and found that 204 of them
reported they ate fresh cucumbers ranging from 0.5 to 10 fresh cucumbers per person.
We assumed the residents ate the same breakfast, lunch, and dinner because they had
no alternative food except skipping meals.
The investigation team hypothesized that illness was associated with eating fresh
cucumbers.
This hypothesis was generated from the first day of activities (3 December 2019) including:
- Meeting with provincial Rapid Response Team who learned about the outbreak
and formed the initial response,
- Visiting the residential facility,
- Conducting unstructured interviews with the staff of the residential facility, medical
staff at the hospital, mobile doctors and nurses who treated ill residents at the
facility, and ill residents, and
- Reviewing the medical records. During the treatment period, the provincial Rapid
Response Team (RRT) recorded patients’ profile—age, gender, symptoms, time
of symptom onset, and the consumption of cucumbers and/or spinach before
getting sick. The information recorded was unstructured.
A case-control study with one case to two-control ratio was conducted to confirm this
hypothesis. The case-control study design was selected due to time constraints and limited
resources.
We defined a person as a control if he/she was a resident in the affected facility during the
event, but did not meet the above case definition.
In our case-control study, we interviewed a sample of 30 cases and 60 controls. This
sample size was calculated using OpenEpi Software with the following inputs: (1) two-
sided confident level at 95%, (2) power or chance of detecting at 80%, (3) expected
proportion of case with exposure at 83.3% (based on medical records), (4) proportion of
control with exposure at 50% (based on brief interviews with residential facility staff), (5)
ratio of control to the case of two to increase the power of the result (the ratio of two
controls to one case is recognized as enough to draw robust statistical inferences with little
Chapter 2
28
gained from increasing the number of controls per case)(6), and (6) Fleiss’ continuity
correction model was chosen due to its ability to generate the largest sample size
compared to other models (7). With these assumptions, we needed 28 cases and 55
controls to detect the difference in exposure. We then rounded up to 30 cases and 60
control.
A three-page questionnaire was created to collect demographics (age, sex), main
exposure (eating cucumber, cleaning cucumber, number of cucumbers eaten), other
potential exposures (breakfast, lunch, dinner, snack), and drinking water.
The cases were randomly selected from medical records. Thirty unique integers without
replacement were randomly selected from a list of 1-237 using a Web-based application,
namely “Randomizer.org.” During case interviews, every case was asked for names of two
peers who slept next to them but did not become ill.
The data collection was conducted on Thursday, 5 December 2019, at a residential facility.
After the cases were randomly selected, their names were listed. The staff of the
residential facility was asked to refer the selected cases with a name list. The cases were
briefly explained the process of data collection before the interview. Each interview lasted
about 15 to 20 minutes. A body soap was given to the interviewee after interviewing.
Before they left, they were asked to refer two of their peers who shared the sleeping room
with them. The same questionnaire and process were used for controls as was used for
cases.
Descriptive data analysis was conducted to determine the attack rate, common symptoms,
date and time of symptom onset, and incubation period. Bivariate analysis was conducted
to understand whether the characteristics of the cases and control were comparable. Chi-
square or Fisher Exact test was used to determine the association between being a case
and exposure to cucumbers; a P-value of less than 0.05 was considered indicative of a
significant association (8). Additional variables such as cleaning the cucumber prior to
eating, the number of cucumbers eaten, having a meal at the facility, and drinking water
at the facility were also analyzed to support the interpretation. We aimed to include
variables with a P-value > 0.25 in a multivariable analysis. However, no variable besides
cucumber was significantly associated with the illness during the bivariate analysis (P-
value > 0.25). Therefore, multivariate analysis was not performed in this study.
An outbreak of unknown etiology associated with fresh cucumbers in a residential facility in Cambodia, 2019
29
Medical and chemical laboratory testing
Three cucumbers, a bunch of spinach, and a bottle of water were transported for testing
for common pathogens including E. Coli, Salmonella, Clostridium perfringens,
Staphylococcus aureus at National Reference Medical Laboratory, MoH.
Another set of three cucumbers and a bunch of spinach were also sent for pesticide
residues testing by Gas chromatography-mass spectrometry (GC-MS) machine at
Industrial Laboratory Centre of Cambodia, Institute of Standard Cambodia, Ministry of
Industry and Handicraft. The samples were tested against the 999 pesticide type provided
by the Pesticide library software.
Human specimens such as blood or stool were not collected due to miscommunication
among the local RRT team. The absence of a laboratory technician in the investigation
team also contributed to this investigation neglecting to include human samples.
Environmental investigation
The investigation team spent one day on the premises of the residential facility to review
the cleanliness of the kitchen, toilet, bathroom, sleeping space and material, and how the
food was handled. In addition, the investigation team conducted unstructured interviews
with the staff of the residential facility and residents on the premises to understand
potential sources of acquisition and modes of transmission. Environmental samples were
not collected.
Trackback investigation
Investigation team members from the Department of Agro-Industry (DAI) and the Ministry
of Agriculture Forestry and Fisheries (MAFF) conducted a trackback investigation to
identify the supplier and source of the implicated cucumbers. The aim of the trackback
was to learn whether the cucumbers had been sold or distributed to others and identify the
chemical compounds in the fertilizers and pesticides used by the farmer before harvesting.
Ethical approval
Ethical approval was not required due to the need for immediate public health action.
Outbreak investigations are conducted under National and Regional public health acts,
and review by an Ethics Review Board is not required. However, for the purposes of

Chapter 2
30
publication in this investigation is covered under the Australian National University
Human Research Ethics Committee approval (2017/909).
Result
Descriptive epidemiology
According to the medical records, 29.3% (n=237/810) of the residents in the residential
facility met the case definition (Table 2.1). Stratified by residential building, three out of
four buildings had similar attack rates at 42.8% (n=122/285) in building A, 43.8% (n=21/48)
in building B, 6.8% (n=15/222) in building C, and 31.0% (n=79/255) in building D. The
attack rate among males (n=216/761, 28.3%) appeared to be lower than the attack rate
among females (n=21/48., 43.8%).
Table 2.1. Outbreak of unknown etiology at a residential facility in Cambodia, Attack rate, by building, and sex 30 Nov-2 Dec 2019
Total Ill Attack Rate (%) Overall 810 237 29.3 Building
A (for male only) 285 122 42.8 B (for female only) 48 21 43.8 C (for male only) 222 15 6.8 D (for male only) 255 79 31.0
Gender Male 762 216 28.3 Female 48 21 43.8
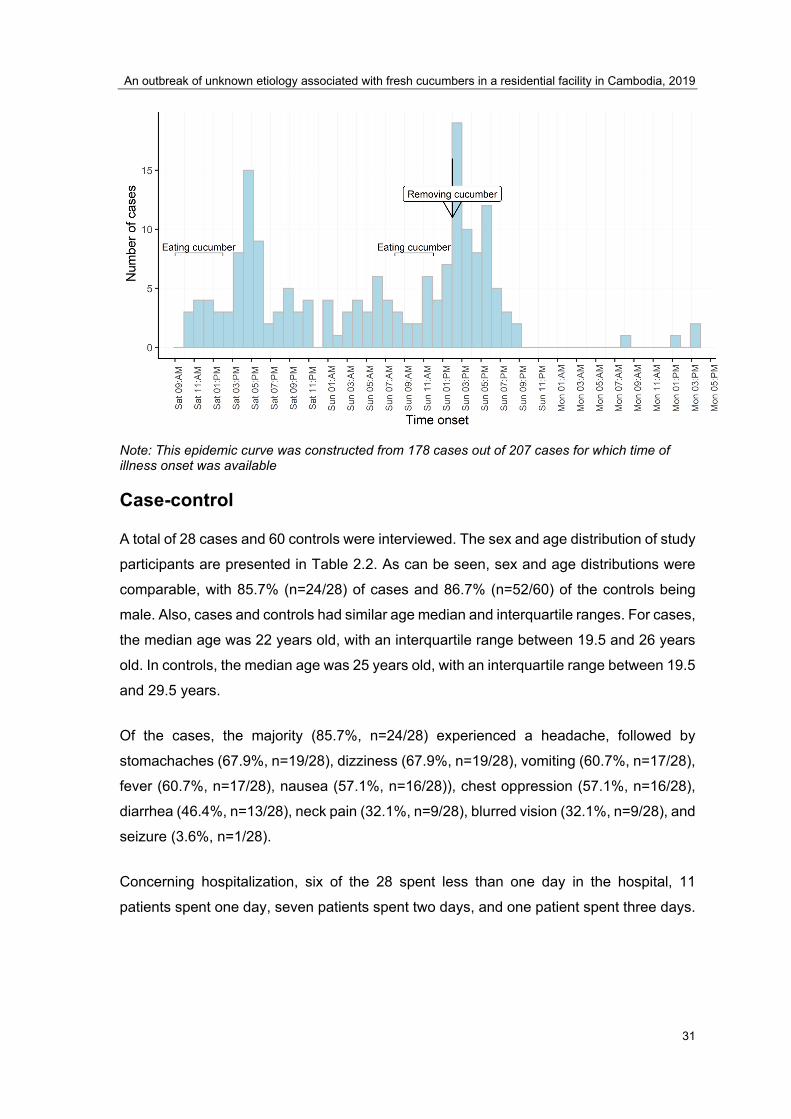
Figure 2.1 is the epidemic curve, which was constructed from 197 out of 207 cases in
which time of symptom onset data was available. The epidemic curve suggested that the
outbreak was from a point source. The outbreak happened within 52 hours, with the first
case reported at 10 AM on Saturday 30th November and the last case reported at 2 PM on
the 2 December 2019. The onset of illness occurred predominantly in the afternoon of
Saturday 30th November and the afternoon of Sunday 1st December. This coincided with
residents eating fresh cucumbers as a snack after lunch on Saturday and after breakfast
on Sunday.
Figure 2.1 Epidemic curve of the outbreak of unknown etiology at a residential facility in Cambodia between 30 Nov-2 Dec 2019
An outbreak of unknown etiology associated with fresh cucumbers in a residential facility in Cambodia, 2019
31
Note: This epidemic curve was constructed from 178 cases out of 207 cases for which time of illness onset was available
Case-control
A total of 28 cases and 60 controls were interviewed. The sex and age distribution of study
participants are presented in Table 2.2. As can be seen, sex and age distributions were
comparable, with 85.7% (n=24/28) of cases and 86.7% (n=52/60) of the controls being
male. Also, cases and controls had similar age median and interquartile ranges. For cases,
the median age was 22 years old, with an interquartile range between 19.5 and 26 years
old. In controls, the median age was 25 years old, with an interquartile range between 19.5
and 29.5 years.
Of the cases, the majority (85.7%, n=24/28) experienced a headache, followed by
stomachaches (67.9%, n=19/28), dizziness (67.9%, n=19/28), vomiting (60.7%, n=17/28),
fever (60.7%, n=17/28), nausea (57.1%, n=16/28)), chest oppression (57.1%, n=16/28),
diarrhea (46.4%, n=13/28), neck pain (32.1%, n=9/28), blurred vision (32.1%, n=9/28), and
seizure (3.6%, n=1/28).
Concerning hospitalization, six of the 28 spent less than one day in the hospital, 11
patients spent one day, seven patients spent two days, and one patient spent three days.
Chapter 2
32
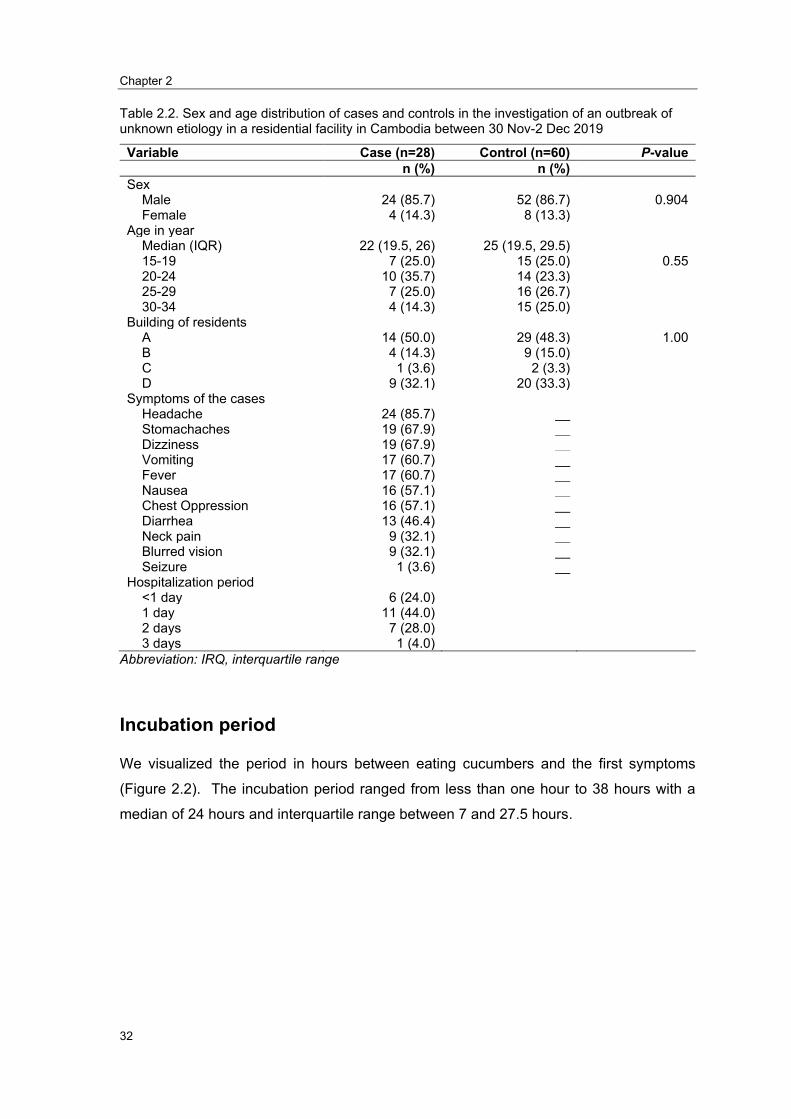
Table 2.2. Sex and age distribution of cases and controls in the investigation of an outbreak of unknown etiology in a residential facility in Cambodia between 30 Nov-2 Dec 2019
Variable Case (n=28) Control (n=60) P-valuen (%) n (%)
Sex Male 24 (85.7) 52 (86.7) 0.904 Female 4 (14.3) 8 (13.3)
Age in year Median (IQR) 22 (19.5, 26) 25 (19.5, 29.5) 15-19 7 (25.0) 15 (25.0) 0.55 20-24 10 (35.7) 14 (23.3) 25-29 7 (25.0) 16 (26.7) 30-34 4 (14.3) 15 (25.0)
Building of residents A 14 (50.0) 29 (48.3) 1.00 B 4 (14.3) 9 (15.0) C 1 (3.6) 2 (3.3) D 9 (32.1) 20 (33.3)
Symptoms of the cases Headache 24 (85.7) __ Stomachaches 19 (67.9) __ Dizziness 19 (67.9) __ Vomiting 17 (60.7) __ Fever 17 (60.7) __ Nausea 16 (57.1) __ Chest Oppression 16 (57.1) __ Diarrhea 13 (46.4) __ Neck pain 9 (32.1) __ Blurred vision 9 (32.1) __ Seizure 1 (3.6) __
Hospitalization period <1 day 6 (24.0) 1 day 11 (44.0) 2 days 7 (28.0) 3 days 1 (4.0)
Abbreviation: IRQ, interquartile range
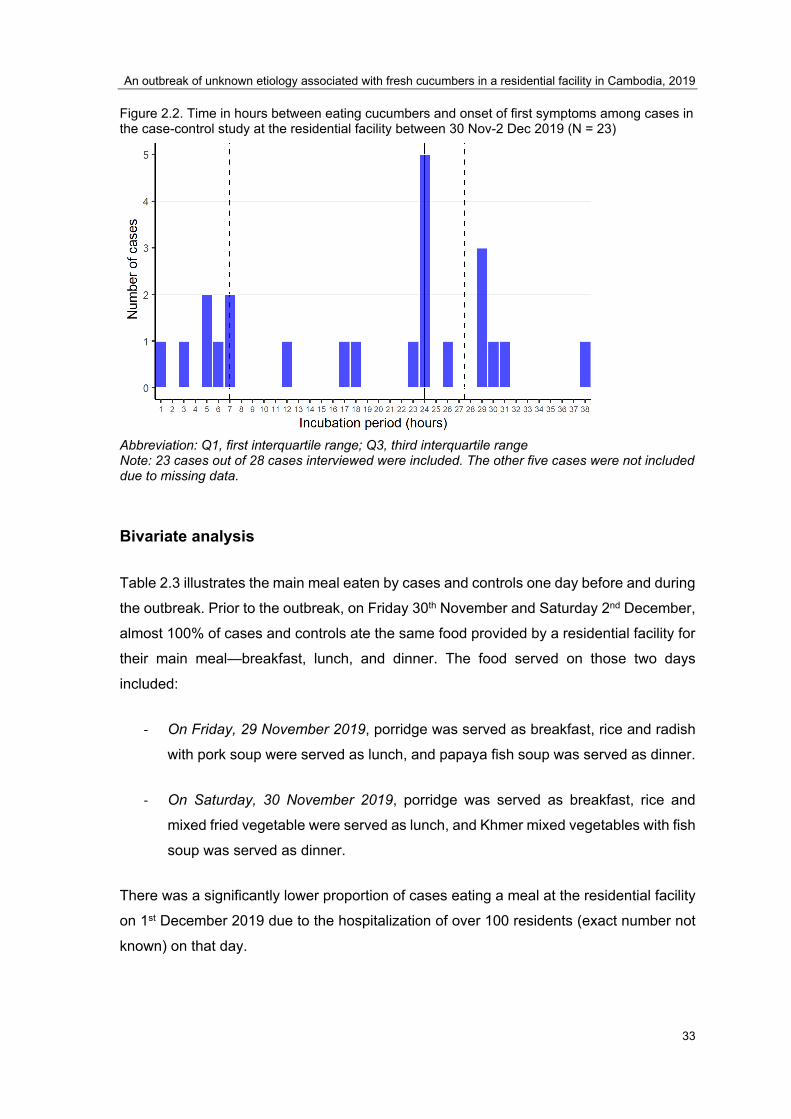
Incubation period
We visualized the period in hours between eating cucumbers and the first symptoms
(Figure 2.2). The incubation period ranged from less than one hour to 38 hours with a
median of 24 hours and interquartile range between 7 and 27.5 hours.
An outbreak of unknown etiology associated with fresh cucumbers in a residential facility in Cambodia, 2019
33
Figure 2.2. Time in hours between eating cucumbers and onset of first symptoms among cases in the case-control study at the residential facility between 30 Nov-2 Dec 2019 (N = 23)
Abbreviation: Q1, first interquartile range; Q3, third interquartile range Note: 23 cases out of 28 cases interviewed were included. The other five cases were not included due to missing data.
Bivariate analysis
Table 2.3 illustrates the main meal eaten by cases and controls one day before and during
the outbreak. Prior to the outbreak, on Friday 30th November and Saturday 2nd December,
almost 100% of cases and controls ate the same food provided by a residential facility for
their main meal—breakfast, lunch, and dinner. The food served on those two days
included:
- On Friday, 29 November 2019, porridge was served as breakfast, rice and radish
with pork soup were served as lunch, and papaya fish soup was served as dinner.
- On Saturday, 30 November 2019, porridge was served as breakfast, rice and
mixed fried vegetable were served as lunch, and Khmer mixed vegetables with fish
soup was served as dinner.
There was a significantly lower proportion of cases eating a meal at the residential facility
on 1st December 2019 due to the hospitalization of over 100 residents (exact number not
known) on that day.

Chapter 2
34
Table 2.3 Results of analysis of possible risk factors associated with an outbreak of unknown etiology in a residential facility in Cambodia between30 Nov-2 Dec 2019
Variable Case (N=28) n(%)
Control (N=60) n(%)
OR (95% CI) P-value
Friday meal Residential facility’s breakfast (porridge)
No 2 (7.1) 3 (5.0) Ref. Yes 26 (92.9) 57 (95.0) 0.7 (0.1, 4.3) 0.687
Residential facility’s lunch (radish with pork soup) No 0 (0.0) 0 (0.0) __ __ Yes 28 (100.0) 60 (100.0) __ __
Residential facility’s dinner (papaya fish soup) No 1 (3.6) 0 (0.0) __ 0.318 Yes 27 (96.4) 60 (100.0) __
Saturday meal Residential facility’s breakfast (porridge)
No 3 (10.7) 1 (1.7) __ 0.093 Yes 25 (89.3) 59 (98.3) __
Residential facility’s lunch (fried mixed vegetable ) No 0 (0.0) 1 (1.7) __ 1.00 Yes 28 (100.0) 59 (98.3) __
Residential facility’s dinner (Khmer mixed vegetable with fish soup (Korko)) No 1 (3.6) 0 (0.0) __ 0.318 Yes 27 (96.4) 60 (100.0) __
Sunday meal Residential facility’s breakfast (porridge)
No 5 (17.9) 1 (1.8) Ref. Yes 23 (82.1) 56 (98.3) 0.1 (0.0, 0.7) 0.026
Residential facility’s lunch (green spinach with pork soup) No 3 (11.1) 0 (0.0) __ 0.028 Yes 24 (88.9) 60 (100.0) __
Residential facility’s dinner (Vietnamese fish soup (Machu Youn) No 6 (22.2) 0 (0.0) __ 0.001 Yes 22 (77.8) 60 (100.0) __
Pipped water (Fri-Sat) No 2 (7.1) 8 (13.3) Ref. Yes 26 (92.9) 52 (86.7) 2.0 (0.4,
10.1) 0.402
Abbreviation: IRQ, interquartile range; OR, odds ratio; CI, confidence interval; Ref., reference
Table 2.4 compares the proportions of cases and controls who ate cucumbers, which was
our hypothesized exposure. In cases, 85.7% (n=24/28) ate cucumber on Saturday 30
November and/or Sunday 1 December 2019, compared to 30.5% (n=18/60) of the
controls. Residents meeting the case definition were 13.7 times (95% CI; 4.1, 45.1, P-
value <0.001), more likely to have eaten cucumbers than controls.

An outbreak of unknown etiology associated with fresh cucumbers in a residential facility in Cambodia, 2019
35
Regarding whether they cleaned cucumbers before eating or not, the risk was lower
among those who cleaned cucumbers before eating and increased among those who did
not clean before eating. The odds of eating cleaned and uncleaned cucumbers, among
cases, were 10.3 (95% CI; 2.5, 42.4) and 16.4 (95% CI; 4.5, 59.9), respectively, times the
odds of eating cleaned and uncleaned cucumbers among controls. Cases were 10.3 and
16.4 times more likely than controls to have eaten cleaned or uncleaned cucumbers,
respectively.
Table 2.4 Cucumber consumption among cases and controls in a residential facility in Cambodia between 30 Nov-2 Dec 2019
Variable Case (n=28) N(%)
Control (n=60) N(%)
OR (95% CI) P-value
Ate cucumber (clean and not clean) No 4 (14.3) 41 (69.5) Ref. Yes 24 (85.7) 18 (30.5) 13.7 (4.1, 45.1) <0.001
Ate cucumber (cleaned) Yes 8 (28.6) 8 (13.6) 10.3 (2.5, 42.4) <0.001 No 16 (57.1) 10 (17.0) 16.4 (4.5, 59.9) <0.001 Didn't eat 4 (14.3) 14 (69.5) Ref.
Number of cucumbers eaten (clean and not clean) 0 2 (7.1) 42 (70.0) Ref. 0.5 14 (50.0) 9 (15.0) 32.7 (6.3, 169.6) <0.001 1-2 5 (17.9) 4 (6.7) 26.3 (3.8, 181.6) 0.001 >=3 7 (25.0) 5 (8.3) 29.4 (4.7, 182.3) <0.001
Ate cucumber with salt and chilly No 13 (54.2) 10 (55.6) Ref. Yes 11 (45.8) 8 (44.4) 1.1 (0.3, 3.6) 0.929
Ate cucumber with noodles (Fri-Sat) No 21 (75.0) 51 (85.0) Ref. Yes 7 (25.0) 9 (15.0) 1.9 (0.6, 5.7) 0.262
Abbreviation: IRQ, interquartile range; OR, odds ratio; CI, confidence interval; Ref., reference
Medical and chemical laboratory testing
E. Coli, Salmonella, Clostridium perfringens, Staphylococcus aureus, and pesticide
residue were not detected from the cucumber sample.
Chapter 2
36
Environmental investigation
The result from the environmental investigation suggested that residents were living with
poor hygiene and sanitation, and the buildings were overcrowded. Poor sanitation and
hygiene during cooking were also observed.
The cooking facilities, toilet facilities, drainage systems, water supply systems were not
cleaned. The residents had no full access to safe drinking water. The residents did not
have enough materials to wash their clothes, mats, mattresses, blankets, pillows, and
bolsters.
Trackback investigation
Findings from the trackback investigation suggested that the facility received 80 kilograms
of cucumbers from a single source--a local vegetable whole seller-- as a donation. The
whole seller bought these cucumbers from a single farmer in a neighboring province.
Although the farmer and the whole seller claimed they had sold these cucumbers to others
as well, the investigation was not extended to identify the other users. This was due to
limited resources. We acknowledge this as a limitation.
In addition, our team members collected empty bags of insecticides and fertilizers from
the farm to identify the chemical compounds. However, according to the farmer, these
insecticides and fertilizers were used a long time before harvesting.
Discussion
The outbreak of unknown etiology occurred between 30th November and 2nd December
2019 in a residential facility in Banteay Mean Chey province in Cambodia. A total of 29.3%
(n=237/810) of residents who lived in the residential facility were hospitalized, and two
died. These cases presented symptoms such as headache, stomachaches, dizziness,
vomiting, fever, nausea, chest oppression, diarrhea, neck pain, blurred vision, and seizure.
The outbreak lasted for a total of 52 hours from the first reported onset of symptoms until
the last reported onset of symptoms.
From the epidemiological investigation, cucumbers were identified as the only risk factor
of the outbreak. However, no causative pathogen or pesticide was isolated from the
implicated cucumbers
An outbreak of unknown etiology associated with fresh cucumbers in a residential facility in Cambodia, 2019
37
From the epidemiological perspective, the association between consuming cucumbers
and being ill was very strong. We discuss our findings against the Bradford Hill criteria of
casual relationship (9). First, there was a strong association between eating cucumbers
and getting ill. As presented in the result section, residents meeting the case definition
were 13.7 times more likely to have eaten cucumbers than controls. Second, it was clear
that people in the residential facility accessed to the same primary food – breakfast, lunch,
and dinner-- and drinking water. There was no alternative food during the period of the
investigation except cucumbers. In building C, cucumbers were distributed late, and only
a small proportion of cucumbers was eaten. Building C had the lowest attack rate of 6.8%,
compared to the attack rate between 31.0% and 43.8% in other buildings where all
cucumbers were eaten. Third, symptom onset occurred after ingesting cucumbers. This
implicates cucumbers as a possible source of the outbreak. Fourth, there was a biological
explanation that those who reported cleaning cucumbers before eating had a lower risk of
being ill. This provides evidence that cucumber was potentially contaminated with a
poisoning substance or pathogen. According to some residents, those who died were
people who ate the cucumbers before others, and they could eat as many as they wanted.
To our best knowledge, this is the first time in Cambodia that an outbreak was linked to
cucumbers. However, several documented outbreaks have been linked to cucumbers in
other settings, including cucumbers contaminated by Salmonella in the United States (10),
cucumbers contaminated with microsporidia in Sweden (11), and cucumbers
contaminated with Shiga toxin-producing Escherichia coli (STEC) in Germany (12).
In our investigation, the lack of biological investigation from those who became ill limited
the ability to identify a causative agent. Reported signs and symptoms, incubation period,
duration of illness, and severity of different agents—bacteria, virus, parasite, or chemical
intoxication, are often similar and cannot be distinguished by a physician without laboratory
evidence. Regarding this, we propose two possible sources of the outbreak. One possible
source, with an incubation period starting at 1 hour, is a toxin. Based on symptoms,
incubation period, and severity, the toxin could be Staphylococcus aureus (Staph) (13-15),
Clostridium perfringens(13, 15), Salmonella (13, 15), and Clostridium botulinum (Botulism)
(13), E. Coli (13, 15), Bacillus cereus (14, 15), Vibrio parahaemolyticus enteritis (15, 16),
and Aeromonas hydrophila (17). In our study, we tested for common bacteria such as E.
Coli, Salmonella, Clostridium perfringens, Staphylococcus aureus from the cucumbers.
Nonetheless, we did not collect samples from cases. Another possible source was
pesticide residues. However, the result of cucumber testing against 999 pesticide types

Chapter 2
38
provided by the pesticide library software using GC-MS machine could not detect any
pesticide residues (18, 19). The GC-MS machines are highly recognized and can detect
various main chemical compounds (18, 19). According to this result, cucumbers were very
unlikely to have been contaminated with harmful pesticides. This was somewhat
supported by the trackback investigation, which found that cucumbers had been sold to
different users, yet no other cases of illness had been reported. We would have expected
to see high numbers of presentations to health facilities by community members who
bought the cucumbers if they were contaminated with pesticides.
Our investigation had several limitations. First, and possibly our biggest limitation, was that
the human specimens were not collected due to miscommunication within Rapid
Response Team. This limited our ability to identify the etiology. Second, active case finding
to identify other possible cases in the community was not done due to time constraints and
resource-limited. In the context that the majority of Cambodians use private health
services, where no mandatory notification system is in place, it is possible that people
became ill due to cucumbers, but our investigation team was not made aware. Third, the
microbiological laboratory testing of cucumbers was not comprehensive enough. Other
pathogens that fit the clinical picture and incubation period were not tested for. Forth, our
unmatched case-control unintentionally became a matched case-control study. We asked
cases to refer roommates to act as controls. This automatically matched the cases and
controls based on the building. Due to males and females residing in separated buildings,
this also automatically matched the cases and controls based on their sex. In addition, it
was likely that roommates had similar ages that led to matching based on their age. With
this inadvertent matching, we were not able to control for building, sex, and age. Finally,
recall bias on food items and time of eating was also observed as a common issue. This
led to the initial incorrect calculation of the incubation period, which was important to
establishing the hypothesis on causation. Researcher bias was also a factor, with
cucumbers being implicated by the team early in the outbreak resulting in a less than
thorough hypothesis-generating questionnaire. Other possible exposures such as
environmental or alternate toxins were not considered.
Conclusion
Our epidemiological study suggests a strong association between eating cucumbers and
illness, but it lacked supporting evidence from laboratory findings. A causative agent was
not identified. However, by employing Bradford Hill’s criteria, we concluded it was plausible
An outbreak of unknown etiology associated with fresh cucumbers in a residential facility in Cambodia, 2019
39
that the contaminated cucumbers were the cause of this outbreak even without a
pathogen/agent being identified.
Recommendation
We came up with several recommendations to prevent a future outbreak and investigation
in the setting.
To prevent future outbreaks:
1. The residential facility should contract with a new vegetable supplier who was
licensed by the government.
2. Residents should be educated to practice better personal hygiene and sanitation
and provided enough cleaning material (e.g., soap, shampoo).
3. Cooking facilities, toilet facilities, drainage systems, water supply systems should
be cleaned regularly and with appropriate cleaning materials.
4. Accessing safe drinking water should be prioritized. Water filtering should be an
affordable choice.
5. Residents should be provided enough material to wash their clothes, mats,
mattresses, blankets, pillows, and bolsters.
To improve future investigation:
6. Specimens from cases should always be collected because it is a critical aspect of
all outbreak investigations, except other reasons justify it.

Chapter 2
40
Reference
1. WHO’s first ever global estimates of foodborne diseases find children under 5 accountfor almost one third of deaths [press release]. Switzerland, Geneva: WHO2015.
2. Dewanti-Hariyadi R, Gitapratiwi D. Foodborne Diseases: Prevalence of FoodborneDiseases in South East and Central Asia. In: Motarjemi Y, editor. Encyclopedia of Food Safety.Waltham: Academic Press; 2014. p. 287-94.
3. Sapbamrer R. Pesticide Use, Poisoning, and Knowledge and Unsafe OccupationalPractices in Thailand. NEW SOLUTIONS: A Journal of Environmental and Occupational HealthPolicy. 2018;28(2):283-302.
4. Communicable Disease Control Department (CDC). CamEWARN: Cambodia EarlyWarning System Phnom Penh: CDC; [Available from:http://cdcmoh.gov.kh/surveillance/camewarn.
5. UNC Gillings School of Global Public Health. FOCUS on Field Epidemiology United States:UNC; 2008 [Available from: https://sph.unc.edu/epid/focus/.
6. Hennessy S, Bilker WB, Berlin JA, Strom BL. Factors influencing the optimal control-to-case ratio in matched case-control studies. Am J Epidemiol. 1999;149(2):195-7.
7. Kelsey JL, Whittemore AS, Evans AS, Thompson WD. Methods in observationalepidemiology: Monographs in Epidemiology and Biostatistics; 1996.
8. Kim H-Y. Statistical notes for clinical researchers: Chi-squared test and Fisher's exacttest. Restor Dent Endod. 2017;42(2):152-5.
9. Hill AB. The environment and disease: association or causation? Proc R Soc Med.1965;58(5):295-300.
10. Angelo KM, Chu A, Anand M, Nguyen T-A, Bottichio L, Wise M, et al. Outbreak ofSalmonella Newport infections linked to cucumbers--United States, 2014. MMWR Morb MortalWkly Rep. 2015;64(6):144-7.
11. Decraene V, Lebbad M, Botero-Kleiven S, Gustavsson AM, LÖFdahl M. First reportedfoodborne outbreak associated with microsporidia, Sweden, October 2009. Epidemiology andInfection. 2012;140(3):519-27.
12. Frank C, Faber M, Askar M, Bernard H, Fruth A, Gilsdorf A, et al. Large and ongoingoutbreak of haemolytic uraemic syndrome, Germany, May 2011. Robert Koch-Institut,Infektionsepidemiologie; 2011.
13. US Centers for Disease Control and Prevention. Food Poisoning Symptoms: US CDC;2019 [updated October 11, 2019; cited 2020 20 Jan 2020]. Available from:https://www.cdc.gov/foodsafety/symptoms.html.
14. Panha Kimsean, Kosal Sreng, Phalmony Has, Sowath Ly, Sansam Sim, Sokheng Chhay, etal. An Outbreak of Gastrointestinal Illness Associated with Khmer Noodles: A Multipronged

An outbreak of unknown etiology associated with fresh cucumbers in a residential facility in Cambodia, 2019
41
Investigative Approach, Kandal Province, Cambodia, June 2014. Outbreak Surveillance and Investigation Report. 2014.
15. Bintsis T. Foodborne pathogens. AIMS Microbiol. 2017;3(3):529-63.
16. Vandy S, Leakhann S, Phalmony H, Denny J, Roces MC. Vibrio parahaemolyticus enteritis outbreak following a wedding banquet in a rural village - Kampong Speu, Cambodia, April 2012. Western Pacific surveillance and response journal : WPSAR. 2012;3(4):25-8.
17. Zhang Q, Shi G-Q, Tang G-P, Zou Z-T, Yao G-H, Zeng G. A foodborne outbreak of Aeromonas hydrophila in a college, Xingyi City, Guizhou, China, 2012. Western Pacific surveillance and response journal: WPSAR. 2012;3(4):39.
18. Wong JW, Zhang K, Tech K, Hayward DG, Makovi CM, Krynitsky AJ, et al. Multiresidue Pesticide Analysis in Fresh Produce by Capillary Gas Chromatography−Mass Spectrometry/Selective Ion Monitoring (GC-MS/SIM) and −Tandem Mass Spectrometry (GC-MS/MS). Journal of Agricultural and Food Chemistry. 2010;58(10):5868-83.
19. Lehotay SJ. QuEChERS sample preparation approach for mass spectrometric analysis of pesticide residues in foods. Methods in molecular biology (Clifton, NJ). 2011;747:65-91.

43
Chapter 3 : Malaria in Cambodia: a retrospective analysis of a changing epidemiology 2006-2019

Chapter 3
44
(This page has been intentionally left blank)

Malaria in Cambodia: a retrospective analysis of a changing epidemiology 2006-2019
45
Prologue
Rational
This chapter describes my data analysis project, which is one of the four core
competencies. Also, it was used to fulfil two other requirements—a conference
presentation and a manuscript submission. Three data sources were used for the
analysis. First, 14-year nationwide data between 2006 and 2019 were provided through
the Epidemiology Unit of the National Centre for Parasitology Entomology and Malaria
Control (CNM). Second, the health facilities’ geographical data were provided by Institute
Pasteur du Cambodia. Third, the population data were obtained from an open-access
dataset of the United Nations for Coordination of Humanitarian Affairs (OCHA).
The report presents in this chapter is a modified version of a manuscript entitled “Malaria
in Cambodia: a retrospective analysis of a changing epidemiology 2006-2019”, submitted
to the International Journal of Environmental Research and Public Health on 10
December 2020, and accepted for publication on 12 February 2021.
The preliminary result of this analysis was presented in the 11th International
Conference on Public Health among Greater Mekong Sub-Region Countries “Improving
Health Equity among greater Mekong Sub-Region Countries: A Public Health Challenge”
between 18 to 19 October 2019 in Laos PDR. The slide presentation is included in
Appendix 1 in this chapter.
Roles
My role was to coordinate the collection of the data, clean the data, perform data
analysis, interpret findings and write the report for this thesis and peer-review
publication.
Lessons Learnt
This analysis provided me with important knowledge of surveillance interpretation and
technical skills for surveillance data analysis.
I learned to use three software—QGIS, R programming, and SatScan-- to perform
spatial and temporal analysis. All of the three software were open-source. I started by
Chapter 3
46
joining one-week GIS training at IPC. I initiated learning R programming and SatScan by
myself, using online resources. Learning this new software was daunting at the
beginning, but I was very happy when I developed proficiency. Spatial analysis is an
important skill for applied epidemiologists. I can now employ my new skills to conduct
spatial epidemiological analysis.
The interpretation of surveillance data was more challenging than I expected. In my
case, I had 14-years of data to analyze. The malaria program in Cambodia had gone
through several main events that affected data collection on malaria during this time
period. Some of these events were not well documented. I sought out experienced
people with knowledge of the changes that had taken place in the malaria program over
time to further understand the context in which the data had been collected throughout
the 14-year time frame. I, however, was excited as I could understand the big picture of
malaria in Cambodia from this data analysis. I also learned the benefit of starting a study
with a review of surveillance data and surveillance reports to familiarize myself with the
topic.
Public Health Impact
This study provides a summary of malaria incidence in Cambodia over the past 14 years.
Findings will help to inform the approach to the malaria program in the future, including
the design of interventions, planning, and resource allocation. The spatial analysis
provides an up-to-date overview of clusters of malaria that will help to inform the
prioritisation of resource allocation to hot spot areas.
Acknowledgments
I sincerely thank Dr. Bunkea Tol, head of the Epidemiology Unit, and his staff at the
National Centre for Parasitology Entomology and Malaria Control (CNM) for providing
me the 14-year malaria surveillance data. In addition, Dr. Tol spent the time helping me
interpret the data. He also took part in writing manuscripts and provided critical inputs to
the manuscript.
Great thanks to all my supervisors— Vincent Herbreteau, Patrice Piola, and Tambri
Housen. Dr. Herbreteau trained me on how to use QGIS and introduced SatScan to me.

Malaria in Cambodia: a retrospective analysis of a changing epidemiology 2006-2019
47
These skills were essential for this data analysis project. Dr. Piola, and Dr. Housen spent
a lot of time and energy to read, provide feedback and inputs during report writing.
Chapter 3
48
Abstract
Background: Malaria remains a serious public health issue globally, even though it is
preventable and curable. In 2018, there were an estimated 228 million cases of malaria,
with 405,000 deaths worldwide. In Cambodia, malaria has been endemic since the 1950s,
and improvements in control and access to care have reduced its burden. However,
malaria persists with changing epidemiology and resistance to antimalarials. This study
aimed to describe how malaria has evolved spatially from 2006 to 2019 in Cambodia.
Methods: We undertook a secondary analysis of existing malaria data from all government
healthcare facilities in Cambodia. The epidemiology of malaria was described by sex, age,
seasonality, and species. Spatial clusters at the district level were identified with a Poisson
model.
Results: A total of 737,210 malaria cases were notified to the Health Management
Information System between 2006 and 2019. Overall, notifications decreased from 7.4
cases/1000 population in 2006 to 1.9 in 2019. The decrease has been drastic for females,
from 6.7 to 0.6/1000. Adults aged 15-49 years had the highest malaria incidence among
all age groups. The proportion of Plasmodium (P.) falciparum + Mixed among confirmed
cases declined from 87.9% (n= 67,489) in 2006 to 16.6% (n= 5,290) in 2019. Clusters of
P. falciparum + Mixed and P. vivax + Mixed were detected in forested provinces along all
national borders.
Conclusion: There has been a noted decrease in P. falciparum cases in 2019, suggesting
that intensification plan should be maintained. A decline in P. vivax cases was also noted,
although less pronounced. Interventions aimed at preventing new infections of P. vivax
and relapses should be prioritized. All detected malaria cases should be captured by the
national surveillance system to avoid misleading trends.
Malaria in Cambodia: a retrospective analysis of a changing epidemiology 2006-2019
49
Abbreviations
AS-MQ Artesunate-mefloquine
AS-PYR Artesunate-pyronaridine
DHA-PIP Dihydroartemisinin-piperaquine
HMIS Health Management Information System
MMW Mobile Malaria Worker
P. falciparum Plasmodium falciparum
P. vivax Plasmodium vivax
VMW Village Malaria Worker
PPM Private Public Mix
Chapter 3
50
Introduction
Malaria, an Anopheles mosquito-borne disease, remains a serious public health issue
globally, although it is preventable and curable (1). According to the World Health
Organization (WHO), an estimated 228 million malaria cases occurred worldwide in 2018,
compared with 251 million cases in 2010 and 231 million cases in 2017 (2). Malaria was
responsible for the loss of 405,000 lives in 2018, 416,000 lives in 2017, and 585,000 lives
in 2010 worldwide. Morbidity and mortality rates due to malaria vary from one global region
to another. The overall malaria incidence rate was 57.4 per 1000 at-risk population,
ranging from 2.6 per 1000 at-risk population in WHO Western Pacific Region covering 37
countries of Oceania, East Asia, and Southeast Asia to 229.3 per 1000 at-risk population
in WHO African Region covering 47 countries in Africa in 2018 (2-4). The deaths due to
malaria were lowest at 0.4 per 100,000 population in the WHO Region of the Americas
and highest at 41.0 per 100,000 in the WHO Africa Region. The Global mortality rate was
10.2 per 100,000 population in 2018. (2, 3, 5).
Historically Cambodia has had a high disease burden due to malaria since the 1950s (6,
7). Cambodia benefits from a tropical climate and is home to a diversity of mosquito
species, including the Anopheles species (8). Malaria vectors mainly live in forests close
to the Vietnamese, Laotian, and Thai borders (9, 10). People living or working in or near
forested areas are at higher risk of contracting malaria (11, 12).
Cambodia has been widely recognized as successful in the fight against malaria because
of the dramatic drop in malaria cases from a peak of over 100,000 cases or 7.4 per 1000
population in 2006 to over 62,000 cases or 3.9 per 1000 population in 2018. Deaths due
to malaria also dropped from around 400 reported deaths in 2006 to zero reported malaria
deaths in 2017, and 2018 (13, 14). However, Cambodia still has the highest malaria
burden compared to its neighboring countries—Vietnam, Thailand, and Laos—and the
WHO Western Pacific Region overall (2). The decline of malaria morbidity and mortality
leads the Ministry of Health to acknowledge the impact of malaria interventions combined
with the prevention, economic growth, improved infrastructure, and strengthening of the
health system (13). All of which have enabled universal access to timely malaria diagnosis
and treatment (13).
Malaria in Cambodia: a retrospective analysis of a changing epidemiology 2006-2019
51
Built on this successful experience, since the year 2011, the government has worked with
local and international partners on an elimination strategy (6, 7). Implementations were
guided by the “National Strategic Plan for Elimination of Malaria in the Kingdom of
Cambodia, 2011-2025” and the revised “Cambodia Malaria Elimination Action Framework,
2016-2020”. Cambodia has divided the country’s malaria-endemic areas into four zones
based on the annual parasite index and malarial multi-drug resistance status (6, 7). All
zones rely on quality diagnosis and treatment at health facilities, village malaria workers
(VMWs), and vector control by promoting malaria prevention education and distribution of
long-lasting insecticide nets (6, 7). However, to be more efficient and cost-effective,
specific interventions were added for each zone (6, 7). First, the elimination zone focused
on ‘transmission interruption’ through household testing, vector control, and expansion of
VMWs (6, 7). Second, the pre-elimination zone focused on universal access to diagnosis
and treatment by expanding VMWs (6, 7). Third, the reduction zone focused on the
intensification plan -- re-activating and scaling up VMWs, switching to new antimalarial
drugs, dihydroartemisinin-piperaquine (DHA-PIP) to artesunate-mefloquine (AS-MQ), and
creating mobile malaria workers (MMWs) dedicated to the diagnosis and treatment of
malaria among forest goers (7). Finally, the non-endemic zone, defined as areas where
no local transmission had been reported, use government run healthcare facilities' basic
services for diagnosis and treatment (6, 7).
As part of the elimination plan, the Ministry of Health licensed the private sector to test and
treat malaria patients between 2011 and 2018 to increase early diagnosis and treatment
accessibility. This initiative was known as "Private Public Mix (PPM)" (7). PPM provided
private point-of-care--health facilities, pharmacies, and other retailers with malaria test kits
and antimalarial drugs free-of-charge or with a subsidy (7, 15, 16). Private points of care
sites charged patients for their service provision (6, 7, 13). These were rapidly scaled up
in all endemic areas (15). According to available data through malaria outlet surveys
between 2011 and 2015, private points of care sites detected over 50% of malaria patients
in the country (15). PPM was later banned from implementing malaria testing and
treatment in April 2018 (7, 15). The reason for banning was due to malarial drug resistance
concerns and the inflexibility experienced in changing testing and treatment policy in the
private sector compared to government run healthcare facilities (7).
The road to success has been fraught with challenges. One main challenge has been
antimalarial drug resistance (17-22). Like other countries in the Greater Mekong sub-

Chapter 3
52
region—China, Myanmar, Thailand, Laos, and Vietnam—Cambodia is facing the continual
threat of antimalarial drug resistance (17-23). Cambodia first detected parasite resistance
to artemisinin in 2006, but retrospective analysis of molecular markers suggested the
resistance may have occurred as early as 2001 (6, 7, 23-25). After nine years of usage,
the first-line treatment-- AS-MQ— was replaced by DHA-PPQ in Pailin province, in 2008,
and nationally in 2010 (6, 7, 26). However, the efficacy of DHA-PPQ dropped after a short
period of usage (19, 27-29). In 2014, the cure rate of DHA-PPQ ranged from 37.5% in
Siem Reap province to 89.9% in Pursat province (6, 7, 28). In consultation with its partners,
the Ministry of Health decided to re-introduced AS-MQ as the first-line treatment nationally
in 2016 (7). However, full coverage was delayed until 2018 due to procurement issues and
funding gaps (7, 30). Cambodia relies heavily on external funding. About 70% of malaria
control funding was from the Global Fund, while the remaining 30% were from a
combination of government funds and other partners (6, 7). Core activities were severely
affected during an external funding interruption between 2015-2016, with all activities
supported by Global Fund being suspended for more than a year. This likely influenced
the increase in malaria notifications that followed in 2017 and 2018 (2, 14).
In the global fight against malaria, the WHO, in the global technical strategy for malaria
2016–2030, has called for the use of surveillance systems as a core intervention in all
malaria-endemic settings (31). Data from the malaria surveillance systems are crucial to
guide interventions, planning, and resource allocation (32-41). In 2019, malaria cases in
Cambodia were reported through two surveillance systems under the Ministry of Health's
umbrella. Those two systems are the Health Management Information System (HMIS) (42)
and the Malaria Information System (43). Created in 1993, with multiple enhancements,
HMIS captures data from all health services, including out-patient and in-patient services
at government run healthcare facilities (42). Specifically for malaria, a more reliable HMIS
was developed in 2004. Based on this data, this study aimed to describe how malaria
incidence has evolved spatially and how the sequence of untoward events and malaria
control interventions may have affected geospatial trends.
Methods
We undertook a secondary data analysis of malaria data from all government healthcare
facilities in Cambodia between 2006 and 2019. Data from private providers are not
captured in this data.
Malaria in Cambodia: a retrospective analysis of a changing epidemiology 2006-2019
53
Data sources
Malaria data
The Epidemiology Unit of the National Centre for Parasitology Entomology and Malaria
Control provided HMIS malaria data for the cases notified between January 1st 2006 and
December 31st 2019. This aggregated data included monthly malaria cases categorized
by age group, gender, type of diagnosis (rapid diagnostic test (RDT), microscope), species
(Plasmodium (P.) falciparum, P. vivax, Mixed meaning having both P. falciparum and P.
vivax), points of care for diagnosis (public hospitals, health centers and VMW), case
classification (uncomplicated, severe, death (44)), and hospitalization (yes, no).
HMIS is under the supervision of the Ministry of Health's Department of Planning and
Health Information. It is the largest health information system in Cambodia, collecting
information from all government-run services, including out-patient, in-patient, and national
program data. At the hospital level, where computers are available, data are collected and
entered by hospital staff. However, at the health center or health post level, data are
recorded in patients' logbooks. Health center data is merged with data from health posts
and VMWs by health center staff and aggregated using a standardized line-listing form
before monthly submission to the operational district. Operational districts are responsible
for entering data in the HMIS system, which is automatically synchronized to the national
database of the Department of Planning and Health Information. The operational districts
were created by the Ministry of Health to provide a local level to Cambodia's health system
administration (central/national level, provincial level, and operational district level) (42).
One operational district manages health facilities in one or more administrative districts
and covers populations between 100,000 and 200,000 (42). Of note, HMIS did not record
malaria cases diagnosed by the private sector.
Population data and maps
The population data, disaggregated by gender and age group at the district-level, were
obtained from an open-access dataset provided by the United Nations for Coordination of
Humanitarian Affairs (OCHA) (45). Population data was only available for 2016 (45). To
obtain population data for other years, we projected backward and forward using the
National Institute of Statistics’ national population growth rate (46). We also used the
district map of Cambodia from OCHA (45).

Chapter 3
54
Untoward events
We gathered untoward events to contextualize the malaria surveillance data. Information
such as treatment failures, key interventions, and events that may have impacted the case
detection were obtained from the grey literature review. We mostly relied on governmental
documents, including strategic plans and strategic plan reviews for additional untoward
events presented in this paper.
Inclusion criteria and setting
All government-run healthcare facilities (hospitals and health centers) reporting to the
HMIS were included in this study. The number of healthcare facilities increased from 1,183
in 2006 to 1,350 in 2019 (Table 3.1). During this period, some health centers were
upgraded to referral hospitals.
Table 3.1. Number of health centers and hospitals by year, reporting to the Health Management Information System (HMIS), Cambodia, 2016 and 2019
Year Number of health centers Number of hospitals Total number of facilities Population(a) 2006 1,087 96 1,183 13,474,489 2007 1,087 96 1,183 13,676,693 2008 1,087 96 1,183 13,880,509 2009 1,087 96 1,183 14,090,208 2010 1,087 96 1,183 14,308,740 2011 1,087 96 1,183 14,537,886 2012 1,087 96 1,183 14,776,866 2013 1,087 96 1,183 15,022,692 2014 1,138 104 1,242 15,270,790 2015 1,148 107 1,255 15,517,635 2016 1,168 111 1,279 15,762,370 2017 1,195 116 1,311 16,005,373 2018 1,213 121 1,334 16,245,454 2019 1,225 125 1350 16,489,135
Population data was only available for 2016 (45). To obtain population data for other years, we projected backward and forward using the National Institute of Statistics’ national population growth rate (46).
These health facilities are located in 24 provinces and the capital city of Phnom Penh
(Figure 3.1). This includes 197 administrative districts and a total of 94 operational districts.
A health center covers a catchment area of between 10,000 to 20,000 people (42).

Malaria in Cambodia: a retrospective analysis of a changing epidemiology 2006-2019
55
Figure 3.1. Locations of provinces and capital city of Phnom Penh of Cambodia
Case definition
According to the National Treatment Guideline in Cambodia, confirmed malaria cases
were persons who tested positive for P. falciparum, P. vivax, or both (“Mixed”) by RDT or
microscopy (47).
Before 2014, unconfirmed malaria cases were also counted in the HMIS system. The
definition of an unconfirmed case was a person who had not been tested for malaria with
a diagnosis based only on signs and symptoms. Unconfirmed cases were counted if they
:
─ had (fever, chills, or sweats) or (two of the following: headache, nausea, vomiting,
diarrhoea),
AND ─ any of the following: Travelled to the forest in the previous month, had confirmed
malaria in the past 28 days, travelled to a malaria-endemic area from a non-
endemic area, or lived or worked around others with a recently confirmed malaria
diagnosis (47).

Chapter 3
56
Our analysis included all cases (confirmed and unconfirmed) for overall incidence rates
and rates by sex, age, district, and seasonality. We, however, used only confirmed cases
to disaggregate by Plasmodium species as it was not possible to identify the species
among unconfirmed cases.
Data analysis
We calculated the annual malaria incidence (disaggregated by species) at the national
and district levels by dividing each year's confirmed cases by their respective populations
and obtaining incidences by gender and age group.
We investigated the existence of clusters (48, 49) by testing two hypotheses: 1) H0=
malaria cases in each district throughout the country are proportional to the population,
and 2) HA= malaria cases in one or more districts are statistically higher than expected
proportional to the population. We ran the cluster analysis using a spatial Poisson model
with SaTScan™ version 9.6 (Information Management Services Inc., Calverton, MD, USA)
at the administrative district scale, using annual malaria cases and population data (48,
49). We introduced the assumption that the cluster's radius had to be smaller than 100
kilometers or cover less than 50% of the total country malaria cases to mitigate the effect
of large cluster sizes on the analysis. Such clusters were split into smaller clusters. Another
assumption we introduced was that the relative risk (RR) had to be greater than three.
This restriction allowed us to focus the analysis on high burden clusters. RR was
calculated as A/B where “A” was the ratio of the observed malaria rate per 1000
populations to the expected rate within the circle, and “B” was the ratio of the observed
malaria rate per 1000 populations to the expected rate outside the circle. The expected
rate was from dividing annual total notifications by the total population multiplied by 1000
in the same calendar year (48, 49). In our case, in identifying clusters, SatScan used a
circle shape to scan districts with high malaria notifications. It starts from one district point.
Suppose the rate within the circle is statistically significantly higher than the rate outside
the circle. In that case, SatScan repeats scanning the same district, but it increases the
size of the circle to cover more nearby district points. It repeats the process until it reaches
the point where the rate inside and outside the circle is not statistically significant. When it
reaches this point, SatScan records the circle of the last scanning remained statistically
significant as a cluster. This is where the RR was obtained. The default Monte Carlo
replication of 999 was used with a cut-off P-value <0.001 (48, 49). In this publication, we

Malaria in Cambodia: a retrospective analysis of a changing epidemiology 2006-2019
57
used the term "cluster" in reference to SaTScan's "most likely cluster," which are clusters
detected during the first run. In the Poisson model, after the first run, SaTScan removes
all data inside the detected clusters and treats them as "no location," "no case," "no
population." It then runs again to detect clusters with the remaining data. These newly
detected clusters are called "secondary clusters." Since we are only interested in high
burden areas or "most likely clusters," we did not allow the option to display "secondary
clusters" in our analysis result.
We used Stata version 15.1 (StataCorp, College Station, Texas, USA) for descriptive data
analysis and R version 4.0 (R Foundation for Statistical Computing, Vienna, Austria) to
produce graphics and maps.
Results
Overall malaria cases and notification rate
A total of 737,210 malaria cases (confirmed or unconfirmed) was reported to HMIS
between 2006 and 2019 (3.6/1,000 population) (Figure 3.2). The highest notification was
reported in 2006, with 7.4 cases/1000 population (100,322 cases), and the lowest
notification was reported in 2016, with 1.5 cases/1000 (23,367 cases). However, the
notification did not decrease regularly over the time period, with a sharp increase to 3.9
cases/1000 in 2018 (62,582 cases) followed by a drop to 1.9 in 2019 (32,597 cases).
Between 2006 and 2013, unconfirmed malaria cases were included in the HMIS.
Unconfirmed cases made up a large proportion of all reported cases between 2006 and
2010, and subsequently dropped between 2011 and 2013. Nevertheless, the number of
confirmed cases was particularly high in 2006, and stable between 2007 and 2011.
Between 2007 and 2011, the total number of malaria cases was quite stable, with a drop
in unconfirmed cases been compensated by an increase of the confirmed cases. Since
2014, all reported malaria cases met the confirmed case definition.
After the public-private mix (PPM) program was initiated in 2011, the malaria notification
trends (in which data from the private sector was not included), dropped dramatically from
4.3 cases/1000 in 2011 to 1.6 cases/1000 in 2013. As a significant proportion of malaria
cases were detected by private sector during this period, the decreasing trend in
notification is unlikely to represent the actual notification of malaria in Cambodia for this
period of time.

Chapter 3
58
Therefore, data represented in this study must be considered in light of the changes in the
surveillance case definition over time and changes in reporting sources.
Figure 3.2. Malaria confirmed notifications (by species) per 1000 population and untoward event, 2006-2019, Cambodia
Abbreviation: AS-MQ, Artesunate-mefloquine; DHA-PIP, Dihydroartemisinin Piperaquine; AS-PYR, Artesunate-pyronaridine; VMW, Village Malaria Worker Note: unconfirmed cases were calculated by subtracting total cases with confirmed cases
The proportion of P. falciparum + Mixed peaked at 87.9% (n= 67,489) of all confirmed
malaria cases notified in 2006 to reach a lowest 16.6% (n= 5,290) of all notified cases in
2019. The proportion of P. falciparum + Mixed was highest between 2006 and 2009, when
the country was using P. falciparum-only RDTs. The proportion of P. vivax + Mixed
exceeded the proportion of P. falciparum + Mixed between 2011 and 2014, and then again
from 2017 onwards. The change occurred a year after Cambodia started using dual RDT
in late 2009, which detected both P. falciparum and P. vivax. More detailed information
can be found in supplementary (Annex 1).
Notification by sex
As presented in the previous section, the reporting changed from confirmed and
unconfirmed cases to just confirmed cases after 2013. The notification of malaria
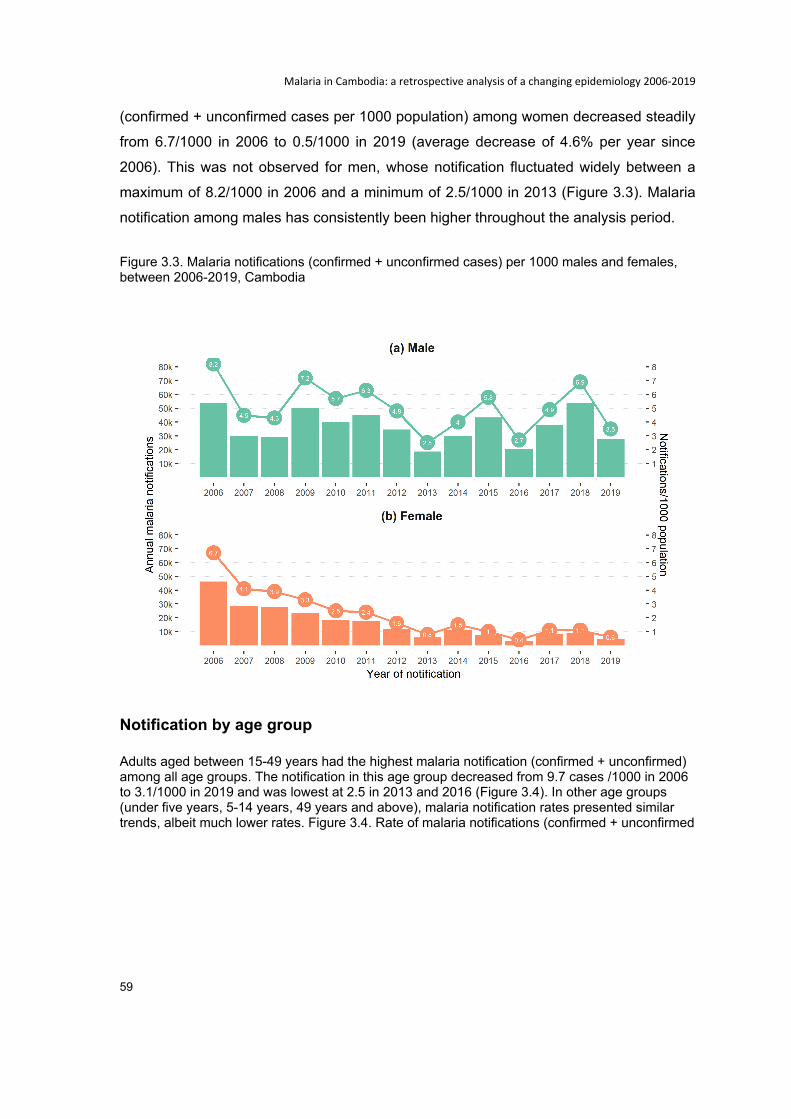
Malaria in Cambodia: a retrospective analysis of a changing epidemiology 2006-2019
59
(confirmed + unconfirmed cases per 1000 population) among women decreased steadily
from 6.7/1000 in 2006 to 0.5/1000 in 2019 (average decrease of 4.6% per year since
2006). This was not observed for men, whose notification fluctuated widely between a
maximum of 8.2/1000 in 2006 and a minimum of 2.5/1000 in 2013 (Figure 3.3). Malaria
notification among males has consistently been higher throughout the analysis period.
Figure 3.3. Malaria notifications (confirmed + unconfirmed cases) per 1000 males and females, between 2006-2019, Cambodia
Notification by age group
Adults aged between 15-49 years had the highest malaria notification (confirmed + unconfirmed) among all age groups. The notification in this age group decreased from 9.7 cases /1000 in 2006 to 3.1/1000 in 2019 and was lowest at 2.5 in 2013 and 2016 (Figure 3.4). In other age groups (under five years, 5-14 years, 49 years and above), malaria notification rates presented similar trends, albeit much lower rates. Figure 3.4. Rate of malaria notifications (confirmed + unconfirmed
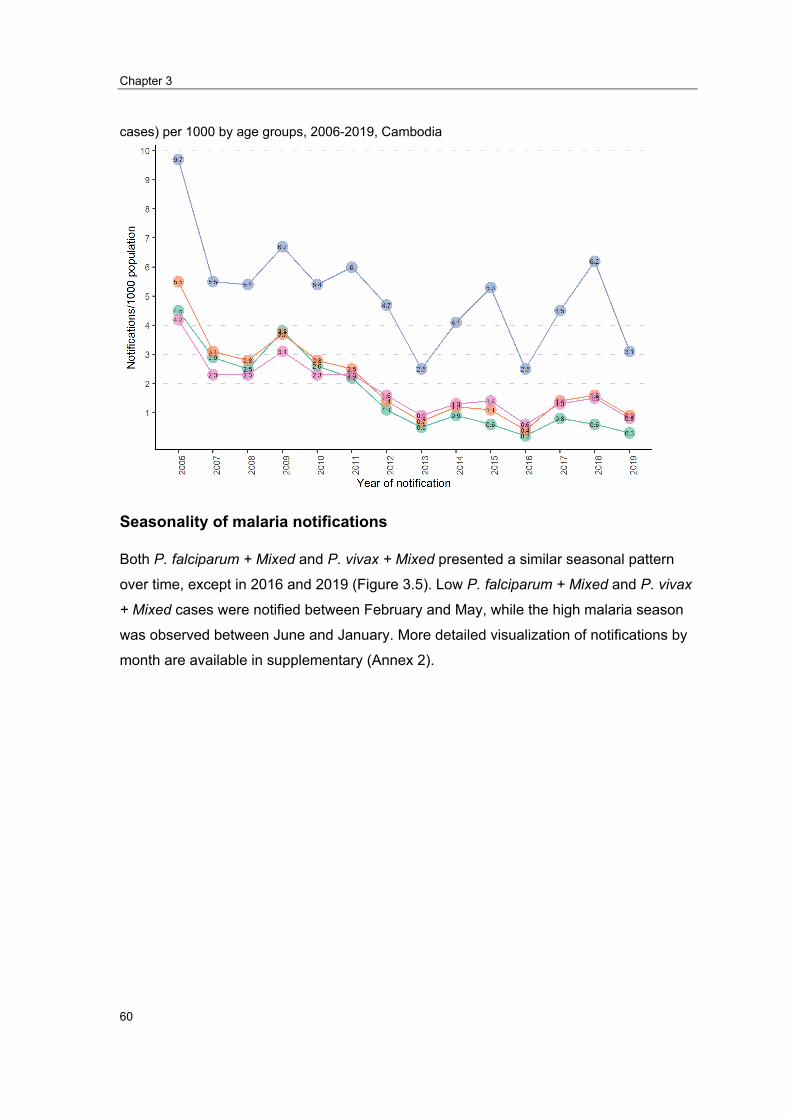
Chapter 3
60
cases) per 1000 by age groups, 2006-2019, Cambodia
Seasonality of malaria notifications
Both P. falciparum + Mixed and P. vivax + Mixed presented a similar seasonal pattern
over time, except in 2016 and 2019 (Figure 3.5). Low P. falciparum + Mixed and P. vivax
+ Mixed cases were notified between February and May, while the high malaria season
was observed between June and January. More detailed visualization of notifications by
month are available in supplementary (Annex 2).
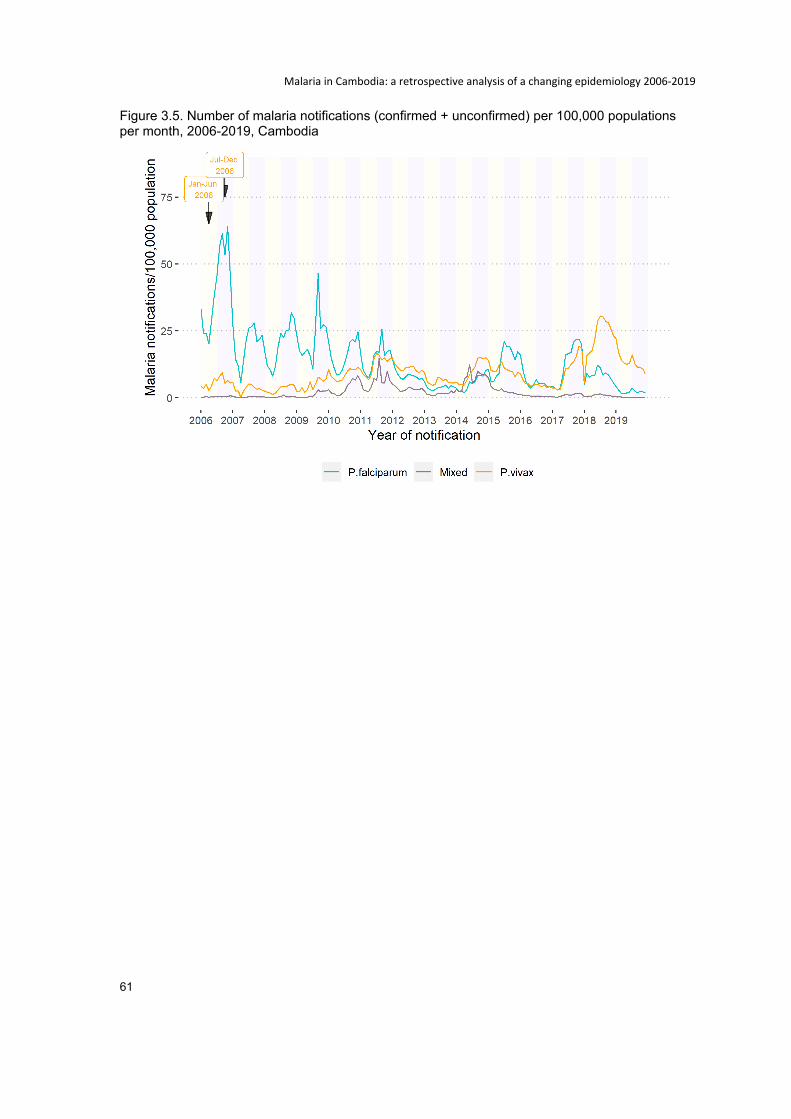
Malaria in Cambodia: a retrospective analysis of a changing epidemiology 2006-2019
61
Figure 3.5. Number of malaria notifications (confirmed + unconfirmed) per 100,000 populations per month, 2006-2019, Cambodia

Chapter 3
62
Clusters of P. falciparum + Mixed
The number of confirmed P. falciparum + Mixed cases ranged from zero to 4,002 by district
per year (Figure 3.6). The districts with a high burden of malaria, over 1,000 cases per
year, were seen along the national borders, in the western provinces (Pursat, Kampong
Speu, Koh Kong, and Pailin), northern provinces (Preah Vihear and Udor Mean Chey),
northeast provinces (Kratie, Stung Treng), and eastern provinces (Mondul Kiri and
Ratanakiri) (Figure 3.6). The majority of districts with a low malaria burden, lower than 250
cases per year, were observed in central and southern provinces (Figure 3.6).
The cluster analysis revealed a decrease in size and number of the clusters of P.
falciparum + Mixed cases during the last three years, 2017, 2018, and 2019 (Figure 3.7).
Between 2017 and 2019, these clusters were detected in districts within the north-eastern
and eastern provinces (Kratie, Stung Treng, Mondul Kiri, and Ratanak Kiri) and districts
within the western provinces (Kampong Speu and Pursat). The malaria notifications were
even more concentrated in the two regions in the last analysis year (2019), increasing
relative risks from between 5 and 25 to between 20 and 60 times higher than the rest of
the country (Figure 3.7).
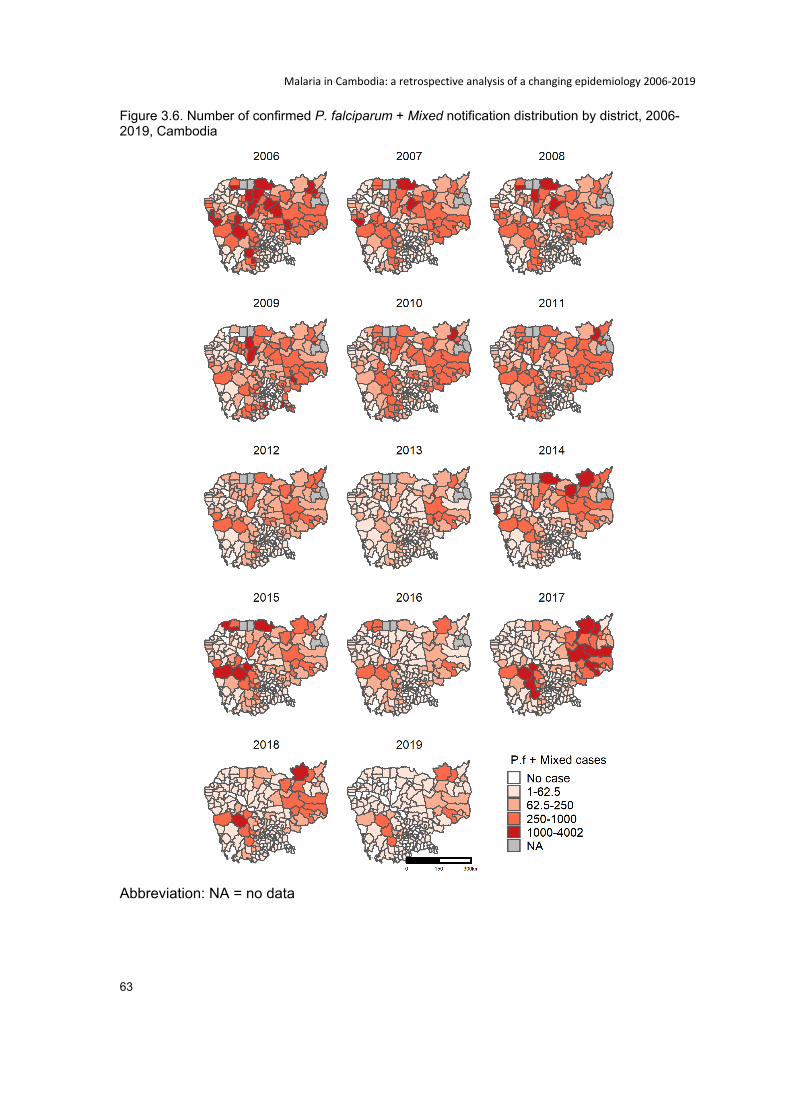
Malaria in Cambodia: a retrospective analysis of a changing epidemiology 2006-2019
63
Figure 3.6. Number of confirmed P. falciparum + Mixed notification distribution by district, 2006-2019, Cambodia
Abbreviation: NA = no data
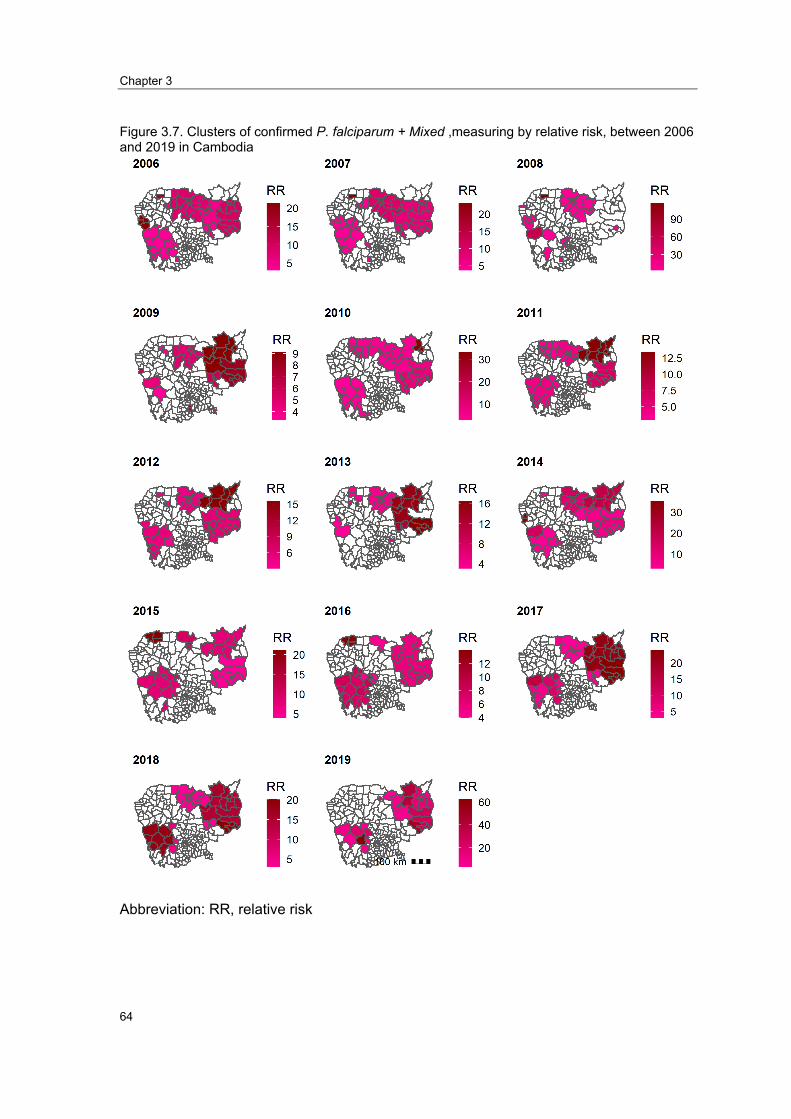
Chapter 3
64
Figure 3.7. Clusters of confirmed P. falciparum + Mixed ,measuring by relative risk, between 2006 and 2019 in Cambodia
Abbreviation: RR, relative risk
Malaria in Cambodia: a retrospective analysis of a changing epidemiology 2006-2019
65
Clusters of P. vivax + Mixed
The number of confirmed P. vivax + Mixed cases ranged from zero to 5,800 cases by
district per year. As for P. falciparum + Mixed, the districts with a high burden of malaria,
over 1,000 cases per year, were seen along the national borders, in the western provinces
(Pursat, Kampong Speu, Koh Kong, and Pailin), the northern provinces (Preah Vihear and
Udor Mean Chey), northeast provinces (Kratie, and Stung Treng), and the eastern
provinces (Mondul Kiri and Ratanak Kiri) (Figure 3.7).
As for P. falciparum, fewer and smaller clusters of P. vivax + Mixed cases were detected
in the last three years (2017-2019) (Figure 3.8). Between 2017 and 2019, the clusters
were also seen along the national borders, in the northern provinces (Preah Vihear and
Udor Mean Chey), north-eastern provinces (Kratie, and Stung Treng), eastern provinces
(Mondul Kiri and Ratanak Kiri), and the western provinces (Pursat, Kampong Speu, and
Koh Kong).
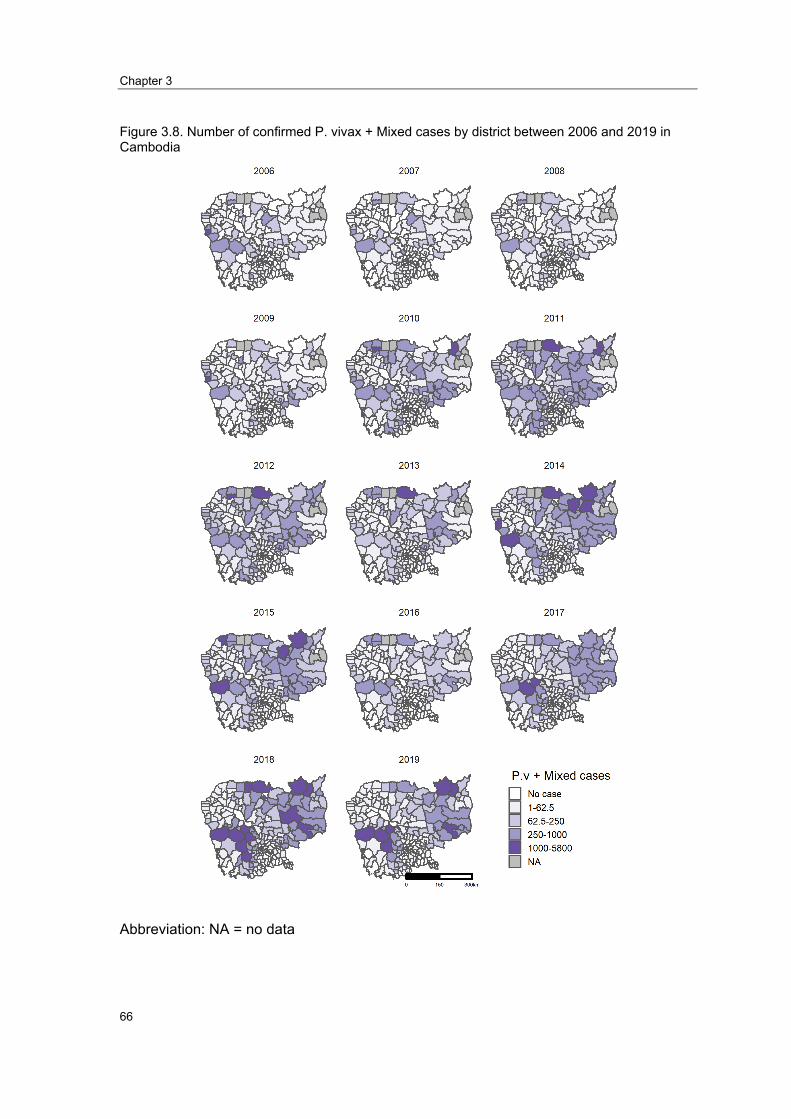
Chapter 3
66
Figure 3.8. Number of confirmed P. vivax + Mixed cases by district between 2006 and 2019 in Cambodia
Abbreviation: NA = no data

Malaria in Cambodia: a retrospective analysis of a changing epidemiology 2006-2019
67
Figure 3.9. Clusters of confirmed P. vivax + Mixed, measuring by relative, riskbetween
2006 and 2019 in Cambodia
Abbreviation: RR, relative risk

Chapter 3
68
Discussion
This study describes how malaria has evolved spatially from 2006 to 2019 in Cambodia.
The peak malaria seasons were found to be between June and January. A similar finding
was described by Maude et al. in 2014, based on Cambodia's national malaria data
between 2004 and 2013 (50). The rainy season starts one month before the malaria
season commences (May vs. June), while it ends two months before the malaria season
ends (November vs. January). Previous studies in China, Tibet, Niger found that rainfall
contributed to increased Anopheles and malaria notification (51-54).
Our analysis detected P. falciparum + Mixed and P. vivax + Mixed clusters in seven
provinces along national borders with Vietnam, Laos, and Thailand. These areas are
covered by evergreen broadleaf forests (55) where P. falciparum and P. vivax infected
Anopheles are prevalent (8). This geographical distribution of malaria in Cambodia was
previously known (50). However, this analysis provides updated information confirming
that these areas, in the elimination phase, are the top priority. The population's livelihood
in the greater notification regions remains dependent on the forests, including logging
precious woods, agriculture activities, and residency in the fringe of the forests (11). To
reduce P. falciparum and P. vivax, the intensification plan, which was effective in 2019
should be maintained, and innovative approaches aimed at blocking transmission from
forests to communities, should be considered. The main limitation of this cluster analysis
is that we can only locate cases at the place of diagnosis, i.e. the location of health
facilities, and it is not possible to know where the case contracted malaria. This is a
common limitation when using surveillance data.
The overall decrease in malaria has been observed mainly in women, while the annual
notification has fluctuated in men, with the highest rate observed among men aged
between 15-49 years old. Although the number of cases was similar in men and women
in 2006 (8.2 vs. 6.7/1,000 population), the gap increased considerably in 2019 (3.5 vs.
0.6/1,000 population). The number of cases in women represented only 14% of the total
cases. This notable difference in malaria notification in males and females is likely related
to a change in exposure. The evolution of women's daily activities may have become less
related to forests, with adult males being the most exposed to forest activities, and
therefore, most at risk of malaria infections (11, 12, 56). According to malaria surveys of
forest goers, 72.2% in 2004, 70.7% in 2007, 69.9% in 2010, 78.8% in 2013, 85.3% in 2017

Malaria in Cambodia: a retrospective analysis of a changing epidemiology 2006-2019
69
were male aged 15 years old or older while 17.1% in 2004, 20.7% in 2007, 20.6% in 2010,
15.6% in 2013, and 9.7% in 2017 were female aged 15 years old or older (57-60). From
these figures, the proportions of females who went to forests has decreased by half since
2010. Another possible reason could be the increasing distance between villages and
forests due to deforestation. In Cambodia, two primary vectors—Anopheles dirus and
Anopheles minimus—plays an important role in spreading malaria [61]. Anopheles dirus
is more efficient (higher percentage of mosquitoes tested positive with P. falciparum and
P. vivax) than Anopheles minimus [61]. They also have different habitats, Anopheles dirus
living in natural forests and forest fringes, and Anopheles minimus living around the rice
fields and forest fringes [61-62]. With Cambodia undergoing rapid deforestation in recent
years [62], the territory of Anopheles dirus could decrease, leading to a lower risk of
malaria transmission. However, deforestation activities correspond to influx loggers into
Anopheles dirus habitat which can lead to increases in malaria cases. This highlights the
importance of interventions targeting forest goers to block malaria transmission inside
forests.
Several key factors may have impacted the malaria trends, although our study design does
not provide evidence to prove causality.
First, we observed that all the upward trends in malaria have coincided with periods of
high treatment failure rates to P. falciparum while all of the observed declines in notification
occurred one to two years after a change in first-line treatment. It is plausible that the
delayed parasite clearance due to ineffective antimalarial drugs increased malaria
transmission among high-risk populations. In 2009, the total malaria cases increased by
29% (n= 16,493) compared to 2008. This rebound occurred after the first-line antimalarial-
AS-MQ - showed high treatment failure rates (7, 24, 25, 61-71). A new first-line antimalarial
(DHA-PIP) was introduced nationally in 2010 to replace AS-MQ (7, 15, 72). This was
followed by an observed reduction of P. falciparum cases in Cambodia until 2013. DHA-
PIP treatment failures emerged after a three-year of usage (27, 73, 74). Total malaria
cases increased again by 68% (n= 16,679) in 2014 compared to 2013. Malaria
notifications continued to increase in Cambodia until 2018. Of note, the ineffective DHA-
PIP was still used in several parts of Cambodia due to procurement challenges until 2018
(7, 30). This finding suggests that antimalarial drug efficacy is key to control P. falciparum.
Timely surveillance of drug efficacy provides critical information to respond to a malaria
epidemic promptly.

Chapter 3
70
Another key factor was that the dramatic drop in malaria cases was likely associated with
the changing use of the private sector and an important limitation of the HMIS that did not
capture data from the private sector. The private sector played a significant role in
changing the national malaria trends between 2011 and 2018. However, the most
substantial impact would have occurred between 2011 and 2013, when malaria notification
dropped from 4.1 to 1.6 /1,000 population with a sharper decrease of P. falciparum
notifications compared to P. vivax. This drop was possibly due to a public-private mix
(PPM) project piloted in 2011 and scaled up in 2012 (7, 15, 16). It may have favored larger
access to early detection and treatment of infections since more than 50% of antimalarial
drugs were delivered at private points of care between 2011 and 2013 (16, 74). This is
consistent with the findings from national malaria surveys that showed 7.3% of malaria
patients used the private sector in 2007, 41.1% in 2010, 56.4% in 2013, with a reduction
to 30.3% in 2017 (57-60). Therefore, the decreasing trend of malaria cases notified in the
HMIS between 2011 and 2013 could be related to the increasing use of the private sector,
which was not included in HMIS before it was banned in April 2018. This highlights the
importance of comprehensive surveillance with mandatory reporting requirements for
public and private sectors to the HMIS to avoid undercounting or misleading trends.
The decreasing trends may have been overestimated due to the inclusion of unconfirmed
cases between 2006 and 2013, when the malaria test was not available throughout the
country. Unconfirmed cases may include non-malaria cases with similar clinical
symptoms. The malaria cases were overestimated if the unconfirmed cases were included
and underestimated if the unconfirmed cases were excluded. However, there is no data
on the proportion of actual cases among the unconfirmed cases. Changing case definitions
and diagnostics have a significant impact on surveillance data and therefore it is important
to recognize such events when interpreting surveillance data.
The role of VMWs also played a key role in malaria trends in Cambodia. The malaria
notification increased from 2.7/1000 population in 2014 to 3.3/1,000 population in 2015.
This increase happened after the scaling up of VMWs in 2014 (7, 15, 75). VMWs provided
free services in villages and reported to HMIS through health centers, leading to greater
malaria notifications. VMWs administered 41% of all antimalarial drug delivery in 2015
(74). The scaling up of VMWs helped change health-seeking behaviors with a noted
decrease in private sector services and improved HMIS sensitivity.

Malaria in Cambodia: a retrospective analysis of a changing epidemiology 2006-2019
71
In contrast, malaria cases dropped to the lowest point in 2016 but increased again in 2017
and 2018. This occurred after many VMWs were laid-off, and all other activities supported
by Global Fund funding were suspended between July 2015 and December 2016 (30, 76).
The immediate drop in malaria cases in 2016 may be due to the absence of notifications
from VMWs. This finding implied that early access to diagnosis and treatment through
VMWs or care points is another critical feature to control and eliminate malaria. Funding
to maintain VMWs, or other equivalent interventions, should be prioritized until elimination
is confirmed.
One more key factor was the intensification plan initiated in 2018 to respond to increasing
case notifications in 2017 and 2018. A significant drop in malaria cases from 3.9/1,000 in
2018 to 1.9/1,000 in 2019 was observed after the plan started. For the first time, both
species – P. falciparum and P. vivax— had a dramatic decline. The success of the new
intensification plan targeting forest goers provides sufficient evidence that this plan should
be maintained.
The final key factor, nationwide crackdowns by police and forest rangers on illegal logging,
may also have had an impact on malaria trends. The massive crackdown started in 2019.
It prevented the highest risk groups (forest goers) from entering forests where most
malaria transmission was occurring (77). It is of interest that the effectiveness of malaria
control programs may be positively affected by external and independent factors such as
anti-deforestation activities.
Concerning the Plasmodium species, an increase of P. vivax proportions was observed
over time. Two reasons may have contributed to these changes. Firstly, the index of
species was likely affected by the shift from P. falciparum-only RDT to dual RDT, which
could have detected both P. falciparum and P. vivax. As previously shown, P. falciparum
notifications were predominant before 2010. This was due to Cambodia using P.
falciparum-only RDT before 2010 (75). In that period, P. vivax cases could only be
detected using microscopy, which availability was limited (78). According to an outlet
survey in 2015, microscopy was available in only 28% of government health facilities
included in the study. The dual RDT was only supplied in late 2009 (75). One year after
using the dual RDT, the proportion of P. vivax exceeded the proportion of P. falciparum.
However, P. vivax possibly remains under-detected due to the RDT’s low sensitivity (ability
to detect true positive) to P. vivax (88). RDTs do not perform well among individuals with
Chapter 3
72
low parasitemia (<100 parasites/parasites/μL) (88). According to a meta-analysis study,
the sensitivity of RDT in detecting P. vivax ranges from 57% to 77% compared to a
polymerase chain reaction (PCR) as a gold standard [90]. Secondly, the proportion of
malaria patients with P. vivax has increased. Relapses may explain these trends.
Relapses among P. vivax patients was described as early as 1893 (79). According to
Taylor A. et al., P. vivax patients along Thai-Myanmar borders neighboring country with
Cambodia, suggested that 75% of P. vivax patients receiving standard treatment (without
Primaquine radical curative treatment) relapsed within 12-month follow-up (80). One P.
vivax patient is thought to have multiple episodes of relapse, but the exact number of
relapses per lifetime per person has not yet been confirmed (81). The accumulation of P.
vivax relapses constitutes a large proportion of all P. vivax cases and maintains the source
of P. vivax infections. Radical cure to P. vivax, piloted in four provinces of Cambodia
(Kampong Speu, Kampong Chhnang, Battambang, and Pailin), should also be prioritized
in all P. vivax clusters.
In contrast to P. vivax, the proportion of P. falciparum notifications have declined faster
over time. The decline of P. falciparum notifications may result from multiple factors.
Firstly, the enhanced P. falciparum elimination efforts by the Ministry of Health have likely
had a key role to play. Interventions such as expanding testing and treating sites to
facilitate early diagnosis and treatment of cases (6, 7, 13). In addition, a focus on the
interruption of P. falciparum transmission, or 1-3-7 strategy (reporting a confirmed case
within one day, investigating within three days, and taking measures to prevent further
transmission within seven days), in elimination areas may have also contributed to this
decline (7, 82, 83). Secondly, P. falciparum is curable. The impact from effective
interventions in reducing P. falciparum cases should be rapidly seen. Thirdly, biologically,
there is evidence that prior exposure to P. vivax suppresses the course of P. falciparum
infection (84-87). It is possible that this factor contributed to the decline of P. falciparum.
However, the proportion by which P. falciparum is reduced by prior exposure to P. vivax
is not known.
The overall P. falciparum prevalence decreased was concurrent with the emergence of
drug resistance in P. falciparum. The scaling up of improved access to early testing and
treatment probably had a greater impact than the emergence of drug resistance. Ongoing
surveillance of antimalarial drug resistance also ensured that first-line treatments were
promptly changed to efficient regimens.

Malaria in Cambodia: a retrospective analysis of a changing epidemiology 2006-2019
73
Conclusions
In this study, we used the nationwide surveillance data collected in the last 14 years
between 2006 and 2019. There was a noted decrease in notifications of P. falciparum in
2019, suggesting that intensification plan should be maintained. P. vivax showed a slower
but promising declining trend. Interventions aimed at achieving P. falciparum elimination
and preventing P. vivax new infections and relapses should be prioritized. In the context
of malaria elimination, all cases detected outside national system should be reported to
national system to avoid misleading trends.

Chapter 3
74
Reference
1. Centers for Disease Control and Prevention (CDC). Malaria: CDC; 2017 [updatedDecember 20, 2017; cited 2020 29 August 2020]. Available from:https://www.cdc.gov/malaria/about/faqs.html.
2. WHO. World Malaria Report. Geneva: World Health Organization; 2019.
3. World Health Organization (WHO). WHO African Region: WHO; 2020 [cited 2020 28August 2020]. Available from:https://www.who.int/immunization/monitoring_surveillance/data/AFR/en/.
4. World Health Organization (WHO). WHO Western Pacific Region: WHO; 2020 [cited 202028 August 2020]. Available from: https://www.who.int/westernpacific.
5. World Health Organization (WHO). Region of the Americas: WHO; 2020 [Available from:https://www.who.int/choice/demography/american_region/en/.
6. National Centre for Parasitology Entomology and Malaria Control (CNM). CambodiaMalaria Elimination Action Framework (2016-2020). Phnom Penh: CNM; 2016.
7. National Centre for Parasitology EaMCC. National Malaria Porgram Review. PhnomPenh: CNM; 2019.
8. St. Laurent B, Oy K, Miller B, Gasteiger EB, Lee E, Sovannaroth S, et al. Cow-baited tentsare highly effective in sampling diverse Anopheles malaria vectors in Cambodia. Malar J.2016;15(1):440.
9. Durnez L, Mao S, Denis L, Roelants P, Sochantha T, Coosemans M. Outdoor malariatransmission in forested villages of Cambodia. Malar J. 2013;12(1):329.
10. Hii J, Rueda LM. Malaria vectors in the Greater Mekong Subregion: overview of malariavectors and remaining challenges. The Southeast Asian journal of tropical medicine and publichealth. 2013;44 Suppl 1:73-165; discussion 306-7.
11. Bannister-Tyrrell M, Gryseels C, Sokha S, Dara L, Sereiboth N, James N, et al. ForestGoers and Multidrug-Resistant Malaria in Cambodia: An Ethnographic Study. The Americanjournal of tropical medicine and hygiene. 2019;100(5):1170-8.
12. Incardona S, Vong S, Chiv L, Lim P, Nhem S, Sem R, et al. Large-scale malaria survey inCambodia: Novel insights on species distribution and risk factors. Malar J. 2007;6:37.
13. National Center for Parasitology EaMCC. The National Strategic Plan For Elimination ofMalaria in the Kingdom of Cambodia 2011-2025. Phnom Penh: CNM; 2011.
14. WHO. World Malaria Report. Geneva: World Health Organization; 2018.

Malaria in Cambodia: a retrospective analysis of a changing epidemiology 2006-2019
75
15. ACTwatch. Cambodia 2009-2015 Reference Document: ACTwatch; 2016 [Available from: http://www.actwatch.info/projects/actwatch/cambodia.
16. Group AC, Phok S, Phanalasy S, Thein ST, Likhitsup A. Private sector opportunities and threats to achieving malaria elimination in the Greater Mekong Subregion: results from malaria outlet surveys in Cambodia, the Lao PDR, Myanmar, and Thailand. Malar J. 2017;16(1):180-.
17. Dondorp AM, Fairhurst RM, Slutsker L, Macarthur JR, Breman JG, Guerin PJ, et al. The threat of artemisinin-resistant malaria. N Engl J Med. 2011;365(12):1073-5.
18. Mahase E. Malaria drugs left ineffective by spread of multidrug resistant parasites in southeast Asia. BMJ. 2019;366:l4807.
19. van der Pluijm RW, Imwong M, Chau NH, Hoa NT, Thuy-Nhien NT, Thanh NV, et al. Determinants of dihydroartemisinin-piperaquine treatment failure in Plasmodium falciparum malaria in Cambodia, Thailand, and Vietnam: a prospective clinical, pharmacological, and genetic study. The Lancet Infectious Diseases. 2019;19(9):952-61.
20. Hamilton WL, Amato R, van der Pluijm RW, Jacob CG, Quang HH, Thuy-Nhien NT, et al. Evolution and expansion of multidrug-resistant malaria in southeast Asia: a genomic epidemiology study. The Lancet Infectious Diseases. 2019;19(9):943-51.
21. Imwong M, Hien TT, Thuy-Nhien NT, Dondorp AM, White NJ. Spread of a single multidrug resistant malaria parasite lineage (<em>PfPailin</em>) to Vietnam. The Lancet Infectious Diseases. 2017;17(10):1022-3.
22. Imwong M, Suwannasin K, Kunasol C, Sutawong K, Mayxay M, Rekol H, et al. The spread of artemisinin-resistant <em>Plasmodium falciparum</em> in the Greater Mekong subregion: a molecular epidemiology observational study. The Lancet Infectious Diseases. 2017;17(5):491-7.
23. Denis MB, Tsuyuoka R, Poravuth Y, Narann TS, Seila S, Lim C, et al. Surveillance of the efficacy of artesunate and mefloquine combination for the treatment of uncomplicated falciparum malaria in Cambodia. Tropical medicine & international health : TM & IH. 2006;11(9):1360-6.
24. Noedl H, Se Y, Schaecher K, Smith BL, Socheat D, Fukuda MM. Evidence of artemisinin-resistant malaria in western Cambodia. N Engl J Med. 2008;359(24):2619-20.
25. Lim P, Chim P, Sem R, Nemh S, Poravuth Y, Lim C, et al. In vitro monitoring of Plasmodium falciparum susceptibility to artesunate, mefloquine, quinine and chloroquine in Cambodia: 2001-2002. Acta tropica. 2005;93(1):31-40.
26. Bustos MD, Wongsrichanalai C, Delacollette C, Burkholder B. Monitoring antimalarial drug efficacy in the Greater Mekong Subregion: an overview of in vivo results from 2008 to 2010. The Southeast Asian journal of tropical medicine and public health. 2013;44 Suppl 1:201-30; discussion 306-7.

Chapter 3
76
27. Amaratunga C, Lim P, Suon S, Sreng S, Mao S, Sopha C, et al. Dihydroartemisinin–piperaquine resistance in Plasmodium falciparum malaria in Cambodia: a multisite prospectivecohort study. The Lancet Infectious Diseases. 2016;16(3):357-65.
28. Spring MD, Lin JT, Manning JE, Vanachayangkul P, Somethy S, Bun R, et al.Dihydroartemisinin-piperaquine failure associated with a triple mutant including kelch13 C580Yin Cambodia: an observational cohort study. The Lancet Infectious diseases. 2015;15(6):683-91.
29. Lon C, Manning JE, Vanachayangkul P, So M, Sea D, Se Y, et al. Efficacy of two versusthree-day regimens of dihydroartemisinin-piperaquine for uncomplicated malaria in militarypersonnel in northern Cambodia: an open-label randomized trial. PloS one. 2014;9(3):e93138.
30. Boyle D. Dispute delays release of malaria money in Cambodia. The Lancet.2015;386(10006):1811.
31. World Health Organization (WHO). Global technical strategy for malaria 2016–2030.WHO; 2015.
32. Thacker SB, Choi K, Brachman PS. The Surveillance of Infectious Diseases. JAMA.1983;249(9):1181-5.
33. Aregawi M, Lynch M, Bekele W, Kebede H, Jima D, Taffese HS, et al. Time series analysisof trends in malaria cases and deaths at hospitals and the effect of antimalarial interventions,2001-2011, Ethiopia. PloS one. 2014;9(11):e106359.
34. Comfort AB, van Dijk JH, Mharakurwa S, Stillman K, Gabert R, Korde S, et al.Hospitalizations and costs incurred at the facility level after scale-up of malaria control: pre-postcomparisons from two hospitals in Zambia. The American journal of tropical medicine andhygiene. 2014;90(1):20-32.
35. Cissé B, Ba EH, Sokhna C, JL ND, Gomis JF, Dial Y, et al. Effectiveness of Seasonal MalariaChemoprevention in Children under Ten Years of Age in Senegal: A Stepped-Wedge Cluster-Randomised Trial. PLoS medicine. 2016;13(11):e1002175.
36. Katureebe A, Zinszer K, Arinaitwe E, Rek J, Kakande E, Charland K, et al. Measures ofMalaria Burden after Long-Lasting Insecticidal Net Distribution and Indoor Residual Spraying atThree Sites in Uganda: A Prospective Observational Study. PLoS medicine.2016;13(11):e1002167.
37. Aregawi M, Malm KL, Wahjib M, Kofi O, Allotey NK, Yaw PN, et al. Effect of anti-malarialinterventions on trends of malaria cases, hospital admissions and deaths, 2005-2015, Ghana.Malar J. 2017;16(1):177.
38. Ssempiira J, Kissa J, Nambuusi B, Kyozira C, Rutazaana D, Mukooyo E, et al. The effect ofcase management and vector-control interventions on space-time patterns of malaria incidencein Uganda. Malar J. 2018;17(1):162.
Malaria in Cambodia: a retrospective analysis of a changing epidemiology 2006-2019
77
39. Kenangalem E, Poespoprodjo JR, Douglas NM, Burdam FH, Gdeumana K, Chalfein F, et al.Malaria morbidity and mortality following introduction of a universal policy of artemisinin-basedtreatment for malaria in Papua, Indonesia: A longitudinal surveillance study. PLoS medicine.2019;16(5):e1002815.
40. Lechthaler F, Matthys B, Lechthaler-Felber G, Likwela JL, Mavoko HM, Rika JM, et al.Trends in reported malaria cases and the effects of malaria control in the Democratic Republic ofthe Congo. PloS one. 2019;14(7):e0219853.
41. Tugume A, Muneza F, Oporia F, Kiconco A, Kihembo C, Kisakye AN, et al. Effects andfactors associated with indoor residual spraying with Actellic 300 CS on malaria morbidity in LiraDistrict, Northern Uganda. Malar J. 2019;18(1):44.
42. Department of Planning and Health Information (DPHI). Health Information SystemMaster Plan 2016-2020 Phnom Penh: DPHI; 2017.
43. Malaria Information System [Internet]. 2020 [cited 08 Sep 2019]. Available from:http://mis.cnm.gov.kh/.
44. World Health Organization (WHO). WHO malaria terminology. Geneva, Switzerland:WHO; 2019.
45. Cambodia administrative level 0-3 population statistics [Internet]. 2019. Available from:https://data.humdata.org/organization/ocha-roap?groups=khm&q=&ext_page_size=25.
46. National Institute of Statistics (NIS). Population Projections for Cambodia, 2008-2030Phnom Penh: NIS; 2008.
47. National Center for Parasitology Entomology and Malaria Control (CNM). NationalTreatment Guidelines for Malaria in Cambodia. Phnom Penh2014.
48. Kulldorff M. A spatial scan statistic. Communications in Statistics - Theory and Methods.1997;26(6):1481-96.
49. Martin K. SaTScan™ , a free software that analyzes spatial, temporal and space-time datausing the spatial, temporal, or space-time scan statistics 2018 [Available from:https://www.satscan.org/.
50. Maude RJ, Nguon C, Ly P, Bunkea T, Ngor P, Canavati de la Torre SE, et al. Spatial andtemporal epidemiology of clinical malaria in Cambodia 2004–2013. Malar J. 2014;13(1):385.
51. Gao H-W, Wang L-P, Liang S, Liu Y-X, Tong S-L, Wang J-J, et al. Change in Rainfall DrivesMalaria Re-Emergence in Anhui Province, China. PloS one. 2012;7(8):e43686.
52. Wardrop NA, Barnett AG, Atkinson J-A, Clements ACA. Plasmodium vivax malariaincidence over time and its association with temperature and rainfall in four counties of YunnanProvince, China. Malar J. 2013;12(1):452.

Chapter 3
78
53. Huang F, Zhou S, Zhang S, Wang H, Tang L. Temporal correlation analysis between malaria and meteorological factors in Motuo County, Tibet. Malar J. 2011;10(1):54.
54. Bomblies A. Modeling the role of rainfall patterns in seasonal malaria transmission. Climatic Change. 2012;112(3-4):673-85.
55. United States Geological Survey (USGS) [Internet]. U.S. Department of Interior. 2020. Available from: https://earthexplorer.usgs.gov/.
56. Sluydts V, Somony H, Coosemans M, Van Roey K, Gryseels C, Canier L, et al. Spatial clustering and risk factors of malaria infections in Ratanakiri Province, Cambodia. Malar J. 2014;13:387.
57. Ung Sam An, Bunsoth Mao, Vonthanak Saphonn, Jane Bruce, Sylvia Meek, Jo Lines, et al. Cambodia Malaria Survey 2007. Phnom Penh: National Centre for Parasitology, Entomology and Malaria Control (CNM); 2007.
58. Lek Dysoley, Leang Rithea, Tol Bunkea, Seshu Babu, Kheng Sim, Chea Nguon, et al. Cambodia Malaria Survey 2010. Phnom Penh: National Centre for Parasitology, Entomology and Malaria Control (CNM); 2010.
59. Huy Rekol, Siv Sovannaroth, Lek Dy Soley, Chan Vanna, Chea Sokun, Oung Yeang, et al. Cambodia Malaria Survey 2013. Phnom Penh: National Centre for Parasitology, Entomology and Malaria Control (CNM); 2013.
60. National Center for Parasitology EaMCC. Cambodia Malaria Survey 2017. Phnom Penh: CNM; 2017.
61. Jambou R, Legrand E, Niang M, Khim N, Lim P, Volney B, et al. Resistance of Plasmodium falciparum field isolates to in-vitro artemether and point mutations of the SERCA-type PfATPase6. Lancet (London, England). 2005;366(9501):1960-3.
62. Khim N, Bouchier C, Ekala MT, Incardona S, Lim P, Legrand E, et al. Countrywide survey shows very high prevalence of Plasmodium falciparum multilocus resistance genotypes in Cambodia. Antimicrob Agents Chemother. 2005;49(8):3147-52.
63. Denis MB, Tsuyuoka R, Lim P, Lindegardh N, Yi P, Top SN, et al. Efficacy of artemether-lumefantrine for the treatment of uncomplicated falciparum malaria in northwest Cambodia. Tropical medicine & international health : TM & IH. 2006;11(12):1800-7.
64. Resistance to artemisinin derivatives along the Thai-Cambodian border. Releve epidemiologique hebdomadaire. 2007;82(41):360.
65. Shah NK, Alker AP, Sem R, Susanti AI, Muth S, Maguire JD, et al. Molecular surveillance for multidrug-resistant Plasmodium falciparum, Cambodia. Emerg Infect Dis. 2008;14(10):1637-40.

Malaria in Cambodia: a retrospective analysis of a changing epidemiology 2006-2019
79
66. Wongsrichanalai C, Meshnick SR. Declining artesunate-mefloquine efficacy againstfalciparum malaria on the Cambodia-Thailand border. Emerg Infect Dis. 2008;14(5):716-9.
67. Antimalarial drug resistance, Thai-Cambodian border. Releve epidemiologiquehebdomadaire. 2009;84(11-12):94-5.
68. Dondorp AM, Nosten F, Yi P, Das D, Phyo AP, Tarning J, et al. Artemisinin resistance inPlasmodium falciparum malaria. N Engl J Med. 2009;361(5):455-67.
69. Müller O, Sié A, Meissner P, Schirmer RH, Kouyaté B. Artemisinin resistance on the Thai-Cambodian border. Lancet (London, England). 2009;374(9699):1419.
70. Rogers WO, Sem R, Tero T, Chim P, Lim P, Muth S, et al. Failure of artesunate-mefloquine combination therapy for uncomplicated Plasmodium falciparum malaria in southernCambodia. Malar J. 2009;8:10.
71. Yeung S, Socheat D, Moorthy VS, Mills AJ. Artemisinin resistance on the Thai-Cambodianborder. Lancet (London, England). 2009;374(9699):1418-9.
72. Leang R, Taylor WRJ, Bouth DM, Song L, Tarning J, Char MC, et al. Evidence ofPlasmodium falciparum Malaria Multidrug Resistance to Artemisinin and Piperaquine in WesternCambodia: Dihydroartemisinin-Piperaquine Open-Label Multicenter Clinical Assessment.Antimicrob Agents Chemother. 2015;59(8):4719-26.
73. Duru V, Witkowski B, Ménard D. Plasmodium falciparum Resistance to ArtemisininDerivatives and Piperaquine: A Major Challenge for Malaria Elimination in Cambodia. TheAmerican journal of tropical medicine and hygiene. 2016;95(6):1228-38.
74. Population Services International and ACTwatch. Actwatch outlet survey results :Cambodia 2009-2015. Phnom Penh: Population Services International and ACTwatch; 2016.
75. Siv S, Roca-Feltrer A, Vinjamuri SB, Bouth DM, Lek D, Rashid MA, et al. Plasmodium vivaxMalaria in Cambodia. The American journal of tropical medicine and hygiene. 2016;95(6Suppl):97-107.
76. Office of the Inspector General (OIG). Investigation Report: Global Fund Grants toCambodiaNational Centre for Parasitology Entomology and Malaria Control (CNM). Geneva,Switzerland: OIG; 2017.
77. Titthara M. Mondulkiri logging crackdowns stun illegal industry. Khmer Times. 2019.
78. Akulayi L, Alum A, Andrada A, Archer J, Arogundade ED, Auko E, et al. Evidence on anti-malarial and diagnostic markets in Cambodia to guide malaria elimination strategies andpolicies. Malar J. 2017;16(1):171.
79. Chu CS, White NJ. Management of relapsing Plasmodium vivax malaria. Expert Rev AntiInfect Ther. 2016;14(10):885-900.

Chapter 3
80
80. Taylor AR, Watson JA, Chu CS, Puaprasert K, Duanguppama J, Day NPJ, et al. Resolving the cause of recurrent Plasmodium vivax malaria probabilistically. Nature Communications. 2019;10(1):5595.
81. World Health Organization (WHO). Control and elimination of plasmodium vivax malaria : Technical brief. Geneva, Switzerland: WHO; 2015.
82. Lu G, Liu Y, Beiersmann C, Feng Y, Cao J, Müller O. Challenges in and lessons learned during the implementation of the 1-3-7 malaria surveillance and response strategy in China: a qualitative study. Infectious Diseases of Poverty. 2016;5(1):94.
83. Kheang ST, Sovannaroth S, Barat LM, Dysoley L, Kapella BK, Po L, et al. Malaria elimination using the 1-3-7 approach: lessons from Sampov Loun, Cambodia. BMC public health. 2020;20(1):544.
84. Bruce MC, Donnelly CA, Alpers MP, Galinski MR, Barnwell JW, Walliker D, et al. Cross-Species Interactions Between Malaria Parasites in Humans. Science. 2000;287(5454):845.
85. Nagao Y, Kimura-Sato M, Chavalitshewinkoon-Petmitr P, Thongrungkiat S, Wilairatana P, Ishida T, et al. Suppression of Plasmodium falciparum by serum collected from a case of Plasmodium vivax infection. Malar J [Internet]. 2008 2008; 7:[113 p.]. Available from: http://europepmc.org/abstract/MED/18582375
https://www.ncbi.nlm.nih.gov/pmc/articles/pmid/18582375/pdf/?tool=EBI
86. Whitehorn J, Coltart C, Manser D, Doherty T. A mixed malaria infection: is Plasmodium vivax good for you? Transactions of The Royal Society of Tropical Medicine and Hygiene. 2010;104(3):240-1.
87. Haghdoost AA, Alexander N. Systematic review and meta-analysis of the interaction between Plasmodium falciparum and Plasmodium vivax in humans. Journal of vector borne diseases. 2007;44(1):33-43.
88. Abba K, Kirkham AJ, Olliaro PL, Deeks JJ, Donegan S, Garner P, et al. Rapid diagnostic tests for diagnosing uncomplicated non-falciparum or Plasmodium vivax malaria in endemic countries. The Cochrane database of systematic reviews. 2014;2014(12):Cd011431
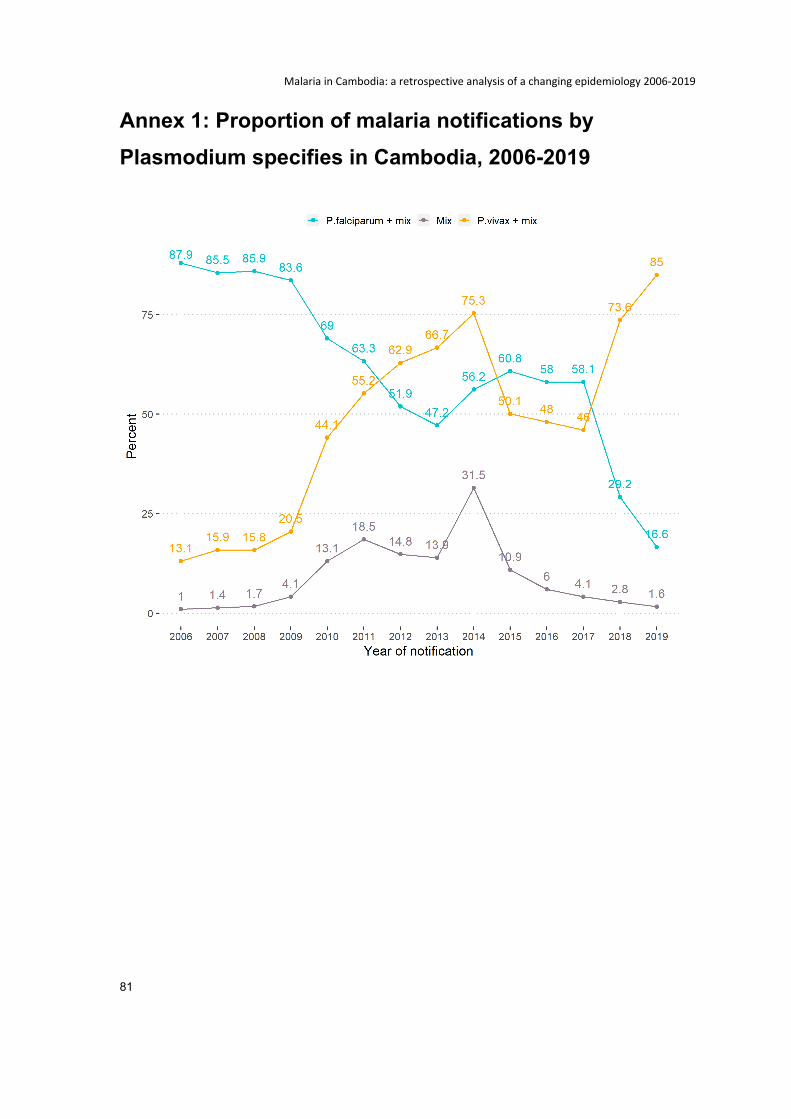
Malaria in Cambodia: a retrospective analysis of a changing epidemiology 2006-2019
81
Annex 1: Proportion of malaria notifications by Plasmodium specifies in Cambodia, 2006-2019
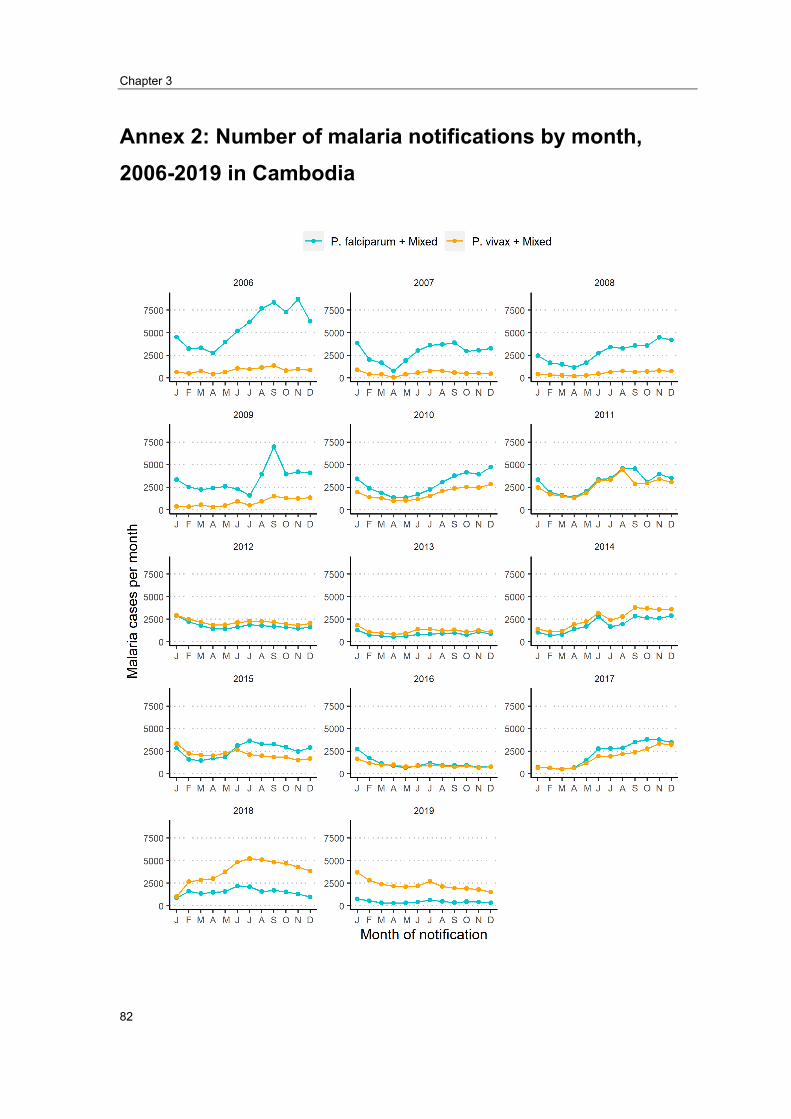
Chapter 3
82
Annex 2: Number of malaria notifications by month, 2006-2019 in Cambodia

83
Chapter 4 : Using Kobo Toolbox as a malaria project-based surveillance system in Cambodia: surveillance evaluation

Chapter 4
84
(This page has been intentionally left blank)

Using Kobo Toolbox as a malaria project-based surveillance system in Cambodia: surveillance evaluation
85
Prologue
Rationale
This chapter is to fulfill the surveillance core competency of the MAE program and
literature review requirement. The “Second-phase Regional Artemisinin-resistance
Initiative (RAI2) surveillance system”, evaluated in this chapter, is a malaria project-based
surveillance system launched in late August 2019. This surveillance system’s primary
objective was to evaluate the effectiveness of in-forest interventions targeting malaria
elimination in Cambodia.
Roles
My role was to design the surveillance system, monitor, and evaluate it, to identify the
system’s strengths and weaknesses. After returning from the first-course block in Australia
in March 2020, my field supervisor planned to implement an operational research project
related to malaria elimination. One part of the project was collecting data from health
centers. I was asked to establish a project-based surveillance system, select intervention
and control health centers, define inclusion criteria for intervention and control sites, train
staff, and ensure the surveillance system met its objectives. I met with stakeholders to
explore the existing system, and later established the “RAI2 surveillance system”. With
administrative support from three other Institut Pasteur du Cambodge’s staff members, I
provided training to 47 health center staff in late August 2019 to roll out the RAI2
surveillance system. After a five-month implementation, I evaluated this surveillance
system and used it as one of my four competencies.
Lessons Learnt
This was my first time managing a surveillance system for malaria and managing a
surveillance system integrated into the government system. I learned several things from
this work, which may help me build a better surveillance system next time.
Maintaining a surveillance system nested in a government system is challenging.
Health centers have competing priorities, of which some are mandatory. There is often
no time for adequate and clean data collection and reporting, which affects the
surveillance system’s data quality and sensitivity.
Chapter 4
86
A more comprehensive, informative assessment should be conducted prior to the
surveillance design. During the setting up, I thought about choosing staff from each
health center to join the data collection training to kick off the system running. I could
not invite more than one person because of the limited budget. With consultation with
stakeholders, I chose a staff responsible for entering data into the Malaria Information
System (MIS) because these staff are the focal points for malaria. In retrospect, the
laboratory staff who meet every malaria patient would have been a more appropriate
choice. The staff who enter data into MIS do not meet every malaria patient; they use
the laboratory registration book, noted by laboratory staff and enter data into the MIS
when they have time. These staffs have other priorities, so they sometimes missed
interviewing malaria patients for the RAI2 surveillance system.
A phone-based application is a practical, cheaper, and faster tool to collect data than
a paper-based form in Cambodia. Health center staff prefer phone-based forms over
paper-based forms.
Performance-based financial incentives for surveillance staff are practical and cheaper
than the fixed incentive only if a health center has more malaria cases, generating a
meaningful incentive for them.
Regular supervision of staff through phone or in-person is essential. When health
center staff are busy, they are likely to drop lower priority tasks. Therefore, it is crucial
to have staff dedicated to regular monitoring.
Public Health Impact
The ability to provide high sensitivity and quality data to evaluate a public health
intervention’s effectiveness is crucial. This evaluation will strengthen the malaria
surveillance system in the areas where it has been implemented. The collection and
reporting of timely and reliable data will allow the intervention team to confidently conclude
their findings at the end of the project. This evaluation’s results will also be used to inform
the development of future project-based surveillance systems.
Acknowledgments
I deeply thank the staff and management teams of the National Centre for Parasitology,
Entomology and Malaria Control, Global Fund, Provincial Health Departments, and all
participated health centers for their kind collaboration.

Using Kobo Toolbox as a malaria project-based surveillance system in Cambodia: surveillance evaluation
87
Thanks to all malaria patients who participated in the interviews.
Finally, I profoundly thank all my supervisors—Tambri Housen, Patrice Piola, Vincent
Herbreteau, and Amy Parry—for constructive feedback. Special thanks to Tambri Housen
for sharing her expertise on surveillance evaluation. Although the task is technically
simple, it is hard to find the right way to do the job without clear guidance.
Chapter 4
88
Abstract
Background: The Second-phase Regional Artemisinin-resistance Initiative (RAI2)
intervention was the first intervention targeted at reducing malaria transmission among
forest goers inside forests in Cambodia. The RAI2 surveillance system was designed to
be nested in the national Malaria Information System (MIS). Its primary objective was to
evaluate the effectiveness of the RAI2 intervention. We evaluated whether the RAI2
surveillance system fulfilled its primary objective.
Methods: Nine attributes adapted from the US Centers for Disease Control and Prevention
guidelines 2001 were used to evaluate the system’s performance. Usefulness was
described based on the outcome of the evaluation of the other eight attributes. Simplicity,
flexibility, acceptability, and stability were assessed using a short online survey with health
center staff. Sensitivity, positive predictive value (PPV), data quality, and timeliness were
assessed using document review and data from the RAI2 surveillance system.
Results: Between September 2019 and January 2020, 765 malaria patients were
interviewed under the RAI2 surveillance system. An online form was completed by the
focal health center staff, 100% (n=6/6) in the intervention site, and 65.8% (n=27/41) in the
control site. All users rated the system as simple, flexible, stable, and timely. 100%
completeness for all variables was achieved. An area that needed greater attention was
the low acceptability and low sensitivity. PPV was measured at the intervention sites only,
by confirming the Rapid Diagnostic Test (RDT) result with PCR, and was found to be 100%
for both Plasmodium (P.) falciparum and P. vivax, although case numbers were low.
Conclusion: Due to unstable sensitivity in the intervention site, we could not solely rely on
the RAI2 surveillance system’s data to evaluate the intervention’s effectiveness. RAI2
surveillance data were found to be partially useful in describing the characteristics of
patients testing positive for malaria and reporting risk factors such as exposure to forest.
The RAI2 surveillance system should be integrated into the national MIS. MIS has already
been a case-based system but is not timely due to a delay for at least one month for data
to be made available at the central level, while missing a few key exposure variables. MIS
should be moved to be a real-time data collection, adding few more exposure variables,
and setting up an alert system to the district and provincial level to increase its usefulness.
Using Kobo Toolbox as a malaria project-based surveillance system in Cambodia: surveillance evaluation
89
Abbreviation
ACT Artemisinin-based Combination Therapy,
CMS Central Medical Store
CNM National Centre for Parasitology, Entomology and Malaria control
DP Dihydroartemisinin plus Piperaquine;
HC Health Center
IPC Institute Pasteur du Cambodia
IRS Indoor Residual Spraying;
ITN Increasing Insecticide-Treated Nets;
LLIN Long-Lasting Insecticidal Nets;
MIS Malaria Information System
MMW Mobile Malaria Worker
MSAT Mass Screenings and Treatment
NGO Non-governmental Organization
OD Operational District
PHD Provincial Health Department
RAI2 Second-phase Regional Artemisinin-resistance Initiative
RDT Rapid Diagnostic Tests;
SMC Seasonal Malaria Chemoprevention
SP Sulphadoxine + Pyrimethamine;

Chapter 4
90
US CDC United State Centers for Disease Control and Prevention
VMW Village Malaria Workers
WHO World Health Organization

Using Kobo Toolbox as a malaria project-based surveillance system in Cambodia: surveillance evaluation
91
Introduction
Malaria burden at the global level
Malaria, a mosquito-borne disease, disproportionally affects people in low-income
countries (1, 2). Even though the disease is preventable and curable, it remains a critical
public health concern and a leading cause of death (3). According to the 2018 World
Health Organization (WHO) estimate 228 million malaria cases occurred worldwide, with
405,000 deaths (2). According to the latest comparison, malaria ranked 16th as the leading
global cause of death among all-cause mortality in 2017 (4) and ranked 6th among low-
income countries in 2016 (5). Globally, the highest malaria burden is found in Africa.
Africa’s population made up 17.2% of the world population in 2020; however, malaria
cases in this continent shared 93% of global malaria cases (2, 6). The incidence rate due
to malaria per 1000 populations at risk was high at 229.3 in Africa compared to 57.4
globally (2). WHO Western Pacific Region and the WHO Southeast Asia Region had the
lowest reported incidence rate at 2.6 and 4.9 per 1000 population at risk of malaria (2).
Literature Review on the role of malaria surveillance system
The global technical strategy for malaria 2016–2030, developed by WHO, highlighted the
malaria surveillance system as a core intervention in all malaria-endemic settings (7). An
effective malaria surveillance system can be used to identify the most affected population,
target interventions, evaluate the effectiveness of interventions, and advocate for
resources (8).
To inform our evaluation, I conducted a scoping review of malaria literature related to
health center surveillance systems with a focus on malaria. I searched for peer-reviewed
articles on how malaria surveillance data had previously been used to evaluate malaria
intervention impacts on malaria trends. As shown in Figure 4.1, in the initial search, I
followed the PICO (population, intervention, comparison, outcome) framework (9). I
searched the PubMed database using the terms “(intervention* OR program* OR control*)
AND (Effect* OR impact* OR implicat*)) AND (Malaria) AND (surveillance).” With these
terms, 7,554 articles were shown. I reduced the number of articles by adding another term
“AND (health facilit*)” to the existing terms. In this second attempt, 691 articles were
presented. In the next phase, the year of publication was restricted to the last ten years,
reducing total articles to 458. Titles of all 458 articles were then screened, and 43 articles
were selected for abstract read and recorded in EndNote X8.2. During the abstract read,
21 more articles were excluded. Of the 22 articles remaining, 13 additional articles were
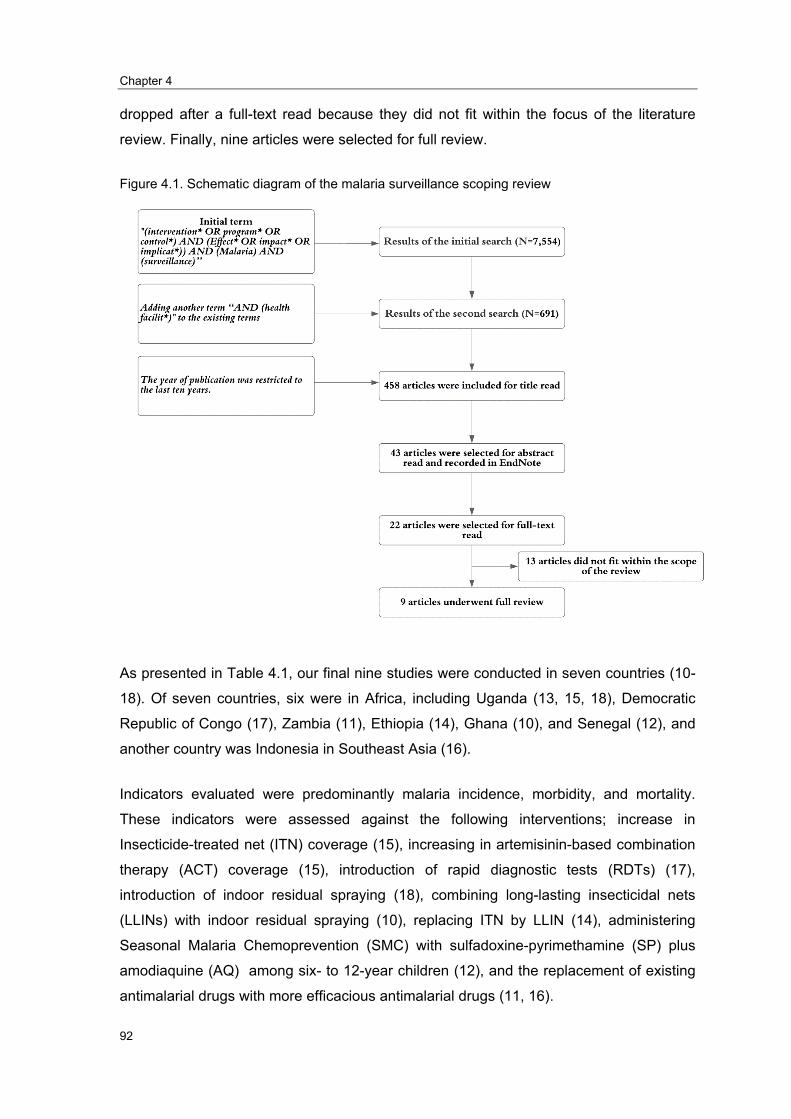
Chapter 4
92
dropped after a full-text read because they did not fit within the focus of the literature
review. Finally, nine articles were selected for full review.
Figure 4.1. Schematic diagram of the malaria surveillance scoping review
As presented in Table 4.1, our final nine studies were conducted in seven countries (10-
18). Of seven countries, six were in Africa, including Uganda (13, 15, 18), Democratic
Republic of Congo (17), Zambia (11), Ethiopia (14), Ghana (10), and Senegal (12), and
another country was Indonesia in Southeast Asia (16).
Indicators evaluated were predominantly malaria incidence, morbidity, and mortality.
These indicators were assessed against the following interventions; increase in
Insecticide-treated net (ITN) coverage (15), increasing in artemisinin-based combination
therapy (ACT) coverage (15), introduction of rapid diagnostic tests (RDTs) (17),
introduction of indoor residual spraying (18), combining long-lasting insecticidal nets
(LLINs) with indoor residual spraying (10), replacing ITN by LLIN (14), administering
Seasonal Malaria Chemoprevention (SMC) with sulfadoxine-pyrimethamine (SP) plus
amodiaquine (AQ) among six- to 12-year children (12), and the replacement of existing
antimalarial drugs with more efficacious antimalarial drugs (11, 16).

Using Kobo Toolbox as a malaria project-based surveillance system in Cambodia: surveillance evaluation
93
In drawing comparisons between intervention and control sites, one of the nine studies,
by Comfort et al. 2014, solely relied on the surveillance data between pre- and post-
intervention (11). Eight studies controlled for one or more of the following factors in their
evaluation; socioeconomic status from national malaria survey, nightlight intensity as
proximity of economic progress, entomological data to calculate human biting index over
time, rainfall, and temperature (10, 12-18).
In terms of the studies’ outcome, eight out of nine studies suggested the interventions
reduced the malaria incidence, morbidity, and mortality, although the levels of reduction
varied (10-16, 18). One intervention, which involved the introduction of RDT, showed a
reversed outcome in which an increase in malaria incidence was observed (17). However,
the reported increase was likely not due to an actual increase in malaria incidence in the
population but due to improved detection (17).
Almost all the studies showed a positive outcome; this might be due to publication bias.
Successful interventions were more likely to be published than the studies that did not
show a positive impact.
We concluded that surveillance data from health facilities could be used to evaluate the
effectiveness of an intervention. However, surveillance data alone is not enough; the data
from other sources should also be collected to adjust in the analysis phase or to support
the interpretation. Learning from this scoping review, we collected information on other
interventions or events that might impact the malaria incidence or notification trends in
their areas through informal discussions with our health center network. The information
was used to support the interpretation of our surveillance evaluation findings and
recommendations.
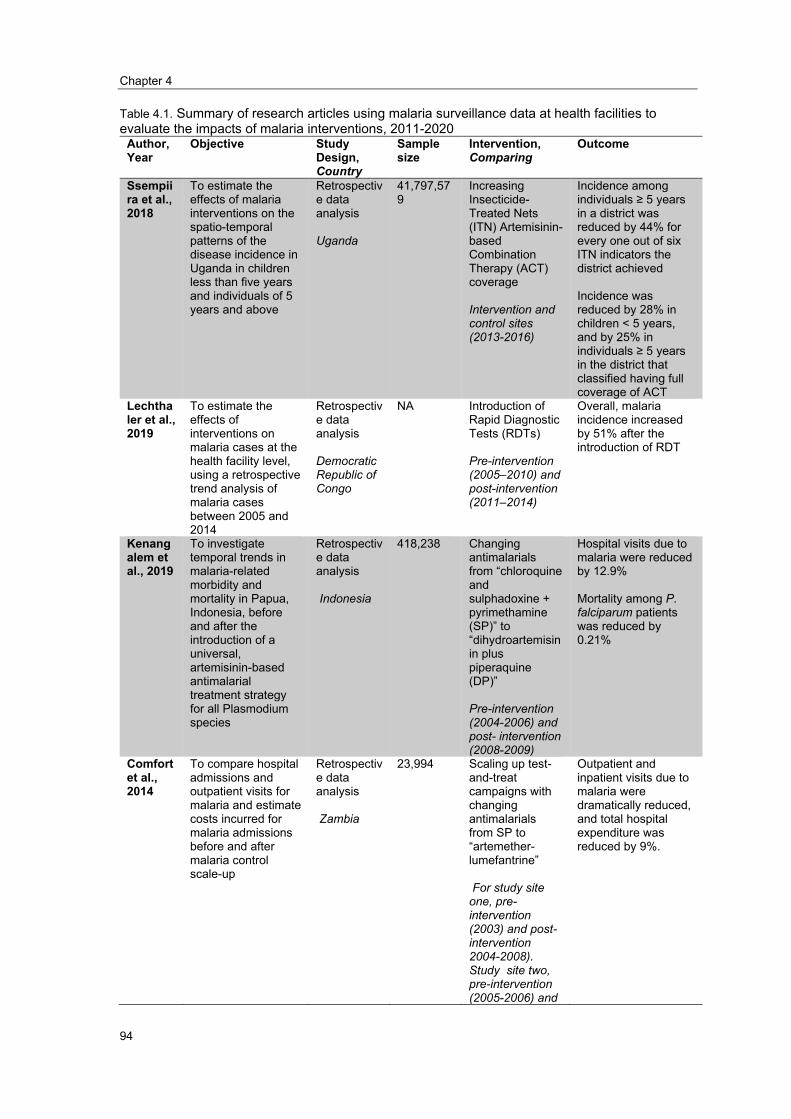
Chapter 4
94
Table 4.1. Summary of research articles using malaria surveillance data at health facilities to evaluate the impacts of malaria interventions, 2011-2020
Author, Year
Objective Study Design, Country
Sample size
Intervention, Comparing
Outcome
Ssempiira et al., 2018
To estimate the effects of malaria interventions on the spatio-temporal patterns of the disease incidence in Uganda in children less than five years and individuals of 5 years and above
Retrospective data analysis
Uganda
41,797,579
Increasing Insecticide-Treated Nets (ITN) Artemisinin-based Combination Therapy (ACT) coverage
Intervention and control sites (2013-2016)
Incidence among individuals ≥ 5 years in a district was reduced by 44% for every one out of six ITN indicators the district achieved
Incidence was reduced by 28% in children < 5 years, and by 25% in individuals ≥ 5 years in the district that classified having full coverage of ACT
Lechthaler et al., 2019
To estimate the effects of interventions on malaria cases at the health facility level, using a retrospective trend analysis of malaria cases between 2005 and 2014
Retrospective data analysis
Democratic Republic of Congo
NA Introduction of Rapid Diagnostic Tests (RDTs)
Pre-intervention (2005–2010) and post-intervention (2011–2014)
Overall, malaria incidence increased by 51% after the introduction of RDT
Kenangalem et al., 2019
To investigate temporal trends in malaria-related morbidity and mortality in Papua, Indonesia, before and after the introduction of a universal, artemisinin-based antimalarial treatment strategy for all Plasmodium species
Retrospective data analysis
Indonesia
418,238 Changing antimalarials from “chloroquine and sulphadoxine + pyrimethamine (SP)” to “dihydroartemisinin plus piperaquine (DP)”
Pre-intervention (2004-2006) and post- intervention (2008-2009)
Hospital visits due to malaria were reduced by 12.9%
Mortality among P. falciparum patients was reduced by 0.21%
Comfort et al., 2014
To compare hospital admissions and outpatient visits for malaria and estimate costs incurred for malaria admissions before and after malaria control scale-up
Retrospective data analysis
Zambia
23,994 Scaling up test-and-treat campaigns with changing antimalarials from SP to “artemether-lumefantrine”
For study site one, pre-intervention (2003) and post-intervention 2004-2008). Study site two, pre-intervention (2005-2006) and
Outpatient and inpatient visits due to malaria were dramatically reduced, and total hospital expenditure was reduced by 9%.
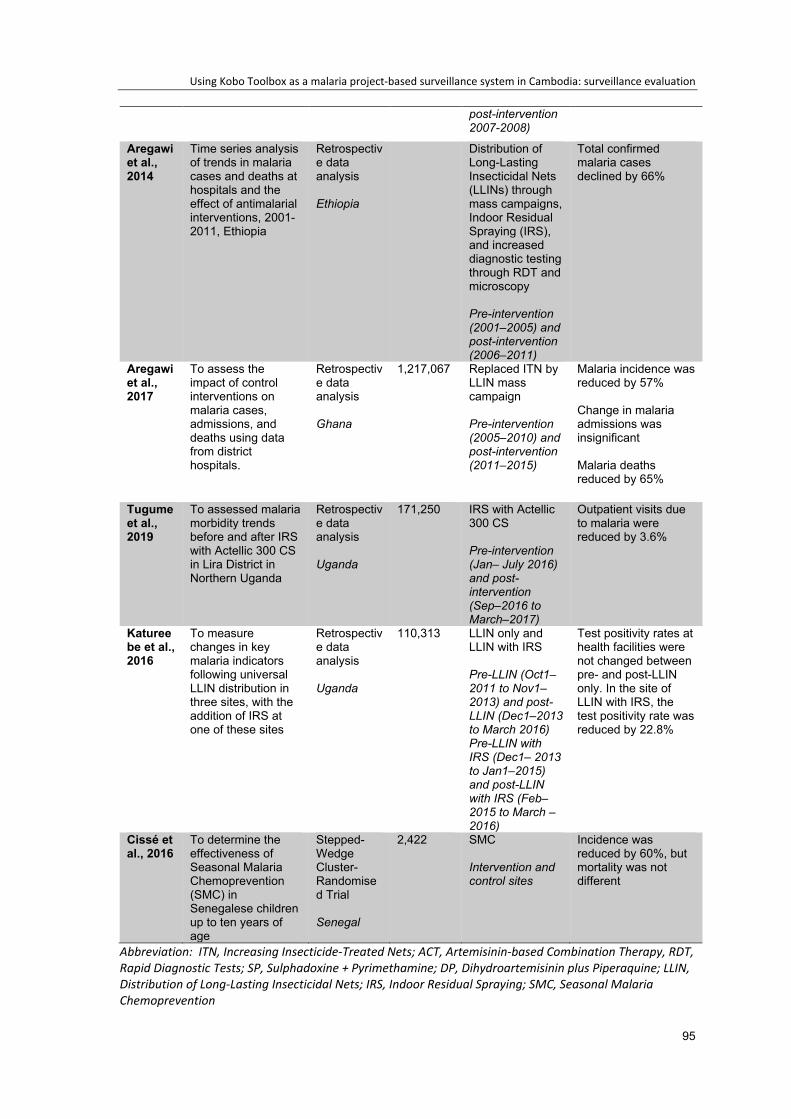
Using Kobo Toolbox as a malaria project-based surveillance system in Cambodia: surveillance evaluation
95
post-intervention 2007-2008)
Aregawi et al., 2014
Time series analysis of trends in malaria cases and deaths at hospitals and the effect of antimalarial interventions, 2001-2011, Ethiopia
Retrospective data analysis
Ethiopia
Distribution of Long-Lasting Insecticidal Nets (LLINs) through mass campaigns, Indoor Residual Spraying (IRS), and increased diagnostic testing through RDT and microscopy
Pre-intervention (2001–2005) and post-intervention (2006–2011)
Total confirmed malaria cases declined by 66%
Aregawi et al., 2017
To assess the impact of control interventions on malaria cases, admissions, and deaths using data from district hospitals.
Retrospective data analysis
Ghana
1,217,067 Replaced ITN by LLIN mass campaign
Pre-intervention (2005–2010) and post-intervention (2011–2015)
Malaria incidence was reduced by 57%
Change in malaria admissions was insignificant
Malaria deaths reduced by 65%
Tugume et al., 2019
To assessed malaria morbidity trends before and after IRS with Actellic 300 CS in Lira District in Northern Uganda
Retrospective data analysis
Uganda
171,250 IRS with Actellic 300 CS
Pre-intervention (Jan– July 2016) and post-intervention (Sep–2016 to March–2017)
Outpatient visits due to malaria were reduced by 3.6%
Katureebe et al., 2016
To measure changes in key malaria indicators following universal LLIN distribution in three sites, with the addition of IRS at one of these sites
Retrospective data analysis
Uganda
110,313 LLIN only and LLIN with IRS
Pre-LLIN (Oct1–2011 to Nov1–2013) and post-LLIN (Dec1–2013 to March 2016) Pre-LLIN with IRS (Dec1– 2013 to Jan1–2015) and post-LLIN with IRS (Feb–2015 to March –2016)
Test positivity rates at health facilities were not changed between pre- and post-LLIN only. In the site of LLIN with IRS, the test positivity rate was reduced by 22.8%
Cissé et al., 2016
To determine the effectiveness of Seasonal Malaria Chemoprevention (SMC) in Senegalese children up to ten years of age
Stepped-Wedge Cluster-Randomised Trial
Senegal
2,422 SMC
Intervention and control sites
Incidence was reduced by 60%, but mortality was not different
Abbreviation: ITN, Increasing Insecticide-Treated Nets; ACT, Artemisinin-based Combination Therapy, RDT, Rapid Diagnostic Tests; SP, Sulphadoxine + Pyrimethamine; DP, Dihydroartemisinin plus Piperaquine; LLIN, Distribution of Long-Lasting Insecticidal Nets; IRS, Indoor Residual Spraying; SMC, Seasonal Malaria Chemoprevention
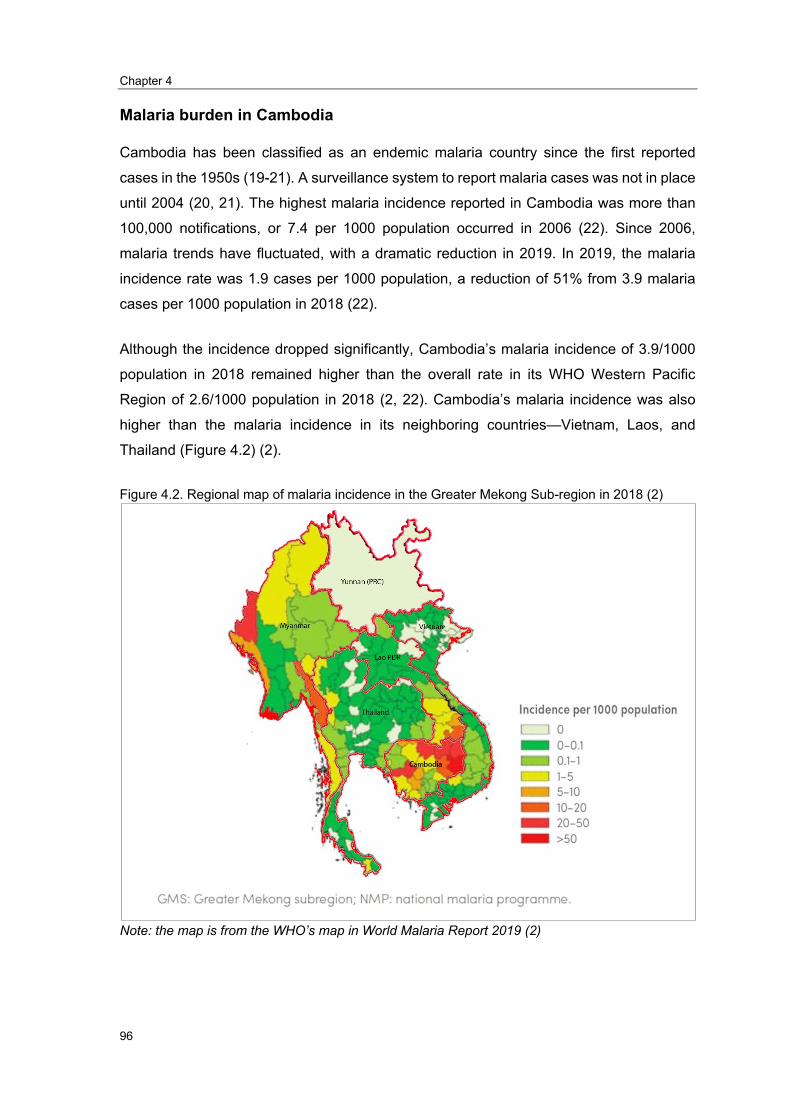
Chapter 4
96
Malaria burden in Cambodia
Cambodia has been classified as an endemic malaria country since the first reported
cases in the 1950s (19-21). A surveillance system to report malaria cases was not in place
until 2004 (20, 21). The highest malaria incidence reported in Cambodia was more than
100,000 notifications, or 7.4 per 1000 population occurred in 2006 (22). Since 2006,
malaria trends have fluctuated, with a dramatic reduction in 2019. In 2019, the malaria
incidence rate was 1.9 cases per 1000 population, a reduction of 51% from 3.9 malaria
cases per 1000 population in 2018 (22).
Although the incidence dropped significantly, Cambodia’s malaria incidence of 3.9/1000
population in 2018 remained higher than the overall rate in its WHO Western Pacific
Region of 2.6/1000 population in 2018 (2, 22). Cambodia’s malaria incidence was also
higher than the malaria incidence in its neighboring countries—Vietnam, Laos, and
Thailand (Figure 4.2) (2).
Figure 4.2. Regional map of malaria incidence in the Greater Mekong Sub-region in 2018 (2)
Note: the map is from the WHO’s map in World Malaria Report 2019 (2)
Using Kobo Toolbox as a malaria project-based surveillance system in Cambodia: surveillance evaluation
97
RAI2 Intervention
In Cambodia, malaria vectors are predominantly located in forested areas along with the
Thai, Vietnamese, and Laos borders (23-25). To date, there are no reported studies of
interventions aimed at eliminating malaria transmission inside these forested areas.
The “Second-phase Regional Artemisinin-resistance Initiative (RAI2)” intervention aimed
to block malaria transmission between forest goers; the initiative was launched in late
August 2019. This project was funded by Global Fund and implemented by Institut Pasteur
du Cambodge in collaboration with the National Centre for Parasitology Entomology and
Malaria Control. The project was implemented in the Prey Lang forest, covering parts of
two northeastern provinces, Kratie and Stung Treng. The RAI2 intervention hypothesized
that the malaria incidence could be reduced through in-forest active mass screenings and
treatment (MSAT) using a standard rapid diagnostic test (RDT) and RDT in combination
with the distribution of a vector control kit— Long-lasting Insecticide Hammock-net and
repellent. This was provided free-of-charge to all infected individuals inside the forest.
Thirty-six forest malaria workers were employed by two partner organizations. These
forest malaria workers spent five days and four nights per week in the forest to perform
study activities. The project covered forest areas of about 1000 square kilometers, with an
estimated 1800 forest-goers regularly entering the areas for their living.The RAI2 initiative
aimed to compare malaria incidence trends in health centers located less than 30
kilometers from the intervention forest with malaria incidence in health centers neighboring
forests in other provinces, where the RAI2 intervention was not implemented.
RAI2 surveillance system
The “RAI2 surveillance system”, a malaria project-based surveillance system, was
launched in late August 2019. This surveillance system’s primary objective was to
contribute to evaluating the effectiveness of in-forest RAI2 interventions targeted at
malaria elimination.
This surveillance system was designed to capture and notify all malaria cases testing
positive (by RDT or microscopy), for Plasmodium (p) falciparum, P. vivax, or Mixed (having
both P. falciparum and P. vivax). The period of data collection was 16 months,
commencing September 2019 and concluding in December 2020. In collecting these data,
malaria patients were interviewed when they met with health center staff to receive their
malaria test results. A 27-item, tablet/smartphone-based questionnaire was used for
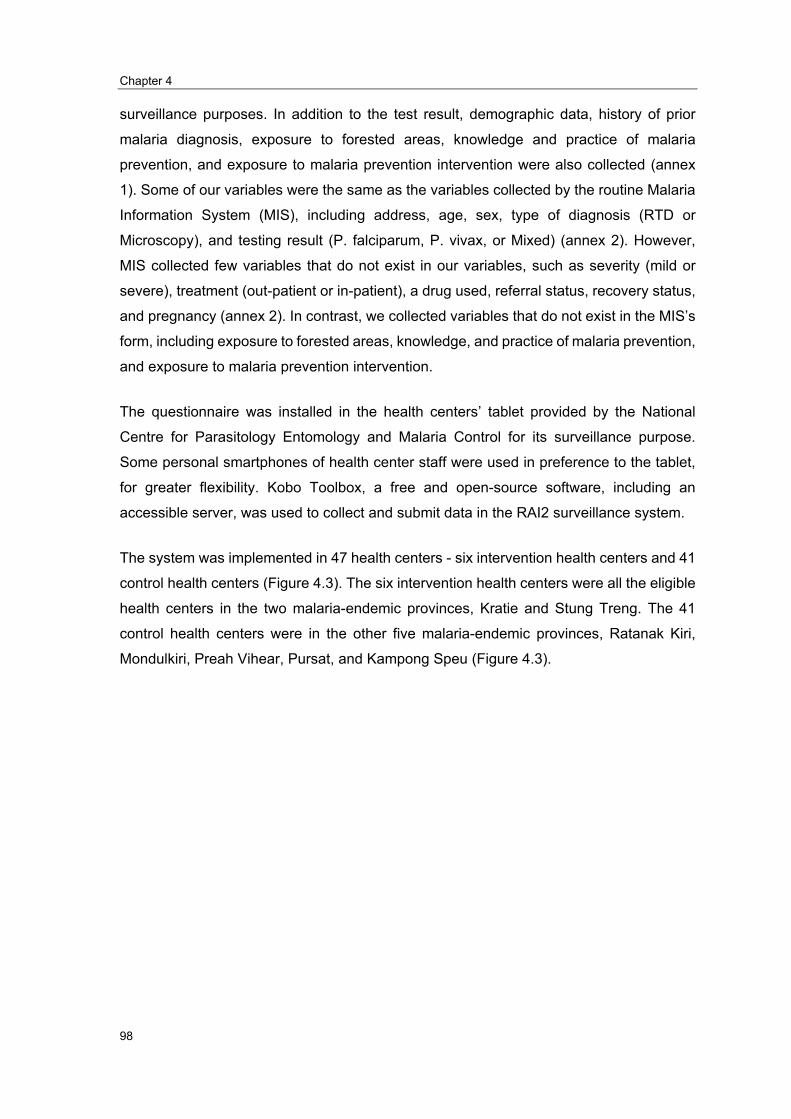
Chapter 4
98
surveillance purposes. In addition to the test result, demographic data, history of prior
malaria diagnosis, exposure to forested areas, knowledge and practice of malaria
prevention, and exposure to malaria prevention intervention were also collected (annex
1). Some of our variables were the same as the variables collected by the routine Malaria
Information System (MIS), including address, age, sex, type of diagnosis (RTD or
Microscopy), and testing result (P. falciparum, P. vivax, or Mixed) (annex 2). However,
MIS collected few variables that do not exist in our variables, such as severity (mild or
severe), treatment (out-patient or in-patient), a drug used, referral status, recovery status,
and pregnancy (annex 2). In contrast, we collected variables that do not exist in the MIS’s
form, including exposure to forested areas, knowledge, and practice of malaria prevention,
and exposure to malaria prevention intervention.
The questionnaire was installed in the health centers’ tablet provided by the National
Centre for Parasitology Entomology and Malaria Control for its surveillance purpose.
Some personal smartphones of health center staff were used in preference to the tablet,
for greater flexibility. Kobo Toolbox, a free and open-source software, including an
accessible server, was used to collect and submit data in the RAI2 surveillance system.
The system was implemented in 47 health centers - six intervention health centers and 41
control health centers (Figure 4.3). The six intervention health centers were all the eligible
health centers in the two malaria-endemic provinces, Kratie and Stung Treng. The 41
control health centers were in the other five malaria-endemic provinces, Ratanak Kiri,
Mondulkiri, Preah Vihear, Pursat, and Kampong Speu (Figure 4.3).

Using Kobo Toolbox as a malaria project-based surveillance system in Cambodia: surveillance evaluation
99
Figure 4.3. Map of intervention and control health centers in the RAI2 surveillance system, Cambodia 2019-2020
Data source: Health Management Information System, Department of Planning Health Information (DPHI), Ministry of Health, 2018
In the selection of intervention health centers, we established the following selection
criteria: the health center (1) had between 10 and 500 P. falciparum cases in 2018, (2)
where located less than 30 km from the forest, and (3) had less than 2500 malaria tests in
2018. We identified six health centers that met the selection criteria; all six health centers
were selected as intervention sites The 41 control health centers were among 45 eligible
health centers in the control site (Figure 4.4). The other four health centers out of 45 also
met the above criteria, but they were not included because of administrative reasons.
These four health centers were already selected for another intervention by another IPC
team. Therefore, it could be burdened to the health centers if they were also chosen for
RAI2. Between the two sites, all processes and questionnaires were the same, except
there was a requirement to collect dried blood spots in all six intervention health centers
and no such requirement in control health centers.

Chapter 4
100
Figure 4.4 Diagram describing the selection of health centers for intervention and control sites in
the early stage (2019), Cambodia
This system was nested into the national Malaria Information System (Figure 4.5). The
RAI2 surveillance system was created and supervised by the Epidemiology and Public
Health Unit at Institut Pasteur du Cambodge, with approval from the National Centre for
Parasitology Entomology and Malaria Control. The research team at Institut Pasteur du
Cambodge provided training to health center staff working for the Malaria Information
System (MIS). We offered extra financial incentives to health center staff for their extra
efforts in completing the surveillance form. In the intervention site, 3.5 USD was provided
to health center staff for each interview and collection of blood samples using dried blood
spots. In the control site, 2 USD was provided per interview only.

Using Kobo Toolbox as a malaria project-based surveillance system in Cambodia: surveillance evaluation
101
Although the RAI2 surveillance system was nested in MIS, enhanced data collection using
the surveillance questionnaire was independent. The completed questionnaire was
expected to be submitted to the Kobo Toolbox server on a monthly basis. However, staff
could submit immediately after the interview, at the end of the day, at the end of the week,
or at the end of the month, depending on access to the internet. At the end of the month,
the staff at Institute Pasteur du Cambodia counted the number of cases (from completed
questionnaires) and contacted the health center staff to pay them through money transfer
agencies.
Staff of Institut Pasteur du Cambodge visited the health centers every two-to-three months
to review the log-book and compare the number of malaria cases reported in health center
registration books to the number notified to the Kobo Toolbox server. Remote
communication with health workers responsible for surveillance activities was conducted
through the TelegramTM App account group chat as needed. Individual phone calls were
conducted to check if any issues had been identified and needed to be addressed.
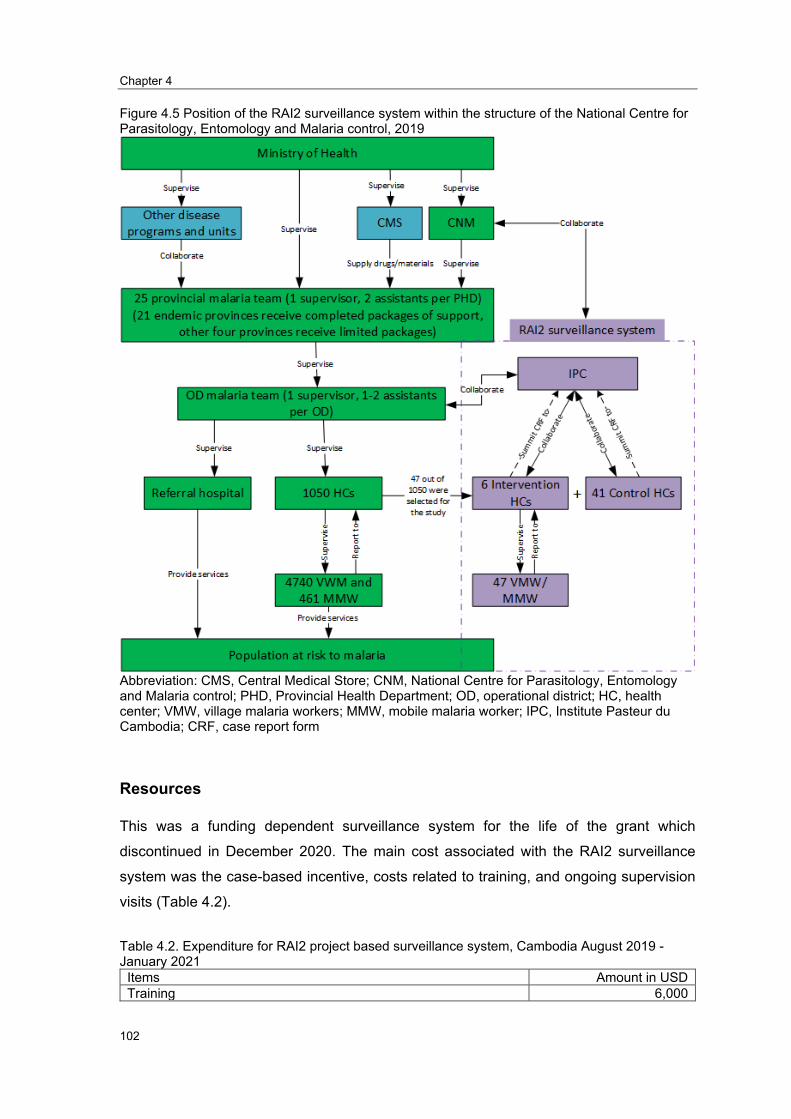
Chapter 4
102
Figure 4.5 Position of the RAI2 surveillance system within the structure of the National Centre for Parasitology, Entomology and Malaria control, 2019
Abbreviation: CMS, Central Medical Store; CNM, National Centre for Parasitology, Entomology and Malaria control; PHD, Provincial Health Department; OD, operational district; HC, health center; VMW, village malaria workers; MMW, mobile malaria worker; IPC, Institute Pasteur du Cambodia; CRF, case report form
Resources
This was a funding dependent surveillance system for the life of the grant which
discontinued in December 2020. The main cost associated with the RAI2 surveillance
system was the case-based incentive, costs related to training, and ongoing supervision
visits (Table 4.2).
Table 4.2. Expenditure for RAI2 project based surveillance system, Cambodia August 2019 -January 2021
Items Amount in USD Training 6,000
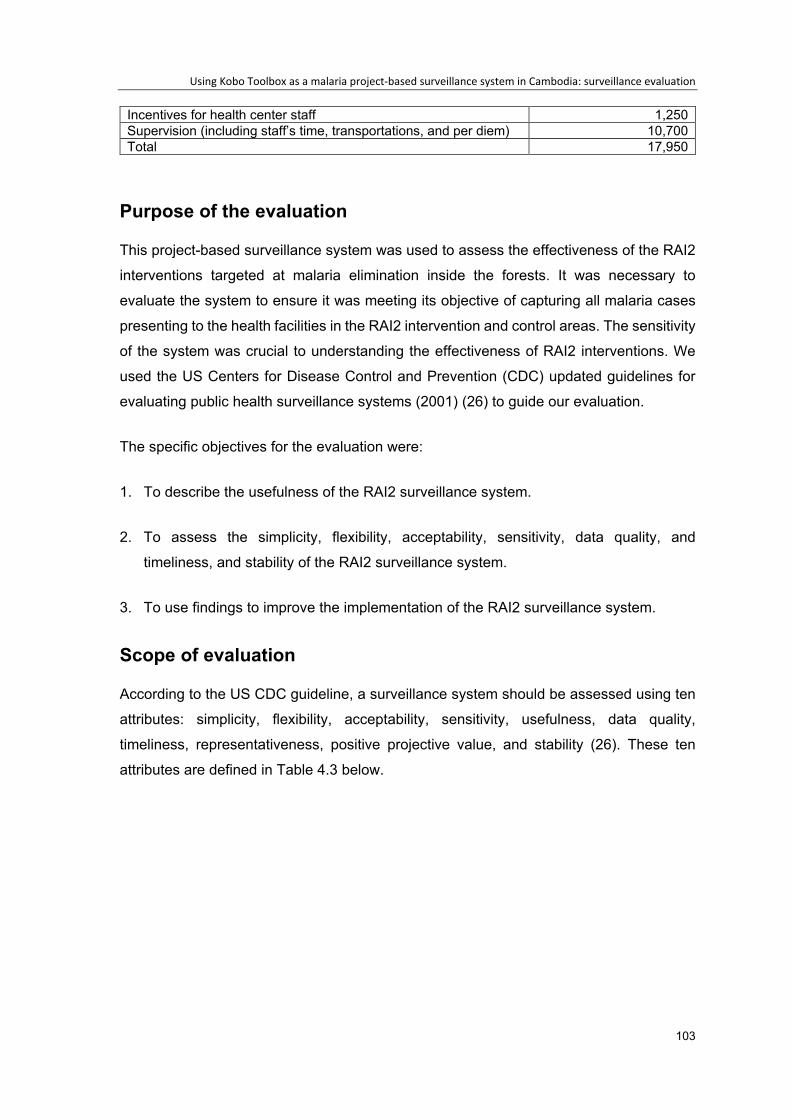
Using Kobo Toolbox as a malaria project-based surveillance system in Cambodia: surveillance evaluation
103
Incentives for health center staff 1,250 Supervision (including staff’s time, transportations, and per diem) 10,700 Total 17,950
Purpose of the evaluation
This project-based surveillance system was used to assess the effectiveness of the RAI2
interventions targeted at malaria elimination inside the forests. It was necessary to
evaluate the system to ensure it was meeting its objective of capturing all malaria cases
presenting to the health facilities in the RAI2 intervention and control areas. The sensitivity
of the system was crucial to understanding the effectiveness of RAI2 interventions. We
used the US Centers for Disease Control and Prevention (CDC) updated guidelines for
evaluating public health surveillance systems (2001) (26) to guide our evaluation.
The specific objectives for the evaluation were:
1. To describe the usefulness of the RAI2 surveillance system.
2. To assess the simplicity, flexibility, acceptability, sensitivity, data quality, and
timeliness, and stability of the RAI2 surveillance system.
3. To use findings to improve the implementation of the RAI2 surveillance system.
Scope of evaluation
According to the US CDC guideline, a surveillance system should be assessed using ten
attributes: simplicity, flexibility, acceptability, sensitivity, usefulness, data quality,
timeliness, representativeness, positive projective value, and stability (26). These ten
attributes are defined in Table 4.3 below.

Chapter 4
104
Table 4.3. The standard definition of surveillance system attributes, according to the US CDC guide (26)
Surveillance attribute Definition Simplicity
Refers to both its structure and ease of operation. Surveillance systems should be as simple as possible while still meeting their objectives.
Flexibility
Ability to adapt to changing information needs or operating conditions with little additional time, personnel, or allocated funds
Acceptability
Reflects the willingness of persons and organizations to participate in the surveillance system
Sensitivity
Refers to the proportion of cases of a disease (or other health-related events) detected by the surveillance system
Usefulness Does the system contribute to the prevention and control of adverse health-related events? The system can also be useful if it helps to identify other adverse health events.
Data quality Reflects the completeness and validity of the data recorded in the public health surveillance system
Timeliness The surveillance system ensures early detection of disease patterns above stipulated alert thresholds, facilitating a timely response and intervention. Examines the speed between steps in the surveillance system
Representativeness a Accurately describes the occurrence of the event over time and its distribution in the population by person and place.
Positive predictive value Proportion of reported cases that have the health-related event under surveillance
Stability
Refers to the reliability (i.e., the ability to collect, manage, and provide data properly without failure) and availability (the ability to be operational when it is needed) of the public health surveillance system
(a)The attribute was not assessed in this evaluation
There were some limitations in our evaluation that limited our scope. First,
representativeness, defined as an accurate description of the event over time and its
distribution in the population by person and place, was not assessed. To our best
knowledge, there is no available data to evaluate representativeness. To evaluate the
RAI2 surveillance system’s representativeness, we would need to determine if the
incidence of malaria captured by the RAI2 surveillance system reflects the actual malaria
incidence in the catchment area. This was beyond the scope of this evaluation. Second,
the definition of sensitivity in our evaluation was modified. The US CDC guide defines the
sensitivity of a surveillance system as the proportion of all cases of a disease detected by
the surveillance system (26). Due to the resource-constraints, we restricted the definition
to the proportion of malaria cases that visited selected health centers and were notified
through the RAI2 surveillance system. Third, the positive predicted value (PPV) is defined
as the proportion of reported cases that actually have the health-related event under
surveillance (26); due to logistical and resource constraints, this was assessed in the six
intervention health centers only as they were collecting the additional blood specimens.

Using Kobo Toolbox as a malaria project-based surveillance system in Cambodia: surveillance evaluation
105
Engaging stakeholders
The data collected was primarily used by the research team at Institute Pasteur du
Cambodia to evaluate the RAI2 intervention. Key stakeholders at the Institute Pasteur du
Cambodia team and the health center staff implementing the surveillance system were
engaged in this evaluation. The principal investigator and relevant staff were consulted on
the evaluation design and key indicators.
Methodology
A quantitative method was used in this evaluation, including an online stakeholder survey
and an analysis of the RAI2 surveillance system data. The data collection took place
between 18 December 2019 and 24 January 2020.
Usefulness was described based on the outcome of evaluating the eight attributes of a
surveillance system, as defined by the US CDC (26). Simplicity, flexibility, acceptability,
and stability were assessed based on the health center head and health center staff’s
opinions through a short online survey. Sensitivity, PPV, data quality, and timeliness were
assessed using document review and data of the RAI2 surveillance system extracted from
the Kobo Toolbox server.
We sent the focal staff an online form through the TelegramTM App personal account. They
were first approached through an initial phone call in which they were invited to participate
prior to sending the link to the e-Survey. The TelegramTM App was chosen by Cambodia’s
government as a communication channel; therefore, the majority of government staff have
a TelegramTM App account.
The questionnaire was created based on consultation with the RAI2 study team for the
specific purpose of improving the implementation of the intervention. The questionnaire
was provided in the Khmer language and consisted of questions about demographics data,
simplicity, flexibility, acceptability, stability, and data quality. These questions had not been
previously validated.
Data analysis
Survey data were downloaded from the Kobo Toolbox server, and a descriptive analysis
was performed to describe each indicator of interest under the relevant attribute.

Chapter 4
106
Since our goal is to see whether data in each site is reliable enough to evaluate the effect
of the intervention, we stratified the results into intervention and control sites. By so doing,
we will be able to recommend whether the data is reliable enough to evaluate the
effectiveness of RAI2 intervention.
Ethics
The study protocol and tools were not submitted to the National Ethics Committee for
Health Research (NECHR) for review and approval. This evaluation was for internal quality
improvement only, and it is also covered under the Australian National University’s blanket
ethics waiver for surveillance evaluations (2017/909). Participation in the study was
completely voluntary, and anticipated risk for participants was minimal. The study
participants were informed that they were able to refuse or discontinue their participation
at any time for any reason and without any consequences.
Results
Summary of RAI2 surveillance data
Characteristics of patients reported through the RAI2 surveillance system are described
in Table 4.4. Between 1 September 2019 and 30 January 2020, 765 malaria cases were
interviewed with 12.4% (n=95) P. falciparum, 86.3% (n=660) P. vivax, and 1.3% (n=10)
Mixed.
Overall, the majority of the patients (82.1%, n=628/765) were male. The median age was
24 years (interquartile range – IQR, 17-33 years), 91.6% (n=701/765) were residents who
had been living in their current village for more than a year at the time of interview (Table
4.4).
The three most frequent symptoms reported by patients were headache (94.9%,
n=665/765), fever (83.7%, n=587/765), and body pain (61.1%, n=428/765) (Table 4.4).
The RDT was used to test most patients (93.3%, n=714/765), while the other 6.7%
(n=51/765) were tested by microscopy (Table 4.4).
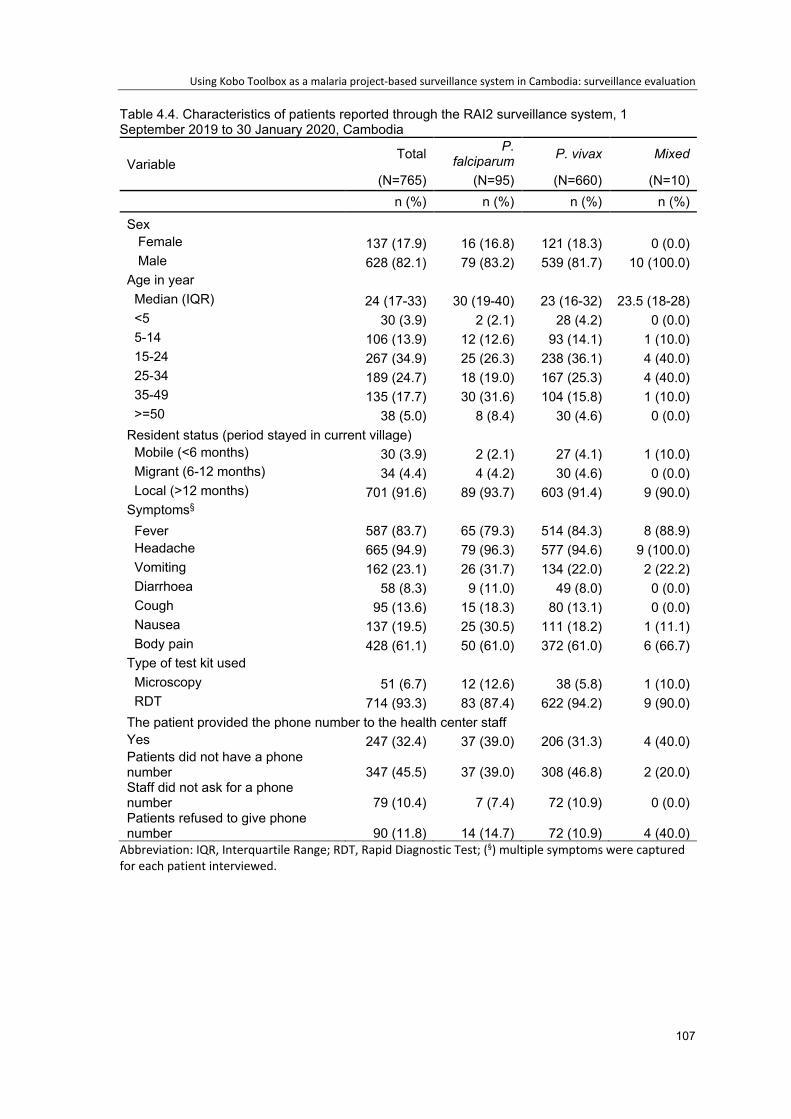
Using Kobo Toolbox as a malaria project-based surveillance system in Cambodia: surveillance evaluation
107
Table 4.4. Characteristics of patients reported through the RAI2 surveillance system, 1 September 2019 to 30 January 2020, Cambodia
Variable Total P.
falciparum P. vivax Mixed
(N=765) (N=95) (N=660) (N=10) n (%) n (%) n (%) n (%)
Sex Female 137 (17.9) 16 (16.8) 121 (18.3) 0 (0.0) Male 628 (82.1) 79 (83.2) 539 (81.7) 10 (100.0)
Age in year Median (IQR) 24 (17-33) 30 (19-40) 23 (16-32) 23.5 (18-28) <5 30 (3.9) 2 (2.1) 28 (4.2) 0 (0.0) 5-14 106 (13.9) 12 (12.6) 93 (14.1) 1 (10.0) 15-24 267 (34.9) 25 (26.3) 238 (36.1) 4 (40.0) 25-34 189 (24.7) 18 (19.0) 167 (25.3) 4 (40.0) 35-49 135 (17.7) 30 (31.6) 104 (15.8) 1 (10.0) >=50 38 (5.0) 8 (8.4) 30 (4.6) 0 (0.0)
Resident status (period stayed in current village) Mobile (<6 months) 30 (3.9) 2 (2.1) 27 (4.1) 1 (10.0) Migrant (6-12 months) 34 (4.4) 4 (4.2) 30 (4.6) 0 (0.0) Local (>12 months) 701 (91.6) 89 (93.7) 603 (91.4) 9 (90.0)
Symptoms§
Fever 587 (83.7) 65 (79.3) 514 (84.3) 8 (88.9) Headache 665 (94.9) 79 (96.3) 577 (94.6) 9 (100.0) Vomiting 162 (23.1) 26 (31.7) 134 (22.0) 2 (22.2) Diarrhoea 58 (8.3) 9 (11.0) 49 (8.0) 0 (0.0) Cough 95 (13.6) 15 (18.3) 80 (13.1) 0 (0.0) Nausea 137 (19.5) 25 (30.5) 111 (18.2) 1 (11.1) Body pain 428 (61.1) 50 (61.0) 372 (61.0) 6 (66.7)
Type of test kit used Microscopy 51 (6.7) 12 (12.6) 38 (5.8) 1 (10.0) RDT 714 (93.3) 83 (87.4) 622 (94.2) 9 (90.0)
The patient provided the phone number to the health center staff Yes 247 (32.4) 37 (39.0) 206 (31.3) 4 (40.0) Patients did not have a phone number 347 (45.5) 37 (39.0) 308 (46.8) 2 (20.0) Staff did not ask for a phone number 79 (10.4) 7 (7.4) 72 (10.9) 0 (0.0) Patients refused to give phone number 90 (11.8) 14 (14.7) 72 (10.9) 4 (40.0)
Abbreviation: IQR, Interquartile Range; RDT, Rapid Diagnostic Test; (§) multiple symptoms were captured for each patient interviewed.

Chapter 4
108
As shown in Table 4.5, almost two-third (60.4%, n=462/765) of patients interviewed had
previously tested positive for malaria (either P.faciparum or P. vivax). The median time
interval between the current positive status and previous positive status was three months,
with an interquartile range between 2 and 8 months.
Approximately 64% (n=493/765) reported they had visited a forest in the past 12 months
(Table 4.5). When we stratified by species, the proportion of patients that reported having
visited the forests in the past 12 months and had tested positive for P. falciparum was
70.5% (n=67/95) compared to 63.3% (n=418/660) P. vivax. When we shortened the
timeframe to the past three weeks, 88.1% (n=59/67) and 75.8% (n=317/418) of P.
falciparum and P. vivax patients reported having visited the forest, respectively.
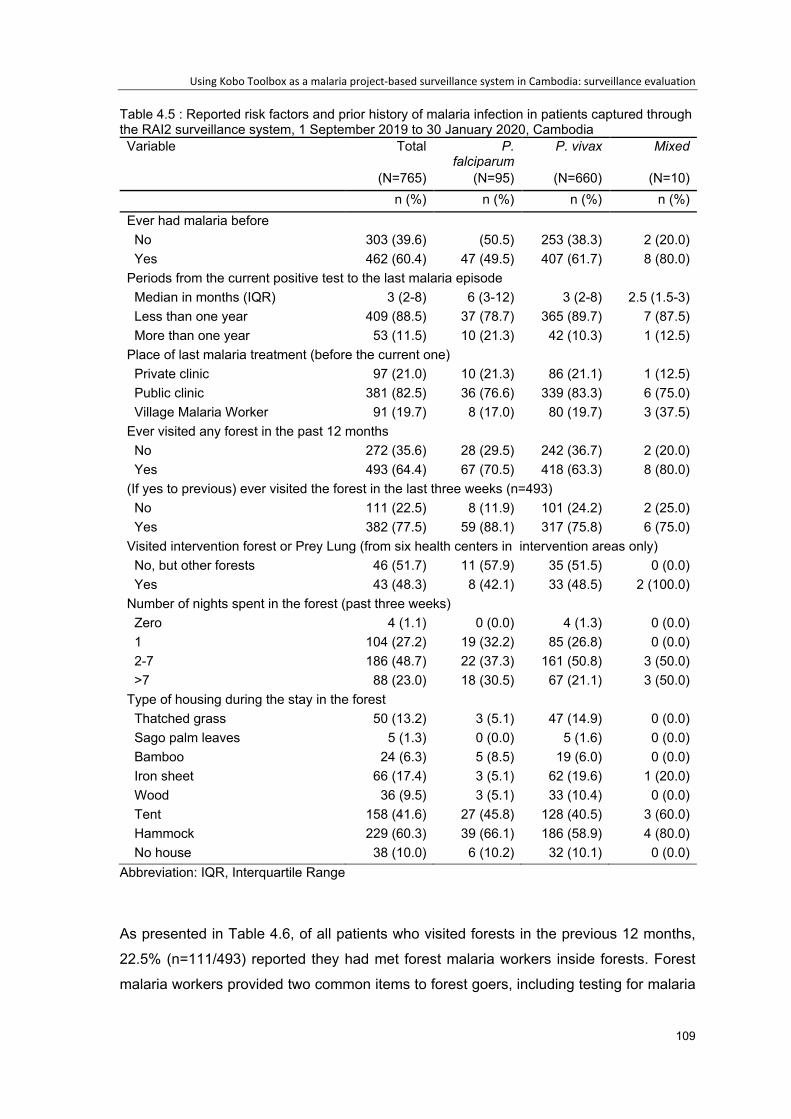
Using Kobo Toolbox as a malaria project-based surveillance system in Cambodia: surveillance evaluation
109
Table 4.5 : Reported risk factors and prior history of malaria infection in patients captured through the RAI2 surveillance system, 1 September 2019 to 30 January 2020, Cambodia Variable Total P.
falciparum P. vivax Mixed
(N=765) (N=95) (N=660) (N=10) n (%) n (%) n (%) n (%)
Ever had malaria before No 303 (39.6) (50.5) 253 (38.3) 2 (20.0) Yes 462 (60.4) 47 (49.5) 407 (61.7) 8 (80.0)
Periods from the current positive test to the last malaria episode Median in months (IQR) 3 (2-8) 6 (3-12) 3 (2-8) 2.5 (1.5-3) Less than one year 409 (88.5) 37 (78.7) 365 (89.7) 7 (87.5) More than one year 53 (11.5) 10 (21.3) 42 (10.3) 1 (12.5)
Place of last malaria treatment (before the current one) Private clinic 97 (21.0) 10 (21.3) 86 (21.1) 1 (12.5) Public clinic 381 (82.5) 36 (76.6) 339 (83.3) 6 (75.0) Village Malaria Worker 91 (19.7) 8 (17.0) 80 (19.7) 3 (37.5)
Ever visited any forest in the past 12 months No 272 (35.6) 28 (29.5) 242 (36.7) 2 (20.0) Yes 493 (64.4) 67 (70.5) 418 (63.3) 8 (80.0)
(If yes to previous) ever visited the forest in the last three weeks (n=493) No 111 (22.5) 8 (11.9) 101 (24.2) 2 (25.0) Yes 382 (77.5) 59 (88.1) 317 (75.8) 6 (75.0)
Visited intervention forest or Prey Lung (from six health centers in intervention areas only) No, but other forests 46 (51.7) 11 (57.9) 35 (51.5) 0 (0.0) Yes 43 (48.3) 8 (42.1) 33 (48.5) 2 (100.0)
Number of nights spent in the forest (past three weeks) Zero 4 (1.1) 0 (0.0) 4 (1.3) 0 (0.0) 1 104 (27.2) 19 (32.2) 85 (26.8) 0 (0.0) 2-7 186 (48.7) 22 (37.3) 161 (50.8) 3 (50.0) >7 88 (23.0) 18 (30.5) 67 (21.1) 3 (50.0)
Type of housing during the stay in the forest Thatched grass 50 (13.2) 3 (5.1) 47 (14.9) 0 (0.0) Sago palm leaves 5 (1.3) 0 (0.0) 5 (1.6) 0 (0.0) Bamboo 24 (6.3) 5 (8.5) 19 (6.0) 0 (0.0) Iron sheet 66 (17.4) 3 (5.1) 62 (19.6) 1 (20.0) Wood 36 (9.5) 3 (5.1) 33 (10.4) 0 (0.0) Tent 158 (41.6) 27 (45.8) 128 (40.5) 3 (60.0) Hammock 229 (60.3) 39 (66.1) 186 (58.9) 4 (80.0) No house 38 (10.0) 6 (10.2) 32 (10.1) 0 (0.0)
Abbreviation: IQR, Interquartile Range
As presented in Table 4.6, of all patients who visited forests in the previous 12 months,
22.5% (n=111/493) reported they had met forest malaria workers inside forests. Forest
malaria workers provided two common items to forest goers, including testing for malaria
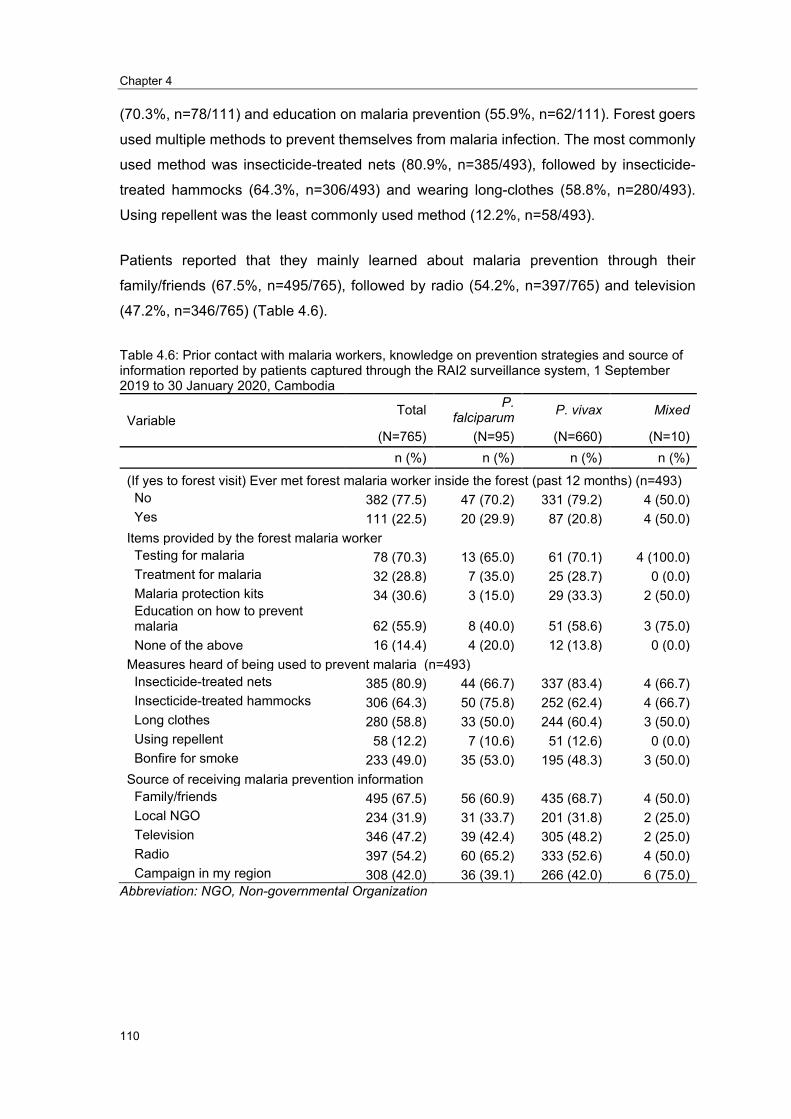
Chapter 4
110
(70.3%, n=78/111) and education on malaria prevention (55.9%, n=62/111). Forest goers
used multiple methods to prevent themselves from malaria infection. The most commonly
used method was insecticide-treated nets (80.9%, n=385/493), followed by insecticide-
treated hammocks (64.3%, n=306/493) and wearing long-clothes (58.8%, n=280/493).
Using repellent was the least commonly used method (12.2%, n=58/493).
Patients reported that they mainly learned about malaria prevention through their
family/friends (67.5%, n=495/765), followed by radio (54.2%, n=397/765) and television
(47.2%, n=346/765) (Table 4.6).
Table 4.6: Prior contact with malaria workers, knowledge on prevention strategies and source of information reported by patients captured through the RAI2 surveillance system, 1 September 2019 to 30 January 2020, Cambodia
Variable Total P.
falciparum P. vivax Mixed
(N=765) (N=95) (N=660) (N=10) n (%) n (%) n (%) n (%)
(If yes to forest visit) Ever met forest malaria worker inside the forest (past 12 months) (n=493) No 382 (77.5) 47 (70.2) 331 (79.2) 4 (50.0) Yes 111 (22.5) 20 (29.9) 87 (20.8) 4 (50.0)
Items provided by the forest malaria worker Testing for malaria 78 (70.3) 13 (65.0) 61 (70.1) 4 (100.0) Treatment for malaria 32 (28.8) 7 (35.0) 25 (28.7) 0 (0.0) Malaria protection kits 34 (30.6) 3 (15.0) 29 (33.3) 2 (50.0) Education on how to prevent malaria 62 (55.9) 8 (40.0) 51 (58.6) 3 (75.0) None of the above 16 (14.4) 4 (20.0) 12 (13.8) 0 (0.0)
Measures heard of being used to prevent malaria (n=493) Insecticide-treated nets 385 (80.9) 44 (66.7) 337 (83.4) 4 (66.7) Insecticide-treated hammocks 306 (64.3) 50 (75.8) 252 (62.4) 4 (66.7) Long clothes 280 (58.8) 33 (50.0) 244 (60.4) 3 (50.0) Using repellent 58 (12.2) 7 (10.6) 51 (12.6) 0 (0.0) Bonfire for smoke 233 (49.0) 35 (53.0) 195 (48.3) 3 (50.0)
Source of receiving malaria prevention information Family/friends 495 (67.5) 56 (60.9) 435 (68.7) 4 (50.0) Local NGO 234 (31.9) 31 (33.7) 201 (31.8) 2 (25.0) Television 346 (47.2) 39 (42.4) 305 (48.2) 2 (25.0) Radio 397 (54.2) 60 (65.2) 333 (52.6) 4 (50.0) Campaign in my region 308 (42.0) 36 (39.1) 266 (42.0) 6 (75.0)
Abbreviation: NGO, Non-governmental Organization
Using Kobo Toolbox as a malaria project-based surveillance system in Cambodia: surveillance evaluation
111
Attributes of the RAI2 surveillance system
Characteristics of respondents
A link to the online survey form was sent to 47 health center staff, and 70.0% (n=33/47)
completed and submitted the form. One hundred percent (n=6/6) of focal health center
staff in the intervention sites and 65.8% (n=27/41) in the control sites completed the form.
Of 33 respondents, 54.6% (n=18/33) were the head of the health center, and 45.5%
(n=15/33) were general health staff.
Simplicity
According to the US CDC, simplicity refers to both the structure of the system and ease of
operation. Surveillance systems should be as simple as possible while still meeting their
objectives (26).
We assumed that the study team and implementers at the health center would benefit from
using an electronic smartphone-based questionnaire (Kobo Toolbox). The proposed
benefit was the ability to do direct data entry at the interview time, removing the need for
health center staff to spend additional time entering data. The inclusion of skip logic made
the interview process easier, removing irrelevant questions based on the previous answer.
It was anticipated that using an electronic data collection system would reduce workload
and additional time burdens on health center staff compared to using a paper-based
questionnaire. It was anticipated that the study team would also reduce the time and
expenses associated with traveling to the data collection sites to collect paper forms.
Key finding:
• The RAI2 surveillance system was simple for a large portion of users overall.
All users (n=33/33, 100%) rated the questionnaire simple/very simple from the evaluation
survey results. Users were confident in saving and submitting completed forms, 97.0%
(n=32/33) (Figure 4.6).
Of the total, 87.9% (n=29/33) rated they were confident with downloading the form, 87.9%
(n=29/33) reported that they always had or often had enough time to interview patients,

Chapter 4
112
and 87.9% (n=29/33) also agreed that they could always or often get technical support
from Institute Pasteur du Cambodia team as needed.
The similarity in the proportion of users positively rating the simplicity variables was seen
between intervention and control sites.
Figure 4.6. Indicators of the simplicity of the RAI2 surveillance system in Cambodia, Sep 2019 to Jan 2019
Using Kobo Toolbox as a malaria project-based surveillance system in Cambodia: surveillance evaluation
113
Flexibility
We assessed flexibility on whether users could choose to use a tablet/smartphone or a
paper-based questionnaire. We also assessed users’ preference for each method,
whether they prefer any one of these or mixed. From the study team’s perspective, using
an electronic questionnaire made it very easy to add or remove variables from the
questionnaire if required.
Key findings:
• Users had the ability to select the data entry tool, an electronic form using a
tablet/smartphone or a paper-based questionnaire, reflecting the RAI2 surveillance
system was flexible.
• There was a stronger preference for using the electronic-based questionnaire in
intervention sites than in the control site.
Table 4.7 presents the indicators for assessing the flexibility of the RAI2 surveillance
system. Approximately, 42.4% (n=14/33) reported using a tablet only, 42.4% (n=14/33)
used smartphone only, and 15.4% (n=4) used both tablet and smartphone. Of the total
respondents, 81.3% (n=26) reported having paper-based questionnaires in their health
centers, which they used when necessary. These findings were similar between
intervention and control sites.
However, 51.5% (n=17/33) said they preferred using tablet/smartphone-based over paper-
based questionnaire while 45.5% (n=15/33) prefer having both electronic and paper-based
questionnaires. A stronger preference for using tablet/smartphone-based questionnaire
was seen in intervention site (83.3%, n=5/6) compared to 44.4% (n=12/27) in control site.
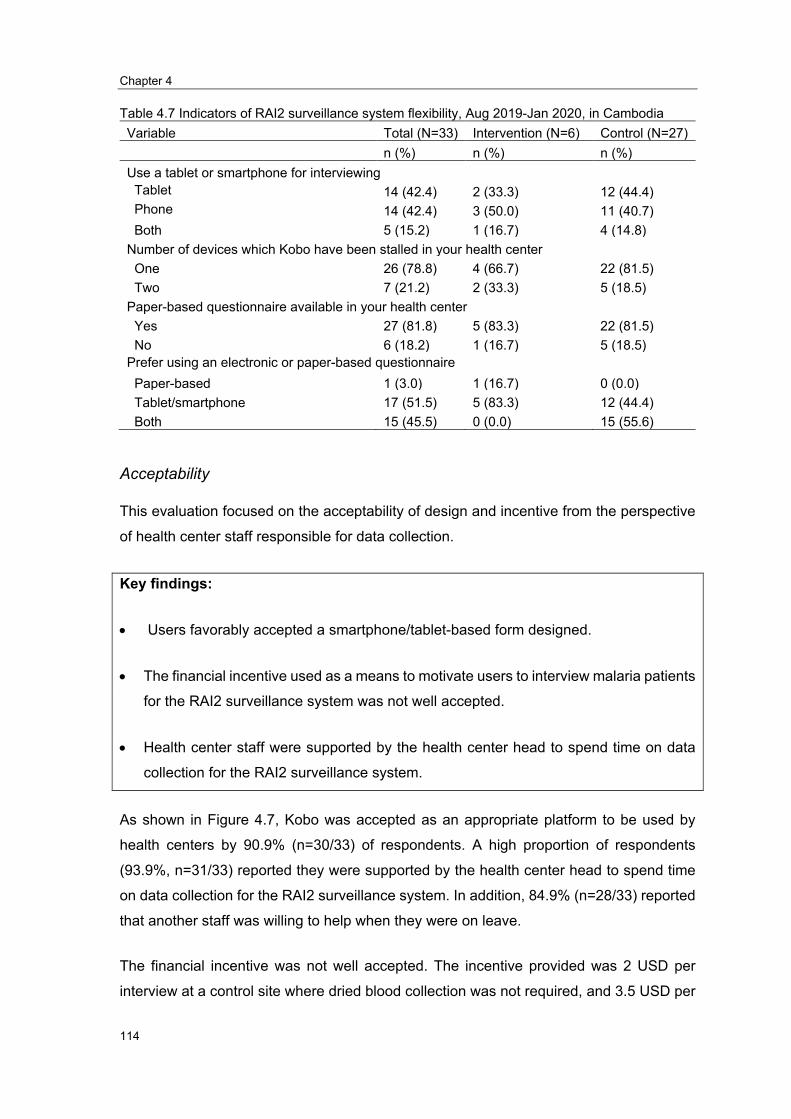
Chapter 4
114
Table 4.7 Indicators of RAI2 surveillance system flexibility, Aug 2019-Jan 2020, in Cambodia Variable Total (N=33) Intervention (N=6) Control (N=27)
n (%) n (%) n (%) Use a tablet or smartphone for interviewing
Tablet 14 (42.4) 2 (33.3) 12 (44.4) Phone 14 (42.4) 3 (50.0) 11 (40.7) Both 5 (15.2) 1 (16.7) 4 (14.8)
Number of devices which Kobo have been stalled in your health center One 26 (78.8) 4 (66.7) 22 (81.5) Two 7 (21.2) 2 (33.3) 5 (18.5)
Paper-based questionnaire available in your health center Yes 27 (81.8) 5 (83.3) 22 (81.5) No 6 (18.2) 1 (16.7) 5 (18.5)
Prefer using an electronic or paper-based questionnaire Paper-based 1 (3.0) 1 (16.7) 0 (0.0) Tablet/smartphone 17 (51.5) 5 (83.3) 12 (44.4) Both 15 (45.5) 0 (0.0) 15 (55.6)
Acceptability
This evaluation focused on the acceptability of design and incentive from the perspective
of health center staff responsible for data collection.
Key findings:
• Users favorably accepted a smartphone/tablet-based form designed.
• The financial incentive used as a means to motivate users to interview malaria patients
for the RAI2 surveillance system was not well accepted.
• Health center staff were supported by the health center head to spend time on data
collection for the RAI2 surveillance system.
As shown in Figure 4.7, Kobo was accepted as an appropriate platform to be used by
health centers by 90.9% (n=30/33) of respondents. A high proportion of respondents
(93.9%, n=31/33) reported they were supported by the health center head to spend time
on data collection for the RAI2 surveillance system. In addition, 84.9% (n=28/33) reported
that another staff was willing to help when they were on leave.
The financial incentive was not well accepted. The incentive provided was 2 USD per
interview at a control site where dried blood collection was not required, and 3.5 USD per

Using Kobo Toolbox as a malaria project-based surveillance system in Cambodia: surveillance evaluation
115
interview at the intervention site where dried blood collection was required. Only 40.7%
(n=11/27) of all respondents at the control site, and 50.0% (n=3/6) of all respondents at
the intervention site, indicated that the incentive was appropriate. When asked to nominate
an acceptable amount for the incentive, the average amount was 4.0 USD, with a standard
deviation of 1.2 USD at the control site and an average of 5 USD with a standard deviation
of 2.9 USD at the intervention sites.
Figure 4.7. Indicators of acceptability of RAI2 surveillance system in Cambodia, Sep 2019 to Jan
2020
Figure 4.8 summarizes the common reasons why not all RAI2 surveillance questionnaires
were completed, even when they had patients testing positive for malaria at the health
center. The most common reason was they were busy with many clients (54.8%. n=17/31),
and the incentive was not enough to motivate them (41.9%, n=13/31).
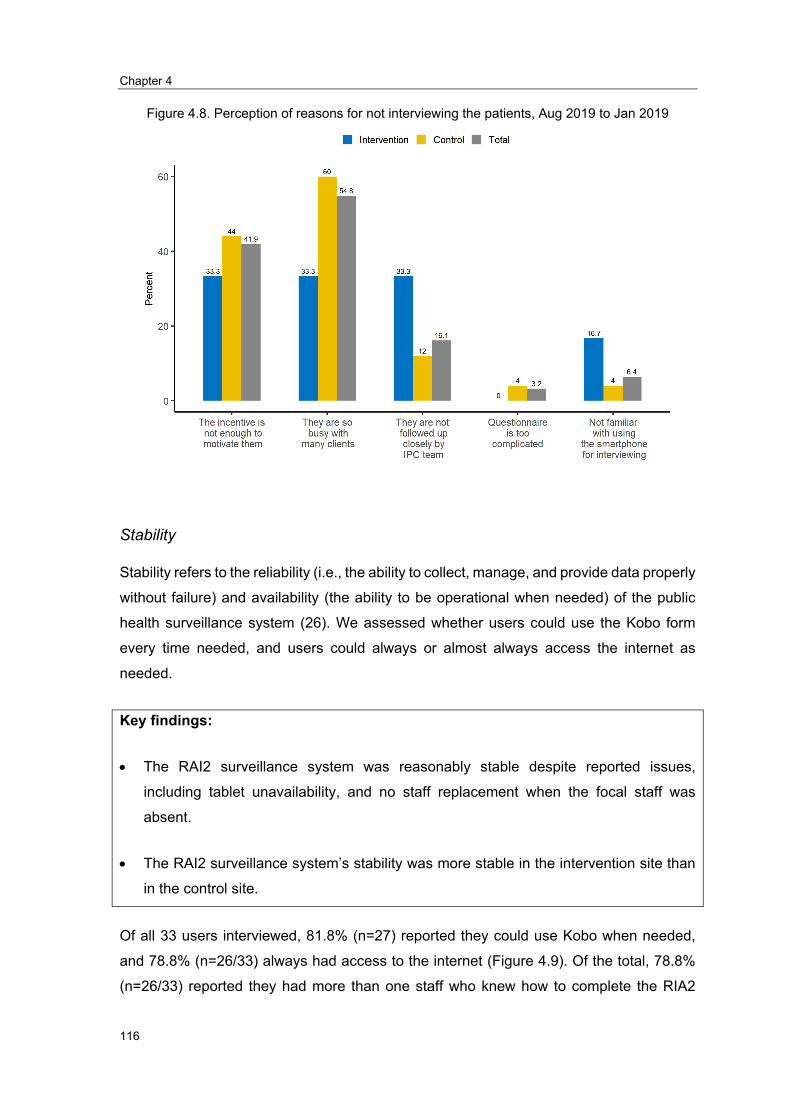
Chapter 4
116
Figure 4.8. Perception of reasons for not interviewing the patients, Aug 2019 to Jan 2019
Stability
Stability refers to the reliability (i.e., the ability to collect, manage, and provide data properly
without failure) and availability (the ability to be operational when needed) of the public
health surveillance system (26). We assessed whether users could use the Kobo form
every time needed, and users could always or almost always access the internet as
needed.
Key findings:
• The RAI2 surveillance system was reasonably stable despite reported issues,
including tablet unavailability, and no staff replacement when the focal staff was
absent.
• The RAI2 surveillance system’s stability was more stable in the intervention site than
in the control site.
Of all 33 users interviewed, 81.8% (n=27) reported they could use Kobo when needed,
and 78.8% (n=26/33) always had access to the internet (Figure 4.9). Of the total, 78.8%
(n=26/33) reported they had more than one staff who knew how to complete the RIA2
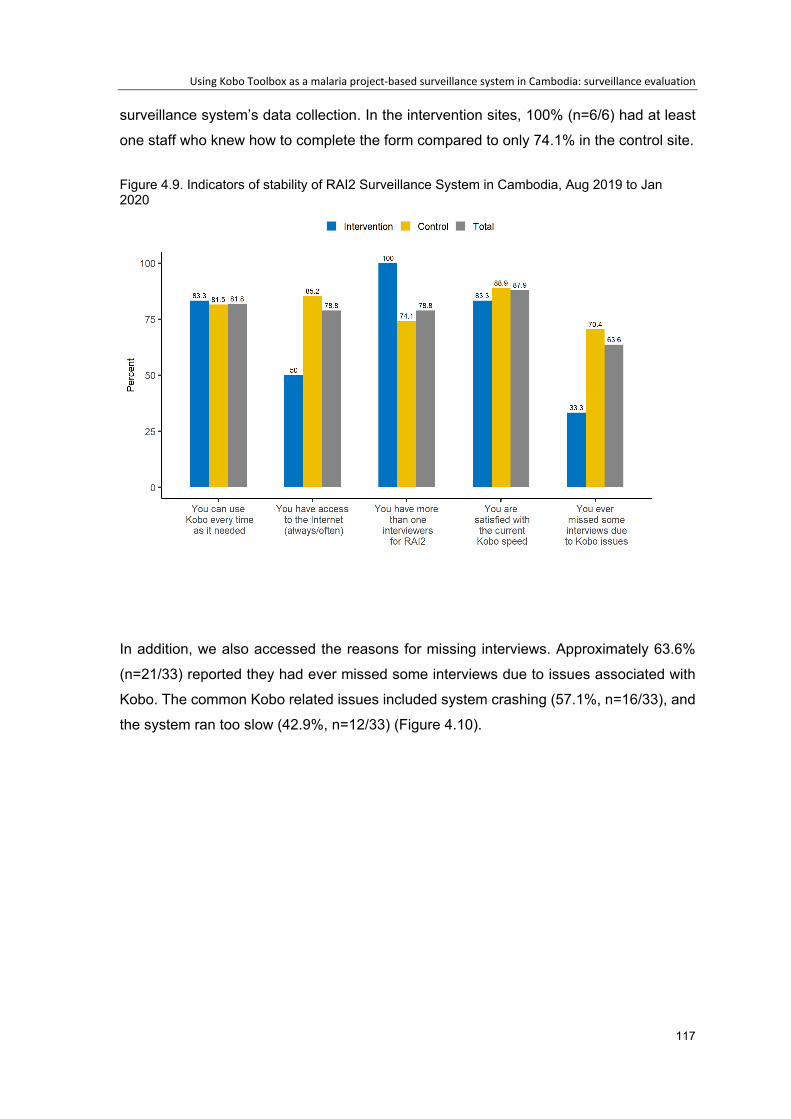
Using Kobo Toolbox as a malaria project-based surveillance system in Cambodia: surveillance evaluation
117
surveillance system’s data collection. In the intervention sites, 100% (n=6/6) had at least
one staff who knew how to complete the form compared to only 74.1% in the control site.
Figure 4.9. Indicators of stability of RAI2 Surveillance System in Cambodia, Aug 2019 to Jan 2020
In addition, we also accessed the reasons for missing interviews. Approximately 63.6%
(n=21/33) reported they had ever missed some interviews due to issues associated with
Kobo. The common Kobo related issues included system crashing (57.1%, n=16/33), and
the system ran too slow (42.9%, n=12/33) (Figure 4.10).

Chapter 4
118
Figure 4.10.Commonly identified issues with the use of Kobo Toolbox for data capture in a project-based surveillance system s, Aug 2019 to Jan 2020
Sensitivity
In this evaluation, sensitivity was defined as the proportion of malaria patients registered
in the health center’s log-book and notified in the RAI2 surveillance system. The sensitivity
equals A/(A+B) where A was the malaria cases in the health center log-book notified to
the RAI2 surveillance system, B was the malaria cases in the health center’s log-book
which were not notified to the RAI2 surveillance system.
Key findings:
• The sensitivity of the RAI2 surveillance system was low.
Overall, the sensitivity was 62.3% (n=599/961) between September 2019 and January
2020 (Table 4.8). The sensitivity was similar in the intervention and the control site (64.2%
vs. 62.2%, respectively).
25.0
10.7
57.1
42.9
33.3 33.3 33.3
50.0
22.7
4.6
63.6
40.9
0.0
10.0
20.0
30.0
40.0
50.0
60.0
70.0
No battery No phone with you Crash Slow
Perc
ent
Total Intervention Control

Using Kobo Toolbox as a malaria project-based surveillance system in Cambodia: surveillance evaluation
119
Table 4.8. The proportion of malaria patients entered into the RAI2 surveillance system among total cases reported at the health center, Sep 2019 – Jan 2020
Malaria cases in health centers’ log-book Total Intervention Control
Number of cases notified to the RAI2 Surveillance System (A)
599 43 556
Number of cases not notified to the RAI2 Surveillance System (B)
362 24 338
Sensitivity (A/ (A+B)) 62.3% 64.2% 62.2%
Overall, the sensitivity improved over time from 44.3% in September 2019 to 82.0% in
November 2019 but dropped to 58.2% in December 2019 and 48.7% in January 2020
(Figure 4.11).
Figure 4.11. The proportion of malaria patients entered into the RAI2 surveillance system among total cases reported at the health center by month, September 2019- January 2020
Positive predictive value
Under the RAI2 surveillance system, six intervention health centers were asked to use
dried blood spots to collect additional blood for Polymerase Chain Reaction (PCR) to
identify Plasmodium strain and treatment failure. Taking this opportunity, we used data
from these six health centers to estimate the Positive predictive value (PPV). The PPV
equals A/A+B+C, where A is confirmed cases by PCR, B is the negative case by PCR,
and C is positive for other species.
Key findings:
Chapter 4
120
• The positive predictive value was noticeably 100% for P. falciparum and 100% for P.
vivax. However, the finding was highly unreliable due to the small sample size.
As shown in Table 4.9, nine patients tested positive for P. falciparum by RDT at
intervention health centers. Of these, 100.0% (n=9/9) were confirmed having P. falciparum
by PCR. However, two of nine were also detected positive for both P. falciparum and
P.vivax. From the same health centers, 25 patients tested positive for P. vivax, of which
100.0% (n=25/25) were confirmed to have P. vivax by PCR, and four of them (4/25) were
also positive for both P. falciparum and P.vivax. RDT is likely to have limited ability to
correctly capture the species when a patient has mixed Plasmodium. We recommend
exercising caution in interpreting these findings due to the small sample size.
Table 4.9. Positive Predictive Value (PPV) of the RAI2 surveillance system, at the six intervention health centers, Cambodia, September 2019 to January 2020.
Total (A+B +C)
P. falciparum by PCR (A)
P.vivax byPCR (B)
Mixed by PCR (C)
PPV A/ (A+B+C)
P. falciparum notifiedto the RAI2surveillance system
9 7 0 2 100.0.0%
P. vivax notified to theRAI2 SurveillanceSystem
25 0 21 4 100.0%
Timeliness
In our context, we considered data collection and reporting timely if the month of the
interview and month of form submission was the same. Of all forms uploaded through the
RAI2 surveillance system, 87.7% (n=671/765) were submitted on time; 93.3% (n=111/119)
in intervention site, and 86.7% (n= 560/646) in control site.
Data quality
In this evaluation, we achieved 100% data completeness for all variables due to the force-
to-answer option. All users (33/33) rated the quality of data they interviewed as very high;
however, as this was self-reported, the rating may be affected by social desirability bias.
To have a true data quality assessment, a validation of the interview data would be
necessary. However, this was beyond the scope of this study.

Using Kobo Toolbox as a malaria project-based surveillance system in Cambodia: surveillance evaluation
121
Usefulness
In our evaluation, usefulness was referred to as whether or not the RAI2 surveillance
system could be used to evaluate the effectiveness of the RAI2 intervention. As
conceptualized in Figure 4.12, the trends of malaria cases detected by the RAI2
surveillance system in the intervention site were compared with the trends of malaria cases
detected by the RAI2 surveillance system in the control site. This concept is known as
difference-in-difference analysis (27).
Figure 4.12: Concept of evaluating intervention effectiveness using difference-in-difference analysis
Key findings:
• The RAI2 surveillance system cannot be used to evaluate the intervention’s
effectiveness without assistance from data of the health center, village malaria
workers, and mobile malaria workers.
A surveillance system’s usefulness depends heavily on high and similar sensitivity
between intervention and control site. During the surveillance evaluation period
(September 2019 and January 2020), when comparing malaria incidence trends by month,
the RAI2 surveillance system’s sensitivity was not stable in the intervention site. The
unstable sensitivity affected the ability to compare malaria incidence trends between the

Chapter 4
122
intervention and control sites. It was unable to use RAI2 surveillance system data on its
own. To investigate the validity of RAI2 surveillance data in evaluating RAI2 intervention’s
effectiveness, we compared the trends between three data sources: RAI2 only, health
center only, and health center data combined with data collected by village malaria
workers and mobile malaria workers (Figure 4.13). The data source combining health
center data with data collected by village malaria workers and mobile malaria workers was
the most comprehensive data, which we considered to be a gold standard for comparison.
In the control site, we found trends were similar irrespective of the data source.
Figure 4.13: Comparing malaria incidence trends between three data sources, September 2019 and January 2020
Although the main objective of the RAI2 surveillance system was not met, its data can be
partially useful to describe the characteristics of malaria patients. One of the most
important additions in the RAI2 surveillance system was information about exposure to
forests among malaria patients. We recommend that this information should be integrated
into the national MIS. This evaluation has shown that the questions were simple and
acceptable to the health center staff. This additional information could increase the
national malaria system’s ability to monitor or evaluate malaria interventions’ impact on a
large scale.
Using Kobo Toolbox as a malaria project-based surveillance system in Cambodia: surveillance evaluation
123
Discussion
The literature review embedded in this RAI2 surveillance evaluation highlights that national
surveillance data can be useful in evaluating an intervention’s impact, however, the
surveillance system alone does not collect all the information needed. Additional data
sources are often needed in some contexts, such as socioeconomic status, entomological
factor, rainfall, and temperature, to interpret their intervention impact (10, 12-18).
Our evaluation suggested that the RAI2 surveillance system was simple, flexible, stable,
and timely; however, it did not meet its primary objective in evaluating the effectiveness of
the RAI2 intervention. One attribute of the RAI2 surveillance system-- low sensitivity--
outweighs other positive attributes. During the evaluation period, only 43% of malaria
cases reported by all selected health centers were detected by health centers, while
VMWs and MMWs detected a larger proportion. Of those detected by selected health
centers, only 62% were interviewed. The intervention site where six health centers were
chosen reported few cases per month. The trends in the intervention site were affected
when one or two interviews were missing. In addressing this issue, a possible solution is
using the number of malaria cases from the health center log-books combined with data
from village malaria workers and mobile malaria workers.
Attributes of surveillance systems affect each other. In our evaluation, the low acceptability
of the RAI2 surveillance system amongst staff, may play a significant role in low sensitivity.
The system’s acceptability was low due to the overall consensus that the financial
incentive provided was not considered sufficient for the additional work required. To
increase the system’s acceptability, health center staff could be motivated by both
monetary and non-monetary incentives. On monetary incentives, increasing the incentive
per interview is likely to increase participation and result in more reliable data. For short
term participation, this may be appropriate, however, is not a sustainable way to run a
surveillance system. On non-monetary incentives, for long-term surveillance, having a
regular meeting (e.g., every three months) for discussion of implementation issues and
support needed, refresher training, and providing additional skills needed (e.g., basic
epidemiology, basic data cleaning, and analysis) may be helpful. Improving understanding
about why the data is collected and how is it used, often helps participating staff to
understand why the data needs to be clean and complete.
Another important aspect of surveillance is data quality. The RAI2 surveillance system
performed well in terms of data completeness and PPV, however, the presence of
Chapter 4
124
information bias could not be ruled out. On the data completeness, all variables were
reported 100%. This achievement may be from a result of the force-to-answer logic using
the electronic form. With respect to the PPV, all patients with P. falciparum or P.vivax were
100% confirmed by PCR. During our evaluation period, Cambodia used the RDT, namely
“One Step Malaria HRP2/pLDH (P.f/P.v) Test,” which was in the WHO recommendation
list in 2018 (28). According to the latest WHO’s annual RDT performance evaluation, the
“One Step Malaria HRP2/pLDH (P.f/P.v) Test” had <5% false-positive rate at 200
parasites/μL, meaning the PPV is ≥95% (28). Our PPV rate may be overestimated due to
the relatively small sample size. With respect to the risk associated with information bias,
it was not in the scope of our evaluation to explore this further. There was a possibility that
interviewees gave interviewers wrong information for social desirability (e.g., whether they
visited forest for unapproved activities), to avoid risk of legal ramifications. Another
possibility is that interviewers may incorrectly record the interviewees’ information due to
misunderstanding the answer or human error.
Besides the low sensitivity impacting the RAI2 surveillance system’s ability to evaluate the
RAI2 intervention, the system was not designed to capture other interventions affecting
the malaria incidence trends. In assessing the effectiveness of the RAI2 intervention, the
most significant assumption is that malaria incidence trends in control and intervention
sites would be parallel if the intervention sites had been an absence of RAI2 intervention.
Identifying other interventions that provide services in the forest or near the forest in the
control site is critical, but it was out of RAI2 surveillance scope. From our informal
interaction with all selected health centers, NGOs, and provincial health departments, we
learned that intervention and control sites also have interventions providing services inside
the forest or near the forest. MMWs target forest goers; MMWs, spend eight days per
month inside forests or two days per week to seek as many forest goers as inside or near
the forests for providing malaria testing and treatment. In addition, radical cure which
prevents P. vivax patients from relapsing has been being implemented in two control
provinces -- fully implemented in Kampong Speu and partially implemented (four health
centers only) in Pursat since early 2019. Such information is useful to interpret the
intervention impact evaluation. To increase the usefulness of a surveillance system aimed
at evaluating an intervention impact, setting up a plan to collect information on potential
factors impacting the disease trends should be a useful aspect.
Furthermore, the RAI2 surveillance system did not capture pre-intervention data requiring
for the difference-in-difference (DID) technique used to evaluate RAI2 intervention’s

Using Kobo Toolbox as a malaria project-based surveillance system in Cambodia: surveillance evaluation
125
effectiveness requires pre-intervention data (27). DID is a quasi-experimental design to
estimate the causal effects of an intervention or treatment in an intervention site compared
to a control site (27). It assumes that a disease’s trends are not different in the absence of
intervention or treatment (27). DID requires pre- and post-intervention data in the
intervention and control group (27). DID’s strengths are easy to interpret, can estimate the
causal effects using observation data (surveillance data or cross-sectional survey data),
the comparison group can start at a different level of outcome, and accounting for other
non-intervention effects. The weakness is the pre-intervention data requirement in the
intervention and control site, which is usually hard to obtain. It cannot be used if the trends
are not stable or different, even without intervention.
Conclusion
Due to unstable sensitivity in the intervention site, we could not solely rely on the RAI2
surveillance system’s data to evaluate the intervention’s effectiveness. RAI2 surveillance
data were found to be partially useful in describing the characteristics of patients testing
positive for malaria and reporting risk factors such as exposure to forest.
Recommendation
We recommend that:
The RAI2 surveillance system should be integrated into the national MIS. While there
are overlapping variables between RAI2 form and MIS form, we can remove a large
part of RAI2. Only several important variables related to forest exposure of RAI2 should
be added to the MIS form.
MIS should be moved to be a real-time data collection, add more exposure variables,
and set up an alert system to the district and provincial level if the malaria trends are
higher than the defined normal trends to increase its usefulness. MIS is already a case-
based system, however is not timely due to the delay for at least one month to make
data available at the central level, it is also missing key exposure variables. Building
on current progress, moving MIS to real-time is possible and the benefits is significant.
To motivate staff, staff should receive regular meetings (e.g., every three months) for
discussion of implementation issues and support needed, refresher training, and
providing additional skills needed (e.g., basic epidemiology, basic data cleaning, and
analysis).

Chapter 4
126

Using Kobo Toolbox as a malaria project-based surveillance system in Cambodia: surveillance evaluation
127
Reference
1. WHO. World Malaria Report. Geneva: World Health Organization; 2018.
2. WHO. World Malaria Report. Geneva: World Health Organization; 2019.
3. U.S. Centers for Disease Control and Prevention (U.S CDC). Malaria: U.S CDC; 2019 [cited2020. Available from: https://www.cdc.gov/malaria/about/disease.html.
4. Causes of Death [Internet]. Our World in Data. 2017 [cited 25 September 2020].Available from: https://ourworldindata.org/causes-of-death.
5. The top 10 causes of death [Internet]. WHO. 2016 [cited 26 September 2020]. Availablefrom: https://www.who.int/news-room/fact-sheets/detail/the-top-10-causes-of-death.
6. World Population [Internet]. Worldometer. 2020 [cited 25 September 2020]. Availablefrom: https://www.worldometers.info/world-population/.
7. World Health Organization (WHO). Global technical strategy for malaria 2016–2030.WHO; 2015.
8. World Health Organization (WHO). Malaria surveillance, monitoring & evaluation: Areference manual. Geneva, Switzerland: WHO; 2018.
9. Schardt C, Adams MB, Owens T, Keitz S, Fontelo P. Utilization of the PICO framework toimprove searching PubMed for clinical questions. BMC Medical Informatics and DecisionMaking. 2007;7(1):16.
10. Aregawi M, Lynch M, Bekele W, Kebede H, Jima D, Taffese HS, et al. Time series analysisof trends in malaria cases and deaths at hospitals and the effect of antimalarial interventions,2001-2011, Ethiopia. PloS one. 2014;9(11):e106359.
11. Comfort AB, van Dijk JH, Mharakurwa S, Stillman K, Gabert R, Korde S, et al.Hospitalizations and costs incurred at the facility level after scale-up of malaria control: pre-postcomparisons from two hospitals in Zambia. The American journal of tropical medicine andhygiene. 2014;90(1):20-32.
12. Cissé B, Ba EH, Sokhna C, JL ND, Gomis JF, Dial Y, et al. Effectiveness of Seasonal MalariaChemoprevention in Children under Ten Years of Age in Senegal: A Stepped-Wedge Cluster-Randomised Trial. PLoS medicine. 2016;13(11):e1002175.
13. Katureebe A, Zinszer K, Arinaitwe E, Rek J, Kakande E, Charland K, et al. Measures ofMalaria Burden after Long-Lasting Insecticidal Net Distribution and Indoor Residual Spraying atThree Sites in Uganda: A Prospective Observational Study. PLoS medicine.2016;13(11):e1002167.
14. Aregawi M, Malm KL, Wahjib M, Kofi O, Allotey NK, Yaw PN, et al. Effect of anti-malarialinterventions on trends of malaria cases, hospital admissions and deaths, 2005-2015, Ghana.Malar J. 2017;16(1):177.
Chapter 4
128
15. Ssempiira J, Kissa J, Nambuusi B, Kyozira C, Rutazaana D, Mukooyo E, et al. The effect ofcase management and vector-control interventions on space-time patterns of malaria incidencein Uganda. Malar J. 2018;17(1):162.
16. Kenangalem E, Poespoprodjo JR, Douglas NM, Burdam FH, Gdeumana K, Chalfein F, et al.Malaria morbidity and mortality following introduction of a universal policy of artemisinin-basedtreatment for malaria in Papua, Indonesia: A longitudinal surveillance study. PLoS medicine.2019;16(5):e1002815.
17. Lechthaler F, Matthys B, Lechthaler-Felber G, Likwela JL, Mavoko HM, Rika JM, et al.Trends in reported malaria cases and the effects of malaria control in the Democratic Republic ofthe Congo. PloS one. 2019;14(7):e0219853.
18. Tugume A, Muneza F, Oporia F, Kiconco A, Kihembo C, Kisakye AN, et al. Effects andfactors associated with indoor residual spraying with Actellic 300 CS on malaria morbidity in LiraDistrict, Northern Uganda. Malar J. 2019;18(1):44.
19. Siv S, Roca-Feltrer A, Vinjamuri SB, Bouth DM, Lek D, Rashid MA, et al. Plasmodium vivaxMalaria in Cambodia. The American journal of tropical medicine and hygiene. 2016;95(6Suppl):97-107.
20. National Centre for Parasitology Entomology and Malaria Control (CNM). CambodiaMalaria Elimination Action Framework (2016-2020). Phnom Penh: CNM; 2016.
21. National Centre for Parasitology EaMCC. National Malaria Porgram Review. PhnomPenh: CNM; 2019.
22. Srean C, Patrice P, Tambri H, Vincent H. Malaria Incidence Trends and SpatiotemporalDistribution in Cambodia—Results from Nationwide Passive Surveillance Data, 2006-2018. In:Cambodia ANUaIPo, editor. 2019.
23. St. Laurent B, Oy K, Miller B, Gasteiger EB, Lee E, Sovannaroth S, et al. Cow-baited tentsare highly effective in sampling diverse Anopheles malaria vectors in Cambodia. Malar J.2016;15(1):440.
24. Maude RJ, Nguon C, Ly P, Bunkea T, Ngor P, Canavati de la Torre SE, et al. Spatial andtemporal epidemiology of clinical malaria in Cambodia 2004–2013. Malar J. 2014;13(1):385.
25. Sluydts V, Somony H, Coosemans M, Van Roey K, Gryseels C, Canier L, et al. Spatialclustering and risk factors of malaria infections in Ratanakiri Province, Cambodia. Malar J.2014;13:387.
26. US CDC. Updated Guidelines for Evaluating Public Health Surveillance SystemsWashington DC, USA: US Centre for Disease Control and Prevention; 2001 [cited 2019 7 Aug2019]. Available from: https://www.cdc.gov/mmwr/preview/mmwrhtml/rr5013a1.htm.
27. Wing C, Simon K, Bello-Gomez RA. Designing Difference in Difference Studies: BestPractices for Public Health Policy Research. Annual Review of Public Health. 2018;39(1):453-69.
28. World Health Organization (WHO). Malaria Rapid Diagnostic Test Performance. 2018.

Using Kobo Toolbox as a malaria project-based surveillance system in Cambodia: surveillance evaluation
129
Annex 1: Quantitative questionnaire
Code Question Answer Skip Section 1: Simplicity Q1 How simple is the questionnaire in
Kobo to understand? 1. Very simple2. simple3. Not simple or difficult4. Difficult5. Very difficult
Q2 How familiar with using a tablet or smartphone are you?
1. Very familiar2. Familiar3. Unfamiliar5. Very unfamiliar
Q3 How confident are you on how to use, save, and submit the completed form in Kobo?
1. Very confident2. Confident3. Not confident5. Not confident at all
Q4 How confident are you on how to install Kobo and download the form for a new device?
1. Very confident2. Confident3. Not confident5. Not confident at all
Q5 Do you have enough time to do the interview when they have malaria patients?
1. Yes, always2. Often3. Sometimes4. Rarely5. Never
Q6 Do you get Kobo-related technical support as needed?
1. Yes, always2. Often3. Sometimes4. Rarely5. Never
Section 2: Flexibility Q7 Do you use a tablet or smartphone for
interviewing? Tablet Phone Both
Q8 How many devices which Kobo have been stalled in your health center?
Number of device___________
Q9 Do you have a paper-based questionnaire available in your health center?
Yes No
Q10 Do you think you can use the paper-based questionnaire or Kobo as you prefer?
Yes No
Section 3: Acceptability Q11 Do you think Kobo is an appropriate
platform to be used by health center staff?
1. Yes2. No9. Don’t know
Q12 Is the incentive of 2-USD per interview is appropriate?
1. Yes2. No9. Don’t know
For control site only
Q13 Is the incentive of 3.5 USD appropriate?
1. Yes2. No9. Don’t know
For intervention site only
Q14 If you can decide on an incentive, how much would you give per interview? ……………..USD

Chapter 4
130
Q15 Does the head of the health center allow you to spend time interviewing the malaria patient for the RAI2 surveillance system?
1. Yes2. No9. Don’t know
Only staff
Q16 Do you think other staff willing to help with interviews when you are on leave?
1. Yes2. No
Q17 Some staff at other health centers did not do an interview for us, may you think what might be the reasons? (multiple answers possible)
1. The incentive is not enoughto motivate them.
2. They are so busy with manyclients.
3. Their boss does not allow4. They are not followed up
closely by the IPC team.5. The questionnaire is too
complicated.6. It is a waste of time to do
dried blood spots.7. Not familiar with using the
smartphone for interviewing8. Other(specify)_________
Section 4: Stability Q18 Can you use Kobo every time as
needed? 1. Yes2. No
19 Do you have access to the internet when you need it?
1. Always2. Often3. Sometimes4. Rarely5. Never
Q20 Do you have more than one staff at your HC who can do an interview for RAI2 surveillance?
1. Yes2. No
Q21 Are you satisfied with the current Kobo speed when you open the form?
1. Very satisfied2. Satisfied3. Not satisfied4. Not satisfied at all
Q22 Have you ever missed some interviews due to Kobo does not work well?
1. Yes2. No
Q23 If yes, what was the main reason? 1. No battery2. No phone with you3. Crash4. Lost records5. Slow6. Other_______-
Q24 What is your opinion on the data quality collected by you?
1. Very high quality2. Ok quality3. I don’t know4. Poor quality5. Very poor quality
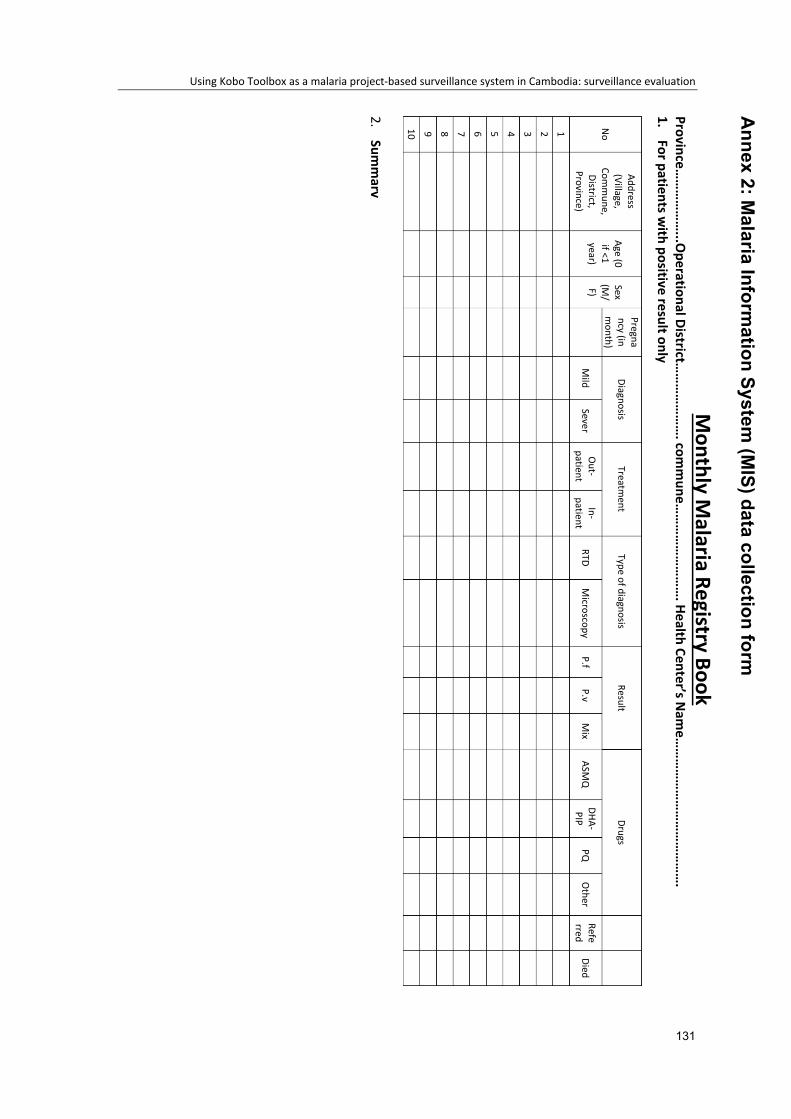
Using Kobo Toolbox as a malaria project-based surveillance system in Cambodia: surveillance evaluation
131
Annex 2: M
alaria Information System
(MIS) data collection form
Monthly M
alaria Registry Book Province…
……
……
…...O
perational District……
……
……
…. com
mune…
……
……
……
……
. Health Center’s Nam
e……
……
……
……
……
……
……
. 1.
For patients with positive result only
No
Address (Village,
Comm
une, District,
Province)
Age (0 if <1 year)
Sex (M
/F)
Pregnancy (in m
onth) Diagnosis
Treatment
Type of diagnosis Result
Drugs
Mild
Sever O
ut-patient
In-patient
RTD M
icroscopy P.f
P.v M
ix ASM
Q
DHA-PIP
PQ
Other
Referred
Died
1 2 3 4 5 6 7 8 9 10
2.Sum
mary

Chapter 4
132
133
Chapter 5 : Coronavirus Disease 2019 asymptomatic transmission: A cluster review in Cambodia, 2020

Chapter 5
134
(This page has been intentionally left blank)

Coronavirus Disease 2019 asymptomatic transmission: A cluster review in Cambodia, 2020
135
Prologue
Rationale
This chapter presents my fourth core competency of the MAE program—epidemiology
project—and a summary for layperson included in annex 1.
In meeting this core competency, I reviewed a Coronavirus Disease 2019 (COVID-19)
cluster of returned travelers to understand how asymptomatic transmission occurred. I
used data provided by the Cambodian Communicable Disease Control Department
(CCDC) collected during the contact tracing process and additional information, which I
later collected through a phone interview with former COVID-19 patients. The study
received ethical approval from the National Ethics Committee for Health Research
(NECHR) in Cambodia and the Human Research Ethics Committee (HREC) of Australian
National University, in Australia.
I chose to use COVID-19 data for my epidemiology project because of my four-month
involvement with COVID-19 response in Cambodia. Roles
Specifically, for this study, I conducted the following roles.
1 Identified a research question
2 Facilitated discussions with the CCDC and its partners about using existing data
3 Designed the study, wrote the research protocol, and managed the approval process
for the National Ethics Committee for Health Research (NECHR) in Cambodia and the
Human Research Ethics Committee (HREC) of Australian National University in
Australia.
4 Designed the questionnaire and interviewed the selected COVID-19 cases for
additional information
5 Performed quantitative and qualitative data analysis and interpretation of findings
6 Wrote a report and a summary for lay audiences (the general public)
Lessons Learnt
I learned several lessons from my role in the study.
Chapter 5
136
1. A study with a small sample size of 22 can be enhanced with the collection of
qualitative information. In an applied epidemiology career, we may need to present
findings from a study with a small sample size making it difficult to generalize or make
statistical inference. By including qualitative information, we can contextualize the
findings. In my case, I used a combination of existing data collected during the contact
tracing process, contact tracer’s notes, and qualitative interviews.
2. Conducting phone-interviews months after COVID-19 patients were released from
isolation is not ideal. I noticed some participants did not trust me even though I followed
all the informed consent processes. Some individuals reported having had a bad
experience as a result of their photos and personal information having been shared
widely on social media. Some participants did not want to hear or talk about COVID-
19. I only received short answers from some of them, they were still in pain with what
happened, I could not get more details as it was not ethical to try to push for more
information when they were hesitant. This highlighted the sensitivities that need to be
considered in conducting interviews and the importance of ethical practice in research.
3. Study results should be produced as quickly as possible for better use. In my case, I
delayed several months. In the beginning, I doubted whether or not I could use data
from a COVID-19 cluster with just more than 20 primary cases for my epidemiology
project. After clarification with supervisors, I submitted a protocol for expedited review
to both Cambodia’s and Australian National University’s ethical committee. Both
committees transferred my protocol to full-board review, which took two months to get
approval. After approval, I was unable to commence the study immediately as I was
distracted by other tasks. Finally, I produced results eight months after the event
occurred. The findings are still useful, however, they may have been more useful if I
could have released my findings a month or two months after the event occurred.
4. People may underestimate the severity of psychological impact of COVID-19 on
patients and their family members. In responding to the spread of SARS-CoV-2, it is
hard to balance between keeping privacy for a patient and the risk of SARS-CoV-2 in
the community. The communities should be informed as quickly as possible so that
they can implement or strengthen prevention measures. During the contact tracing in
Cambodia, the contact tracers always disclose the personal information of a COVID-
19 case to people in the community to assess the risk of SARS-CoV-2 infection if they
have exposed to the identified cases. Due to the fear of COVID-19 transmission, the
whole community socially disconnected themselves from the entire family of a COVID-

Coronavirus Disease 2019 asymptomatic transmission: A cluster review in Cambodia, 2020
137
19 case despite the laboratory results suggesting that some family members were
SARS-CoV-2 negative. At least two out of 12 families I interviewed relocated their
whole family to another city. The main reason was the economic reason as they could
not pursue their business in their community. It was also too painful when they saw
their children were prevented from playing with other kids as they used to. Learning
from this, I think both psychological and financial support should be included in the
COVID-19 response. Education aimed at reducing stigma on former COVID-19
patients and family should be considered as well. This may reflect that a role of
epidemiologists may not only advise on control measures focusing focused on social
distancing, hygiene, stay at home messaging, but other aspects such as the
psychological aspects and stigmatization should also be mentioned by
epidemiologists.
Public Health Impact
Although the information was not released as quickly as possible, it was still useful to
understand how asymptomatic transmission may occur, contributing to local policy design.
The local evidence that people without any symptoms can be a COVID-19 case and
transmit the virus is useful information that can be used to communicate with the public.
Such information may lead to better self-prevention in the community.
Acknowledgments
I earnestly express gratitude toward Dr. Ly Sovann, Director of CCDC, for allowing me to
join the response team and use CCDC to fulfil my MAE epidemiology competency.
Profound thanks to all contact tracers for collecting information and the former COVID-19
patients for providing information during the contact tracing process and response to my
phone-interviews.
I gratefully thank all my supervisors—Patrice Piola, Tambri Housen, Vincent Herbreteau,
and Amy Parry – for their kindness and helpful comments during since study design stage
to the report writing. You spent your valuable time to support me since the beginning.
Chapter 5
138
Abstract
Background: Since the global spread of Severe Acute Respiratory Syndrome Coronavirus
2 (SARS-Cov-2) was declared a pandemic, the role that asymptomatic transmission has
played in fueling the pandemic not fully understood. Our study aimed to measure the
proportion of asymptomatic cases and describe the transmission from asymptomatic
primary cases to their contacts.
Methods: We undertook a secondary data analysis and qualitative exploratory study of a
cluster of COVID-19 in returned travelers from a religious event (28 February to 2 March
2020) in a Southeast Asian country. We defined a COVID-19 case as a person who tested
positive for SARS-CoV-2 by Real-time reverse transcription-polymerase chain reaction
(rRT-PCR) and interviewed them with a standard questionnaire to identify their contacts.
Identified contacts were categorized by risk and followed up for 14 days.
Results: The cluster of returned travelers had 22 primary cases (infected outside
Cambodia), ten secondary cases (infected contacts in Cambodia), and 491 uninfected
contacts. Of the 22 primary cases, 63.6% (n=14/22) were asymptomatic. Ten secondary
cases out of the 501 contacts tested positive for SARS-CoV-2, giving the secondary attack
rate (SAR) of 2.0%. The SAR in high-risk contacts was (5.9%, n=8/136), 1.2% (n=1/86) in
medium-risk contacts and 0.4% (n=1/279) in low-risk contacts. A non-statistically higher
SAR was observed in household contacts than in non-household contacts (3.4%, n=4/118
vs. 1.7%, n=1/60, P-value=0.256). In household, contacts the SAR in spouses was 18.8%
(n=3/16), 1.7% (n=1/60) in children, and 0.0% (n=0/42) in other relatives (P-value=0.008).
Of non-household contacts, a higher SAR of 4.0% (n=1/25) was observed in co-travelers
with a primary case and 3.3% (n=5/153) in people praying in a mosque with a case. Overall
SAR and stratified SAR among contacts exposed to asymptomatic and symptomatic
primary cases were not statically different.
Conclusion: In this study, asymptomatic cases were shown to transmit SARS-CoV-2 to
their contacts. Our study found no statistically different infectivity among contacts exposed
to asymptomatic and symptomatic primary cases. A response to contain and mitigate
COVID-19 spread must take into account asymptomatic transmission.
Coronavirus Disease 2019 asymptomatic transmission: A cluster review in Cambodia, 2020
139
Abbreviation
CCDC Cambodia Communicable Disease Control Department
COVID-19 Coronavirus Disease 2019
CRF Case Report Forms
HREC Human Research Ethics Committee
MoH Ministry of Health
NECHR National Ethics Committee for Health Research
rRT-PCR Real-time reverse transcription-polymerase chain reaction
SAR Secondary attack rate
SARS-Cov-2 Severe Acute Respiratory Syndrome Coronavirus 2

Chapter 5
140
Introduction
A novel coronavirus was identified in Wuhan, Hubei Province, China, in December 2019.
This virus was named Severe Acute Respiratory Syndrome Coronavirus 2 (SARS-CoV-
2); the disease caused by this virus was named coronavirus disease 2019 (COVID-19).
SARS-CoV-2 spreads from human-to-human through droplets, close contacts, and
aerosol (1). The global spread of SARS-CoV-2 was declared as a pandemic by the World
Health Organization (WHO) on 11 March 2020 (1). By 15 December 2020, 70 million
people were reported to have tested positive for COVID-19 internationally, and 1.6 million
people had died, giving a crude case fatality rate of 2.3% (2). These cases and deaths
were reported by 222 countries territories. Three countries made up more than 46% of
total cases, including the United States (23.0%), Brazil (13.4%), and India (9.5%) (2). The
fatality rate was disproportionate across contexts, ranging from 1.5% in WHO Southeast
Asia Region (SEARO) to 2.6% in the Pan American Health Organization (PAHO)(2). The
high case fatality rate occurred mostly in high-income settings (3). The fatality rate in a
country is directly affected by how quickly the number of cases exceeded the healthcare
system’s capacity, population’s age distribution, and population’s prevalence of chronic
medical conditions such as diabetes, heart disease, obesity, cancer, and kidney disease
(3-8). Studies suggest that the risk of dying is elevated among males, individuals aged 60
or older, and people with chronic medical conditions (3-8).
Without vaccine availability (at the time of the study), non-medical approaches known as
containment and mitigation strategies have been used to reduce transmission. The
containment strategy is to minimize the transmission from infected individuals to non-
infected individuals to stop widespread transmission in the population (9). Containment
strategies have included the isolation of the cases and the testing and quarantining of
close contacts (9). The mitigation strategy is focused on slowing down the spread of the
virus and reducing the demand on the healthcare system (9). Mitigation strategies have
included social distancing, society lock-down, and improved personal and environmental
hygiene (9). Mathematical modeling of the effectiveness of containment and mitigation
strategies, suggested that containment and mitigation strategies’ success may be
associated with the timeliness of implementation of the containment measure, high
temperatures, low population density, younger population, and the country’s high health
security index (10).
In Southeast Asia, as of 16 December 2020, 11 nations experienced a varied burden of
COVID-19 incidence ranging from six cases per million population in Laos to 10,404 per
Coronavirus Disease 2019 asymptomatic transmission: A cluster review in Cambodia, 2020
141
million population in Singapore, while the world rate was 9,632 per million population (11).
After Singapore, the high incidence rate in our region was observed in the Philippines
(4,352/million), followed by Malaysia (2,911/million), Indonesia (2,426/million), and
Myanmar (2,140/million) (11). The lowest COVID-19 incidence rate in Southeast Asia was
detected in four out of five countries in Greater Mekong Sub-region (11). While Laos had
the lowest incidence rate (6/million) and Myanmar had the highest incidence rate
(2,140/million) in this region, low incidence rates were observed in Vietnam (15/million),
Cambodia (23/million), and Thailand (62/million) (11). The reasons these countries had a
low incidence rate is not fully understood. Myanmar, which had the highest incidence rate
share similar characteristics to its neighbors-- greeting culture, population density,
transportation infrastructure, climate, and response strategy.
Cambodia, a lower-middle-income country, is ranked 89th out of 195 in the 2019 Global
Health Security Index. The index reflects the rank of Cambodia’s capacity to respond to
health emergencies compared to other nations. Although the country’s capacity was not
high, the country did not experience COVID-19 community transmission until the 28th of
November 2020. Cambodia reported 362 confirmed cases as of 15 December 2020 (12,
13). Of these cases, 88.7% were overseas acquired (12, 13). No deaths due to COVID-
19 have been reported, and by 15 December 2020, 318 out of 362 (88.1%) of COVID-19
cases were classified as recovered (12).
Like many other countries, COVID-19 is having a negative impact on Cambodia’s
economy. Public fear and the government’s actions, such as travel restriction, flight
disconnection, closure of all schools, and closure of all gathering sites to reduce
transmission, have had a detrimental impact on businesses and Cambodians’ quality of
life (14-18). In response, the government increased the health sector budget, while the
country’s income decreased (16).
The role asymptomatic transmission has had in fueling the pandemic is not fully
understood. Early data in China suggested almost all COVID-19 cases (98.4%) were
symptomatic (19). This may have misled initial control strategies and was further
influenced by the WHO’s early recommendation to screen only those who had symptoms.
From February 2020, studies began to suggest asymptomatic carriage of the virus was
possible and that asymptomatic carriers could transmit the disease to other people (20-
29). A true proportion and basic reproduction number (number of secondary cases infected
by a primary case) from asymptomatic cases are difficult to ascertain from the global or
country-level data due to the application of different case definitions, variations in testing,

Chapter 5
142
and control policies (29). Cluster investigations are a common study method for field
epidemiological investigations, many of which have been carried out during the COVID-
19 pandemic in order to further understand disease transmission. Of particular interest to
the scientific community has been increasing knowledge and evidence around the
asymptomatic transmission of the SARS-CoV-2. There is a need to add to the emerging
evidence to inform the development of evidence-based policy and practice to contain the
spread of COVID-19 (20-22).
Our study aimed to measure the proportion of asymptomatic cases and describe the
transmission from asymptomatic primary cases to their contacts.
Methods
Study Design
We conducted secondary data analysis and a qualitative exploratory study of a cluster of
COVID-19 cases in returned travelers.
Case definition and primary and secondary case detection
Case definition
A confirmed case was defined as an individual who tested positive for SARS-CoV-2 by
Real-time reverse transcription-polymerase chain reaction (rRT-PCR) [29, 30]. We
classified cases into two groups.
• Primary Case: A confirmed case who had traveled to a religious event in country x
between 28 and 2 March and tested positive for SARS-Cov-2 by PCR within 14
days of returning home.
• Secondary Case: A close contact of a Primary Case who subsequently tested
positive for the SARS-Cov-2 by PCR with no history of international travel one
month prior to testing positive.
Primary cases detection
The primary cases were detected using an event-based surveillance system 12-18 days
after returning home from a country in Southeast Asia (country x).

Coronavirus Disease 2019 asymptomatic transmission: A cluster review in Cambodia, 2020
143
A religious event was hosted between 28 February and 2 March 2020 in country x.
According to the religious leader in Cambodia, 79 Cambodians joined the event. These 79
people were from 10 provinces in Cambodia.
The testing for SARS-CoV-2 among this group started on 14 March 2020 after country x
reported a cluster of new COVID-19 cases linked to the religious event and similar reports
from other Southeast Asian countries through the International Health Regulations (IHR)
’s focal persons. Cambodia’s response team decided to test all 79 returned travelers,
27.8% (n=22) of them were confirmed positive for SARS-CoV-2. Figure 5.1 provides a
timeline of events related to this cluster. All individuals testing positive were required to
undergo isolation in hospital until such time as they were classified as no longer infectious.
Figure 5.1. Summary of events, 27 February-30 March 2020, in Cambodia
Abbreviation: MoH, Ministry of Health
During isolation, at that time, the interval of sample collection from the cases was every
three days if the result remained positive. If the result was negative, sample collection was
done again after 48 hours. Within this 48-hour interval, if the result was negative, the
patients were released from the isolation. However, if the result was positive again, the
patient would be re-tested within the three-day interval. A detail time interval of testing was
included in Figure 5.2 below.
Chapter 5
144
Secondary case detection
The secondary cases were detected during the contact tracing and quarantine process.
Contact tracing commenced within 24 hours after the primary cases were notified. The
contact tracing started by interviewing the confirmed primary cases to fill in the case report
form and trace their movement, we asked questions to identify where they had been, at
what time, and who they meet with in the past 14 days.
Our study included all contacts exposed to the primary cases since day one of arrival in
Cambodia. We considered this period as the potential infectious period, which may not
align with the available evidence (30).
The contacts were classified into three groups (Table 5.1). The first group, high-risk
contacts, were defined as contacts who stayed closer than two meters to the primary case
during their infectious period without protection for 30 minutes or with protection for one
hour or longer. High-risk contacts were quarantined at hospitals and tested for SARS-CoV-
2 within 24 hours after they were identified. All high-risk contacts were again tested for
SARS-CoV-2, 13 days after the last date of exposure to the primary case, in order to
receive the result on day 14 of their quarantine result was negative. All close contacts were
called daily and asked, “Do you have any symptoms such as fever, cough, sore throat,
runny nose, or difficulty breathing today?” for 14 days after the last date of exposure. If
high-risk contacts developed any symptoms during the quarantine period, they were tested
for SARS-CoV-2 on the day of follow up or the next day.
The second group, medium-risk contacts, were defined as contacts who stayed closer
than two meters to the primary case without protection for a period of time between 15 and
30 minutes or with protection for a period between 15 and 60 minutes, at any time during
the primary cases infectious period. All medium-risk contacts were quarantined at home
and also tested 24 hours after they were identified. They were not required to undergo a
repeat test on day 13 of quarantine, but they were called daily to check if they had
developed any symptoms and were tested if they reported any symptoms.
The third group, low-risk contacts, were defined as those who did not meet the definition
for a high-risk or medium-risk contact. Low-risk contacts were not tested, and their
movements were not restricted. However, they were also followed up for symptoms for 14
days. Symptom-based testing was also applied.
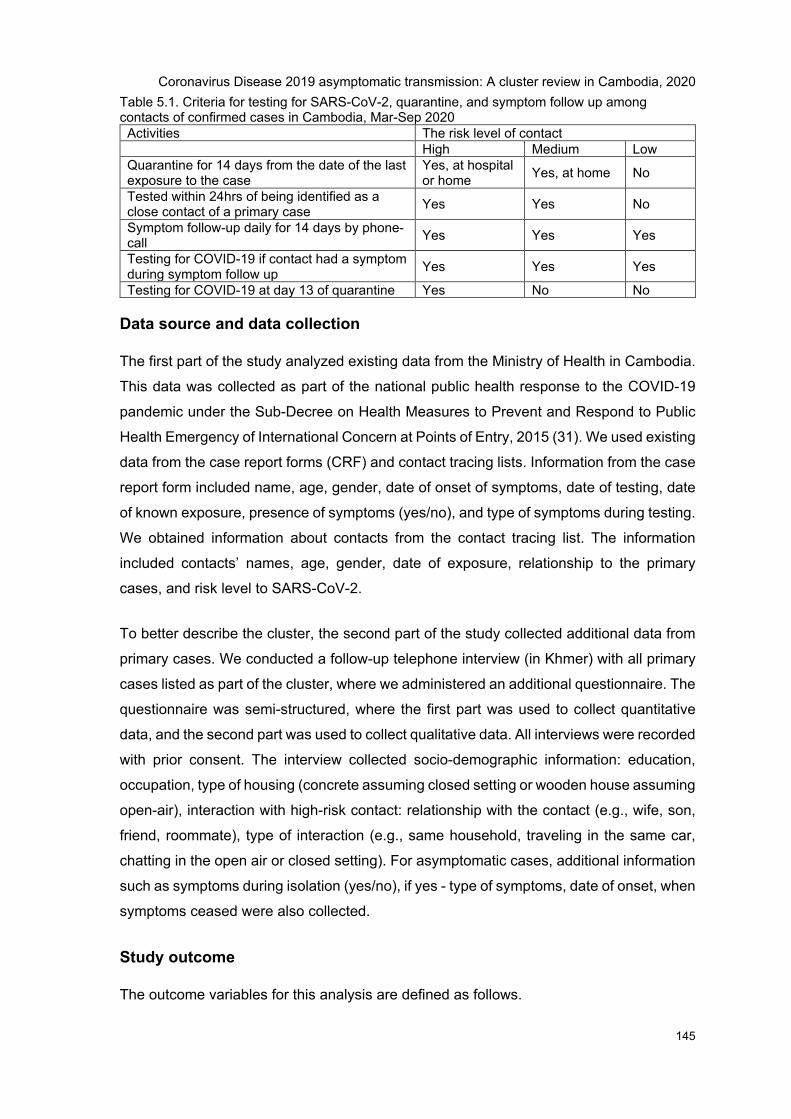
Coronavirus Disease 2019 asymptomatic transmission: A cluster review in Cambodia, 2020
145
Table 5.1. Criteria for testing for SARS-CoV-2, quarantine, and symptom follow up among contacts of confirmed cases in Cambodia, Mar-Sep 2020
Activities The risk level of contact High Medium Low
Quarantine for 14 days from the date of the last exposure to the case
Yes, at hospital or home Yes, at home No
Tested within 24hrs of being identified as a close contact of a primary case Yes Yes No
Symptom follow-up daily for 14 days by phone-call Yes Yes Yes
Testing for COVID-19 if contact had a symptom during symptom follow up Yes Yes Yes
Testing for COVID-19 at day 13 of quarantine Yes No No
Data source and data collection
The first part of the study analyzed existing data from the Ministry of Health in Cambodia.
This data was collected as part of the national public health response to the COVID-19
pandemic under the Sub-Decree on Health Measures to Prevent and Respond to Public
Health Emergency of International Concern at Points of Entry, 2015 (31). We used existing
data from the case report forms (CRF) and contact tracing lists. Information from the case
report form included name, age, gender, date of onset of symptoms, date of testing, date
of known exposure, presence of symptoms (yes/no), and type of symptoms during testing.
We obtained information about contacts from the contact tracing list. The information
included contacts’ names, age, gender, date of exposure, relationship to the primary
cases, and risk level to SARS-CoV-2.
To better describe the cluster, the second part of the study collected additional data from
primary cases. We conducted a follow-up telephone interview (in Khmer) with all primary
cases listed as part of the cluster, where we administered an additional questionnaire. The
questionnaire was semi-structured, where the first part was used to collect quantitative
data, and the second part was used to collect qualitative data. All interviews were recorded
with prior consent. The interview collected socio-demographic information: education,
occupation, type of housing (concrete assuming closed setting or wooden house assuming
open-air), interaction with high-risk contact: relationship with the contact (e.g., wife, son,
friend, roommate), type of interaction (e.g., same household, traveling in the same car,
chatting in the open air or closed setting). For asymptomatic cases, additional information
such as symptoms during isolation (yes/no), if yes - type of symptoms, date of onset, when
symptoms ceased were also collected.
Study outcome
The outcome variables for this analysis are defined as follows.
Chapter 5
146
The asymptomatic cases are referred to cases who did not have a history of fever, cough,
sore throat, runny nose, or difficulty breathing when tested positive for the SARS-CoV-2
since the last date of exposure. Asymptomatic cases were asked only once following the
positive result. Therefore, we were not able to follow whether cases have developed
symptoms during isolation.
The attack rate refers to SARS-CoV-2 positivity among those exposed to the source of
infection. In secondary cases, the attack rate was calculated as the number of contacts
who tested positive for SARS-CoV-2 among all identified contacts.
In addition to the quantitative data, we described the interactions between asymptomatic
primary cases and their contacts which subsequently tested positive for SARS-CoV-2.
Sample size
For both retrospective data analysis and the qualitative component, we aimed to include
all identified cases who participated in the religious event travelled back to Cambodia and
their contacts in Cambodia.
Data analysis
Secondary data analysis
Descriptive analysis was conducted to describe the characteristics of primary and
secondary cases in the cluster. The asymptomatic proportion was calculated among
returned travelers by dividing asymptomatic primary cases by all primary cases. In
producing the secondary attack rate (SAR), among non-travelers, we divided the number
of secondary cases by the number of contacts. In determining the statistically significant
difference in the SAR of contacts exposed to symptomatic and asymptomatic primary
cases, we used the Chi-square test if all expected values were greater than five and used
Fisher’s exact test if one or more expected values were five or less (32). We also compared
time taken to clear the virus where clearance was defined as having two consecutive
negative PCR results within a 48-hour interval.
Interview analysis
A rapid qualitative analysis was conducted on the qualitative data where interview
recordings were listened to repeatedly through re-familiarisation with the content and
pseudonymized. A summary table was developed in MS Word based on the semi-
Coronavirus Disease 2019 asymptomatic transmission: A cluster review in Cambodia, 2020
147
structured interview guide. This table was used to summarize key themes from the
interviews and to capture illustrative quotes. In the second phase of this rapid analysis,
information from the summary tables was collated in a matrix in MS Excel. A matrix was
created to capture the initial set of themes identified in the summary tables, a brief
descriptor of each theme, key findings under each, and supporting quotations. Rapid
qualitative data analysis is considered acceptable where resource and time constraints
are barriers to interview transcription (33-35).
Ethical Approvals
The protocol was reviewed and approved by the Human Research Ethics Committee
(HREC) of Australian National University (No 2020/043, on 25 August 2020 for secondary
data analysis and No 2020/506, on 01 October 2020 on the qualitative part) and the
National Ethical Committee for Health Research (No 211 NECH R, on 28 August 2020) in
Cambodia.
Results
For the retrospective data analysis, we included all primary cases (n=22), all secondary
cases (n=10), and all uninfected contacts (n=491)
For the qualitative component of the study, we analyzed data from 12 out of 22 primary
cases. Ten were excluded because they either declined the invitation to participate (n=4)
or could not be reached through a phone number in the database (n=6). Reasons of refusal
was not recorded for ethical reasons.
Description of the Returned Traveler Cluster
The religious event was hosted between 28 February and 2 March 2020 in country x.
According to the religious leader in Cambodia, 79 Cambodians joined the event. These 79
people were from 10 provinces in Cambodia. The majority (>70 people) traveled together
from Phnom Penh international airport to airport of country x on the evening of 27 February
2020. They were picked up by buses arranged by the religious event organizers and
transported from the airport to the religious event. The bus journey was approximately 30
minutes from the airport to the religious facility. The buses used by the Cambodian
travelers were for Cambodian nationals only.

Chapter 5
148
All Cambodians stayed at the religious facility for the whole ceremony (four or five days
from 27 February to 3 March 2020); they stayed in an open space in a building (⁓10x30
meters) prepared for Cambodians. Similar spaces were also prepared for other
nationalities (e.g., Thai, Bruneian, Indonesian). Bathroom and toilets were shared by
everyone who stayed in the facility.
“There was a block for Cambodia; they had a reserved place for Cambodia… Other countries had their block, but the toilets were shared for all countries “Case 1.
Organizers prepared food, but all primary cases reported eating some meals at nearby
local markets (5 to 10-minute walk). Many reported touring the local market, but not often
and for a short period of time only, due to the event’s busy schedule. The event was
crowded, and every case interviewed reported hand-shaking with the preachers and with
participants of other nationalities.
“We sometimes ate the food prepared by the organizer, but we walked down the hill to eat in a restaurant nearby…because there were many people waiting for the meals and the curry taste was a bit different from Khmer[Cambodian] food” Case 6.
No COVID-19 prevention measures were implemented at a religious event. Temperature
screening was conducted prior to boarding the airplane and prior to exiting the airport in
Cambodia and country x.
“I saw several people from the Philippines wore a mask, but almost everyone did not wear a mask. We did not hear any advice from the organizers to prevent [SARS-Cov-2] transmission.”, Case 6.
The 79 Cambodians were split into two groups during their return trip to Cambodia. The
first group traveled from the religious facility to the airport in country X on the evening of 2
March (the last day of the event) by the organizers’ buses (about a 30-minute trip). They
stayed in the airport to wait for boarding at approximately 4:30 AM on 3 March. The second
group underwent the same process on the 3 March. They stayed at the airport to wait for
boarding at approximately 4:30 AM on 4 March. The flight time from country x to Phnom
Penh was approximately 3 hours. Cambodians shared flights with passengers who did not
attend the religious event.
Temperature screening at Phnom Penh International Airport was in place. However, no
other policies such as testing and quarantine at home/hotel/hospital for arrival passengers
had been imposed at this time. Those who resided in the provinces took taxi vans as a

Coronavirus Disease 2019 asymptomatic transmission: A cluster review in Cambodia, 2020
149
group (all in one taxi) to their home. The returned travelers in each province reported
attending their local religious facilities in the days after returning home. Some reported
traveling to other districts in their province or other provinces to share what they had
learned at the religious event. Sometimes they were required to stay overnight.
“The taxi to my province was waiting for me in front of the airport. I traveled with all other people from province X “, Case 7.
No precautionary prevention measures to protect family members from possible SARS-
CoV-2 transmission were reported by interviewees. At least two respondents were misled
by the fact they had temperature screening. They felt safe after they passed the screening
process and did not think they posed a risk. Some said they had never heard about
COVID-19 before, and some said they have heard about COVID-19 but never expected
they could have had it because they were very healthy. Before the primary cases were
tested, 19 out of 22 primary cases had exposed to their household members for a period
ranging from 10 to 15 days with a median of 12 and interquartile ranging from 12 to 13
days (Figure 5.2). Two cases reported they had not stayed with their family until the day
they were tested for SARS-CoV-2, while one case stayed with the family for the first five
days before traveling away from home.
“I have never heard about COVID [19] until the day I was tested for it [SARS-CoV-2]”, Case 4.
“I did not want to transmit the virus to someone else. I thought I did not have it [SARS-CoV-2] because I was screened for the temperature at the airport, and they allowed me to leave the airport”, Case 1
Of secondary cases, two of them developed symptoms before they were tested for SARS-
CoV-2. The first symptomatic secondary case had his/her symptom onset eight days after
the last date of exposure with the primary cases. The second symptomatic secondary case
had his/her symptom onset 14 days after the last date of exposure to the primary cases.
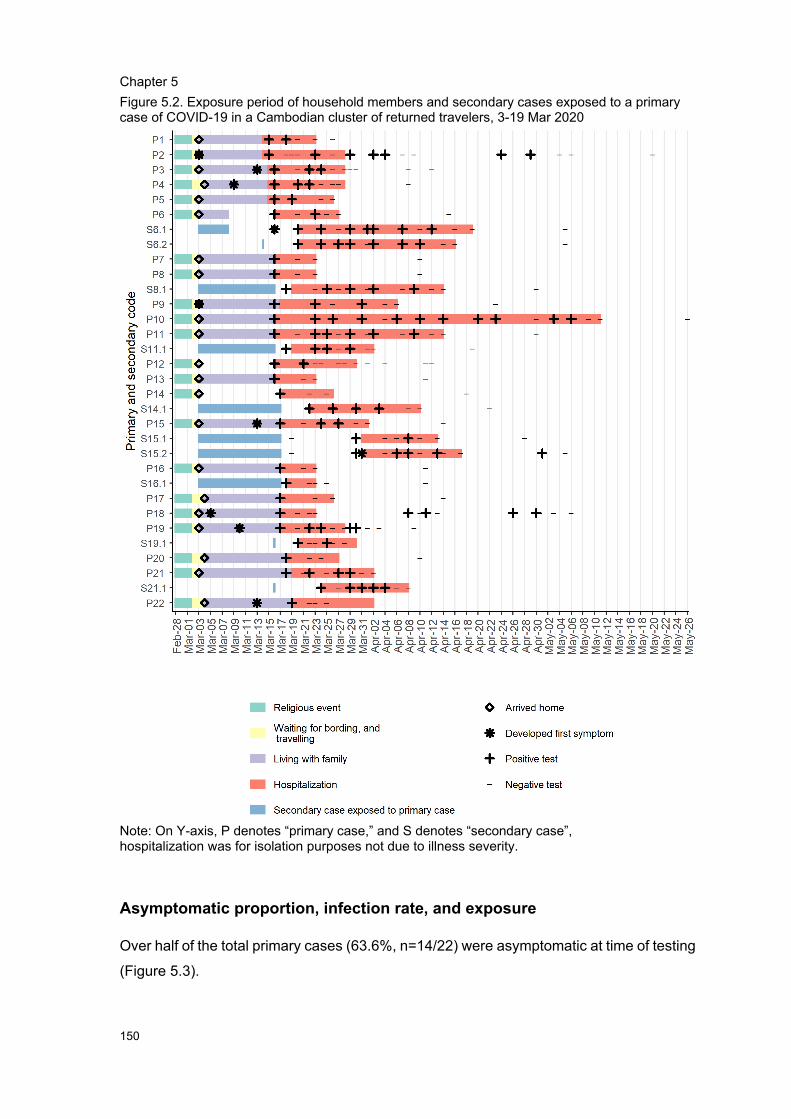
Chapter 5
150
Figure 5.2. Exposure period of household members and secondary cases exposed to a primary case of COVID-19 in a Cambodian cluster of returned travelers, 3-19 Mar 2020
Note: On Y-axis, P denotes “primary case,” and S denotes “secondary case”, hospitalization was for isolation purposes not due to illness severity.
Asymptomatic proportion, infection rate, and exposure
Over half of the total primary cases (63.6%, n=14/22) were asymptomatic at time of testing
(Figure 5.3).

Coronavirus Disease 2019 asymptomatic transmission: A cluster review in Cambodia, 2020
151
Overall, 22 primary cases generated ten secondary cases, giving the overall rate or so-
called “basic reproduction number” of 0.5 secondary cases per primary case. The basic
reproduction number generated by the asymptomatic primary case of 0.5 (n=7/14) was
similar to the rate of 0.4 (n=3/8) generated by the symptomatic primary case (Figure 5.3).

Chapter 5
152
Figure 5.3. A network between primary and secondary cases in a cluster of returned travelers in Cambodia, 27 Feb-19 Mar 2020, in Cambodia
From our qualitative data, we described how the secondary cases were exposed to their
asymptomatic case.
Primary case #6: This asymptomatic case, a male in his 30s, generated two secondary
cases. Case 6 tested positive 13 days after returning from country x, on 16 March. Case
6 spent the first five days living with his family (wife and three kids) in a wooden house (no
air conditioner) and traveled away from home (stayed overnight) between day six and day
13. All of his family members were tested for SARS-CoV-2 and all tested negative by PCR.
There was no reported further transmission in the communities he visited.
• Secondary case 6.1 was a male in his 30s, who was a close friend of case 6. After
case 6 arrived home from country x, they met five times per day, every day, for five
days in a nearby mosque for praying. They had physical and non-physical
interactions, including praying and talking with less than one-meter distance many
times, hand-shaking at least once a day for five days from day one to day five after
case 6 had returned home. In addition, they had one meal together, including
sharing water-drinking glass during that period. The secondary case was identified
Coronavirus Disease 2019 asymptomatic transmission: A cluster review in Cambodia, 2020
153
during contact tracing. He was tested three days after Case 6 was confirmed
positive for SARS-CoV-2.
• Secondary case 6.2 was a male in his 30s. He was not known to the primary case.
The primary case met the secondary case on day 11 after the he arrived home
from country x. It was one day before case 6 tested positive for SARS-CoV-2. Both
of them claimed they shook hands and had a 5-10-minute talk. That was the only
time they met. The secondary case was tested four days after they met by the
contact tracing team.
Case #8: Case 8 was an asymptomatic male in his 40s, whom generated a secondary
case. Case 8 tested positive 13 days after returning from country x, on 16 March. Case 8
lived with his family in a concrete house (no air conditioner) from the time he returned from
country x until he tested positive for SARS-CoV-2. The couple had three children aged
between 13-19 years living with them. No physical interaction with the children was
reported, and all children tested negative for SARS-Cov-2.
• Secondary case 8.1 was the wife of case 8. She was in her 40s. She lived with her
husband without any protections for 13 days after he arrived home from country x.
Case #11: This asymptomatic primary case, a male in his 40s, generated one secondary
case. Case 11 tested positive 13 days after returning from country x, on 16 March. He
lived in the family home, a wooden house (no air conditioner), from the time he returned
from country x until he tested positive for SARS-CoV-2. He had four children aged between
5 and 12 years old. The family reported physical contact, sharing meals, and water-
drinking glasses. Case 11 reported often spending time playing with his second and third
child in the period between returning home and testing positive. However, all children
tested negative for SARS-CoV-2 at the time of testing.
• Secondary case 11.1 was the wife of case 11. She was in her 30s. She lived with
her husband without any protections for 13 days after he arrived home from country
x.
Case #14: This asymptomatic primary case, a male in his 50s, generated one secondary
case. Case 14 tested positive 14 days after returning from country x, on 17 March. Case
14 traveled with 13 people by van (with air conditioning) to three provinces—the day after
Chapter 5
154
returning home from country x. Case 14 did not spend time with his family after returning
to Cambodia from country x.
• Secondary case 14.1 was a male in his 30s. He travelled and prayed with case 14
for 14 days. He was the only contact that tested positive for SARS-CoV-2 out of 12
high-risk contacts. Besides sitting in the van together, they reported eating meals
together, including using the same water-drinking glass.
Case #16: Case 16 tested positive 14 days after returning from country x, on 17 March.
This asymptomatic primary case was a male in his 50s. Case 16 lived with his family in a
wooden house from the day of his return from country x until the day he was tested for
SARS-CoV-2. None of his family members tested positive for SARS-CoV-2.
• The secondary case, 16.1, was a male whom he prayed with in a mosque every
day for more than ten days. They shook hands at least once a day and had multiple
meals together during that period.
Case #21: This asymptomatic primary case, a male in his 60s, tested positive 16 days
after returning from country x, on 19 March. Case 21 stayed with his family in a wooden
house from the time of his arrival from country x until the day he was tested, and his family
members were all tested negative for SARS-CoV-2.
• Case 21 met the secondary case 21.1, a male in his 50s, in a mosque. The meeting
was 14 days after the religious event in country x had ended. They spent a day
together in the mosque. The interaction reported was one-time hand-shaking and
several conversations with less than 2-meter distance.
Characteristics of primary and secondary case
All primary cases (100%, n=22) in our cluster were males with a median age of 41 years
old (IQR 34-57 years) (Table 5.2). The age distribution between asymptomatic and
symptomatic primary cases was similar. Of these primary cases, the period between their
last exposed date and recovery dates ranges from 17 to 68 days. The asymptomatic
primary cases took a non-statistically shorter time than the symptomatic primary cases to
clear the virus (median of 26 days, IQR 22-19 compared to median 27, IQR 24-31,
respectively). The individual was considered to have cleared the virus if they had two
consecutive negative PCR results within a 48-hour interval.

Coronavirus Disease 2019 asymptomatic transmission: A cluster review in Cambodia, 2020
155
Of all ten secondary cases, 60.0% (n=6/10) were female. The median age was 38 years
old (IQR 35-48 years).
Table 5.2. Characteristics of primary and secondary cases in a cluster of returned travelers, Cambodia 14-19 March
Primary cases Secondary case
Variable Total (N=22)
Asymp. (N=14)
Symp. (N=8)
P Total (N=10) Asymp. (N=8)
Symp. (N=2)
P
column (%) n (%) n (%) column (%) n (%) n (%) No. of primary cases (a)
22 14 8 __ __ __
No. of secondary cases (b)
10 7 3 __ __ __
Secondary cases per primary case (b/a)
0.5 0.5 0.4 __ __ __
Sex Male 22 (100.0) 14 (63.6) 22 (36.4) __ 6 (60.0) 5 (83.3) 1 (16.7) 0.7 Female 0 (0.0) 0 (0.0) 0 (0.0) 4 (40.0) 3 (75.0) 1 (25.0)
Age in years Median [IQR] 41[34-57] 44 [39-57] 37 [31-51] 38 [35-48] 37 [34-40] 59 [48-71] <27 __ __ __ 0.5 1 (10.0) 1 (100.0) 0 (0.0) 0.2 27-39 8 (36.4) 4 (50.0) 4 (50.0) 5 (50.0) 5 (100.0) 0 (0.0) 40-59 9 (40.9) 7 (77.8) 2 (22.2) 3 (30.0) 2 (66.7) 1 (33.3) 60-75 5 (22.7) 3 (60.0) 2 (40.0) 1 (10.0) 0 (0.0) 1 (100.0)
Type of symptoms among those who had symptoms Fever 7 (50.0) __ __ _ 1 __ __ _ Cough 7 (50.0) __ __ 2 __ __ Sorethroat 6 (42.9) __ __ 1 __ __ Runny nose 6 (42.9) __ __ 1 __ __ Breathing difficulty
5 (35.7) __ __ 1 __ __
Underlying condition (diabetes, hypertension, lung, and other) No 18 (81.8) 11 (61.1) 7 (38.9) 0.5 10 (100.0) 8 (80.0) 2 (20.0) __ Yes 4 (18.2) 3 (75.0) 1 (25.0) 0 (0.0) 0 (0.0) 0 (0.0)
No. of days between last exposed date to recovery (two consecutive negative PCR) within 48-hour interval Range 17 to 68 22 to 44 17 to 68 __ __ __ _ Median [IQR] 27 [22-31] 26 [22-29] 27 [24-31] __ __ __ _
Housing
Wooden 16 (72.7) 13 (81.3) 3 (18.7) 0.0
1 Concrete 6 (27.3) 1 (16.7) 5 (83.3)
Abbreviation: Asymp, Asymptomatic; Symp, Symptomatic; IQR, interquartile range
Attack rate among contacts
Table 5.3 shows the attack rate among contacts. We detected ten secondary cases out of
the 501 contacts, giving the crude attack rate of 2.0%. The highest attack rate was in high-
risk contacts (5.9%, n=8/136), followed by 1.2% (n=1/86) in medium-risk contacts and
0.4% (n=1/279) in low-risk contacts with P-value=0.001. (Table 5.3).
Chapter 5
156
A non-statistically higher attack rate was observed in household contacts than in non-
household contacts (3.4%, n=118 vs. 1.7%, n=1/60, P-value=0.256). Of the household
contacts, the highest attack rate was in spouse’s (18.8%, n=3/16), followed by children
(1.7%, n=1/60), while no other relatives (n=0/42) were reported to have tested positive (P-
value=0.008).
Of non-household individuals, co-travelers who shared the car with a case had the highest
attack rate of 4.0% (n=1/25), while the attack rate of people praying in a mosque with a
case was 3.3% (n=5/153). We did not detect any cases among health care staff providing
consultation to the cases (n=0/3), villagers talking with case (n=0/191), café staff and
clients sharing a table with a case (n=0/5), or grocery sellers (n=0/5).
When stratifying between contacts exposed to asymptomatic and symptomatic primary
cases, we observed that the attack rate was similar (2.0%, n=7/343 vs. 1.9%, n=3/158,
respectively). Also, the attack rate among high-risk contacts exposed to the asymptomatic
primary cases was similar (5.8%, n=5/86 vs. 6.0%, n=3/50).
Attack rate in wives whose husband was asymptomatic was 20.0% (n=2/10), similar to
those whose husband was symptomatic 16.7% (n=1/6). One child was infected with
SARS-CoV-2 in a family whose father was symptomatic.
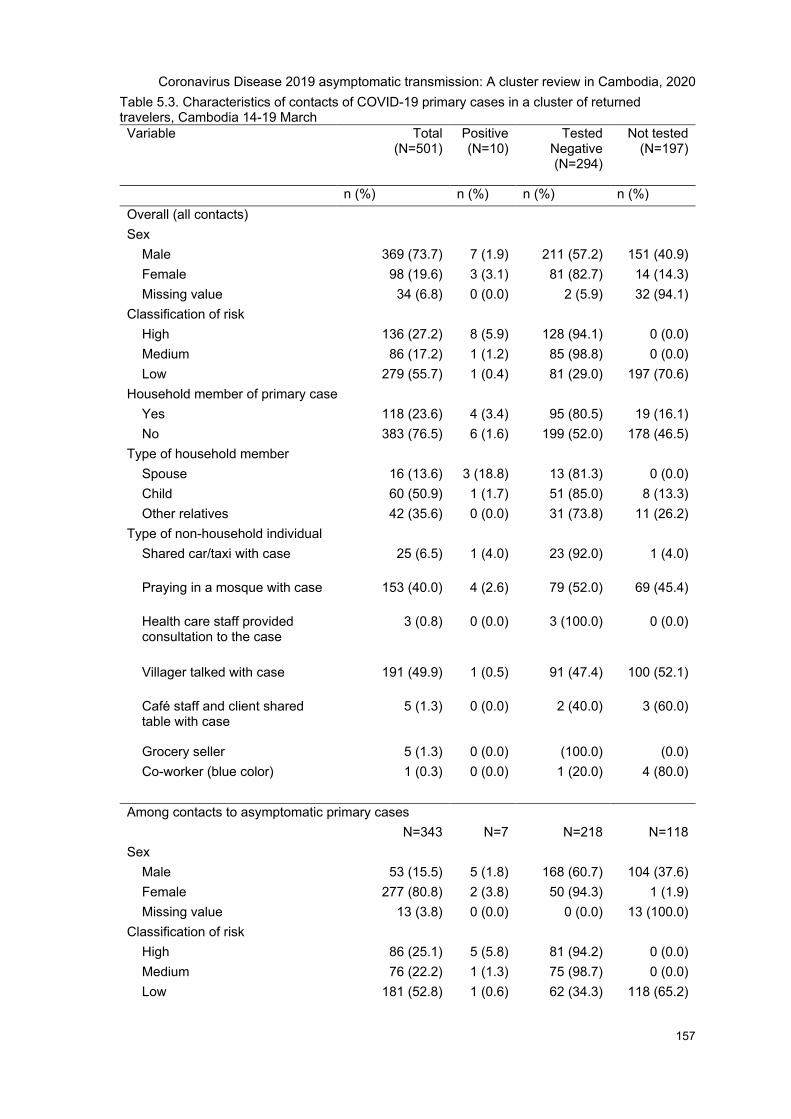
Coronavirus Disease 2019 asymptomatic transmission: A cluster review in Cambodia, 2020
157
Table 5.3. Characteristics of contacts of COVID-19 primary cases in a cluster of returned travelers, Cambodia 14-19 March Variable Total
(N=501) Positive (N=10)
Tested Negative (N=294)
Not tested (N=197)
n (%) n (%) n (%) n (%) Overall (all contacts) Sex
Male 369 (73.7) 7 (1.9) 211 (57.2) 151 (40.9) Female 98 (19.6) 3 (3.1) 81 (82.7) 14 (14.3) Missing value 34 (6.8) 0 (0.0) 2 (5.9) 32 (94.1)
Classification of risk High 136 (27.2) 8 (5.9) 128 (94.1) 0 (0.0) Medium 86 (17.2) 1 (1.2) 85 (98.8) 0 (0.0) Low 279 (55.7) 1 (0.4) 81 (29.0) 197 (70.6)
Household member of primary case Yes 118 (23.6) 4 (3.4) 95 (80.5) 19 (16.1) No 383 (76.5) 6 (1.6) 199 (52.0) 178 (46.5)
Type of household member Spouse 16 (13.6) 3 (18.8) 13 (81.3) 0 (0.0) Child 60 (50.9) 1 (1.7) 51 (85.0) 8 (13.3) Other relatives 42 (35.6) 0 (0.0) 31 (73.8) 11 (26.2)
Type of non-household individual Shared car/taxi with case 25 (6.5) 1 (4.0) 23 (92.0) 1 (4.0)
Praying in a mosque with case 153 (40.0) 4 (2.6) 79 (52.0) 69 (45.4)
Health care staff provided consultation to the case
3 (0.8) 0 (0.0) 3 (100.0) 0 (0.0)
Villager talked with case 191 (49.9) 1 (0.5) 91 (47.4) 100 (52.1)
Café staff and client shared table with case
5 (1.3) 0 (0.0) 2 (40.0) 3 (60.0)
Grocery seller 5 (1.3) 0 (0.0) (100.0) (0.0) Co-worker (blue color) 1 (0.3) 0 (0.0) 1 (20.0) 4 (80.0)
Among contacts to asymptomatic primary cases N=343 N=7 N=218 N=118
Sex Male 53 (15.5) 5 (1.8) 168 (60.7) 104 (37.6) Female 277 (80.8) 2 (3.8) 50 (94.3) 1 (1.9) Missing value 13 (3.8) 0 (0.0) 0 (0.0) 13 (100.0)
Classification of risk High 86 (25.1) 5 (5.8) 81 (94.2) 0 (0.0) Medium 76 (22.2) 1 (1.3) 75 (98.7) 0 (0.0) Low 181 (52.8) 1 (0.6) 62 (34.3) 118 (65.2)
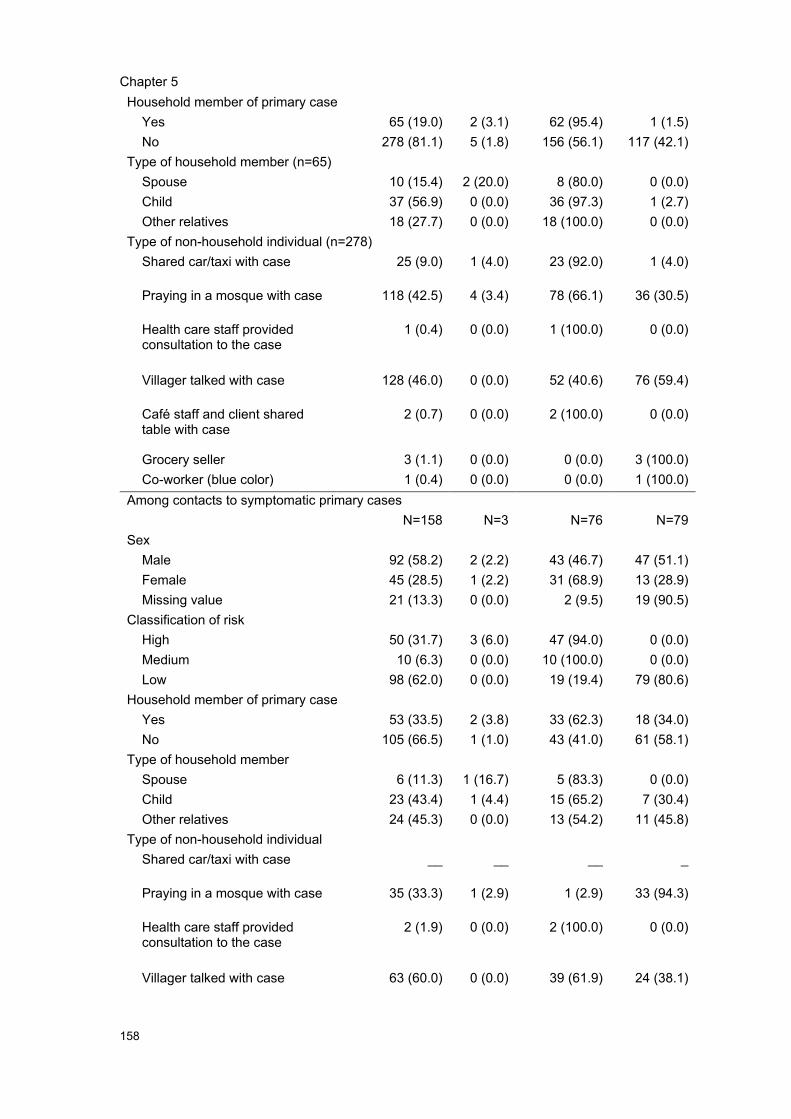
Chapter 5
158
Household member of primary case Yes 65 (19.0) 2 (3.1) 62 (95.4) 1 (1.5) No 278 (81.1) 5 (1.8) 156 (56.1) 117 (42.1)
Type of household member (n=65) Spouse 10 (15.4) 2 (20.0) 8 (80.0) 0 (0.0) Child 37 (56.9) 0 (0.0) 36 (97.3) 1 (2.7) Other relatives 18 (27.7) 0 (0.0) 18 (100.0) 0 (0.0)
Type of non-household individual (n=278) Shared car/taxi with case 25 (9.0) 1 (4.0) 23 (92.0) 1 (4.0)
Praying in a mosque with case 118 (42.5) 4 (3.4) 78 (66.1) 36 (30.5)
Health care staff provided consultation to the case
1 (0.4) 0 (0.0) 1 (100.0) 0 (0.0)
Villager talked with case 128 (46.0) 0 (0.0) 52 (40.6) 76 (59.4)
Café staff and client shared table with case
2 (0.7) 0 (0.0) 2 (100.0) 0 (0.0)
Grocery seller 3 (1.1) 0 (0.0) 0 (0.0) 3 (100.0) Co-worker (blue color) 1 (0.4) 0 (0.0) 0 (0.0) 1 (100.0)
Among contacts to symptomatic primary cases N=158 N=3 N=76 N=79
Sex Male 92 (58.2) 2 (2.2) 43 (46.7) 47 (51.1) Female 45 (28.5) 1 (2.2) 31 (68.9) 13 (28.9) Missing value 21 (13.3) 0 (0.0) 2 (9.5) 19 (90.5)
Classification of risk High 50 (31.7) 3 (6.0) 47 (94.0) 0 (0.0) Medium 10 (6.3) 0 (0.0) 10 (100.0) 0 (0.0) Low 98 (62.0) 0 (0.0) 19 (19.4) 79 (80.6)
Household member of primary case Yes 53 (33.5) 2 (3.8) 33 (62.3) 18 (34.0) No 105 (66.5) 1 (1.0) 43 (41.0) 61 (58.1)
Type of household member Spouse 6 (11.3) 1 (16.7) 5 (83.3) 0 (0.0) Child 23 (43.4) 1 (4.4) 15 (65.2) 7 (30.4) Other relatives 24 (45.3) 0 (0.0) 13 (54.2) 11 (45.8)
Type of non-household individual Shared car/taxi with case __ __ __ _
Praying in a mosque with case 35 (33.3) 1 (2.9) 1 (2.9) 33 (94.3)
Health care staff provided consultation to the case
2 (1.9) 0 (0.0) 2 (100.0) 0 (0.0)
Villager talked with case 63 (60.0) 0 (0.0) 39 (61.9) 24 (38.1)

Coronavirus Disease 2019 asymptomatic transmission: A cluster review in Cambodia, 2020
159
Café staff and client shared table with case
3 (2.9) 0 (0.0) 0 (0.0) 3 (100.0)
Grocery seller 2 (1.9) 0 (0.0) 1 (50.0) 1 (50.0) Co-worker (blue color) __ __ __ _
Discussion
This study provides evidence for asymptomatic transmission of the SARS-CoV-2 virus in
Cambodia. Asymptomatic primary cases made up 63.6% of all primary cases within our
cluster, and the asymptomatic cases generated seven out of 10 secondary cases. This
provides additional evidence confirming that asymptomatic transmission is likely to play
an important role in the transmission of SARS-CoV-2 (36-39).
Our study suggested the infectivity among contacts of an asymptomatic and symptomatic
case was not statistically different. This finding was not consistent with findings of previous
studies, suggesting that symptomatic cases are more infectious than asymptomatic (37).
A meta-analysis study by Buitrago-Garcia D et al. suggested that contacts of symptomatic
primary cases had an increased risk of SARS-CoV-2 infection by 65% compared to the
risk of contacts of asymptomatic (37). The absence of evidence for differential infectivity
in our study may have occurred due to the small sample size and mild symptom profile in
primary cases, which may have led to inadequate power to detect the difference.
Another unexpected finding was the low infectivity. It was clear that we missed the
opportunity to detect the 22 primary cases at the airport. The delay was dangerous as their
family and community were exposed to those primary cases during their infectious period
without any protection. We observed the overall reproduction number (secondary cases
per a primary case) was low at 0.5. This basic reproduction number was much lower than
that reported in the existing literature, between 1.9 and 6.5 in other settings [44]. Also, the
household SAR of 3.4% in our study was much lower compared to that reported in the
literature. A meta-analysis study by Koh WC et al. reported a pooled household SAR of
18.1% (95% CI: 15.7% and 20.6%), ranging from 3.9% to 54.9% (40). There are several
factors that may influence the SAR. First, medium and low-risk contacts were only tested
if symptomatic and not routinely at day 13. It is possible that asymptomatic infections were
not detected, so attack rates are compromised. Second, it is possible that the primary
cases in our study were not highly contagious because they were asymptomatic or mildly
symptomatic, indicative of a low viral load (41). However, we have no data to support this
argument. Third, housing and temperature could be another factor influencing infectivity.
Chapter 5
160
The majority of our primary cases exposed to their household members (n=14/20) lived
with them in a wooden house without an air conditioner in low population density areas. In
March and April when the cluster was identified, Cambodia was in the middle of hot
season. The combination between wooden housing where ventilation is usually adequate
and hot temperatures could have reduced droplet and aerosolized transmission (41). In
addition, although the contact tracing and quarantining of the contacts was delayed, it
could have prevented further spread by the first wave of the infection chain.
The mode of transmission from the asymptomatic cases to their susceptible contacts
remains a gap in our study. We were not able to distinguish whether the transmission was
through physical contact or droplet. All asymptomatic primary cases with one or more
secondary cases reported they had physical contacts and conversations with their SARS-
CoV-2 positive contact. It was not possible to determine at what stage and which mode
the virus was transmitted from the primary to the secondary case. This study’s strength
was that we analyzed a rare cluster in which time and place of exposure were known
among primary and secondary cases, with no active preventative strategies in place. This
provided an opportunity to calculate the basic reproduction number and attack rate.
We identified seven limitations within our study. First, we may have wrongly assumed the
last date of exposure. We assumed the last date of exposure for primary cases was the
last date of the event. They might have been infected on the return flight to Cambodia,
therefore, the actual recovery period may be shorter than reported in our findings. Second,
we assumed that all contacts were exposed to a single primary case based on our
information. It was unlikely but possible that the secondary cases were exposed to other
unknown or unidentified cases in their community. Third, our sample size was small which
may not have enough power to detect statistical difference between groups. Fourth, we
did not have information on viral load which would have strengthened our analysis. Despite
this, our findings remain useful in understanding asymptomatic infection. Fifth, due to the
frequency of testing was every three days (not every day), it has the potential to result in
over-estimation of the time for viral clearance. Due to the frequency of testing was every
three days (not every day), it has the potential to result in over-estimation of the time for
viral clearance. Sixth, another limitation, leading to underestimating the attack rate among
household members, is that children may be infected and naturally recovered before being
tested for SARS-CoV-2. Finally, recall bias may have occurred during our interviews,
which were conducted about six months after cases were discharged from isolation.
However, by reminding interviewees what the information they provided contact tracers
during the first interview, they were able to recall events. Also, the significance of the event
Coronavirus Disease 2019 asymptomatic transmission: A cluster review in Cambodia, 2020
161
is likely to have enhanced the individual’s ability to recall information associated with the
event.
Conclusions
In this study, asymptomatic COVID-19 cases were shown to transmit SARS-CoV-2 to their
contacts. There was no statistically different infectivity among contacts exposed to
asymptomatic and symptomatic primary cases. Future response to contain and mitigate
COVID-19 spread must take into account asymptomatic transmission.
Recommendations
• All people who travel back from abroad should be quarantined and tested
regardless their symptomatic status.
• The SARS-CoV-2 testing should be done when passengers arrived at the airport
or border gate and tested for a second time on day 13 of quarantine, regardless
of their symptom status.The Cambodian Government should consider provide
education about asymptomatic transmission to general public.
Chapter 5
162
Reference
1. World Health Organization (WHO). WHO Timeline - COVID-19 Geneva, Switzerland:WHO; 2020 [cited 2020 19 June 2020]. Available from: https://www.who.int/news-room/detail/27-04-2020-who-timeline---covid-19.
2. World Health Organization (WHO). Weekly epidemiological update - 15 December 2020.WHO; 2020.
3. Xie Y, Wang Z, Liao H, Marley G, Wu D, Tang W. Epidemiologic, clinical, and laboratoryfindings of the COVID-19 in the current pandemic: systematic review and meta-analysis. BMCinfectious diseases. 2020;20(1):640.
4. Zheng Z, Peng F, Xu B, Zhao J, Liu H, Peng J, et al. Risk factors of critical & mortal COVID-19 cases: A systematic literature review and meta-analysis. The Journal of infection.2020;81(2):e16-e25.
5. Tian W, Jiang W, Yao J, Nicholson CJ, Li RH, Sigurslid HH, et al. Predictors of mortality inhospitalized COVID-19 patients: A systematic review and meta-analysis. Journal of medicalvirology. 2020.
6. Romero Starke K, Petereit-Haack G, Schubert M, Kämpf D, Schliebner A, Hegewald J, etal. The Age-Related Risk of Severe Outcomes Due to COVID-19 Infection: A Rapid Review, Meta-Analysis, and Meta-Regression. International journal of environmental research and publichealth. 2020;17(16).
7. Lu L, Zhong W, Bian Z, Li Z, Zhang K, Liang B, et al. A comparison of mortality-related riskfactors of COVID-19, SARS, and MERS: A systematic review and meta-analysis. The Journal ofinfection. 2020;81(4):e18-e25.
8. Fang X, Li S, Yu H, Wang P, Zhang Y, Chen Z, et al. Epidemiological, comorbidity factorswith severity and prognosis of COVID-19: a systematic review and meta-analysis. Aging.2020;12(13):12493-503.
9. OECD. Flattening the COVID-19 peak: Containment and mitigation policies: OECD; 2020[cited 2020 26 October 2020]. Available from: https://www.oecd.org/coronavirus/policy-responses/flattening-the-covid-19-peak-containment-and-mitigation-policies-e96a4226/.
10. Pragyan Deb, Davide Furceri, Jonathan D. Ostry, Tawk N. The Effect of ContainmentMeasures on the COVID-19 Pandemic. International Monetary Fund (IMF); 2020.
11. Southeast Asia Covid-19 Tracker [Internet]. CSIS. 2020. Available from:https://www.csis.org/programs/southeast-asia-program/southeast-asia-covid-19-tracker-0.
12. COVID-19 cases in Cambodia by 15 December 2020 [press release]. Phnom Penh:MoH2020.
13. Cambodian Communicable Disease Control Department (CCDC). COVID-19 DailySurveillance Report. Phnom Penh2020.
Coronavirus Disease 2019 asymptomatic transmission: A cluster review in Cambodia, 2020
163
14. Cambodia Communicable Diseas Control (CCDC). COVID-19 Documentation PhnomPenh: CCDC; 2020 [Available from: http://www.cdcmoh.gov.kh/resource-documents/covid-19-documents.
15. Us Embassy in Cambodia. COVID-19 Information Phnm Penh: Us Embassy in Cambodia;2020 [Available from: https://kh.usembassy.gov/covid-19-information/.
16. Vicheika K. Cambodian Government Allocates Up to $2 Billion for Economic Fallout fromCoronavirus. VOA Khmer. 2020.
17. World Bank. The Economy in the Time of Covid-19. Washington, DC: World Bank; 2020.
18. World Bank. East Asia and Pacific in the Time of COVID-19. Washington, DC: World Bank;2020.
19. Wu Z, McGoogan JM. Asymptomatic and Pre-Symptomatic COVID-19 in China. Infect DisPoverty. 2020;9(1):72.
20. Bai Y, Yao L, Wei T, Tian F, Jin DY, Chen L, et al. Presumed Asymptomatic CarrierTransmission of COVID-19. JAMA. 2020;323(14):1406-7.
21. Byambasuren O, Cardona M, Bell K, Clark J, McLaws M-L, Glasziou P. Estimating theextent of asymptomatic COVID-19 and its potential for community transmission: systematicreview and meta-analysis. medRxiv. 2020:2020.05.10.20097543.
22. European Centre for Disease Prevention and Control (ECDC). Transmission of COVID-19:ECDC; 2020 [cited 2020 19 June 2020]. Available from: https://www.ecdc.europa.eu/en/covid-19/latest-evidence/transmission.
23. Gandhi M, Yokoe DS, Havlir DV. Asymptomatic Transmission, the Achilles' Heel ofCurrent Strategies to Control Covid-19. N Engl J Med. 2020;382(22):2158-60.
24. Heneghan C, Brassey J, Jefferson T. COVID-19: What proportion are asymptomatic? : TheCentre for Evidence-Based Medicine develops, promotes and disseminates better evidence forhealthcare; 2020 [Available from: https://www.cebm.net/covid-19/covid-19-what-proportion-are-asymptomatic/.
25. Huang L, Zhang X, Zhang X, Wei Z, Zhang L, Xu J, et al. Rapid asymptomatic transmissionof COVID-19 during the incubation period demonstrating strong infectivity in a cluster ofyoungsters aged 16-23 years outside Wuhan and characteristics of young patients with COVID-19: A prospective contact-tracing study. The Journal of infection. 2020;80(6):e1-e13.
26. Ing AJ, Cocks C, Green JP. COVID-19: in the footsteps of Ernest Shackleton. Thorax.2020;75(8):693-4.
27. Furukawa NW, Brooks JT, Sobel J. Evidence Supporting Transmission of Severe AcuteRespiratory Syndrome Coronavirus 2 While Presymptomatic or Asymptomatic. Emerg Infect Dis.2020;26(7).
28. World Health Organization (WHO). Transmission of COVID-19 by asymptomatic casesGeneva, Switzerland: WHO; 2020 [Available from: http://www.emro.who.int/health-topics/corona-virus/transmission-of-covid-19-by-asymptomatic-cases.html.
Chapter 5
164
29. World Health Organization (WHO). COVID-19 Virtual Press conference on 8 June 2020Geneva, Switzerland: WHO; 2020.
30. The Incubation Period of Coronavirus Disease 2019 (COVID-19) From Publicly ReportedConfirmed Cases: Estimation and Application. Annals of Internal Medicine. 2020;172(9):577-82.
31. World Health Organization (WHO). Joint External Evaluation of IHR Core Capacities ofthe Kingdom of Cambodia. Phnom Penh, Cambodia: WHO; 2016.
32. Kim HY. Statistical notes for clinical researchers: Chi-squared test and Fisher's exact test.Restor Dent Endod. 2017;42(2):152-5.
33. Halcomb EJ, Davidson PM. Is verbatim transcription of interview data always necessary?Appl Nurs Res. 2006;19(1):38-42.
34. Johnson GA, Vindrola-Padros C. Rapid qualitative research methods during complexhealth emergencies: A systematic review of the literature. Soc Sci Med. 2017;189:63-75.
35. Taylor B, Henshall C, Kenyon S, Litchfield I, Greenfield S. Can rapid approaches toqualitative analysis deliver timely, valid findings to clinical leaders? A mixed methods studycomparing rapid and thematic analysis. BMJ open. 2018;8(10):e019993.
36. Cevik M, Tate M, Lloyd O, Maraolo AE, Schafers J, Ho A. SARS-CoV-2, SARS-CoV, andMERS-CoV viral load dynamics, duration of viral shedding, and infectiousness: a systematicreview and meta-analysis. The Lancet Microbe. 2020.
37. Buitrago-Garcia D, Egli-Gany D, Counotte MJ, Hossmann S, Imeri H, Ipekci AM, et al.Occurrence and transmission potential of asymptomatic and presymptomatic SARS-CoV-2infections: A living systematic review and meta-analysis. PLoS medicine. 2020;17(9):e1003346.
38. Cevik M, Kuppalli K, Kindrachuk J, Peiris M. Virology, transmission, and pathogenesis ofSARS-CoV-2. BMJ. 2020;371:m3862.
39. Little P, Read RC, Amlot R, Chadborn T, Rice C, Bostock J, et al. Reducing risks fromcoronavirus transmission in the home-the role of viral load. BMJ. 2020;369:m1728.
40. Koh WC, Naing L, Chaw L, Rosledzana MA, Alikhan MF, Jamaludin SA, et al. What do weknow about SARS-CoV-2 transmission? A systematic review and meta-analysis of the secondaryattack rate and associated risk factors. PloS one. 2020;15(10):e0240205.
41. The Lancet Respiratory M. COVID-19 transmission—up in the air. The LancetRespiratory Medicine. 2020;8(12):1159.
Coronavirus Disease 2019 asymptomatic transmission: A cluster review in Cambodia, 2020
165
Annex 1: Research summary for general public
Can a Coronavirus Disease 2019 patient without any sign or symptom transmit the virus?
Written by Mr. Chhim Srean, student of Master of Philosophy in Applied Epidemiology, Australian National University
Why was the study needed?
Coronavirus Disease 2019 (COVID-19) is caused by a virus called Severe Acute
Respiratory Syndrome Coronavirus 2 – and commonly referred to as SARS-CoV-2. By 15
December 2020, according to the World Health Organization (WHO), 70 million people
were reported to have tested positive for SARS-CoV-2 internationally, and about 1.6
million people had died globally.
SARS-CoV-2 positive people may or may not have any signs or symptoms such as fever,
cough, sore throat, runny nose, or difficulty breathing. This is called asymptomatic. A
SARS-CoV-2 positive person without any signs or symptoms may not know they have
SARS-CoV-2 and can recover naturally without treatment. They can, however, still pass
the virus to other people. This makes the disease hard to detect and difficult to prevent
further people from getting the virus. Scientists need more evidence to understand how
the virus is spread, especially from people who do not know they have the virus
In contributing to a new understanding, we reviewed a group of returned travelers who
tested positive for SARS-CoV-2 to describe how the virus from asymptomatic people
spread to others.
Who did we include in our analysis?
We included three groups of people in our analysis as follows.
1 People who had traveled internationally to a religious event between 28 February
and 2 March and tested positive for the SARS-Cov-2 within 14 days of returning
home.

Chapter 5
166
2 People who have been in contact with the positive cases then tested positive for
the SARS-Cov-2 with no history of international travel one month prior to testing
positive.
3 Uninfected contacts - people who have been in contact with positive cases (, but
tested negative for the SARS-Cov-2 with no history of international travel one
month prior to testing positive.
How did we detect the primary cases?
Between 28 February and 2 March 2020, an international religious event was hosted in a
Southeast Asian country. Seventy-nine Cambodians joined that 4-day religious event.
They returned to Cambodia on 3 and 4 March 2020.
Eleven days later, on 13 March 2020, Cambodia’s Ministry of Health got the information
through international collaboration that hundreds of new COVID-19 cases were linked to
a religious event. On 14 March, Cambodia’s Ministry of Health tested some of the people
who returned from that religious event. Two of them were tested positive for the virus. The
Ministry of Health decided to test all 79 people who joined the event.
How did we detect the secondary cases and uninfected contacts?
As part of the national response to stop the spread of SARS-CoV-2, when a person tested
positive for SARS-CoV-2, he/she was interviewed within 24 hours to identify people they
had been in contact with and places they had visited. They were interviewed to trace their
movement (where did they go? at what time? and who did they meet?). We considered a
person as a contact if they interacted with the confirmed cases any time between arriving
in Cambodia and isolation in hospital.
How did we collect data?
The Ministry of Health collected all data as part of the national public health
response to the COVID-19 pandemic. Additional data on how the primary and
secondary cases interacted was collected through phone-interview.
What did we find?
Twenty-two out of 79 returned travelers tested positive. We called these 22 cases ‘primary
cases’, meaning infected with SARS-CoV-2 at the religious event. Of the 22 primary cases,
Coronavirus Disease 2019 asymptomatic transmission: A cluster review in Cambodia, 2020
167
14 cases or 63.6% did not develop any symptoms by time they were tested positive SARS-
CoV-2. It is possible we would have never known they infected with SARS-CoV-2 if we did
not test them.
We identified 501 contacts to the 22 primary cases. Among 501 contacts, ten people (2%)
tested positive for SARS-CoV-2. Of these 10 infected people, seven were infected from
primary cases who did not develop any sign or symptom.
People in the household of a case were more likely to catch the virus than non-household
contacts. In our study, 4 out of 118 household members or 3.4% were tested positive,
while 1 out of 60 or 1.7% among non-household contacts tested positive. In households,
the spouses had the highest chance to be infected with SARS-CoV-2 from their infected
partner. In our study, 3 out of 16 wives tested positive. Children, however, had a much
lower chance of catching the virus with 1 out of 60 children testing positive.
Of non-household contacts, people who prayed in a mosque with a case were at risk of
getting SARS-CoV-2 (3.3%, 5 out of 153).
What could our study tell?
Our study found that the people infected with SARS-CoV-2 who do not present signs or
symptoms can transmit SARS-CoV-2 to their contacts. It is important that people should
all prevent themselves from SARS-CoV-2 infection by avoiding physical contact, talking
closer than two meters with people, and doing regular handwashing despite contact with
people who do not have any suspected signs and symptoms. Control measures should
also include a strategy to prevent SARS-CoV-2 transmission from people who have the
virus but do not present any sign or symptom.

Chapter 5
168
Appendix 2: Case report form
េឈ� ះអ�កបំេពញ៖______________េលខទូរស័ព�៖_______________Case number:___________
Interviewer’s name Telephone number កលបរេិច�ទសមា� សន៍ ____/____/20____
Date of interview ទំរង់រយករណ៍ករណីសង្ស័យ ជំងឺរលកផ�ូវដេង�ម(COVID-19)
Case Report form - suspected case of respiratory infection (COVID-19) 1. េឈ� ះ_______________________ Patient document number : ___________
Name (dossier) 2. អយុអ�កជំងឺៈ _____ ឆា� ំ
Age in year 3. េភទ ❑ ្របស ❑ �សី (្របសិនេប�សី� េតមានៃផ�េពះឬេទ? ❑មាន ❑មិនមាន ❑មិនដឹង)
Gender Male Female (If female, pregnant? ❑ Yes ❑ No ❑ Unknown) 4. ស�� តិ:_______________________ 5. មុខរបរ :_______________________
Nationality Occupation 6. អស័យដ�
នៈផ�ះេលខ:_______ ផ�ូវេលខ:________ ភូមិ:___________ ឃំុ/សង� ត់:___________
Address: House # street # Village Commune េខត�/ ្រក�ង:___________ េលខទូរស័ព�#1:________________ េលខទូរស័ព�#2:________________
Province/City Telephone # 1 Telephone # 2 7. សូមគូសប�� ក់លក�ខណ� ខងេ្រកមៈ (េដម្ីបកំណត់និយមន័យករណី)
Please tick the following conditions below ( To define the case) 7.1. សីតុណ�ភាព _________ ºC (វស់េពលជួបអ�កជំងឺ)
Curent temperature (Measured when meeting the patient) 7.2. ្របវត�ិ របស់អ�កជំងឺក�ុងកំឡុងេពល១៤ ៃថ�កន�ងមក
Patient history during the past 14 days 7.2. ្រគ�នេក� ❑មាន ❑មិនមាន ❑មិនដឹង
Fever Yes No Don’t know7.2.1. ក�ក ឬ ឈឺបំពង់ក ឬ េហៀរសំេបារ ❑មាន ❑មិនមាន ❑មិនដឹង
Cough or sore throat or runny nose Yes No Don’t know7.2.2. ហត់ ឬ ពិបាកដកដេង�ម ❑មាន ❑មិនមាន ❑មិនដឹង
Breathing difficulty Yes No Don’t know7.2.3. ៃថ�/ែខ/ឆា� ំ េចញេរគស�� ដំបូង: ____/____/20____
Date of first symptom(s) 8. អ�កជំងឺបានេធ�ដំេណ រមកពី្របេទសចិន ឬ ្របេទសែដលកំពុងមានករណី
ក�ុងេពល ១៤ ៃថ�មុនេចញេរគស�� :
❑មាន ❑មិនមាន ❑មិនដឹង
The patient came from China OR country with presence of confirmed cases within 14 days before symptoms:8.1. ៃថ�/ែខ/ឆា� ំមកដល់្របេទសកម�ុជា: ____/___
_/20____ If NO/DK >>> Go to Q 9
Date of arrival to Cambodia: 8.2. ្រចក្រពំែដនមកដល់្របេទសកម�ុជា:__________________________ Port of entry at arrival to Cambodia 8.3. េលខេជងេហះេហរមក្របេទសកម�ុជា: Flight number to Cambodia From To
Flight 1.__________________ មកពី____________ េទ____________
Flight 2.__________________ មកពី____________ េទ____________
Flight 3.__________________ មកពី____________ េទ____________
8.4. មកជាមួយនរណាខ�ះ?
Who did you come with? Name Relationship
1.__________________ ្រត�វជា__________________

Coronavirus Disease 2019 asymptomatic transmission: A cluster review in Cambodia, 2020
169
2.__________________ ្រត�វជា__________________
3.__________________ ្រត�វជា__________________
9. បានេនែក្បរ ឬ ប៉ះពល់អ�កជំងឺរលកផ�ូវដេង�ម�សេដៀងផា� សយ១៤ ៃថ�មុនេនះ
Have you been near or in contact with a person who presented flu-like symptoms for the last 14 days❑មាន ❑មិនមាន ❑មិនដឹង If NO/DK >>> Go to Q 10
Yes No Don’t know 9.1. បានេនែក្បរ ឬ ប៉ះពល់អ�កជំងឺេនទីកែន�ងណា:____________________________
Specify the place?
10. បានេនែក្បរ ឬ ប៉ះពល់សត� ១៤ ៃថ�មុនេនះ
Have you been near or in contact with sick or dead animals for the past 14 days?❑មិនមាន ❑ សត�ក�ុង�ស�ក ❑សត�ៃ្រព ❑មិនដឹង If NO/DK >>> Go to Q 11
No Domestic animal Wild animal Don’t know 10.1. បានេនែក្បរ ឬ ប៉ះពល់សត�េនទីកែន�ងណា:____________________________
Has been near or in contact with animals anywhere 10.2. ក�ុងេនាះមានសត� ឈឺ ឬ ងប់ ែដរឬេទ? ❑មាន ❑មិនមាន ❑មិនដឹង
Any sick or dead animals among those animals? Yes No Don’t know
11. កំពុងមានប�� សុខភាព ❑មាន (សូមគូស √ រល់ចំេលយែដលមាន) ❑មិនមាន ❑មិនដឹង
Current health problem Please tick all available answers If NO/DK >>> Go to Q 12
❑ Heart disease ❑ Lung disease ❑ Neurologic disease ❑ Blood disease ❑ Kidney disease ❑ Liver disease ❑ Diabetes ❑ Cancer❑ TB ❑ HIV/AIDS ❑ Malnutrition ❑ Obesity❑ Other_____________________________________________
12. វត�ុវភិាគែដលបាន�សង់យកនិងប��ូ នេទមន�ីរពិេសធន៍ (សូមគូស √ រល់វត�ុវភិាគែដលមាន)
Sample(s) collected and sent to laboratory (Please tick all availablesamples) ❑ តម្បារ្រចមុះ/ បំពង់ក ❑ ឈម-េសរ ៉មូ ❑ េផ្សងេទៀត (Other)____________________
Nasal swap/throat Blood - serum ៃថ�/ែខ/ឆា� ំ ____/____/____ េឈ� ះអ�ក�សង់ៈ ______________ េលខទូរស័ព�: ___________
Date of sampling Name of sample collector Phone number 12.1. កែន�ងយកវត�ុវភិាគ ❑មន�ីរេពទ្យ/ គ�ីនិក ❑េនផ�ះ
Place of sampling Hospital/Clinic Home 12.2. ប��ូ នវត�ុវភិាគេទមន�ីរពិេសធន៍េឈ� ះ ________________ ៃថ�/ែខ/ឆា� ំ ____/____/____ Samples sent to laboratory (name) Date 13. ករ្រគប់្រគងនឹង ព្យោបាលេនមន�ីរេពទ្យ (សូមគូស √ ប�� ក់ )
Patient management and treatment (please tick)13. អ�កជំងឺស្រមាក់ក�ុងបន�ប់ដច់េដយែឡក ❑មាន ❑មិនមាន
Patient placed in a separate room Yes No 13.1. Intubation with assisted ventilation ❑មាន ❑មិនមាន ❑មិនដឹង
Yes No Don’t know 13.2. Continuous positive airway pressure (CPAP) ❑មាន ❑មិនមាន ❑មិនដឹង
Yes No Don’t know 13.4. Only medication:___________________________________
14. សរបុស� នភាពរបស់អ�កជំងឺៈ Summary of patient’s status
❑ កំពុងេនផ�ះ Staying athome
❑ កំពុងសំរកេនមន�ីរេពទ្យ េឈ� ះមន�ីរេពទ្យ:________________
Staying at the hospital Hospital name ៃថ�/ែខ/ឆា� ំចូលសំរកេពទ្យ:____/____/20____
Day / Month / Year of admission 15. ករប��ូ ន ❑មាន ❑មិនមាន If NO >>> Go to Q 16
Patienttransfer
Yes No
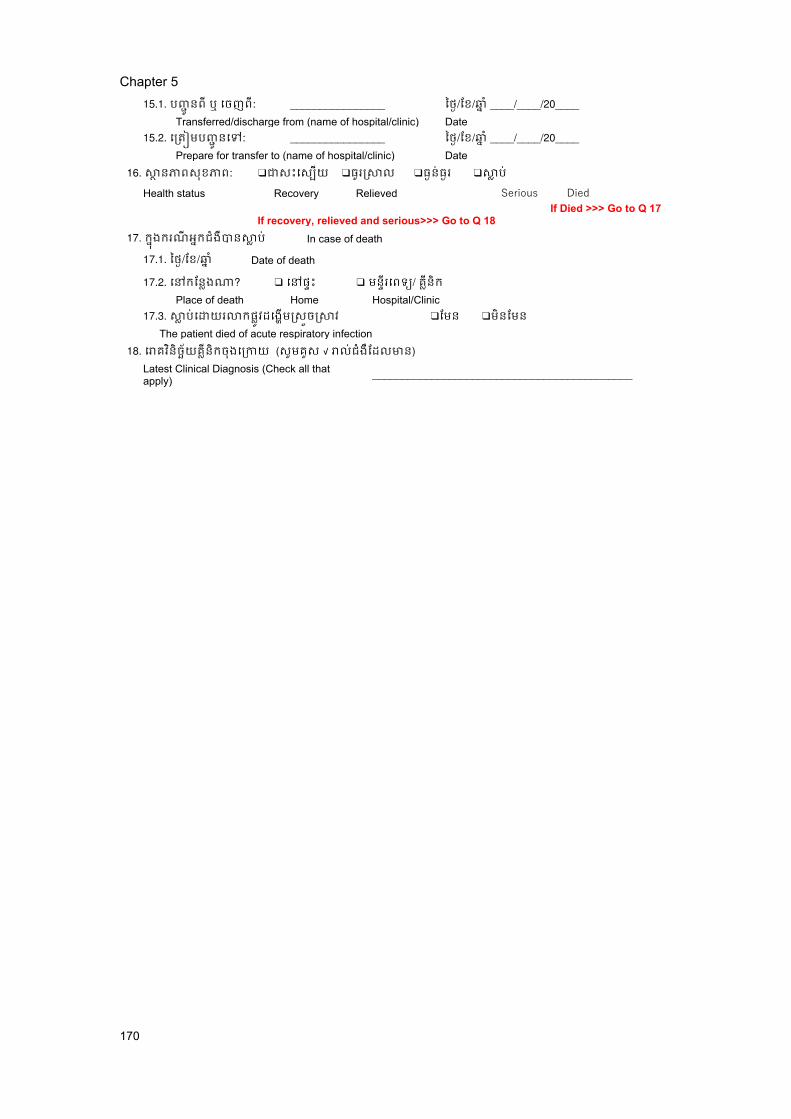
Chapter 5
170
15.1. ប��ូ នពី ឬ េចញពី: ________________ ៃថ�/ែខ/ឆា� ំ ____/____/20____
Transferred/discharge from (name of hospital/clinic) Date 15.2. េ្រត�មប��ូ នេទ: ________________ ៃថ�/ែខ/ឆា� ំ ____/____/20____
Prepare for transfer to (name of hospital/clinic) Date 16. ស� នភាពសុខភាព: ❑ជាសះេស្បយ ❑ធូរ�សល ❑ធ�ន់ធ�រ ❑ស� ប់
Health status Recovery Relieved Serious Died If Died >>> Go to Q 17
If recovery, relieved and serious>>> Go to Q 18 17. ក�ុងករណីអ�កជំងឺបានស� ប់ In case of death
17.1. ៃថ�/ែខ/ឆា� ំ Date of death
17.2. េនកែន�ងណា?
❑ េនផ�ះ ❑ មន�ីរេពទ្យ/ គ�ីនិក
Place of death Home Hospital/Clinic17.3. ស� ប់េដយរលកផ�ូវដេង�ម�ស�ច�សវ ❑ែមន ❑មិនែមន The patient died of acute respiratory infection
18. េរគវនិិច�័យគ�ីនិកចុងេ្រកយ (សូមគូស √ រល់ជំងឺែដលមាន)
Latest Clinical Diagnosis (Check all thatapply) ____________________________________________

Coronavirus Disease 2019 asymptomatic transmission: A cluster review in Cambodia, 2020
171
Annex 3: Questionnaire
Quantitative Interview with confirmed cases
No Question Answer Case ID Case ID nCovid_________________ Q1 At what grade did you complete at school? Grade_____ Q2 What is your job? _________________
Q3 Do you live in a concrete house or wood house?
1. Concrete house2. Wood house3.Other(specify )
Q4 Do you use air conditioner at home? 1. Yes2. No
Q5 How many household members do you have? ________________ Q6 On what date did you fly to Malaysia? DD____MM_____2020 Q8 When did you come back? DD____MM_____2020
Q9 Have you had any of the following symptoms during isolation at hospital?
1. Fever2. Cough3. Runny nose4. Sore throat5. Difficult to breath6. Loss of taste/smell7. Fatigue8. Body pain9. Diarrhoea10. Other(specify)
Q10. In the information you provided the health department earlier it is mentioned you had close contact with XX people. May you tell us a bit more detail what kind of interaction did you had?
Contact ID Relationship with the case (e.g. wife, son, friend, roommate)
Physical or non-physical contact (<2 meter)
Duration of interaction (<2 meter)
Type of interaction (e.g. same household, travelling in the same car, chatting in open air)
Qualitative Interview with confirmed cases
Q1 How many days were you in Malaysia?
Q2 How many people flew to join the event with you in Malaysia? Who are they?
Q3 How did you reach there from airport? Who was with you?

Chapter 5
172
Q4 Where did you stay when you were in Malaysia? Did you stay at the same place the whole time?
Q5 Who did you stay with?
Was this in the same room?
What was the ventilation like in this room?
Was anybody showing symptoms in the room?
Q6 How did you travel to and from the event? Who did you travel with? Q7 May you describe your main activities in Malaysia? Please give as much details as possible.
First day: ………………………………….
Second day: ………………………………
.
.
Last day: ……………………………………
Q8 Did you wear a mask of face covering? When? What type of covering?
Were there hand washing facilities at the event? How many times a day did
you use them?
Were you aware of COVID-19 before you travelled/before the event?
Did you take extra measures to protect yourself from COVID-19 in Malaysia?
If yes, why? If not, why not?
Q9 When you arrived home from Malaysia, did you stay home for 14 days in case you had COVID-19?
Did you do somethings to preventing your household members from COVID-
19? If yes, what did you do? If not, why?
Q10 When/If you developed symptoms – what measures did you take to stop others getting sick?
When you had symptoms – did you
o Go to the market
o Go to the mosque
o Go to your neighbour’s house
o Go to see family / friends
o Go to work
o Share a sleeping area
Other

173
Chapter 6 : Teaching

Chapter 6
174
(This page has been intentionally left blank)

Lesson learned from the field and teaching
175
Prologue
Rationale
This chapter demonstrates how I fulfill the two MAE program teaching requirements. First,
it requires that MAE students to choose a lesson they learned from the field (LFF) and
then teach a small learning group of MAE students within the cohort (MAE19). Each
learning group member participates in the LFFs of other members within the group.
Second, the MAE program requires that students form a small teaching group, choose a
topic, and teach first-year MAE students (MAE20). In addition to the required teachings, I
will also demonstrate in this chapter my contribution to local capacity building.
Lesson learned from the field
Sharing a lesson learned from the field (LFF) allows a small group of MAE students to
learn from each other. I was the third person sharing my LFF in my group. I shared my
experience in doing contact tracing in Cambodia. In my group, I had other members:
Laura Goddard, placement at Darwin Public Health Unit, Top End Health Service,
Northern Territory, Australia,
Elenor Kerr, placement at Queensland Health in Australia, The Pasteur Institute
Cambodia in Cambodia, Doherty Institute, and Victorian Department of Health and
Human Services in Australia, and
Hannah Vogt, placement at Metropolitan Communicable Disease Control at North
Metropolitan Health Service, and Communicable Disease Control Directorate at
the Department of Health in Western Australia
I chose this topic based on an informal discussion during the first session shared by Laura
Goddard. Other team members expressed their interest in “something about Cambodia”.
In April 2020, it was a time that Coronavirus Disease 2019 (COVID-19) was a common
topic to discuss. I was supporting Cambodia’s Communicable Disease Control
Department (CCDC) to do contact tracing. I thought this could be “something about
Cambodia” I should share.
Chapter 6
176
The purpose of my LFF was to help peers understand contact tracing in a low resource
setting like Cambodia as it was different from that of the settings they were working in
Australia. The specific objectives of LFF were to (1) understand the rationale of contact
tracing, (2) describe the steps of contact tracing in Cambodia, and (3) challenges and
lessons learned in contact tracing in Cambodia. The session lasted an hour and was
conducted through Zoom teleconference.
I used the “debriefing” method (1, 2) to share and examine what I had been doing using
slide presentations (Annex 1). I introduced Cambodia’s situation and my experience doing
contract tracing and asked other group members to share their situation and experience.
We had a lively discussion. The discussion was around how a COVID-19 patient’s privacy
was disclosed, difficulty balancing between keeping a patient’s privacy and ability to
identify the contacts, and using the “demonstrating” method (1, 2) to train other contact
tracers. I encouraged the discussion by asking questions to the group members to share
their experiences and opinions. Everyone was enthusiastic about sharing what they had
been doing and their views. No pre-reading was provided as some of us were members
of the COVID-19 response team needing time for emergency activities.
I did not conduct a formal evaluation at the end of my session, however my understanding
from our discussion there were areas which should be improved, such as adding a
practical exercise. By having an exercise, I would have given my teammates time to think,
so they could have provided better answers and therefore would have developed a deeper
understanding of my topic.
Teaching first-year MAE student
I joined a group of three MAE students for first-year student teaching, having Vannida
Douangboupha (National Centre for Laboratory and Epidemiology in Vientiane, Laos),
Kushani Marshall (National Center for Immunization Research and Surveillance), and
myself. As the COVID-19 pandemic disrupted the usual learning process, the MAE
program allowed us to choose one of our Lesson Learned from the Field (LFF) among our
team to teach the first-year students. I took part in all processes, including identifying the
teaching topic, discussing and creating the teaching plan, creating slide presentations,
commented on the evaluation form, and took part in teaching.
Lesson learned from the field and teaching
177
Our team decided to use Vannida’s LFF entitled “How to create a knowledge, attitude, and
practice survey.” It was a 30-minute teaching session through Zoom teleconference. The
objectives of that teaching were: (1) explain what a knowledge, attitude & practice (KAP)
survey is, (2) explain why we use KAP surveys, and (3) learn how to develop KAP survey
questions. The slide presentation used for this teaching is in Annex 2 of this chapter.
The 30 minutes were split into 10 minutes for teaching or three minutes for each team
member, eight minutes for students doing their tasks, eight minutes for students presenting
their team’s task, and four minutes for all students filling an online evaluation form. The
lesson plan can be found in Annex 3 of this chapter.
Our team used the “collaborating” method (1, 2), meaning students actively discussed in
their group and presented the result of the discussion with the larger group. We started by
introducing the theory and an example. Our first member, Kushani, presented the global
picture and Laos’s dengue epidemiology. I covered the second section introducing “what
the KAP is,” “why we use KAP,” and “how we use KAP.” Vannida covered the last section
demonstrating how KAP was used in dengue in Laos and gave the assignment to the
students.
A link to an online survey was sent to all students for feedback. We encouraged them to
complete the form immediately after the teaching was finished. When we got a result, my
team and I spent the time to discuss the evaluation results and lessons learned from the
teaching. Overall, the students indicated that the teaching was well planned and
organized, useful in improving knowledge on KAP surveys, and also useful in improving
skills to develop KAP survey questions. According to the feedback, the explanation we
provided was clear for the majority of the students. The main criticism we received was
that the session was a bit rushed at the ends.
Additional teaching experience
As part of capacity building, I provided two other trainings. First, I trained in creating
smartphone-based data collection form using Kobo Toolbox software
(https://www.kobotoolbox.org) for the Cambodian National Institute of Public Health staff.
Second, I trained contact tracers at the provincial and district level to respond to the spread
of Severe acute respiratory syndrome coronavirus 2 (SARS-CoV-2).
Chapter 6
178
Kobo Toolbox Training
Kobo Toolbox (https://www.kobotoolbox.org) is an open-source solution and provide free
server and storage. Individual researchers or research institute can easily register and use
it. It is designed to support data collection in limited resource settings.
Due to the increasing demand for smartphone/tablet-based forms for data collection, I was
informally invited to provide training on creating a smartphone/tablet-based data collection
form at the National Institute of Public Health (NIPH), Ministry of Health, Cambodia. Ten
staff of NIPH attended the training. It was a one-day training on Saturday, 20 July 2019. I
used the “demonstrating” method (1, 2). I started by asking participants to identify the
online data and discussed the advantages and disadvantages of non-commercial
platforms. I showed them all the steps from having a questionnaire in Microsoft Word to
have an electronic form in smartphone. Next, participants learned to do each step by
themselves including creating a user account on Kobo Toolbox. They learned to create a
short data collection form in Excel and uploaded the form to the Kobo Toolbox server,
downloaded the form to use in smartphone. I was with them to support them when they
had questions. The training helped them to understand the whole process to have an
electronic form in smartphone. However, they have to practice to get more familiarity.
COVID-19 Contact Tracing Training
In response to COVID-19 in Cambodia, I spent four months, from March 2020, to support
Cambodia’s Communicable Disease Control (CCDC). I was involved with contact tracing
and surveillance between the country’s 2nd and 124th cases.
I shared my contract tracing experience with the Rapid Response Team (RRT) in other
provinces to support actual contract tracing and COVID-19 preparedness. In the provinces
where the COVID-19 cases were detected, with the CCDC team, we provided a short
contract tracing training using the “demonstrating” method (1, 2). This method mixes the
theory and the demonstration of how we do things. We presented participants with the
rationale and process of contract tracings. We help them get familiar with the existing
materials and reporting flow. We demonstrated the actual activities in their areas. RRT
teams learned it, and they were confident in doing it in a short time. We left them after two
to three days.
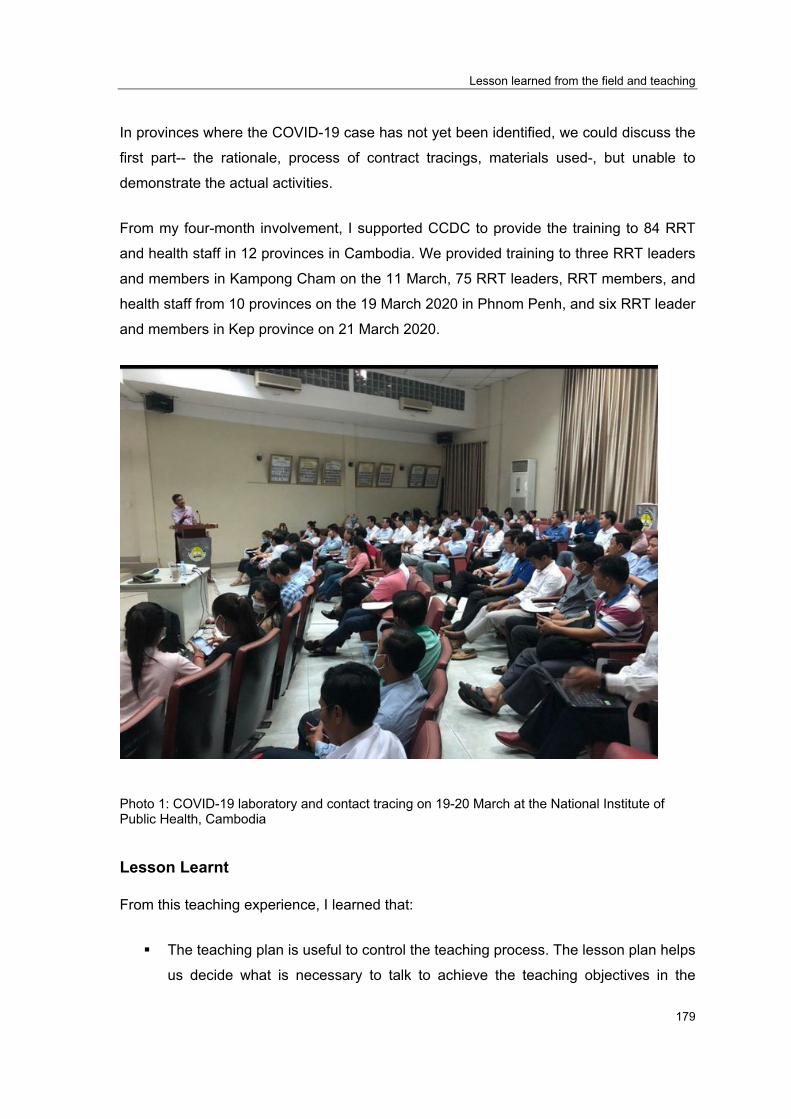
Lesson learned from the field and teaching
179
In provinces where the COVID-19 case has not yet been identified, we could discuss the
first part-- the rationale, process of contract tracings, materials used-, but unable to
demonstrate the actual activities.
From my four-month involvement, I supported CCDC to provide the training to 84 RRT
and health staff in 12 provinces in Cambodia. We provided training to three RRT leaders
and members in Kampong Cham on the 11 March, 75 RRT leaders, RRT members, and
health staff from 10 provinces on the 19 March 2020 in Phnom Penh, and six RRT leader
and members in Kep province on 21 March 2020.
Photo 1: COVID-19 laboratory and contact tracing on 19-20 March at the National Institute of Public Health, Cambodia
Lesson Learnt
From this teaching experience, I learned that:
The teaching plan is useful to control the teaching process. The lesson plan helps
us decide what is necessary to talk to achieve the teaching objectives in the
Chapter 6
180
permitted time. Practice teaching using our lesson plan, again and again, allow us
to reduce unnecessary content. During the actual teaching, it helps us to overcome
nervousness if we are new to teaching.
Different contexts need different teaching methods. In my case, I used a different
types of approaches, including the “debriefing” method for a small group learning
that all members were knowledgeable about the topic and could share their opinion
contributing to learning, “demonstrating” method to train RRT team as they needed
to learn the actual activities urgently, and “collaborating” to teach students who
have varied background and expertise.
Hands-on training may be suitable in emergency situations. In an emergency,
people are overwhelmed with competing priorities. The teaching should be focused
on what is critical to know and worth spending time with.

Lesson learned from the field and teaching
181
Reference
1. Wikipedia. Teaching method: Wikipedia; 2020 [updated 28 November 2020. Availablefrom: https://en.wikipedia.org/wiki/Teaching_method.
2. Eric Gill. What is Your Teaching Style? 5 Effective Teaching Methods for Your Classroom:Resilent Educator; 2020 [Available from: https://resilienteducator.com/classroom-resources/5-types-of-classroom-teaching-styles/.

Chapter 6
182
Annex 1: Slide presentation used for Lesson Learned from the field
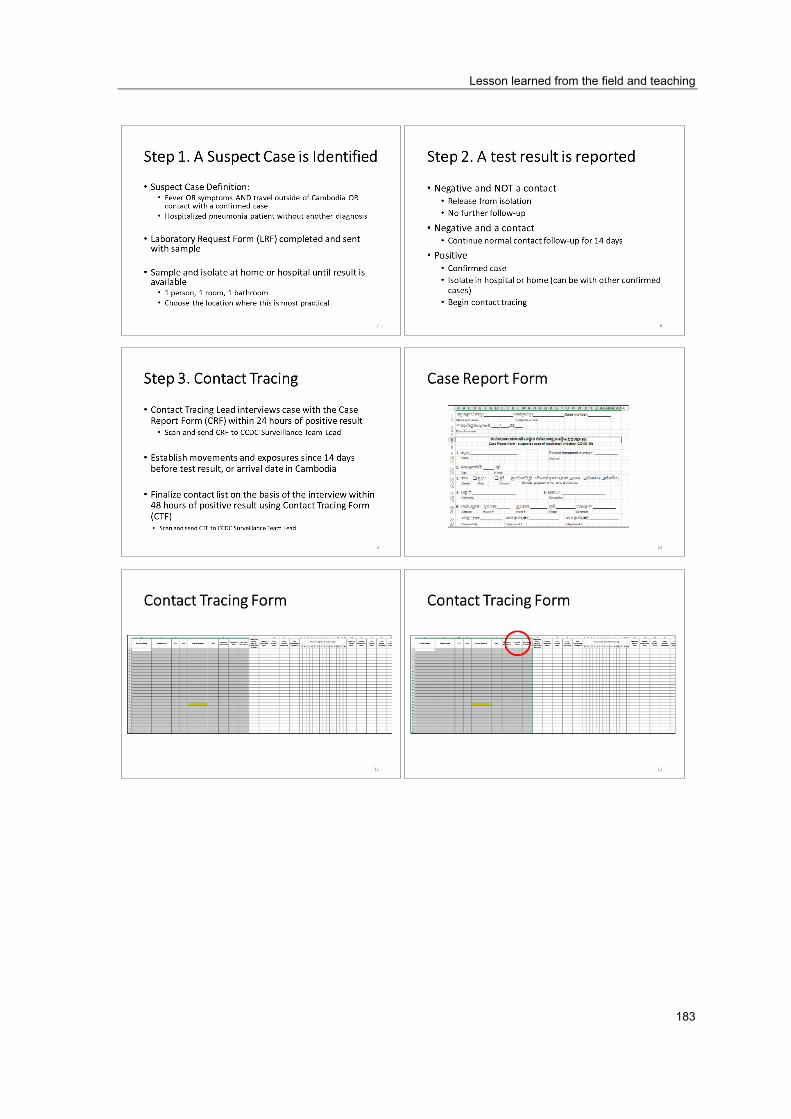
Lesson learned from the field and teaching
183
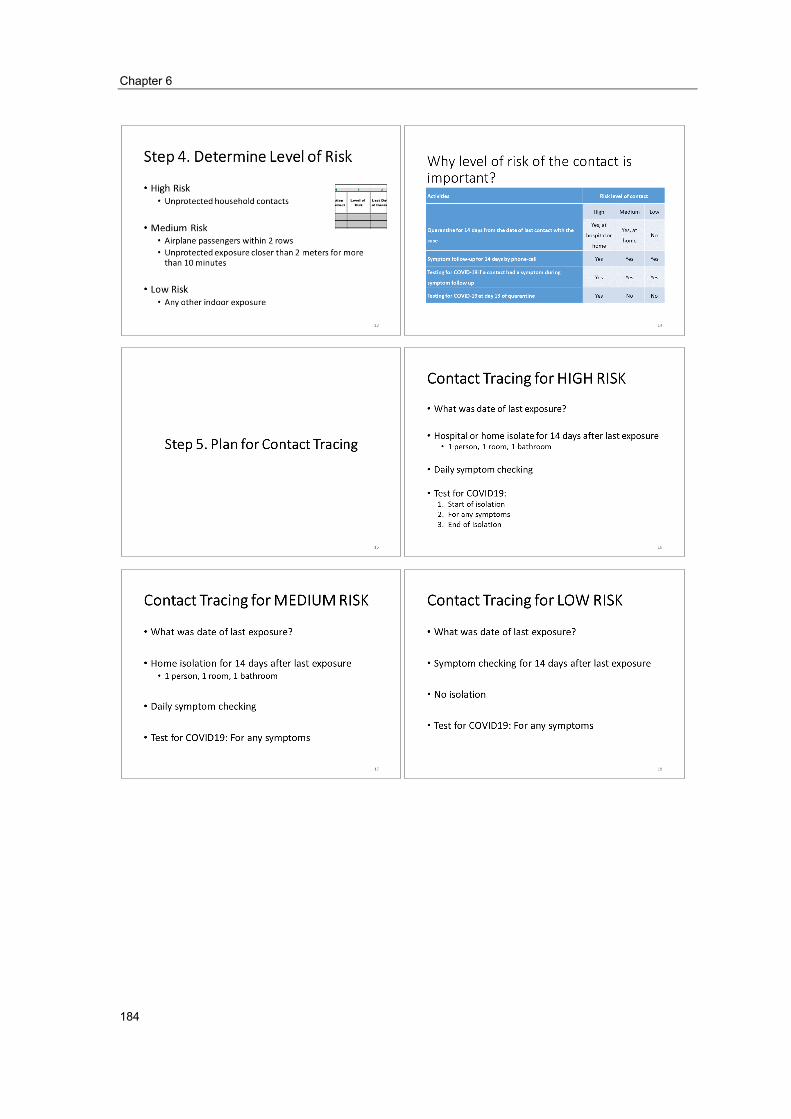
Chapter 6
184
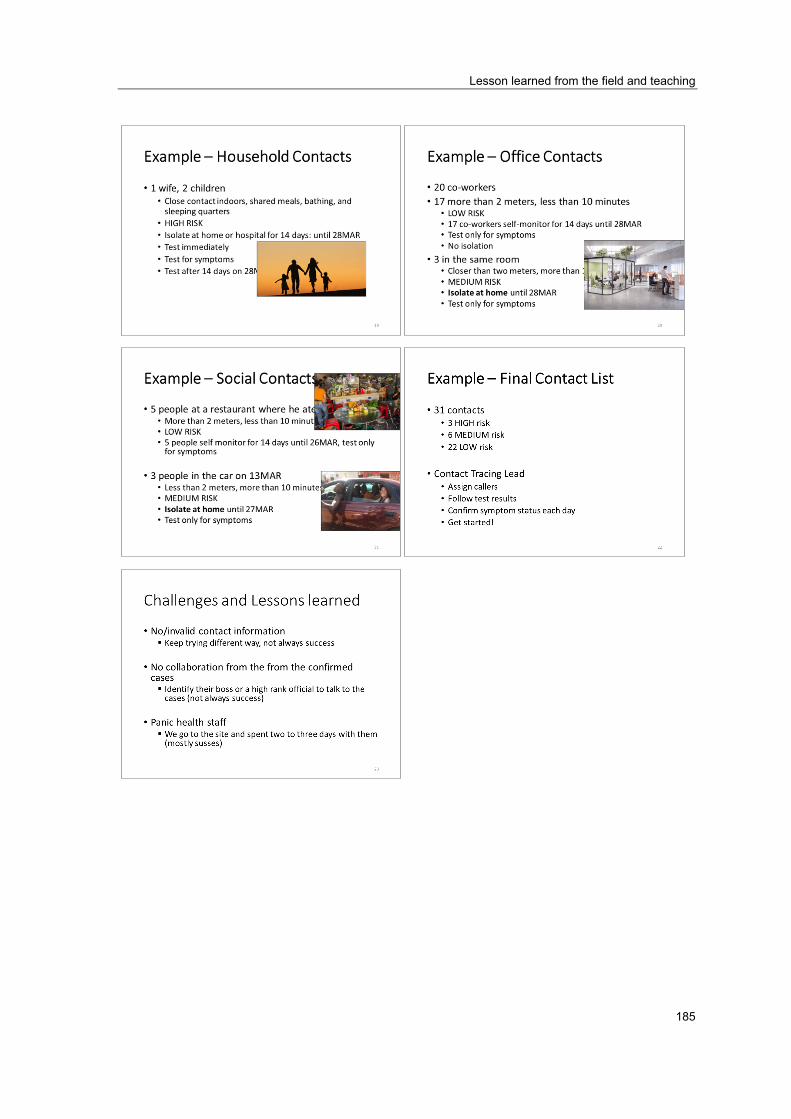
Lesson learned from the field and teaching
185
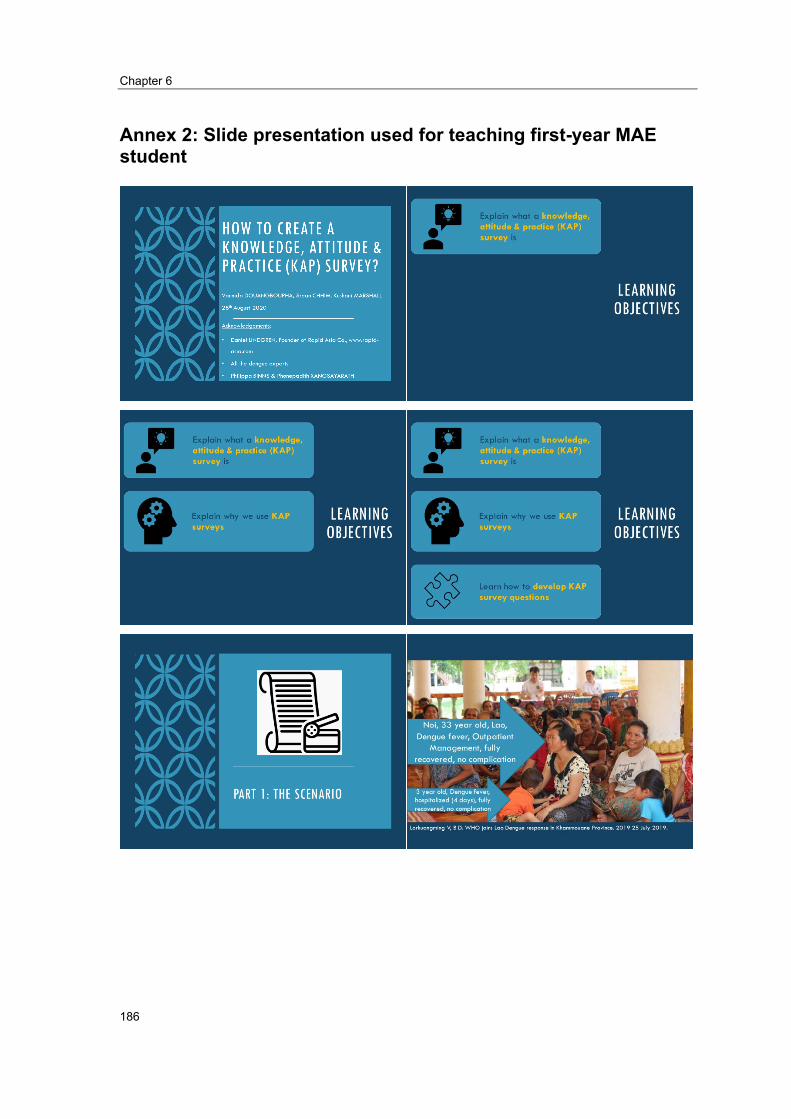
Chapter 6
186
Annex 2: Slide presentation used for teaching first-year MAE student
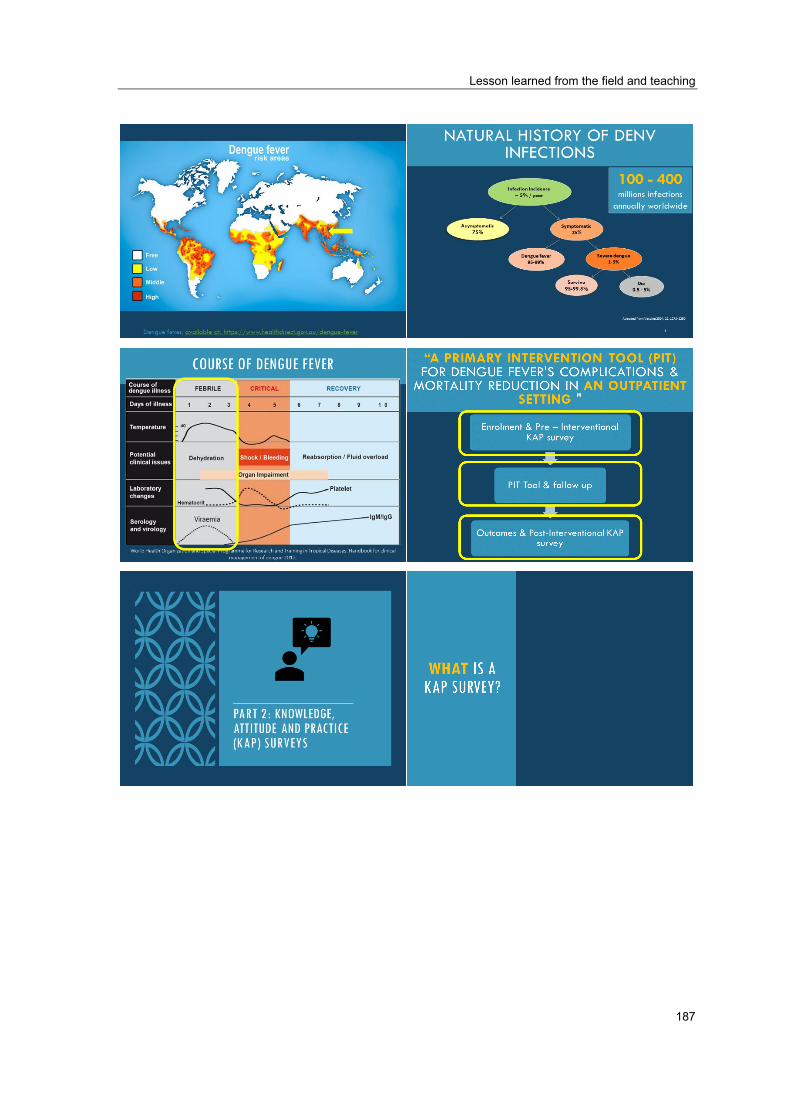
Lesson learned from the field and teaching
187

Chapter 6
188

Lesson learned from the field and teaching
189

Chapter 6
190
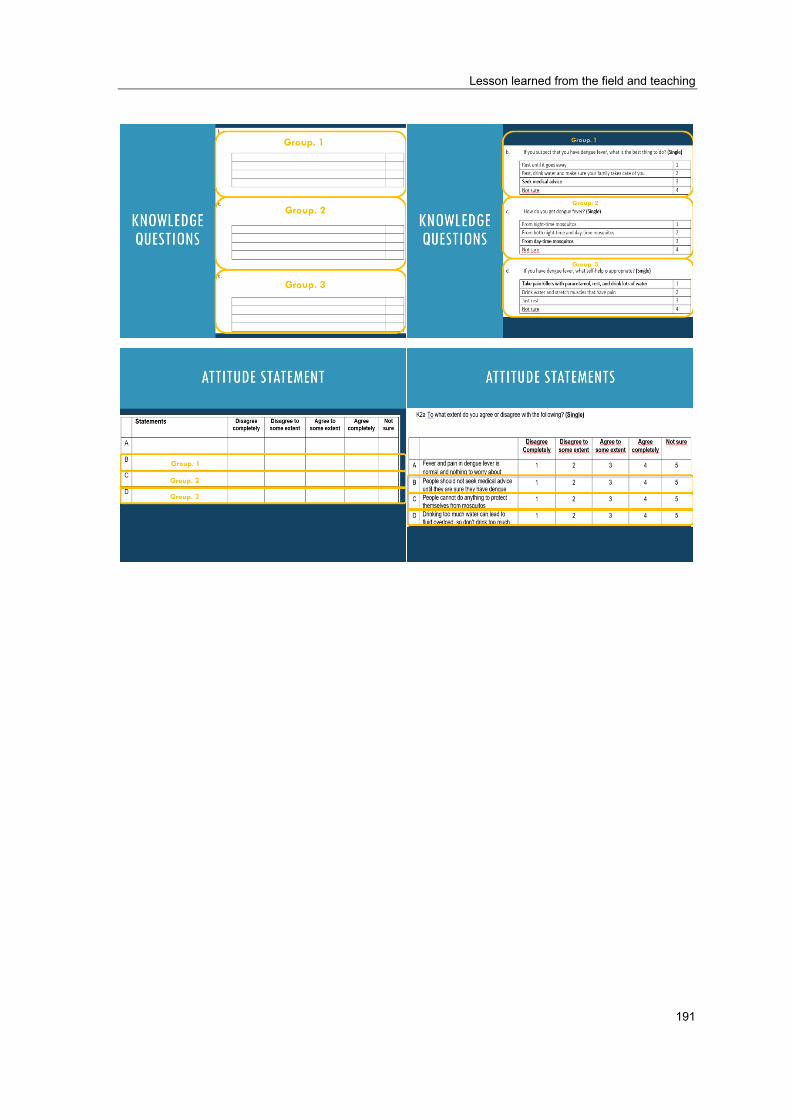
Lesson learned from the field and teaching
191

Chapter 6
192

Lesson learned from the field and teaching
193
Annex 3: Teaching session outline
Date of session
Friday 28 August 2020
Leads Kushani, Srean, Vannida Topic How to create knowledge, attitude, and practice (KAP) survey questions using KAP
Score model Session Outlines
What is a KAP (Knowledge, Attitude and Practice) survey? When would you use a KAP survey? KAP examples What is the KAP Score model? When would you use a KAP Score Model? Introduce the dengue scenario Students practice developing KAP survey questions based on the top five dengue KAP from dengue experts. Students report back on their KAP survey questions and provide useful feedback and tips. Wrap up and evaluation.
Learning Objectives
Students are able to: Explain what a KAP survey is and when to use it. Explain what a KAP Score model is and when to use it. Practice developing KAP survey questions and apply these to a real-life scenario
Teaching
Introduce KAP surveys as a useful tool to help researchers to gain quantitative and qualitative insight into a topic/issue. Based on the given scenario, guide students to develop KAP Score questions and agree on tips on developing KAP score questions, including identify the top five knowledge, five attitudes, and five practices, where the KAP questions will be based on if feasible, seek input from experts in the field
Activity & Assessment
Students will be divided into groups of 3-4 to develop one knowledge, one attitude, and one practice question. These should be based on the provided scenario and the top five dengue KAP from dengue experts. Each group will present their KAP survey questions back to the class, and students will be asked to provide feedback on each group’s suggestions.
Time 3 mins – intro to KAP surveys and examples 3 mins – intro to KAP Score model and explanation 3 mins – intro to the scenario 8 mins – each group develops 3 KAP survey questions based on the scenario 8 mins – feedback of KAP survey questions to groups, wrap up and evaluation

Chapter 6
194