applications of the national institute of standards and
TRANSCRIPT

J. Vac. Sci. Technol. A 39, 063205 (2021); https://doi.org/10.1116/6.0001261 39, 063205
© 2021 Author(s).
Applications of the National Instituteof Standards and Technology (NIST)database for the simulation of electronspectra for surface analysis for quantitativex-ray photoelectron spectroscopy ofnanostructuresCite as: J. Vac. Sci. Technol. A 39, 063205 (2021); https://doi.org/10.1116/6.0001261Submitted: 05 July 2021 . Accepted: 19 August 2021 . Published Online: 13 September 2021
Wolfgang S. M. Werner, and Cedric J. Powell
COLLECTIONS
Paper published as part of the special topic on Commemorating the Career of Charles S. Fadley
ARTICLES YOU MAY BE INTERESTED IN
Strong effect of scandium source purity on chemical and electronic properties of epitaxialScxAl1−xN/GaN heterostructures
APL Materials 9, 091106 (2021); https://doi.org/10.1063/5.0054522
Comment on “Underlying simplicity of 5f unoccupied electronic structure” [J. Vac. Sci.Technol. A 39, 043205 (2021)]Journal of Vacuum Science & Technology A 39, 066001 (2021); https://doi.org/10.1116/6.0001315
Hybrid molecular beam epitaxy growth of BaTiO3 films
Journal of Vacuum Science & Technology A 39, 040404 (2021); https://doi.org/10.1116/6.0001140

Applications of the National Institute of Standardsand Technology (NIST) database for the simulationof electron spectra for surface analysis forquantitative x-ray photoelectron spectroscopyof nanostructures
Cite as: J. Vac. Sci. Technol. A 39, 063205 (2021); doi: 10.1116/6.0001261
View Online Export Citation CrossMarkSubmitted: 5 July 2021 · Accepted: 19 August 2021 ·Published Online: 13 September 2021
Wolfgang S. M. Werner1,a) and Cedric J. Powell2
AFFILIATIONS
1Institut für Angewandte Physik, Vienna University of Technology, Wiedner Hauptstrasse 8-10, A 1040 Vienna, Austria2Associate, Materials Measurement Science Division, National Institute of Standards and Technology, Gaithersburg,
Maryland 20899-8370
Note: This paper is a part of the Special Collection Commemorating the Career of Charles S. Fadley.a)Author to whom correspondence should be addressed: [email protected]
ABSTRACT
SESSA (Simulation of Electron Spectra for Surface Analysis) is a software that was frequently used by the late Charles Fadley, since it providesa convenient means to simulate peak intensities as well as entire spectral regions for photoelectron spectroscopy. X-ray photoelectronspectra can be simulated for several types of nanostructures. SESSA can also be utilized in more complex cases, e.g., if the nondipolar terms inthe photoelectric ionization cross section need to be taken into account, a typical situation encountered in spectroscopy using synchrotronradiation. The software was initially released in 2005 as a National Institute of Standards and Technology Standard Reference Database.Here, we describe two new features that have recently been added to the newest version (SESSA V2.2) of the software, i.e., simulation ofsurface excitations and an effective approach to account for the energy dependence of the interaction characteristics of emitted photoelec-trons. Furthermore, we illustrate some functionalities of SESSA by presenting several applications. These include overlayer measurements todetermine the effective electron attenuation length, quantitative analysis of impurities in multilayer materials, analysis of ionic liquids, theinfluence of nondipolar effects for photon energies above a few keV, and analysis of nanoparticles by means of photoelectron spectroscopy.
© 2021 Author(s). All article content, except where otherwise noted, is licensed under a Creative Commons Attribution (CC BY) license(http://creativecommons.org/licenses/by/4.0/). https://doi.org/10.1116/6.0001261
I. INTRODUCTION
The late Charles (Chuck) Fadley published a large number ofpapers that described applications of x-ray photoelectron spectro-scopy (XPS) to a wide range of advanced materials. In recent years,these investigations included studies of the electronic structure of thedilute magnetic semiconductor Ga1�xMnxP with so-called hard XPS(also known as HAXPES),1 characterization of free-standing InAsquantum membranes by standing-wave HAXPES,2 unexpected ter-mination switching and polarity compensation in LaAlO3=SrTiO3
heterostructures,3 and structural studies of an epitaxial Fe/MgO
multilayer magnetic tunnel junction with standing-wave HAXPES.4
These investigations were aided by the use of the National Instituteof Standards and Technology (NIST) Database for the Simulation ofElectron Spectra for Surface Analysis (SESSA).5,6
SESSA can be used to simulate XPS spectra of multilayer films aswell as nanostructures such as islands, lines, spheres, and layeredspheres on surfaces. As for earlier versions, such simulations can beperformed for multilayer films. Users can specify the compositionsand dimensions of each material in the sample structure as well asthe measurement configuration. SESSA contains the physical data
ARTICLE avs.scitation.org/journal/jva
J. Vac. Sci. Technol. A 39(6) Nov/Dec 2021; doi: 10.1116/6.0001261 39, 063205-1
© Author(s) 2021

needed to perform quantitative interpretation of an XPS spectrum fora specimen of given composition and morphology. XPS spectra canbe simulated for the specified sample structure and measurementconditions, and the simulated spectra can be compared with mea-sured spectra. Compositions and dimensions can then be adjusted tofind maximum consistency between simulated and measured spectra.
In this paper, we outline the structure and operation of thesoftware and briefly describe newer features of SESSA that have beenadded since its release in 2005.7 Owing to the very general structureof the SESSA software, it can be used for a large range of analyticalapplications involving XPS intensities and spectral shapes. Theaccuracy with which SESSA can be used to quantitatively predict XPSsignal intensities has been tested in various ways by comparingresults of SESSA simulations with different models specifically devel-oped for a given problem. In Sec. III, we present examples of SESSA
that illustrate how it can be utilized for various tasks involved inquantifying XPS intensities.
II. FUNCTIONALITIES OF SESSA
SESSA contains physical data needed to perform quantitativeinterpretation of an XPS spectrum or an Auger-electron spectrum(AES) for a specimen of given composition and morphology (differ-ential inverse inelastic mean free paths (IMFPs), total inelastic meanfree paths, differential elastic-scattering cross sections, totalelastic-scattering cross sections, transport cross sections, photoioniza-tion cross sections, photoionization asymmetry parameters,electron-impact ionization cross sections, photoelectron line shapes,Auger-electron line shapes, fluorescence yields, and Auger-electronbackscattering factors). Retrieval of relevant data is performed by asmall expert system that queries the comprehensive databases. Asimulation module provides an estimate of peak intensities as well asthe peak spectra. A user can select data values from two or moredatabases for each parameter or even, if desired, insert their ownvalues. Users can also choose a particular function (Lorentzian,Gaussian, or Doniach–Sunjic) to describe the intrinsic shape of aphotoelectron line. There is also an “Empirical” option with which atext file can be entered into SESSA that could, for example, be anexperimental line shape or the line shape from a function that wasconsidered to be appropriate for a particular peak.8
The design of the SESSA software allows the user to enter therequired information in a reasonably simple way. The modularstructure of the user interface closely matches that of the usualcontrol units on a real instrument. Any user who is familiar with atypical XPS spectrometer can perform a retrieval/simulation opera-tion with the SESSA software in a few minutes for a specimen with agiven composition and morphology. A command line interface canalso control the software; this feature allows users to load sequencesof commands that facilitate simulations for similar conditions.
SESSA was initially designed to simulate XPS and AES spectrafrom multilayer thin-film structures. Users could specify the compo-sitions and dimensions of each material in the structure as well asthe measurement configuration, and the simulated spectra could becompared with measured spectra. The simulation of electron spectrain SESSA employs the trajectory-reversal Monte Carlo method,9
making it highly efficient: simulation of a full spectrum typicallytakes a fraction of a second on a modern personal computer.
Since the release of Version 1 of SESSA in 2005,5 later versionshave incorporated additional data and capabilities. These enhance-ments have included the ability to perform simulations with polar-ized x rays and to make these simulations with nondipolephotoionization cross sections. The former improvement is neces-sary for simulations relevant to XPS at synchrotron light sourceswhile the latter is required for simulations with x-ray energieslarger than about 2 keV.
Version 2.0 of SESSA10 was released in 2014 with additional
capabilities for specifying specimen nanomorphologies (such asislands, lines, spheres, and layered spheres on surfaces). Thisversion allows users to create new sample morphologies with thePENGEOM geometry package.11 For this and subsequent releases,additional databases have been added for inelastic mean free pathsand for electron-impact ionization cross sections. Version 2.2 wasreleased in March 2021.12 It contains a new database for inelasticmean free paths and the two new functionalities described below.
A. Modeling surface excitations
A simple model for surface excitations induced by Auger orphotoelectrons escaping from semi-infinite solids with planar sur-faces and energy losses suffered as a consequence has been imple-mented in SESSA.13,14 Surface excitations are additional modes of theinelastic-scattering process in the bulk of a material and are a con-sequence of the boundary conditions of Maxwell’s equations nearan interface between media with different dielectric constants, inthe present case the sample and the vacuum. The starting point ofthis model is the so-called partial intensity approach based on thecontribution of the spectrum of electrons that have participated acertain number of times in specific scattering processes.15 Thedepth range where surface excitations take place is very shallowinside the solid, although surface excitations also take place invacuum when the probing electron still interacts with the solid-stateelectrons. When the path length of escaping electrons inside thesurface-scattering zone is sufficiently small compared to the charac-teristic mean free path for deflections, the passage through thesurface-scattering zone is approximately rectilinear, and the partialintensities for bulk and surface scattering are uncorrelated,13,16,17
Cnb ,ns ¼ Cnb � Cns , (1)
where nb and ns are the collision numbers for bulk and surfacescattering, respectively. Rectilinear passage also implies that theprobability for plural surface scattering is governed by the Poissonstochastic process,
Cns (E, θ) ¼hns(E, θ)ins
ns!e�hns(E,θ)i, (2)
where hns(E, θ)i is the average number of surface excitationsduring a single surface crossing with energy E and angle θ (withrespect to the surface normal). Different physical models have beenproposed in the literature for the average number of surface excita-tions, qualitatively expressing the fact that hns(E, θ)i shouldroughly be proportional to the time the electron spends in thesurface-scattering zone. The result by Oswald,18 based on the work
ARTICLE avs.scitation.org/journal/jva
J. Vac. Sci. Technol. A 39(6) Nov/Dec 2021; doi: 10.1116/6.0001261 39, 063205-2
© Author(s) 2021
of Stern and Ferrell19 is given as
hns(E, θ)i ¼ 1
aDBffiffiffiE
pcos θ þ 1
: (3)
An alternative mathematical form for hns(E, θ)i is20,21
hns(E, θ)i ¼ 1
aDBffiffiffiE
pcos θ
: (4)
Note that the material parameter aDB in Eq. (4) is generally defineddifferently in the literature. Here the reciprocal value is used toensure consistency with Eq. (3). Following the convention in theliterature,14 the quantity aDB will be referred to as the “surface exci-tation parameter” (SEP) in the following. Databases for the SEPhave been implemented in SESSA from which the average number ofsurface excitations is calculated as indicated in Table I.
Concerning the reliability of the databases available withinSESSA for a specific material, the use of the empirical databases isrecommended (SEP01 or SEP02). If a datum is available for thematerial in question this has been proven to describe correspondingelectron energy loss spectra quantitatively. Alternatively, it is rec-ommended to use the empirical formula (SEP03), which can beused as a guide for calculating values of the SEP. The above choicesare generally expected to be more realistic than the estimates fornearly free-electron materials (SEP04 and SEP05).
In analogy to the case of bulk excitations (see, e.g., Ref. 22),the distribution of energy losses T in a single surface excitation,ws(T), the so-called differential surface excitation parameter isintroduced. To account for the passage through the surface scatter-ing zone, the spectrum Y(E, θ) in the partial intensity approach isgiven by
Y(E, θ) ¼XNmax
ns¼0
Cns (E, θ)ð10YBulk(E þ T , θ)Lns (T) dT , (5)
where YBulk(E, θ) is the bulk spectrum and the partial loss distribu-tions for surface excitations Lns (T) are calculated from a self-convolution of ws(T), and Nmax is the maximum number of surface
excitations which is considered (usually Nmax ¼ 2 to 5 represents agood choice).
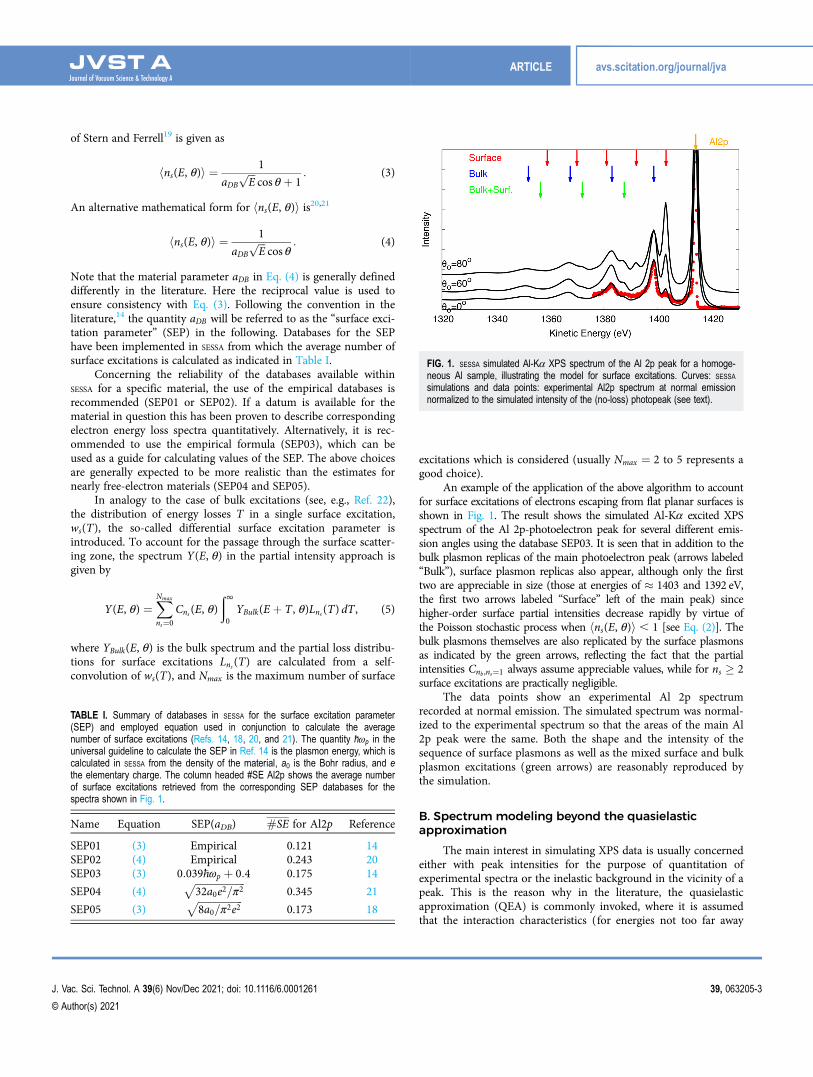
An example of the application of the above algorithm to accountfor surface excitations of electrons escaping from flat planar surfaces isshown in Fig. 1. The result shows the simulated Al-Kα excited XPSspectrum of the Al 2p-photoelectron peak for several different emis-sion angles using the database SEP03. It is seen that in addition to thebulk plasmon replicas of the main photoelectron peak (arrows labeled“Bulk”), surface plasmon replicas also appear, although only the firsttwo are appreciable in size (those at energies of � 1403 and 1392 eV,the first two arrows labeled “Surface” left of the main peak) sincehigher-order surface partial intensities decrease rapidly by virtue ofthe Poisson stochastic process when hns(E, θ)i , 1 [see Eq. (2)]. Thebulk plasmons themselves are also replicated by the surface plasmonsas indicated by the green arrows, reflecting the fact that the partialintensities Cnb ,ns¼1 always assume appreciable values, while for ns � 2surface excitations are practically negligible.
The data points show an experimental Al 2p spectrumrecorded at normal emission. The simulated spectrum was normal-ized to the experimental spectrum so that the areas of the main Al2p peak were the same. Both the shape and the intensity of thesequence of surface plasmons as well as the mixed surface and bulkplasmon excitations (green arrows) are reasonably reproduced bythe simulation.
B. Spectrum modeling beyond the quasielasticapproximation
The main interest in simulating XPS data is usually concernedeither with peak intensities for the purpose of quantitation ofexperimental spectra or the inelastic background in the vicinity of apeak. This is the reason why in the literature, the quasielasticapproximation (QEA) is commonly invoked, where it is assumedthat the interaction characteristics (for energies not too far away
FIG. 1. SESSA simulated Al-Kα XPS spectrum of the Al 2p peak for a homoge-neous Al sample, illustrating the model for surface excitations. Curves: SESSA
simulations and data points: experimental Al2p spectrum at normal emissionnormalized to the simulated intensity of the (no-loss) photopeak (see text).
TABLE I. Summary of databases in SESSA for the surface excitation parameter(SEP) and employed equation used in conjunction to calculate the averagenumber of surface excitations (Refs. 14, 18, 20, and 21). The quantity �hωp in theuniversal guideline to calculate the SEP in Ref. 14 is the plasmon energy, which iscalculated in SESSA from the density of the material, a0 is the Bohr radius, and ethe elementary charge. The column headed #SE Al2p shows the average numberof surface excitations retrieved from the corresponding SEP databases for thespectra shown in Fig. 1.
Name Equation SEP(aDB) #SE for Al2p Reference
SEP01 (3) Empirical 0.121 14SEP02 (4) Empirical 0.243 20SEP03 (3) 0:039�hωp þ 0:4 0.175 14
SEP04 (4)ffiffiffiffiffiffiffiffiffiffiffiffiffiffiffiffiffiffiffiffi32a0e2=π2
p0.345 21
SEP05 (3)ffiffiffiffiffiffiffiffiffiffiffiffiffiffiffiffiffiffi8a0=π2e2
p0.173 18
ARTICLE avs.scitation.org/journal/jva
J. Vac. Sci. Technol. A 39(6) Nov/Dec 2021; doi: 10.1116/6.0001261 39, 063205-3
© Author(s) 2021

from the photopeak) do not depend on the energy. In the presentcontext, the term “interaction parameters” mainly refers to theIMFP and the elastic-scattering cross section. This approximationyields the exact result for the zero-loss peak, often referred to as theelastic peak or simply the photoelectron “peak.” If a significantenergy loss range is of interest, as, for example, for inelastic-background analysis to obtain information about the sample mor-phology, the quasielastic approximation may become invalid and itwould be desirable to account for the energy dependence of theinteraction characteristics in the simulation in some way. In princi-ple, this can be achieved by employing the so-called direct simula-tion approach in a Monte Carlo simulation.23 However, thisprocedure comes at the cost of increased complexity and a severedecrease in computational efficiency, and, moreover, it is strictlyimpossible to combine a direct simulation approach with thetrajectory-reversal algorithm since the latter is based on Case’s reci-procity theorem for one speed transport.24
A simple and effective workaround has been proposed inRef. 25. There, it is observed that the partial intensity approach isconceptually similar to the multispeed approximation employed in
the numerical solution of the transport equation in neutronphysics,26 in which the particle flux is divided into groups within acertain speed interval. In a statistical sense, the nth order partialintensities correspond to the group of particles within a certainspeed range. Since their intensity is governed by the Poisson distri-bution after n collisions [see Eq. (8)] and, therefore, by the inelasticmean free path after n inelastic collisions, a simple, yet effective,way to account for the energy dependence of the interaction char-acteristics is to multiply the peak spectrum YQEA(E) by the energydependence of the inelastic mean free path,
YQEAþ (E) ¼ YQEA(E)� λ(E)λ(E0)
, (6)
where λ(E) is the IMFP for energy E and λ(E0) is the IMFP forenergy E0 of the photoelectron peak. We refer to this procedure asthe QEAþ-approximation.
One of the underlying implications of this type of approxima-tion is that the energy dependence of the elastic interaction is negli-gible. For sufficiently smooth initial angular distributions at thesource, where the photoionization takes place, the so-called gener-alized radiative field similarity principle27 states that the details ofthe elastic cross section do not essentially affect the path length dis-tribution and hence the partial intensities will mainly change dueto the energy dependence of the inelastic mean free path, which isapproximately accounted for by Eq. (6). Indeed the distribution ofpath lengths for Auger- or photoelectrons is not significantlyaffected by the energy dependence of the elastic-scattering crosssection. This makes the QEAþ-approximation an effectiveapproach in true slowing down problems even for a sharply peakedinitial angular distribution, such as for reflection of a focused beamof electrons from a surface.28
A comparison between the QEA (curve labeled QEA) andQEAþ (curve labeled QEA+) approximation is shown in Fig. 2.Panel (a) represents the case of a homogeneous Al sample, while inpanel (b) the resulting simulated spectra for a core-shell nanoparti-cle with a 12 nm gold core and a 1 nm silver shell are shown. Theemployed nanoparticle is schematically illustrated in panel (b).The curve labeled “QEA” in panel (b) represents the quasielasticapproximation (QEA) while the curve labeled QEA+ is theQEAþ-approximation [Eq. (6)] and the curve labeled “SDN” is thetrue slowing down (SDN) Monte Carlo calculation, which isthe most realistic.25 It is seen that the quasielastic approximation issatisfactory for energy losses ΔE less than about 10% of the initialenergy and the effect of the change in the interaction characteristicsbecomes noticeable only if a broader energy range is considered.
III. APPLICATIONS
A. Attenuation length measurements over a wideenergy range using the overlayer method
Our first example of an application of SESSA concerns measure-ments of effective attenuation lengths (EALs) for the measurementof overlayer-film thicknesses, LTH , by XPS. In the early days ofXPS, many measurements were made of these EALs to obtain mea-sures of the surface sensitivity of XPS.29–32 At this time (prior to1980), the effects of elastic scattering of photoelectrons had not
FIG. 2. Comparison of the QEAþ approximation to account for the variation ofthe interaction characteristics with energy. (a) For a homogeneous Al sampleand (b) for a core-shell nanoparticle with a 12 nm gold core and a 1 nm silvershell, schematically illustrated in the inset. Solid curve labeled “QEA”: quasielas-tic approximation; solid curve labeled “QEAþ”: QEAþ-approximation [Eq. (6)];and solid curve labeled “SDN”: SDN Monte Carlo calculation (Ref. 25).
ARTICLE avs.scitation.org/journal/jva
J. Vac. Sci. Technol. A 39(6) Nov/Dec 2021; doi: 10.1116/6.0001261 39, 063205-4
© Author(s) 2021
been recognized, and it was commonplace then to refer to the mea-sured quantities as attenuation lengths, IMFPs, and escape depths.Each of these terms now has a separate meaning and definition.33
EAL measurements were typically made by depositing anoverlayer film on a substrate material and measuring changes inthe intensities of photoelectron signals from the film and substratematerials as a function of film thickness. A number of simplifyingassumptions were made in conducting these experiments and ininterpreting the results.33 One major assumption was that the over-layer film was homogeneous and of uniform thickness. Althoughno direct assessments could then be made of film uniformity, itwas assumed that exponential increases or decreases of signalintensities with increasing film thickness were reliable indicationsof film uniformity. Similarly, deviations from exponential depen-dences were indications that the film was not uniform, and theresults were typically discarded.
We will now summarize an analysis of EAL measurements forgold by Rubio-Zuazo and Castro (RZC)34 that were made bydepositing thin films of gold on a polycrystalline copper substrate.35
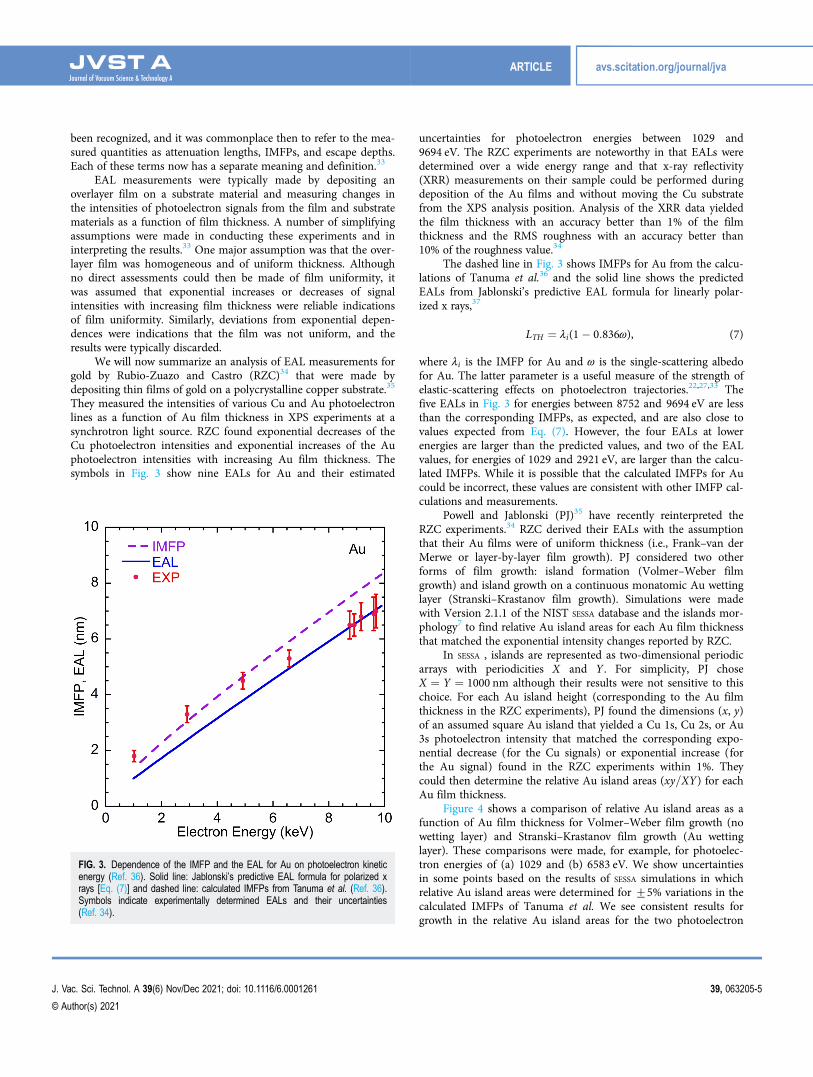
They measured the intensities of various Cu and Au photoelectronlines as a function of Au film thickness in XPS experiments at asynchrotron light source. RZC found exponential decreases of theCu photoelectron intensities and exponential increases of the Auphotoelectron intensities with increasing Au film thickness. Thesymbols in Fig. 3 show nine EALs for Au and their estimated
uncertainties for photoelectron energies between 1029 and9694 eV. The RZC experiments are noteworthy in that EALs weredetermined over a wide energy range and that x-ray reflectivity(XRR) measurements on their sample could be performed duringdeposition of the Au films and without moving the Cu substratefrom the XPS analysis position. Analysis of the XRR data yieldedthe film thickness with an accuracy better than 1% of the filmthickness and the RMS roughness with an accuracy better than10% of the roughness value.34
The dashed line in Fig. 3 shows IMFPs for Au from the calcu-lations of Tanuma et al.36 and the solid line shows the predictedEALs from Jablonski’s predictive EAL formula for linearly polar-ized x rays,37
LTH ¼ λi(1� 0:836ω), (7)
where λi is the IMFP for Au and ω is the single-scattering albedofor Au. The latter parameter is a useful measure of the strength ofelastic-scattering effects on photoelectron trajectories.22,27,33 Thefive EALs in Fig. 3 for energies between 8752 and 9694 eV are lessthan the corresponding IMFPs, as expected, and are also close tovalues expected from Eq. (7). However, the four EALs at lowerenergies are larger than the predicted values, and two of the EALvalues, for energies of 1029 and 2921 eV, are larger than the calcu-lated IMFPs. While it is possible that the calculated IMFPs for Aucould be incorrect, these values are consistent with other IMFP cal-culations and measurements.
Powell and Jablonski (PJ)35 have recently reinterpreted theRZC experiments.34 RZC derived their EALs with the assumptionthat their Au films were of uniform thickness (i.e., Frank–van derMerwe or layer-by-layer film growth). PJ considered two otherforms of film growth: island formation (Volmer–Weber filmgrowth) and island growth on a continuous monatomic Au wettinglayer (Stranski–Krastanov film growth). Simulations were madewith Version 2.1.1 of the NIST SESSA database and the islands mor-phology7 to find relative Au island areas for each Au film thicknessthat matched the exponential intensity changes reported by RZC.
In SESSA , islands are represented as two-dimensional periodicarrays with periodicities X and Y . For simplicity, PJ choseX ¼ Y ¼ 1000 nm although their results were not sensitive to thischoice. For each Au island height (corresponding to the Au filmthickness in the RZC experiments), PJ found the dimensions (x, y)of an assumed square Au island that yielded a Cu 1s, Cu 2s, or Au3s photoelectron intensity that matched the corresponding expo-nential decrease (for the Cu signals) or exponential increase (forthe Au signal) found in the RZC experiments within 1%. Theycould then determine the relative Au island areas (xy=XY) for eachAu film thickness.
Figure 4 shows a comparison of relative Au island areas as afunction of Au film thickness for Volmer–Weber film growth (nowetting layer) and Stranski–Krastanov film growth (Au wettinglayer). These comparisons were made, for example, for photoelec-tron energies of (a) 1029 and (b) 6583 eV. We show uncertaintiesin some points based on the results of SESSA simulations in whichrelative Au island areas were determined for +5% variations in thecalculated IMFPs of Tanuma et al. We see consistent results forgrowth in the relative Au island areas for the two photoelectron
FIG. 3. Dependence of the IMFP and the EAL for Au on photoelectron kineticenergy (Ref. 36). Solid line: Jablonski’s predictive EAL formula for polarized xrays [Eq. (7)] and dashed line: calculated IMFPs from Tanuma et al. (Ref. 36).Symbols indicate experimentally determined EALs and their uncertainties(Ref. 34).
ARTICLE avs.scitation.org/journal/jva
J. Vac. Sci. Technol. A 39(6) Nov/Dec 2021; doi: 10.1116/6.0001261 39, 063205-5
© Author(s) 2021

energies from the simulations with an Au wetting layer. No suchconsistency is found for the simulations without a wetting layer.An important conclusion of this work is that the exponentialgrowth of overlayer intensity or decay of substrate intensity withincreasing overlayer-film thickness does not necessarily mean thatthe film is uniform.
We note that the analysis of the RZC experiments with SESSA
(Ref. 35) was based on the assumptions that the Au islands weresquare and had rectangular edges. While these assumptions areclearly unrealistic, there appears to be an adequate qualitativeagreement between the gold island growth curves in Fig. 4 forphotoelectron energies of 1029 and 6583 eV and the assumed
Stranski–Krastanov film growth with a monatomic Au wettinglayer. We also point out that the RZC measurements of EALs at thehigher energies in Fig. 3 (where the EALs are over 6 nm) are lesssensitive to overlayer-film nonuniformities than the EAL measure-ments at lower energies, where the reported EAL at 1.029 keV was1:8+ 0:2 nm. At the higher energies, thicker overlayer films wouldbe utilized in the experiments, and full or partial coalescence ofany islands would be more likely.
We also point out that RZC fitted their measured EALs to theempirical relation LTH ¼ kEp, where the EALs are expressed in nmand the photoelectron energy, E, is in eV. They found k ¼0:023+ 0:002 and p ¼ 0:62+ 0:01 where the uncertainties indi-cate the standard deviations for each parameter from their fits. Incontrast, Powell38,39 found that the value of p from Au EALs calcu-lated from Eq. (7) for electron energies between 992.3 and19.33 keV was 0:871+ 0:003. We believe that the smaller value ofthe parameter p for Au from the RZC experiments (0:62+ 0:01)than the calculated value (0:871+ 0:003) is another indication ofthe effects of islanding in the early stages of film growth in theRZC work and in many EAL measurements for other materials.40
In this example, SESSA simulations with the islands morphol-ogy7 provided important new information from the careful RZCexperiments. It was shown that exponential changes in photoelec-tron intensities during the growth of an overlayer film on a planarsubstrate did not necessarily mean that the film was uniform. Thesimulations showed that the observed intensity changes could beinterpreted in terms of Stranski–Krastanov film growth, a muchmore common form of film growth than layer-by-layer growth.41,42
Jablonski and Powell have recently published a comprehensivereview of EALs for different quantitative applications of XPS.33
They point out that EALs can be defined for different XPS applica-tions (e.g., measurement of film thicknesses on a planar substrate,quantitative analyses, marker depths, and shell thicknesses of nano-spheres) and that EALs for one application and instrument config-uration can be numerically different from those for another. Inaddition, EALs for the measurement of film thicknesses for XPSwith linearly polarized x rays can be different from those withunpolarized x rays.
B. Quantitative analysis of surface impurities onmultilayered materials
Quantitative analyses by XPS are often based on the implicitassumption that the sample of interest is homogeneous over thesampling volume of the XPS measurement. The observed intensi-ties of photoelectron peaks are then analyzed with relative sensitiv-ity factors to obtain a sample composition. However, many samplesof interest are inhomogeneous, either laterally or with depth (orboth). Tougaard has developed algorithms and software that havebeen effective in identifying such inhomogeneities and in obtainingquantitative information about inhomogeneous samples from XPSmeasurements.43
SESSA is also useful for identifying sample inhomogeneities andin obtaining quantitative information about an inhomogeneoussample. We now describe an application in which SESSA was used todetermine absolute amounts of low-level surface impurities onlayered samples of the type used for extreme ultraviolet (EUV)
FIG. 4. Comparisons of relative gold island areas as a function of gold islandthickness for Volmer–Weber film growth (no wetting layer) and for Stranski–Krastanov film growth (Au wetting layer) for photoelectron energies, E, of (a)1029 and (b) 6583 eV (Ref. 35). Uncertainties are indicated for some pointsbased on assumed uncertainties of +5% in the calculated IMFPs of Tanumaet al. (Ref. 36). Lines are shown between points to guide the eye.
ARTICLE avs.scitation.org/journal/jva
J. Vac. Sci. Technol. A 39(6) Nov/Dec 2021; doi: 10.1116/6.0001261 39, 063205-6
© Author(s) 2021
lithography.44 In this application, it was possible to estimatethe total uncertainty of such measurements by considering thesystematic limitations of SESSA and the statistical uncertainties of themeasurements. The same procedure can be employed for othermultilayered materials.
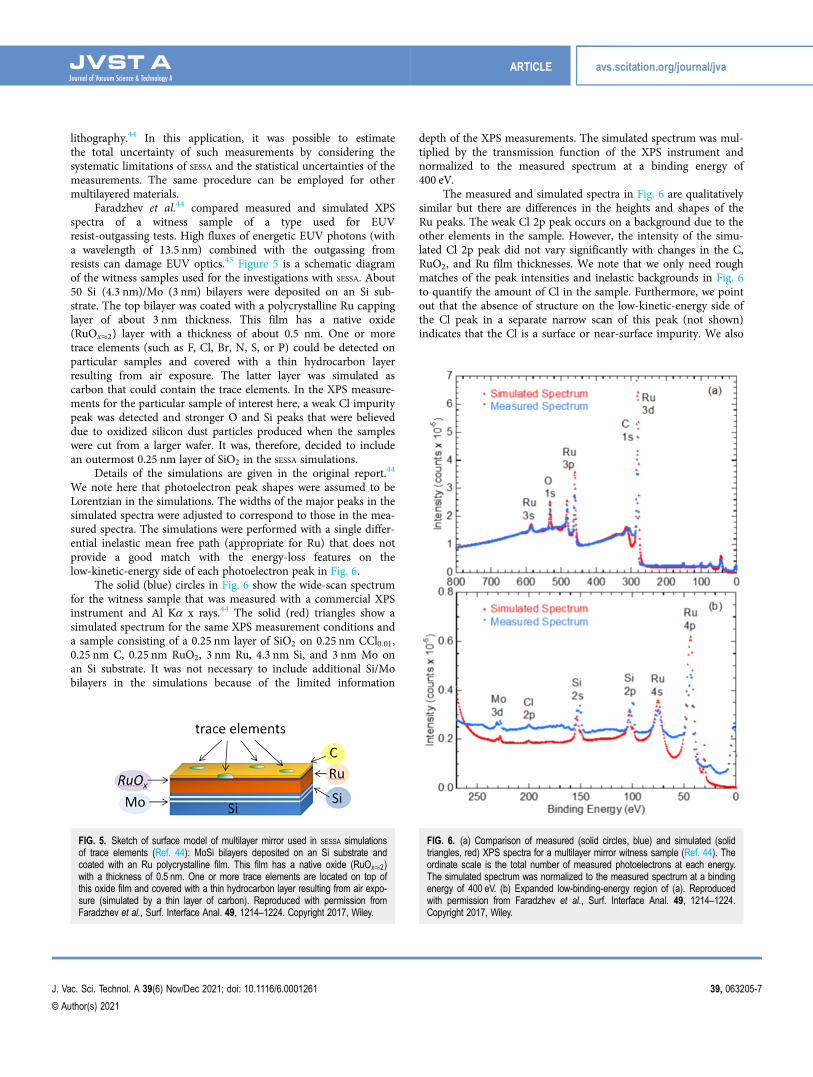
Faradzhev et al.44 compared measured and simulated XPSspectra of a witness sample of a type used for EUVresist-outgassing tests. High fluxes of energetic EUV photons (witha wavelength of 13.5 nm) combined with the outgassing fromresists can damage EUV optics.45 Figure 5 is a schematic diagramof the witness samples used for the investigations with SESSA. About50 Si (4.3 nm)/Mo (3 nm) bilayers were deposited on an Si sub-strate. The top bilayer was coated with a polycrystalline Ru cappinglayer of about 3 nm thickness. This film has a native oxide(RuOx�2) layer with a thickness of about 0.5 nm. One or moretrace elements (such as F, Cl, Br, N, S, or P) could be detected onparticular samples and covered with a thin hydrocarbon layerresulting from air exposure. The latter layer was simulated ascarbon that could contain the trace elements. In the XPS measure-ments for the particular sample of interest here, a weak Cl impuritypeak was detected and stronger O and Si peaks that were believeddue to oxidized silicon dust particles produced when the sampleswere cut from a larger wafer. It was, therefore, decided to includean outermost 0.25 nm layer of SiO2 in the SESSA simulations.
Details of the simulations are given in the original report.44
We note here that photoelectron peak shapes were assumed to beLorentzian in the simulations. The widths of the major peaks in thesimulated spectra were adjusted to correspond to those in the mea-sured spectra. The simulations were performed with a single differ-ential inelastic mean free path (appropriate for Ru) that does notprovide a good match with the energy-loss features on thelow-kinetic-energy side of each photoelectron peak in Fig. 6.
The solid (blue) circles in Fig. 6 show the wide-scan spectrumfor the witness sample that was measured with a commercial XPSinstrument and Al Kα x rays.44 The solid (red) triangles show asimulated spectrum for the same XPS measurement conditions anda sample consisting of a 0.25 nm layer of SiO2 on 0.25 nm CCl0:01,0.25 nm C, 0.25 nm RuO2, 3 nm Ru, 4.3 nm Si, and 3 nm Mo onan Si substrate. It was not necessary to include additional Si/Mobilayers in the simulations because of the limited information
depth of the XPS measurements. The simulated spectrum was mul-tiplied by the transmission function of the XPS instrument andnormalized to the measured spectrum at a binding energy of400 eV.
The measured and simulated spectra in Fig. 6 are qualitativelysimilar but there are differences in the heights and shapes of theRu peaks. The weak Cl 2p peak occurs on a background due to theother elements in the sample. However, the intensity of the simu-lated Cl 2p peak did not vary significantly with changes in the C,RuO2, and Ru film thicknesses. We note that we only need roughmatches of the peak intensities and inelastic backgrounds in Fig. 6to quantify the amount of Cl in the sample. Furthermore, we pointout that the absence of structure on the low-kinetic-energy side ofthe Cl peak in a separate narrow scan of this peak (not shown)indicates that the Cl is a surface or near-surface impurity. We also
FIG. 5. Sketch of surface model of multilayer mirror used in SESSA simulationsof trace elements (Ref. 44): MoSi bilayers deposited on an Si substrate andcoated with an Ru polycrystalline film. This film has a native oxide (RuOx�2)with a thickness of 0.5 nm. One or more trace elements are located on top ofthis oxide film and covered with a thin hydrocarbon layer resulting from air expo-sure (simulated by a thin layer of carbon). Reproduced with permission fromFaradzhev et al., Surf. Interface Anal. 49, 1214–1224. Copyright 2017, Wiley.
FIG. 6. (a) Comparison of measured (solid circles, blue) and simulated (solidtriangles, red) XPS spectra for a multilayer mirror witness sample (Ref. 44). Theordinate scale is the total number of measured photoelectrons at each energy.The simulated spectrum was normalized to the measured spectrum at a bindingenergy of 400 eV. (b) Expanded low-binding-energy region of (a). Reproducedwith permission from Faradzhev et al., Surf. Interface Anal. 49, 1214–1224.Copyright 2017, Wiley.
ARTICLE avs.scitation.org/journal/jva
J. Vac. Sci. Technol. A 39(6) Nov/Dec 2021; doi: 10.1116/6.0001261 39, 063205-7
© Author(s) 2021
note that SESSA does not simulate valence-band spectra and theinelastic backgrounds associated with valence-band photoemission.While the agreement between measured and simulated spectra inFig. 6 could possibly be improved, the main goal of the work wasin the relative magnitudes of the Cl 2p peaks above their local back-grounds in the measured and simulated spectra.
Comparison of the background-subtracted Cl 2p peak areas inthe simulated and measured narrow-scan spectra indicated that thecomposition of the outermost 0.25 nm carbonaceous layer wasCCl0:027. This composition corresponds to a Cl coverage of 0.020monolayers assuming a van der Waals radius for Cl of 0.175 nm.The relative statistical uncertainty of this result was estimated to be13%. The systematic uncertainty of the Cl 2p photoionization crosssection was estimated to be about 9% and the uncertainty associ-ated with the neglect of surface and shakeup excitations was esti-mated to be about 13%. The combined one-standard-deviationsystematic uncertainty is then 16% and the total uncertainty in theamount of surface Cl is 21%.
C. Analysis of ionic liquids for determination of theanalyzer transmission function
An example of a comparison of SESSA with other availablemodels concerns the analysis of ionic liquids (ILs), which are verysuitable materials for performing a relatively easy calibration of thetransmission function of the analyzer of an XPS instrument. Ionicliquids are easy to prepare by casting a drop on a sample holder,they have a very low vapor pressure, so these materials are fullyUHV-compatible, they are conductive, unaltered after x-ray expo-sure, and exhibit well separated photoemission peaks covering themain energy range of interest for XPS. ILs can be easily prepared toexhibit a flat surface almost free of adventitious carbon contamina-tion (and time-consuming sputtering and annealing cycles asneeded for metallic reference materials can be omitted) and ILs aresufficiently homogeneous both in-depth as well as laterally. Finally,nonfunctionalized ILs are inert to surface oxidation.
The potential of ionic liquids for the use as reference materialfor the calibration of the spectrometer transmission function ofXPS instruments has been recently studied by Holzweber et al.46
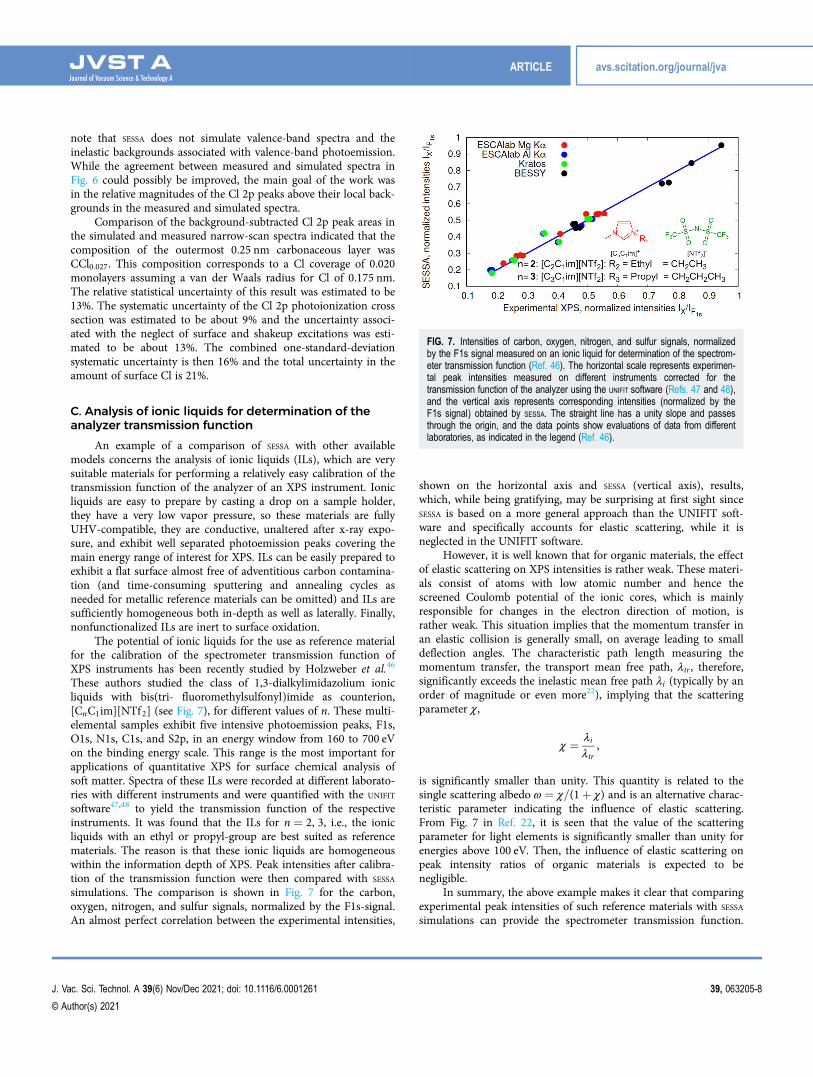
These authors studied the class of 1,3-dialkylimidazolium ionicliquids with bis(tri- fluoromethylsulfonyl)imide as counterion,[CnC1im][NTf2] (see Fig. 7), for different values of n. These multi-elemental samples exhibit five intensive photoemission peaks, F1s,O1s, N1s, C1s, and S2p, in an energy window from 160 to 700 eVon the binding energy scale. This range is the most important forapplications of quantitative XPS for surface chemical analysis ofsoft matter. Spectra of these ILs were recorded at different laborato-ries with different instruments and were quantified with the UNIFIT
software47,48 to yield the transmission function of the respectiveinstruments. It was found that the ILs for n ¼ 2, 3, i.e., the ionicliquids with an ethyl or propyl-group are best suited as referencematerials. The reason is that these ionic liquids are homogeneouswithin the information depth of XPS. Peak intensities after calibra-tion of the transmission function were then compared with SESSA
simulations. The comparison is shown in Fig. 7 for the carbon,oxygen, nitrogen, and sulfur signals, normalized by the F1s-signal.An almost perfect correlation between the experimental intensities,
shown on the horizontal axis and SESSA (vertical axis), results,which, while being gratifying, may be surprising at first sight sinceSESSA is based on a more general approach than the UNIFIT soft-ware and specifically accounts for elastic scattering, while it isneglected in the UNIFIT software.
However, it is well known that for organic materials, the effectof elastic scattering on XPS intensities is rather weak. These materi-als consist of atoms with low atomic number and hence thescreened Coulomb potential of the ionic cores, which is mainlyresponsible for changes in the electron direction of motion, israther weak. This situation implies that the momentum transfer inan elastic collision is generally small, on average leading to smalldeflection angles. The characteristic path length measuring themomentum transfer, the transport mean free path, λtr , therefore,significantly exceeds the inelastic mean free path λi (typically by anorder of magnitude or even more22), implying that the scatteringparameter χ,
χ ¼ λiλtr
,
is significantly smaller than unity. This quantity is related to thesingle scattering albedo ω ¼ χ=(1þ χ) and is an alternative charac-teristic parameter indicating the influence of elastic scattering.From Fig. 7 in Ref. 22, it is seen that the value of the scatteringparameter for light elements is significantly smaller than unity forenergies above 100 eV. Then, the influence of elastic scattering onpeak intensity ratios of organic materials is expected to benegligible.
In summary, the above example makes it clear that comparingexperimental peak intensities of such reference materials with SESSA
simulations can provide the spectrometer transmission function.
FIG. 7. Intensities of carbon, oxygen, nitrogen, and sulfur signals, normalizedby the F1s signal measured on an ionic liquid for determination of the spectrom-eter transmission function (Ref. 46). The horizontal scale represents experimen-tal peak intensities measured on different instruments corrected for thetransmission function of the analyzer using the UNIFIT software (Refs. 47 and 48),and the vertical axis represents corresponding intensities (normalized by theF1s signal) obtained by SESSA. The straight line has a unity slope and passesthrough the origin, and the data points show evaluations of data from differentlaboratories, as indicated in the legend (Ref. 46).
ARTICLE avs.scitation.org/journal/jva
J. Vac. Sci. Technol. A 39(6) Nov/Dec 2021; doi: 10.1116/6.0001261 39, 063205-8
© Author(s) 2021
It should be emphasized that SESSA can perform such simulationsfor instruments with an arbitrary geometrical configuration. As theexperimental configuration can strongly influence relative peakareas, in particular, for high energies where nondipolar terms inthe photoionization cross section come into play, or for polarized xrays (see also Sec. III D), the use of SESSA may be advantageous insuch cases.
D. Simulation of the inelastic background for hard xrays with and without polarization
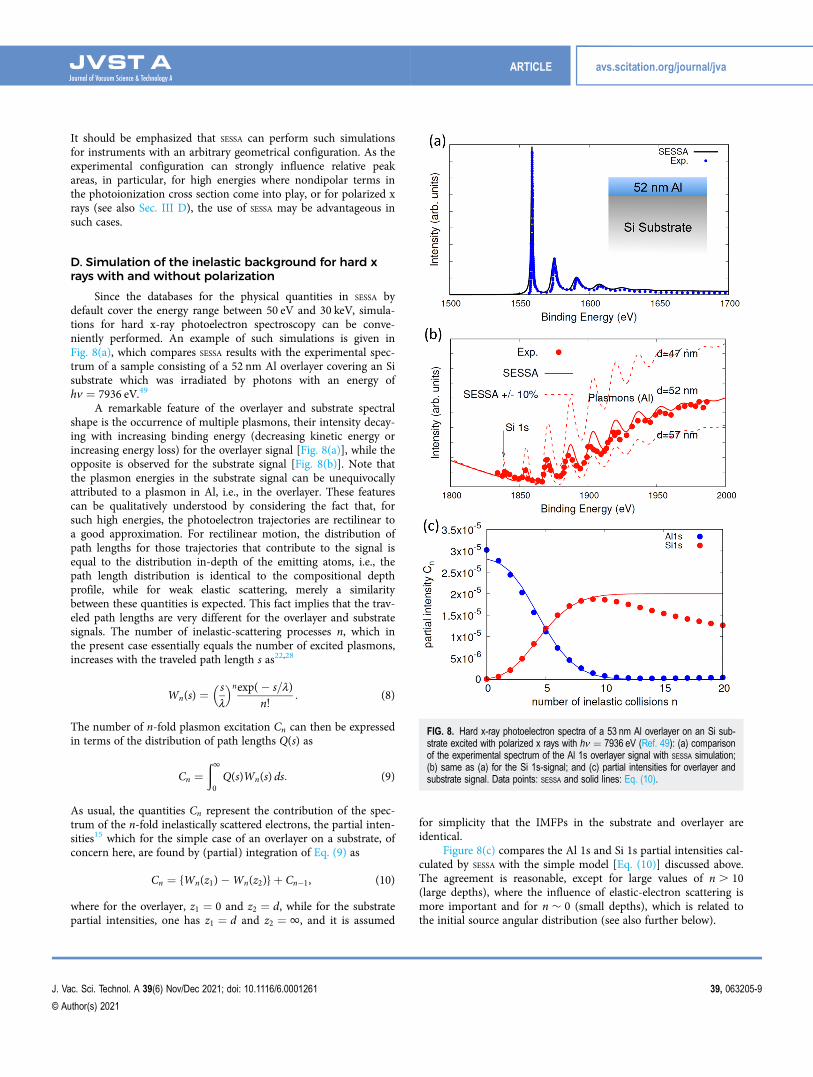
Since the databases for the physical quantities in SESSA bydefault cover the energy range between 50 eV and 30 keV, simula-tions for hard x-ray photoelectron spectroscopy can be conve-niently performed. An example of such simulations is given inFig. 8(a), which compares SESSA results with the experimental spec-trum of a sample consisting of a 52 nm Al overlayer covering an Sisubstrate which was irradiated by photons with an energy ofhν ¼ 7936 eV.49
A remarkable feature of the overlayer and substrate spectralshape is the occurrence of multiple plasmons, their intensity decay-ing with increasing binding energy (decreasing kinetic energy orincreasing energy loss) for the overlayer signal [Fig. 8(a)], while theopposite is observed for the substrate signal [Fig. 8(b)]. Note thatthe plasmon energies in the substrate signal can be unequivocallyattributed to a plasmon in Al, i.e., in the overlayer. These featurescan be qualitatively understood by considering the fact that, forsuch high energies, the photoelectron trajectories are rectilinear toa good approximation. For rectilinear motion, the distribution ofpath lengths for those trajectories that contribute to the signal isequal to the distribution in-depth of the emitting atoms, i.e., thepath length distribution is identical to the compositional depthprofile, while for weak elastic scattering, merely a similaritybetween these quantities is expected. This fact implies that the trav-eled path lengths are very different for the overlayer and substratesignals. The number of inelastic-scattering processes n, which inthe present case essentially equals the number of excited plasmons,increases with the traveled path length s as22,28
Wn(s) ¼ sλ
� �nexp(� s=λ)n!
: (8)
The number of n-fold plasmon excitation Cn can then be expressedin terms of the distribution of path lengths Q(s) as
Cn ¼ð10Q(s)Wn(s) ds: (9)
As usual, the quantities Cn represent the contribution of the spec-trum of the n-fold inelastically scattered electrons, the partial inten-sities15 which for the simple case of an overlayer on a substrate, ofconcern here, are found by (partial) integration of Eq. (9) as
Cn ¼ {Wn(z1)�Wn(z2)}þ Cn�1, (10)
where for the overlayer, z1 ¼ 0 and z2 ¼ d, while for the substratepartial intensities, one has z1 ¼ d and z2 ¼ 1, and it is assumed
for simplicity that the IMFPs in the substrate and overlayer areidentical.
Figure 8(c) compares the Al 1s and Si 1s partial intensities cal-culated by SESSA with the simple model [Eq. (10)] discussed above.The agreement is reasonable, except for large values of n . 10(large depths), where the influence of elastic-electron scattering ismore important and for n � 0 (small depths), which is related tothe initial source angular distribution (see also further below).
FIG. 8. Hard x-ray photoelectron spectra of a 53 nm Al overlayer on an Si sub-strate excited with polarized x rays with hν ¼ 7936 eV (Ref. 49): (a) comparisonof the experimental spectrum of the Al 1s overlayer signal with SESSA simulation;(b) same as (a) for the Si 1s-signal; and (c) partial intensities for overlayer andsubstrate signal. Data points: SESSA and solid lines: Eq. (10).
ARTICLE avs.scitation.org/journal/jva
J. Vac. Sci. Technol. A 39(6) Nov/Dec 2021; doi: 10.1116/6.0001261 39, 063205-9
© Author(s) 2021
Overall, the comparison in Fig. 8 demonstrates the ability ofSESSA to predict relative intensities and spectral shapes. In particular,the shape and intensity of the inelastic background accompanyingthe Si 1s peak [in Fig. 8(b)] reproduces the experimental data quitewell, while similar simulations for Al film thicknesses 10% aboveand below the nominal specimen thickness yield distinctly differentshapes of the inelastic background. This result not only gives confi-dence in the reliability of the databases in SESSA but also suggests asimple way to measure film thicknesses using the spectral shape ofthe inelastic background.
Finally, note again that the weak Si 1s peak of the buried layerin Fig. 8(b) is accompanied by a series of (multiple) plasmon losspeaks whose energy separation corresponds exactly to the plasmonloss in Al. These energy losses (� 15 eV) are distinctly differentfrom the plasmon energy loss in Si (� 16 eV). This result impliesthat a comparatively large number of secondary electrons created asa result of an interaction with the incoming beam in the buried layerare generated later when the photoelectron loses energy during itspassage through the overlayer. The plasmons excited in this way candecay and transfer their energy and momentum to a solid-state elec-tron, which is emitted as a secondary electron if its energy is largeenough to overcome the surface barrier.50–54 Since the momentumtransferred to the secondary electron is small for high-energy elec-trons, its point of escape will be in the vicinity of the Si atom thatemitted the photoelectron. This result explains the good lateral reso-lution of the photoelectron emission microscope for buried layers,which was the original purpose of this experiment.49
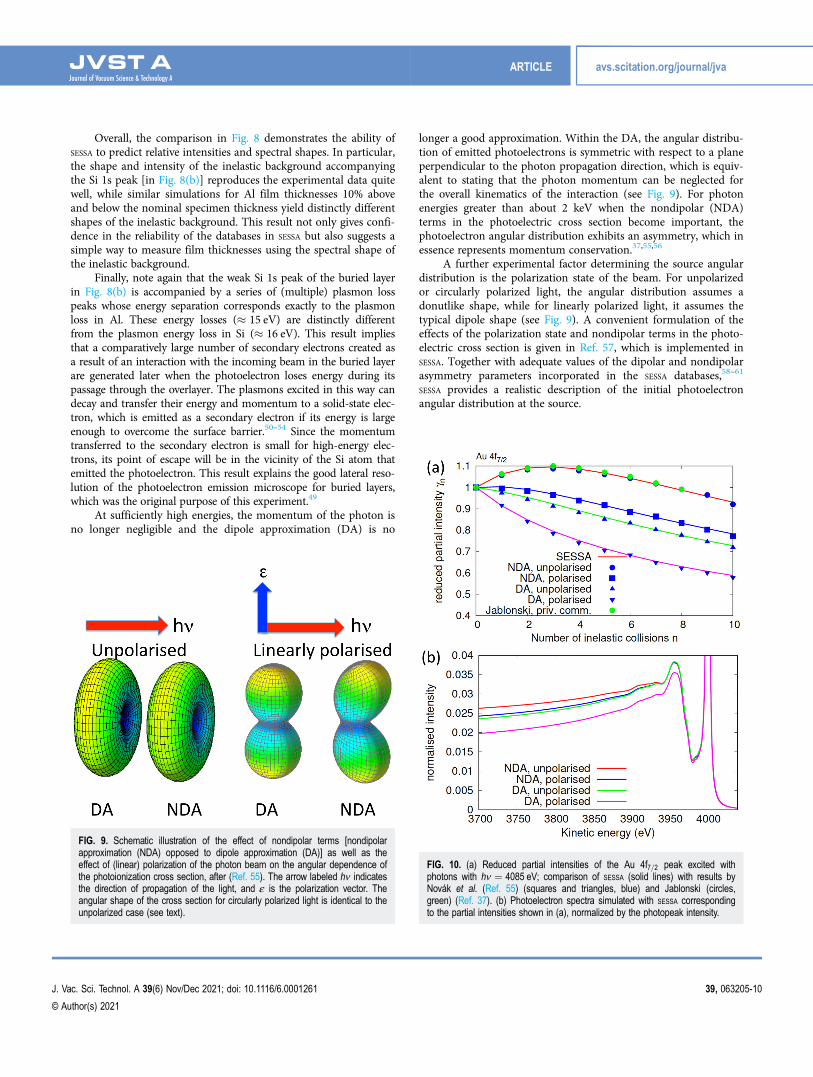
At sufficiently high energies, the momentum of the photon isno longer negligible and the dipole approximation (DA) is no
longer a good approximation. Within the DA, the angular distribu-tion of emitted photoelectrons is symmetric with respect to a planeperpendicular to the photon propagation direction, which is equiv-alent to stating that the photon momentum can be neglected forthe overall kinematics of the interaction (see Fig. 9). For photonenergies greater than about 2 keV when the nondipolar (NDA)terms in the photoelectric cross section become important, thephotoelectron angular distribution exhibits an asymmetry, which inessence represents momentum conservation.37,55,56
A further experimental factor determining the source angulardistribution is the polarization state of the beam. For unpolarizedor circularly polarized light, the angular distribution assumes adonutlike shape, while for linearly polarized light, it assumes thetypical dipole shape (see Fig. 9). A convenient formulation of theeffects of the polarization state and nondipolar terms in the photo-electric cross section is given in Ref. 57, which is implemented inSESSA. Together with adequate values of the dipolar and nondipolarasymmetry parameters incorporated in the SESSA databases,58–61
SESSA provides a realistic description of the initial photoelectronangular distribution at the source.
FIG. 9. Schematic illustration of the effect of nondipolar terms [nondipolarapproximation (NDA) opposed to dipole approximation (DA)] as well as theeffect of (linear) polarization of the photon beam on the angular dependence ofthe photoionization cross section, after (Ref. 55). The arrow labeled hν indicatesthe direction of propagation of the light, and ε is the polarization vector. Theangular shape of the cross section for circularly polarized light is identical to theunpolarized case (see text).
FIG. 10. (a) Reduced partial intensities of the Au 4f7=2 peak excited withphotons with hν ¼ 4085 eV; comparison of SESSA (solid lines) with results byNovák et al. (Ref. 55) (squares and triangles, blue) and Jablonski (circles,green) (Ref. 37). (b) Photoelectron spectra simulated with SESSA correspondingto the partial intensities shown in (a), normalized by the photopeak intensity.
ARTICLE avs.scitation.org/journal/jva
J. Vac. Sci. Technol. A 39(6) Nov/Dec 2021; doi: 10.1116/6.0001261 39, 063205-10
© Author(s) 2021
It is well known that the angular distribution of photoelec-trons at their source not only has implications for the photoelec-tron angular distribution measured in vacuum37 but also influencesthe shape of the inelastic background accompanying the photo-peak.22 As discussed above, the inelastic background is governed bythe distribution of path lengths taken by the photoelectrons ontheir way from the source to the surface and, in the presence ofelastic scattering, this is clearly influenced by the source angulardistribution.
In Figs. 10(a) and 10(b), the influence of nondipolar terms inthe photoelectron ionization cross section as well as the polariza-tion state of the incoming light on the partial intensities is illus-trated for an Au sample irradiated with photons with an energy ofhν ¼ 4085 eV and compared with results by Novák et al.55 andJablonski,37 yielding excellent agreement. The sequence of partialintensities is clearly influenced by the source angular distribution,leading to significantly different spectral shapes, as shown inFig. 10(b).
E. Analysis of core-shell nanoparticles
Since the chemical characterization of core-shell nanoparticles(CSNPs) is rapidly gaining importance in nanotechnology, analyti-cal techniques originally developed for catalysis62 and based onXPS measurements are being adopted for NP research. The presentversion of the SESSA software V2.2 (Ref. 12) is able to simulate XPSspectra for surfaces with certain nanomorphologies such as core-shell particles, multishell particles, and lines and islands on layeredplanar surfaces and has been successfully employed in severalapplications.63–74 In particular, SESSA has been used to quantifyshell thicknesses based on XPS measurements. Other methods toquantify shell thicknesses of CSNPs have been proposed in the lit-erature, such as the “TNP”-formula by Shard.75 This is a simple
predictive formula allowing one to calibrate shell thicknesses frommeasured core/shell XPS-intensity ratios, assuming the core radiusto be known. The formula was empirically derived by parameteri-zation of a large set of calculations for core shell intensity ratios inwhich elastic scattering was neglected. A further method for quan-tifying shell thicknesses is the infinitesimal column model,76 whichis also based on the rectilinear motion model and requires a moreinvolved numerical procedure. SESSA has been used to investigatethe range of validity of these approaches66 and has been instrumen-tal in the INNANOPART (Ref. 77) project aimed at developingprocedures for accurate characterization of the chemistry of shellmaterials in CSNPs. A recent publication78 summaries a TechnicalReport79 from the International Organization for Standardizationwith guidelines and recommendations on quantifying XPS data foranalysis of nanoparticles with coatings.
Here, we present a result from a study on the limitationsimposed by making the single-sphere approximation mentionedabove on the interpretation of XPS intensities from nanoparticles.71
In heterogeneous catalysis, the catalyst may be assumed to be amorphological aggregate resembling a powder consisting of core-shell nanoparticles. Models to quantitatively interpret XPS signalintensities of core-shell particles have been developed.62,75,80–83 Thesingle-sphere approximation is generally assumed to describe therelative XPS intensities for a random aggregate of many nanoparti-cles forming a powder. With this approximation, the relative pho-toelectron intensities are assumed to be equivalent to those of asingle spherical core-shell particle.62,80 The single-sphere approxi-mation implies that the angular distribution of photoelectrons forpowders is essentially isotropic since a sphere looks the same irre-spective of the direction from which it is observed.
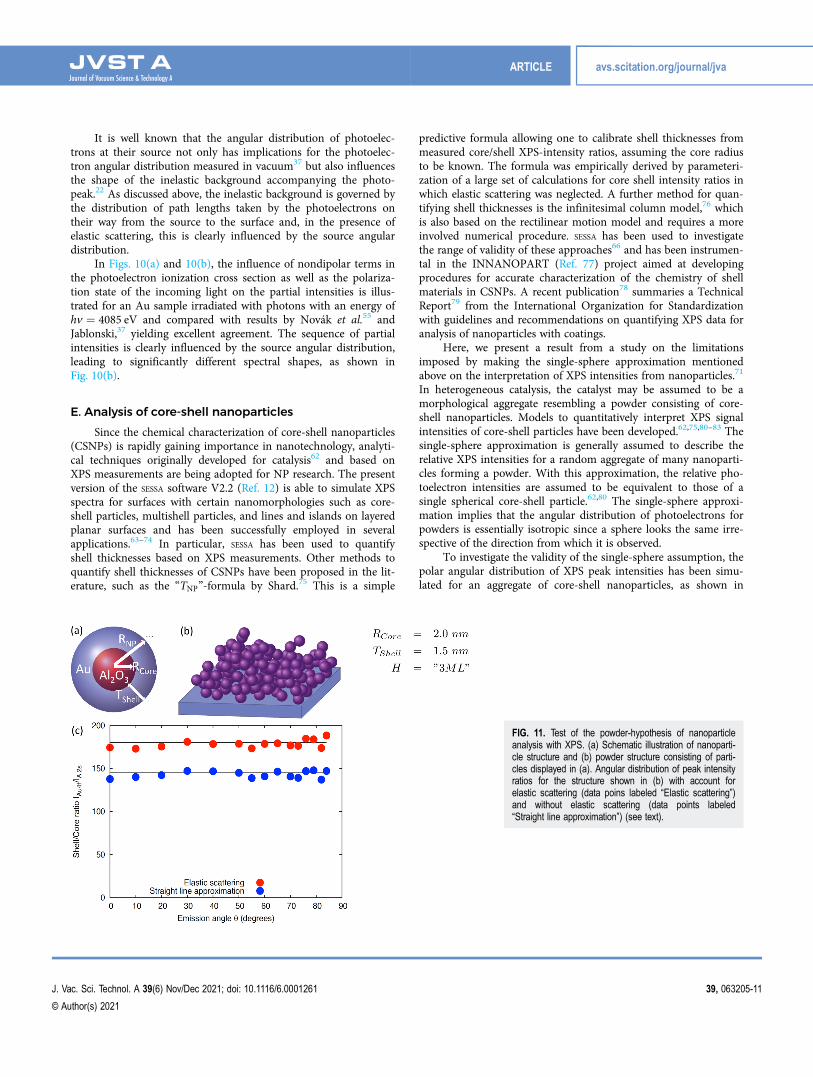
To investigate the validity of the single-sphere assumption, thepolar angular distribution of XPS peak intensities has been simu-lated for an aggregate of core-shell nanoparticles, as shown in
FIG. 11. Test of the powder-hypothesis of nanoparticleanalysis with XPS. (a) Schematic illustration of nanoparti-cle structure and (b) powder structure consisting of parti-cles displayed in (a). Angular distribution of peak intensityratios for the structure shown in (b) with account forelastic scattering (data poins labeled “Elastic scattering”)and without elastic scattering (data points labeled“Straight line approximation”) (see text).
ARTICLE avs.scitation.org/journal/jva
J. Vac. Sci. Technol. A 39(6) Nov/Dec 2021; doi: 10.1116/6.0001261 39, 063205-11
© Author(s) 2021

Fig. 11(b). This system consisted of Au=Al2O3 core-shell NPs(RAl2O3,Core ¼ 2:0 nm, RAu,Shell ¼ 1:5 nm). These simulations werecarried out with a developmental version of SESSA.
The points labeled “Elastic scattering” in Fig. 11(c) representthe Au4f7=2-Al2s intensity ratio as a function of the (off-normal)polar emission angle θ of a single core-shell NP when elastic scat-tering is accounted for, and the points labeled “Straight lineapproximation” show the corresponding result in the straight-lineapproximation when elastic scattering is “turned off” in the simula-tions. The featureless angular distributions for the intensity ratioare expected both for the straight-line approximation and the morephysically realistic case when elastic scattering is accounted forsince a single-sphere looks identical irrespective of the direction ofobservation. This result remains true for different types of opacityof the spheres for the signal electrons, i.e., moving along straightlines or along zig-zag-shaped trajectories. In the latter case, thepath length elongation along the penetration depth into the NPreduces the core signal, giving rise to a somewhat larger shell-coreintensity ratio. Therefore, the core-shell intensity ratio changes sig-nificantly for the considered system consisting of materials with ahigh atomic number for which elastic-electron scattering is knownto have a significant effect on the photoelectron intensities.22
IV. CONCLUSIONS
In summary, the functionality of SESSA has been revisited andtwo new features, which have recently been added to the newestversion (SESSA V2.2) of the software have been introduced. Thelatter concern the simulation of surface excitations and an effectiveapproach to account for the energy dependence of the interactioncharacteristics for photoelectrons. Some functionalities of SESSA
have been discussed on the basis of various applications, includingoverlayer measurements to determine the effective electron attenua-tion length, quantitative analysis of impurities in multilayer materi-als, analysis of ionic liquids, the influence of nondipolar effects forphoton energies above a few keV, and analysis of nanoparticles bymeans of photoelectron spectroscopy.
DATA AVAILABILITY
The data that support the findings of this study are availablefrom the corresponding author upon reasonable request.
REFERENCES1A. Keqi et al., Phys. Rev. B 97, 155149 (2018).2G. Conti et al., APL Mater. 6, 058101 (2018).3G. Singh-Bhalla et al., Phys. Rev. Mater. 2, 112001 (2018).4C. S. Conlon et al., J. Appl. Phys. 126, 075305 (2019).5W. S. M. Werner, W. Smekal, and C. J. Powell, NIST Database for Simulation ofElectron Spectra for Surface Analysis SRD100, Version 1.0 (National Institute ofStandards and Technology, Gaithersburg, MD, 2005).6W. Smekal, W. S. M. Werner, and C. J. Powell, Surf. Interface Anal. 37, 1059(2005).7W. S. M. Werner, W. Smekal, and C. J. Powell, Simulation of Electron Spectrafor Surface Analysis (SESSA), Version 2.2.0, User’s Guide, NIST NSRDS 100(National Institute of Standards and Technology, Gaithersburg, MD, 2021).8G. H. Major, T. G. Avval, D. S. D. I. Patel, T. Roychowdhury, A. J. Barlow,P. J. Pigram, M. Greiner, V. Fernandez, and A. H.-G. M. R. Linford, Surf.Interface Anal. 53, 689 (2021).
9W. H. Gries and W. S. M. Werner, Surf. Interface Anal. 16, 149 (1990).10W. S. M. Werner, W. Smekal, and C. J. Powell, NIST Database for Simulationof Electron Spectra for Surface Analysis SRD100, Version 2.0 (National Instituteof Standards and Technology, Gaithersburg, MD, 2014).11J. Almansa, F. Salvat-Pujol, G. Diaz-Londono, A. Carnicer, A. M. Lallena, andF. Salvat, Comput. Phys. Commun. 199, 102 (2016).12W. S. M. Werner, W. Smekal, and C. J. Powell, NIST Database for Simulationof Electron Spectra for Surface Analysis SRD100, Version 2.2 (National Instituteof Standards and Technology, Gaithersburg, MD, 2021).13W. S. M. Werner, M. Novak, F. Salvat-Pujol, J. Zemek, and P. Jiricek, Phys.Rev. Lett. 110, 086110 (2013).14W. S. M. Werner, W. Smekal, C. Tomastik, and H. Störi, Surf. Sci. 486, L461(2001).15ISO 18115-1, Surface Chemical Analysis Vocabulary Part 1, General Terms andTerms Used in Spectroscopy (International Organization for Standardization,Geneva, 2010).16W. S. M. Werner, Surf. Interface Anal. 35, 347 (2003).17W. S. M. Werner, Surf. Sci. 526, L159 (2003).18R. Oswald, “Numerische untersuchung der elastischen streuung von elektro-nen an atomen und ihrer rückstreuung an oberflächen amorpher substanzen imenergiebereich unter 2000 eV,” Ph.D. thesis (Eberhard-Karls-UniversitätTübingen, 1992).19E. A. Stern and R. A. Ferrell, Phys. Rev. 120, 130 (1960).20Y. F. Chen, Surf. Sci. 519, 115 (2002).21R. H. Ritchie, Phys. Rev. 106, 874 (1957).22W. S. M. Werner, Surf. Interface Anal. 31, 141 (2001).23Z.-J. Ding, “Fundamental studies on the interactions of kV electrons with solidsfor application to electron spectroscopies,” Ph.D. thesis (Osaka University, 1990).24K. M. Case and P. F. Zweifel, Linear Transport Theory (Addison-Wesley,Reading, MA, 1967).25M. Hronek, “Simulation of x-ray photoelectron spectra beyond thequasi-elastic approximation: Application to nanoparticle analysis,” Master’sthesis (Vienna University of Technology, 2019).26B. Davison, Neutron Transport Theory (Oxford University, Oxford, 1955).27I. S. Tilinin and W. S. M. Werner, Phys. Rev. B 46, 13739 (1992).28W. S. M. Werner, Phys. Rev. B 55, 14925 (1997).29C. J. Powell, J. Electron Spectrosc. Relat. Phenom. 44, 29 (1974).30C. R. Brundle, J. Vac. Sci. Technol. 11, 212 (1974).31I. Lindau and W. E. Spicer, J. Electron Spectrosc. Relat. Phenom. 3, 409(1974).32M. P. Seah and W. A. Dench, Surf. Interface Anal. 1, 2 (1979).33A. Jablonski and C. J. Powell, J. Phys. Chem. Ref. Data 49, 033102 (2020).34J. Rubio-Zuazo and G. Castro, J. Electron Spectrosc. Relat. Phenom. 184, 384(2011).35C. J. Powell and A. Jablonski, J. Electron Spectrosc. Relat. Phenom. 236, 27(2019).36S. Tanuma, C. J. Powell, and D. R. Penn, Surf. Interface Anal. 43, 689 (2011).37A. Jablonski, Surf. Sci. 667, 121 (2018).38C. J. Powell, J. Vac. Sci. Technol. A 38, 023209 (2020).39C. J. Powell, J. Vac. Sci. Technol. A 38, 057001 (2020).40C. J. Powell, Surf. Interface Anal. 7, 256 (1985).41C. Argile and G. E. Rhead, Surf. Sci. Rep. 10, 277 (1989).42A. Barbier, Surf. Sci. 406, 69 (1998).43S. Tougaard, J. Vac. Sci. Technol. A 39, 011201 (2021).44N. S. Faradzhev, S. B. Hill, and C. J. Powell, Surf. Interface Anal. 49, 1214(2017).45T. E. Madey, N. S. Faradzhev, B. V. Yakshinskly, and N. V. Edwards, Appl.Surf. Sci. 253, 1691 (2006).46M. Holzweber, A. Lippitz, R. Hesse, R. Denecke, W. S. Werner, andW. E. Unger, J. Electron Spectrosc. Relat. Phenom. 233, 51 (2019).47R. Hesse, P. Streubel, and R. Szargan, Surf. Interface Anal. 37, 589 (2005).48Certain commercial instruments and software are identified to specify experi-mental measurement conditions and methods of data analysis. These
ARTICLE avs.scitation.org/journal/jva
J. Vac. Sci. Technol. A 39(6) Nov/Dec 2021; doi: 10.1116/6.0001261 39, 063205-12
© Author(s) 2021

identifications are not intended as endorsements of these products by thenational institute of standards and technology nor are they intended to implythat they are the most suitable products for the applications.49T. Kinoshita et al., Surf. Sci. 601, 4754 (2007).50W. S. M. Werner, F. Salvat-Pujol, A. Bellissimo, R. Khalid, W. Smekal,M. Novak, A. Ruocco, and G. Stefani, Phys. Rev. B 88, 201407 (2013).51W. S. M. Werner, W. Smekal, H. Winter, A. Ruocco, F. Offi, S. Iacobucci, andG. Stefani, Phys. Rev. B 78, 233403 (2008).52W. S. M. Werner, V. Astašauskas, P. Ziegler, A. Bellissimo, L. Linhart, andF. Libisch, Phys. Rev. Lett. 125, 196603 (2020).53O. Y. Ridzel, V. Astašauskas, and W. S. M. Werner, J. Electron Spectrosc.Relat. Phenom. 241, 146824 (2020).54A. Bellissimo, G.-M. Pierantozzi, A. Ruocco, G. Stefani, O. Y. Ridzel,V. Astašauskas, W. S. M. Werner, and M. Taborelli, J. Electron Spectrosc. Relat.Phenom. 241, 146883 (2020).55M. Novák, N. Pauly, and A. Dubus, J. Electron Spectrosc. Relat. Phenom. 185,4 (2012).56W. S. M. Werner, W. Smekal, T. Hisch, J. Himmelsbach, and C. J. Powell,J. Electron Spectrosc. Relat. Phenom. 190, 137 (2013).57P. S. Shaw, U. Arp, and S. H. Southworth, Phys. Rev. A 54, 1463 (1996).58R. F. Reilman, A. Msezane, and S. T. Manson, J. Electron Spectrosc. Relat.Phenom. 8, 289 (1976).59J. J. Yeh and I. Lindau, At. Data Nucl. Data Tables 32, 1 (1985).60M. B. Trzhaskoskaya, V. I. Nefedov, and V. G. Yarzhemsky, At. Data Nucl.Data Tables 77, 97 (2001).61M. B. Trzhaskoskaya, V. I. Nefedov, and V. G. Yarzhemsky, At. Data Nucl.Data Tables 82, 257 (2003).62H. P. C. E. Kuipers, H. C. E. van Leuven, and W. M. Visser, Surf. InterfaceAnal. 8, 235 (1986).63C. Powell, W. Werner, A. Shard, and D. Castner, J. Phys. Chem. C 120, 22730(2016).64C. J. Powell, M. Chudzicki, W. S. M. Werner, and W. Smekal, J. Vac. Sci.Technol. A 33, 05E113 (2015).65C. J. Powell, W. S. M. Werner, and W. Smekal, J. Vac. Sci. Technol. A 32,050603 (2014).
66M. Chudzicki, W. S. Werner, A. G. Shard, Y. C. Wang, D. G. Castner, andC. J. Powell, J. Phys. Chem. C 119, 17687 (2015).67C. J. Powell, S. Tougaard, W. S. M. Werner, and W. Smekal, J. Vac. Sci.Technol. A 31, 021402 (2013).68C. J. Powell, W. S. Werner, H. Kalbe, A. G. Shard, and D. G. Castner, J. Phys.Chem. C 122, 4073 (2018).69N. Belsey et al., J. Phys. Chem. C 120, 24070 (2016).70M. Chudzicki, W. S. M. Werner, A. G. Shard, Y.-C. Wang, D. G. Castner, andC. J. Powell, J. Phys. Chem. C 120, 2484 (2016).71W. S. M. Werner, M. Chudzicki, W. Smekal, and C. J. Powell, Appl. Phys. Lett.104, 243106 (2014).72A. Müller et al., J. Phys. Chem. C 123, 029765 (2019).73A. Müller, T. Krahl, J. Radnik, A. Wagner, C. Kreyenschulte, W. S. Werner,B. Ritter, E. Kemnitz, and W. E. Unger, Surf. Interface Anal. 53, 494(2021).74D. J. Cant, C. Minelli, K. Sparnacci, A. Müller, H. Kalbe, M. Stöger-Pollach,W. E. Unger, W. S. Werner, and A. G. Shard, J. Phys. Chem. C 124, 011200(2020).75A. G. Shard, J. Phys. Chem. C 116, 016806 (2012).76H. Kalbe, S. Rades, and W. E. S. Unger, J. Electron Spectrosc. Relat. Phenom.212, 34 (2016).77Innanopart euramet empir project, see http://empir.npl.co.uk/innanopart/.78D. J. H. Cant, A. Müller, C. A. Clifford, W. E. S. Unger, and A. G. Shard, Surf.Interface Anal. (published online) (2021).79International Organization for Standardization, ISO/TR 23713: 2021 SurfaceChemical Analysis -Electron Spectroscopies—Measurement of the Thickness andComposition of Nanoparticle Coatings (International Organization for Standardization,Geneva, 2021).80A. Frydman, D. G. Castner, M. Schmal, and C. T. Campbell, J. Catal. 83, 866(2011).81A. Rafati, R. ter Veen, and D. G. Castner, Surf. Interface Anal. 157, 1737(2013).82S. Techane, L. J. Gamble, and D. G. Castner, J. Phys. Chem. C 115, 9432(2011).83S. Techane, D. R. Baer, and D. G. Castner, Anal. Chem. 83, 6704 (2011).
ARTICLE avs.scitation.org/journal/jva
J. Vac. Sci. Technol. A 39(6) Nov/Dec 2021; doi: 10.1116/6.0001261 39, 063205-13
© Author(s) 2021