applications of pressure analysis and hydrodynamics to ... · applications of pressure analysis and...
TRANSCRIPT

IPA 87-22/07
PROCEEDINGS INDONESIAN PETROLEUM ASSOCIATION Sixteenth Annual Convention, October 1987
APPLICATIONS OF PRESSURE ANALYSIS AND HYDRODYNAMICS TO PETROLEUM EXPLORATION IN INDONESIA
P.J. Cockroft ' G.A. Edwards * R.S.K. Phoa3 H.W. Reid
ABSTRACT
The study of reservoir, fluid and capillary pressures can be very rewarding to the explorationist as well as to the engineer. This paper discusses the concepts of formation pressures and their relationship to geology, and the appli- cation of pressure data towards accurately defining hydro- carbon accumulations and aid exploration for new fields.
Pressure gradients, capillary pressure, relative permeabi- lities and water chemistry under hydrostatic and hydrody- namic conditions are reviewed. In a hydrodynamic environ- ment, fluid movement occurs in response to potential ener- gy differentials; flow is from regions of high to low energy, commonly involving meteoric water influx at topographi- cally elevated intake or recharge regions. The significant topographical relief and high rainfall in the Indonesian Archipelago favor such hydrodynamic mechanisms.
Common effects of hydrodynamic pressure gradients include tilted oil-water contacts, flushed structural or stratigraphic traps, and structurally offset hydrocarbon accumulations, as wall as pools with no apparent trap.
The influence of hydrodynamics on traps - whether they be stratigraphic, fault or unconformity - as well as on the lateral and vertical continuity of accumulations is also discussed.
Further exploration applications of pressure data include identification o f
a. Field boundaries by determination of fluid contacts. b. Hydrocarbon pools that may be in different pressure
regimes, and are therefore separate accumulations, though correlatable on the basis of log character.
c. Migration paths. d. Cellar oil.
Techniques using pressure - depth plots and maps of
A combination of hydrodynamic studies with the stan- potentiometric surfaces are described.
--_-___-____ 1) Consultant 2) Huffco Indonesia
3) Trend International Ltd. 4) H.W. Reid & Associates
dard geological and geophysical exploration techniques may result in a substantial reduction in the finding cost of oil in Indonesia.
INTRODUCTION
The majority of explorationists describe and rank pros- pects and leads by the evaluation of source rock, reservoir quality, and the mapping or recognition of traps. Typically, however, very little emphasis is placed upon the nature and movement of fluids and their relationship with hydrocar- bon accumulations.
This paper will discuss various techniques to measure fluid movement in the subsurface by the utilization of pres- sure relationships. Initially, common fluid-rock relation- ships such as capillary pressure and relative permeability as well as the applications of pressure data under hydrosta- tic conditions are described. The effect of hydrodynamic aquifer conditions on typical hydrocarbon accumulations is then discussed. As conditions in Indonesia favor the existence of hydrodynamic fluid flow, it is suggested that the prudent use of this exploratory tool may help reduce the costs of finding and developing commercial hydrocar- bon accumulations in this country.
CONCEPT OF SUBSURFACE FLUID MOVEMENT
Hydrodynamic flow may be defined as fluid movement which is caused other than by buoyancy effects. The appli- cation of subsurface fluid movement or hydrodynamics concepts to hydrocarbon exploration has in recent years g.?ined renewed acceptance in the petroleum exploration industry. This is especially true in certain areas worldwide, notably Canada, the Rocky Mountains region oft the USA and Russia. This concept was originally discussed by Munn (1909), and Hubbert (1953) in his classic treatise on the general theory of hydrodynamic entrapment, outlined mo- delling and mapping procedures applicable to exploration, complete with mathematical verifications. Subsequent publications by Hill (1961), Hubbert (1967), Dahlberg (1982) and Chapman (1983) among others, documented
© IPA, 2006 - 16th Annual Convention Proceedings, 1987

2
field examples of oil accumulations in active hydrodyna- mic regimes. Recent research by hydrogeologists, particu- larly Toth (1980), has contributed significantly to the understanding of traffic patterns or geometry of fluid miggtion paths in the subsurface, especially vertically, and to the recognition of hydraulic traps in quasi-stagnant regions bet.ween oppositely directed flow systems. With the advent of high-resolution pressure gauges, of obtaining less expensive pressure measurements utilizing wireline techniques, and more rigorous interpretation techniques, the accuracy of mapping subsurface fluid movement pat- terns has increased.
BRIEF REVIEW OF HYDRODYNAMIC THEORY
Potentiomem2 Surface Oil and gas fields are commonly found in permeable
reservoir rocks that cover wide areas. The portion of the re- servoir that is not filled with hydrocarbons can be assumed to be filled with water. This water-bearing portion is called the aquifer. In Figure 1, the reservoir outcrops at A and three oil fields are present in the same aquifer at BrC and D. The water-phase pressure in each field (below the oil- water contact) is simply the height of the vertical column of formation water below the elevation of the outcrop. The level or surface to which such a hypothetical column of water could rise in wells penetrating the aquifer is called the potentiometric surface. The pressure in the oil phase in each field is a function of the density differences between the oil and the water and is discussed later in the text.
Gravitational Fluid Flow In a hydrodynamic environment, fluid movement occurs
in response to potential energy differences; flow is from re- gions of high to low energy. Commonly this is caused by difference in elevation of an aquifer which is exposed at the surface at relatively high topographies (see Fig. 1). Flow through such an aquifer is defined by Darcy's Law and is dependent upon a large hydraulic head and relatively few permeability barriers.
In Indonesia, many producing and potential reservoirs outcrop at nearby topographic highs (Fig. 2). Together with high regional rainfall, this would indicate that condi- tions are suitable for dynamic fluid flow to occur in most sedimentary basins in Indonesia. This is confirmed by che- mical analyses of formation waters which indicate the pre- sence of meteoric or artesian sources in the majority of basins in Indonesia.
Three - Dimensional Flow It is not logical, however, to assume that this flow is
strictly two-dimensional even though apparently confining beds, such as shales, envelop the reservoir in questionSince the magnitude of the flow of a fluid is directly proportional
to the cross-sectional area and inversely proportional to the length of the flow path, the low permeability of a shale is overshadowed by the large cross-sectional area of the con- tact between the formations and the relatively small distan- ce of flow across the tight formation. Thus, the possibility of three-dimensional flow should also be considered.
Effect of Subsurface Fluid Movement Hydrodynamics, or present-day subsurface fluid move-
ment, influences oil migration pathways, and may modify the geometry or location of pre-existing accumulations. Common effects include tilted oil-water contacts, flushed or partially flushed traps, structurally offset oil and gas accumulations, hydrocarbon accumulations in non-closed geologic features, and gas accumulations downdip from, and underlying, water.
Migration .and Flow A common misconception in petroleum exploration is
that migration is always upwards or updip. Actually, migra- tion of subsurface fluids is along paths of local minimum potential, and accumulation occurs at potential minima. When pore water is at rest, potential energy is constant, and petroleum migration is primarily determined by buoy- ancy (the difference in deasity between hydrocarbons and water), involving vertical or updip movement only. When the pore water is in motion, a component of lateral motion is imparted to the migrating petroleum. The magnitude of this component depends upon the density difference of the fluids, whereby, as the density of the petroleum approach- es that of the water, the closer are their directions of mo- tion. The direction of gas migration will be essentially ver- tical, due to its lower density relative to oil and water.
Flow Patterns in Mature Basins
Most hydrodynamic studies worldwide have been con- ducted within mature compacted interior basins which have undergone significant uplift and erosion following deposi- tion and burial. Pressures in such basins typically range from subnormal to artesian, depending upon the height of the potentiometric surface relative to surface elevation. The potentiometric surfaces typically are subdued replicas of the regional topographic expression, and are characterized by hydrodynamic flow from upland recharge areas to dis- charge areas which commonly coincide with topographic depressions. Local geographic features may cause perturbations to this surface, "notably the drawdown effects due to large revers, or recharge at local intake areas. Local deviations from the regional trend may also occur due to change in reservoir character, for example, reduced thickness or permeability, or potentiometric gradient change related to faulting. Closed potentiometric lows correspond to locations of PO- tentiometric minima into which subsurface hydrocarbons

3
tend to migrate and within which entrapment is likely to occur. Note that, in many cases, large portions of mature basins are hydraulically isolated and display pressures which are either greater or less than the corresponding artesian type part of the basin. These pressures are controlled by thermal phenomena or overburden removal and are gene- rally gas-rich, e.g. “Deep Basin” of the Western Canada Sedimentary Basin. (Davis, 1984 and Ward, 1986).
Evidence of Hydrodynamics in Indonesia By contrast, however, in immature, continental margin
basins, hydrodynamic considerations remain under-utili- zed or neglected. This certainly appears to be the case in Indonesia where published reports concerning the effects of subsurface water movement and hydrodynamics are res- tricted to the Salawati Basin (Redmond etaZ., 1976). However, the authors have seen evidence of hydrodynamic influence in selected areas in the Salawati, Kutei, Tarakan, North Sumatra and Central Sumatra Basins.
The presence of meteoric water in aquifers underlying many hydrocarbon cdumns clearly attests to the prevalen- ce of freshwater influx and flushing phenomena within many basins in Indonesia. The actual hydrodynamic effects of such water influx remain to be assessed.
GEOLOGICAL APPLICATIONS OF RESERVOIR AND FLUID PRESSURE DATA
The main driving force controlling upward movement or migration of oil or gas through the subsurface is buoyan- cy. .This buoyancy effect is principally dependent upon the density difference of the fluids concerned. However, ca- pillary forces restrain the migration of hydrocarbons in the subsurface. The capillarity of a specific rock depends on the radius of the effective pore throats of the rocks, the hy- drocarbon-water interfacial tension and wettability.
Capillary Pressure
ways: ‘The term ”capillary pressure” has been defined in two
A. The pressure difference between the oil phase and the water phase across a curved oil-water interface (Le- verett, 1941). This definition can be applied to any two immiscible fluids.
B. The more common definition is that described by core analysis laboratories in terms.of surface tension contact angle and pore throat radius. This is in fac the injection pressure for a specific rock.
The first definition is important for the explorationist as it is the main reason for the trapping of hydrocarbons. This definition allows the use of pressure-depth plots to predict hydrocarbon-water contacts and may also be uti- lized for determination of hydrocarbon column length for
a particular reservoir (Berg, 1976). These two definitions are in fact equivalent (Fig. 3).
The oil-water contact occurs at the lowest elevation at which a continuous oil phase exists (see figure 4). Oil can exist below this elevation but is not producible because of the discontinuous nature of the oil “blobs” (Chen et al., 1986) which can be trapped in the pore spaces and exist as residual oil. The oil water contact can still be at a higher elevation than the free water level and is often seen as staining”, up to 20 to 25 percent, even in a water-wet rock. Capillary properties can affect the level at which water- free oil can be produced in the reservoir (see Fig. 4). Thus, it is obvious that capillary effects do control the amount of structural closure required to trap a particular hydrocarbon accumulation under static conditions (Fig. 5): In Figure 6, the hypothetical structural traps have the same vertical dimensions but the minimum closure for accumulation varies with capillary pressure properties. This phenomenon could be an explanation for some of :the partially-filled traps commonly seen in Indonesia. Thus, when the Gussow (1954) differential trapping theory is invoked, capillary pressure effects should also be taken into account.
Arguably, the most important aspect of capillary pres- sure to the explorationist is not the concept of capillary rise in a tube, but in its significance to the trapping mecha- nisms and the potential production characteristics.
1. Displacement or Entry Pressure.
Displacement pressure (Pd) is the lowest capillary pres- sure at which oil can be forced into a water-wet pore. For normal water-wet sediments, oil cannot enter any water-filled pore space until the capillary pressure across the oil-water interface exceeds the entry or displa- cement pressure of that particular pore opening. The quality or trapping capacity of a seal is determined by this displacement pressure. This displacement pressure is a function of interfacial tension between hydrocarbon and water, wettability and the radius of the largest pore throats. The smaller the effective pore radius, the higher the entry pressure for hydrocarbon movement through that pore space,’ and thus the hlgher the capillary pres- sure (sealing capacity) becomes (Downey, 1984).
2 . Capillary Pressure Gradients
The rate at which capillary pressure increases with decreasing depth (above a hydrocarbon-water contact) is called-the capillary pressure gradient (Fig. 7). This gradient is a function of the density difference between the fluids. A common ‘ h l e of thumb” for Indonesian oils is 0.1 psi per foot(Figure 9 assumes hydrostatic con- ditions). If hydrodynamic forces are active, this gradient can be modifed according to the direction of flow (Figs. 8 and 9).

4
.3. Hydrocarbon Column Calculations The explorationist may need to estimate the expected hydrocarbon column height that can be trapped in a given pore system. Smith (1966) and Berg (1975) show- ed that such calculations are possible with knowledge -of the capillarity and fluid properties. Stone and Hoeger (1973) show the practical use of this in their delineation of Creataceous reservoirs in Wyoming. Schowalter (1979) indicated that even oil “shows” could be quanti- fied, if capillarity properties and fluid saturations were known, to determine the maximum hydroCarbon co- lumn that could be associated with a given “show”. Use of such data could also prove valuable to the deve- lopment geologist or engineer to estimate downdip li- mits of production. The calculations of column heights are based on hydrostatic conditions only. If hydrodyna- mic conditions exist, then these column lengths can be increased or decreased if downdip or updip hydrodyna- mic flow is present.
Relative Permeability When a porous medium contains more than one immis-
cible fluid, as happens in bydrocarbon-bearing reservoirs, each restricts the flow of the other. The permeability to one of the fluids, expressed as a percentage of the single- phase permeability, is the relative permeability. Thus, pro- duction ratios (e.g. water cut) are primarily controlled by relative permeabilities.
As the capillary-pressure gradient in a reservoir under hydrostatic conditions is controlled by the density diffe- rence of the wetting and non-wetting phases, the capillafy pressure will increase linearly above the oil-water contact, and the maximum capillary pressure will exist at the structurally highest continuous-phase hydrocarbon. At this point, the water saturation is at a minimum, therefore the relative permeability to) oil is at a maximum. Relative permeability can, therefore, be directly related to capillary pressure.
If the presence of water in a water-wet membrane such as a shale acts as an effective barrier to migration because hydrocarbon movement is blocked, then such a seal is dependent on relative permeability properties. Thus, per- haps relative permeability and wettability measurements should be taken in seals.
PressureDepth Relationships
Pressure-depth plots can theoretically be utilized to determine differences in the gas-oil, oil-water or gas-water contacts within a field and to define the continuity or otherwise of each static fluid phase. Sometimes it is diffi- cult to adequately define gas-oil and oil-water contacts because of the similarity in gradients. In these situations, it may be necessary to use pressure-depth plots with confi- dence only where large hydrocarbon columns are encoun-
Some of the more common applications include: 1. Determination of Fluid Depths
Knowledge of the extent of a hydrocarbon accumulation is essential for acreage evaluation and future development. The most common field boundary is that defined by the oil-water or gas-water contact. A good approximation of sucli a contact can be undertaken with a minimum of two initial reservoir pressure in the oil and water phases, res- pectively. An algebraic method using only one pressure has been suggested (Roach, 1963), but greater accuracy can obviously be made with more pressure measurements.
In Figure 10, an oil test at 350 ft subsea depth was made and the extrapolated pressure was estimated to be 345 psi. The oleostatic gradient determined for this particular oil was 0.35 psi/ft at reservoir conditions. Well 2 intersected the same formation, but tested water at a depth of 1950 ft subsea at an extrapolated pressure of 880 psi. A hydrosta- tic pressure gradient of 0.44 psi/ft was then determined for this water. As can be seen, the pressure gradient lines inter- sect at 1250 ft subsea. As mentioned previously, the capilla- ry pressure at this level is zero, therefore this is the oil- water contact under hydrostatic conditions. Obviously this method is dependent upon the accuracy of the pressure measurements and assumes hydrostatic conditions. Use of this method to estimate reserves should be treated with caution, as there are examples worldwide of stratigraphical- ly trapped oil where a higher aquifer pressure than expected was found. This pressure difference, if extrapolated to a projected oil-water contact, could lead to an erroneously large estimate of reserves. It has been our experience in Indonesia that thin, discontinuous sands may be slightly overpressured, and the above method should be used with discretion in these cases.
2. Separate Hydrocarbon-Bearing Zones On a pressure versus subsea depth graph, true reservoir
pressures taken in a hydrocarbon phase will fall on a static line, the slope of which represents the subsurface pressure gradient of that phase. Thus, separate hydrocarbon accu- mulations can be identified by the use of pressure-depth plots even if other means of correlation are not possible. Hannon (1967) described such a case in the Keg River reef accumulations in Canada. Note that only virgin pressures, recorded prior to significant withdrawal of fluid from a pool, should be used in such a technique.
In Figure 1 1, from Dickey (198 1) three wells, each pene- trating three sands, are shown. Routine log correlation in- dicated that sands A, B, and C were correlatable and pre- sent in each well. However, when the appropriate pressu- res were plotted, it became obvious that sand B is fully connected and 1A and 2A are in the same pressure regime. Sand 3A is 40 psi too hgh and is probably a separate body. Similarly, 2C and 3C are in a common pressure regime with
tered. each other, but not with 1C.

5
The use ofpressures as a correlating device can therefore be extremely useful, especially in multi-layered reservoirs such as in the Kutei and Tarakan Basins, Kalimantan, and in regions of multiple faulting where missing or repeated sec- tion is not obvious from log correlation.
Another hypothetical example of the use of pressure- depth.plots is shown in Figure 12. The discovery well A, together with the seismic interpretation, indicated a field of economic proportions. The Engineering Department was asked to estimate a production forecast and go out to ten- der for production facilities. The explorationists drilled well B, supposedly on the same structure. This well also tested large amounts of gas from a DST high in the well. The well was then deepened t o a point estimated to be above the gas-water contact but produced water. The ex- plorationists had doubts about the validity’ of these re- sults, but nonetheless the pressure-depth plot provided confirmation that the two wells were in separate accumu- lations. As individual reef masses typically have common aquifers and hence common pressure gradients the discon- tinuous nature of the gas accumulations could have been predicted from the pressures in test 4, before penetrating the water leg.
3. Acreage Evalution (Field Extension) The pressure-depth plot can be used to determine
whether a new discovery is in the same pressure regime as a known field, and acreage between the two may be upgra- ded as a result.
4. Hydrocarbon Phse Areal Continuity Pressure-depth plots can be used to determine areal
extent of a particular hydrocarbon phase. The example in Figure 13 is from a deltaic channel sand depositional environment. Wells 1, 2, 3, 4, 6 and 11 determine the con- tinuity of the large accumulation and the oil-water contact. Well 9 identifies a smaller, separate accumulation. Wells 5, 7, 8 and 10 have a definitive deviation from the hydrostatic gradient for the density of water encountered (for example, greater than 1000 psi between wells 3 and 5). The downdip flow of water indicated by the plot creates a favorable hy- drodynamic environment which could account for the large size of the accumulation. The mechanism by which down- dip flow enhances accumulation size is discussed later in the text.
5. Mapping Zones of High Dansmissibility Mapping of high transmissibility or high permeability
zones can sometimes be aided by pressure-depth plots. Because of the high permeability of reefs the pressure gradients may appear as hydrostatic along any specific in- dividual trend. In other words, the pressure system of each reef would appear static, but with different pressure-depth properties.
This principle is shown in Figure 14. Three exploratory
wells (marked X) were drilled far beyond the known limits of reefal development (130 kilometers away). However, they encountered reefal material of high permeability. Are these an extension of any of the known trends? The pres- sures and depths were plotted and it was determined that the wildcats were in the trend “A” reef system. Further exploration could, therefore, be extended to the south of the ccA” trend.
Determination of Fluid Densities
In order to determine the true subsurface fluid densities and true subsurface pressure gradients, it is absolutely ne- cessary to convert surface-measured density values for water, oil and gas to subsurface conditions.
1. Formation Waters Subsurface water density ranges from 0.95 to 1.2 g/cc
(0.41 1 to 0.520 psi/ft static gradients) and is dependent upon temperature and dissolved ionic components (Salini- ty). Pressure has little effect on the density due to the low compressibility of water, whereas temperature has a more significant effect. However, salinity imparts the greatest influence on the subsurface water density. Th,e relatively fresh formation waters, together with the high formation temperatures found in Indonesia suggest that subsurface densities may be slightly less than the standard surface gradient. For example the average gradient of the waters of the Miocene carbonate Kais Formation in Irian Jaya is only 0.428 psi per foot (compared to 0.433 pd/ft, the standard surface fresh-water gradient at 60 deg. F).
2. Oil The principal factors that influence subsurface oil densi-
ty are solution gas-oil ratio, pressure and temperature. The correction for subsurface oil density is far greater for oil than for water, mainly becquse of its higher compressibility due to the gas in solution. Typical oil gradients range from 0.25 to 0.35 psi per foot with increasing MI gravity. Re- combined PVT data provide the most reliable subsufface density estimate as standard correlations developed else- where are not strictly applicable to Indonesian conditions.
3. Gas The density of subsurface gas is very low compared to
oil and water and can be obtained from PVT analysis, if available. Often the selective use of the equation PV = ZnRT can be applied to estimate subsurface gas densities. Subsurface gradients are again a function of pressure and temperature and composition of the gas, particularly the amount of heavy “ends”. Gas gradients typically range from 0.02 (dry gas) to 0.10 (wet gas) psi/ft.
IMPORTANCE OF FORMATION WATER PROPERTIES
A recent study (Cockcroft et al., 1987) showed that

6
waters of meteoric origin are ubiquitous throughout Indo- nesian producing basins. The survey also indicated that waters associated with hydrocarbon accumulations com- monly have different compositions compared to those below the oil-water contact, Most meteoric waters in South East Asia typically have total dissolved solids less than 10,000 mg/l and contain abundant bicarbonate and some sulphate, whereas the relative proportions of magnesium and calcium are quite low. One recommended procedure to utilize these data is to examine zones where total dissolved solids are higher than average, which may indicate protec- tion from flushing. This technique was applied in a study of a fresh-water environment in the Douleb Field, Tunisia (Coustau, 1977), as well as in previous work in the Kutei Basjn (Lalouel, 1979). In the Handil field (Lalouel, 1979), formation waters found below oil-water contacts generally have a salinity of 6,000 ppm NaCl equivalent or less, where- as salinities above this contact can range up to 18,000 ppm. Salinity is not the sole criterion, however; analysis of the dissolved ionic composition, if performed accurately, can be more diagnostic, especially by comparing the relative proportions of sulfate and chloride ions.
TRAPPING AND MIGRATION IN A HYDROSTATIC ENVIRONMENT
A true seal lacks connected filaments of hydrocarbons (Schowalter and Hess, 1982) and might be simply a non- commercial reservoir where pore structure and saturations do not allow water-free hydroc&bon production. It is in- teresting to note that the term “hydrocarbon reservoir” is a commercial expression, whereas a “seal” is purely a techni- cal expression (and does not vary with the price of oil).
Many explorationists corisider that shales are the only seals, but this is not necessarily the case. In a preferentially water-wet and water-saturated reservoir, hydrocarbons will tend to migrate upward to structurally high positions due to the effect of bhoyancy. A difference in pressure between the oil and the water is needed to force an oil-water inter- face into a particular pore space. If this capillary pressure is not sufficient to force the interface through the pore throats of the structurally updip sediments, these updip sediments will act as a barrier to upward migration of the oil, regardless of their permeability. They can thus be des- cribed as seals, regardless of de i r lithology.
If the capillary pressure is sufficient to force the oil- water interface through the pores of the updip sediments, these sediments will no longer act as barriers to migration. The magnitude of the capillary pressure at which this oil- water interface enters the barrier ‘is the displacement or entry pressure of the trapping barrier described previously. Due to the buoyancy of the oil or gas contained in the water wet rock, the capillary pressure at any position in an oil column increases in direct proportion to the length of
the oil column (below that position) under hydrostatic conditions. Therefore, under hydrostatic conditions, the entry pressure of any barrier can be interpreted in terms of the maximum length of the oil column that can be support- ed below the barrier. In the case of a medium gravity oil, which is common in Indonesia, and in normal formation- water salinities, (i.e. a capillary pressure gradient of 0.1 psi per foot) the maximum length of oil column is typically about 10 ft per each psi of entry pressure of the barrier.
HYDRODYNAMIC CONDITIONS
Occurrence of Hydrodynamic Conditions
It has been shown in many areas of the world that hy- drodynamic conditions are common, and hydrostatic condi- tions are the exception rather than the ruIe. This is com- monly so in regions of high elevation andcontinuous reser- voirs where meteoric water influx is observable. However, many of these hydrodynamic gradients are different from those expected from observed topographic relief and known outcrop elevations. In these cases the simple lateral artesian flow model may be insufficient to explain the ob- served flow patterns, and crossformational flow should be taken into account (Toth; 1980). The authors have mapped hydrodynamic gradients in areas where flow might be least expected such as:
a. in areas of negligible topographic relief, such as Australia
b. in areas of very low rainfall, such as the West Sirte Basin in Libya (less than 1 inch annual rainfall) where broad, slow-moving regional subsurface water flow is evident in Eocene carbonates (Fache Formation).
In nature, an absolute permeability barrier is rare or non- existent, except in pure evaporite beds (provided they do not have carbonate stringers which allow leakage). In Indo- nesia considerable subsurface water flow is expected be- cause of the high rainfall and pressure heads. This may be reduced somewhat because of the intense late tectonics and basin subsidence interrupting lateral continuity of permea- bility to the outcrop. Nonetheless, hydrodynamics is defini- tely a factor to be considered.
Effects of Hydrodynamic Pressure Gradients
1. Tilted Oil- Water Contacts Under hydrostatic conditions hydrocarbons will rise as
a result of the buoyancy effect caused by the density diffe- rence of the fluids. However when hydrodynamic conditi- ons occur, a force from the potential gradient will be added as a vector to this buoyancy factor. An accumulation of oil will move in the direction of the resultant force.
If a datum-pressure difference is caused by water flow- ing within a vertical closure beneath an oil accumulation,

7
the oil water contact will be tilted in the direction of water flow. High velocity is a requirement in high permeability rocks in order to generate a steep pressure gradient which of course in turn is essential to cause a tilted contact. The steeper the pressure gradient the greater the tilt. Pressure gradients can be generated in two ways: a. Either throqgh friction loss on flow through tight rock,
or
b. Through flow at high velocity. In a high transmissibility zone it is essential to have high velocity to produce a steep gadient.
The flank dips of anticlinal traps must have a caprock reservoir rock interface that is steeper than the hydrocar- bon water interface if the hydrocarbons are to be retained. If this is not the case, the commonly observed “flushed” traps could be the result.
Circumstances can exist under which no hydrocarbons will remain in the crest of the anticline, with the result that an exploratory well located on the crest will encounter only water (an apparent eedry” structure) whereas a well drilled some distance downdip in the direction of water flow may intersect. hydrocarbons. This type of displace- ment is more likely with an undersaturated oil than an oil with an associated gas cap. An example of this phenomenon is the Upper Valley Field in Utah, U.S.A. (see Fig. 15), which has a tilted oil-water contact in every producing zone (Sharp, 1976). Variations of MI gravity from 27 deg. near the crest of the structure to 19 deg. at the southern end of the field have produced a curvilinear oil-water contact. Note that there are water-productive wells that are struc- turally higher than oil-producing wells (Fig. 15). Another notable feature of this field .is the high water ve- locities, a key requirement to produce the steep gradients necessary for tilting of interfaces in highly transmissible rocks.
Tilted Contacts“1nduced” by Production An induced tilted contact from nearby production has
been noted in the Cairo Field, Arkansas, USA (Fig. 20). This field lies a few miles northeast of the Schuler Field which also produces from the same Smackover limestone reservoir. The Schuler Field was placed on production eleven years before the Cairo Field, and the oil contact slope has been affected by production at the Schuler Field. Wells in the south-western region of the Cairo field curren- tly produce from below the original oil-water contact whereas at the opposite end of the field this contact has risen. Thus a combination of hydrodynamic flow and the nearby production has accelerated this tilting.
Indonesian Example of Tilted Contact An example of a tilted contact from the Badak field,
Kutei Basin, East Kalimantan is shown in Figure 17. The logs indicate the presence of oil overlying water in three
wells which encountered a distributary sand approximaiely 70 ft thick. In each case an oil-water contact is present, with a broad transition zone and a thin oil column at irre- ducible water saturation.
The discrepancies in subsea depths s f the fluid contacts are interpreted to be principally related to hydrodynamic effects. Though the calculated angle of tilt is small (less than two degrees), this is significant when related to the low flank dips of the structure which are less than four degrees in tlhs vicinity. As a result, the oil-water contact on the east flank exhibits a shift, in plan view, of approxima- tely 1000 ft further towards east than would be the case in a purely static setting. Such a tilt is unlikely to be due to capillarity variation alone, as illustrated in Figure 18. Simi- larly, the maximum estimated survey depth error between wells is less than ten feet, based on gas-water contact data noted in adjacent reservoirs.
Exploratory Significance of Tilted Contacts The-major exploration application is to detect tilted or
ercells” oil accumulations in fields where the downdip extensions have not been fully developed, or to find new pools which had been tilted off the top of the structure and trapped within a plunging nose.
It is noted that the detection of tilted oil accumulations has not been as frequent as might be expected because: 1. If the oil is tilted from the structural crest then it may
have been tilted right out of the structure (provided that the oil gravity is low and the dip is moderate to low).
2. When oil is discovered in a structure without recourse to hydrodynamic principles, the field is usually developed by regularly spaced delineation wells, and hydrodyna- mic concepts are not given credit for the new reserves encountered.
3. A key requirement for a tilted contact is high water ve- locity. This can only occur in areas where there is a ho- mogeneous reservoir (i.e. a rrpipeline”) uninterrupted by permeability barriers. Permeability barriers slow the velocity and hence many areas with high rainfall and lar- ge elevation differences between intake and discharge areas (artesian systems) do not have structures with tilted contacts simply because the velocity is reduced due to intervening permeability barriers. The prime example of this is the Western Canadian sedimentary basin, where no tilted contacts have been recorded in any of the numerous oil fields discovered to date. Areas where tilted contacts caused by hydrodynamic flow are best documented are in Wyoming, and particularly the Bighorn Basin, where relatively homogeneous reservoirs have high velocity water flow (Hannon, 1987).
The major use of the tilting concept from an exploration standpoint lies in risk evaluation and in prospect ranking. The analysis of the geometric configuration of each strut-

8
ture to determine its tolerance to numerous possible hy- drodynamic gradients becomes very important. The objec- tive is to find those structures which are least likely to have undergone flushing by hydrodynamic fluid movement.
TRAPS IN HYDRODYNAMIC ENVIRONMENTS
Structural. Traps
A basic premise of exploration for structural traps under hydrostatic conditions is four-way dip closure. If a regional flow direction can be determined under hydrodynamic con- ditions, this premise may not be critical for prospect drill- ing approval. If a structure lacks west closure but easterly flow is evident, then this prospect could be equalljj as fa- vorable as others with full closure. Also, on a closed struc- ture in an area of hydrodynamic influence, it may be pre- ferable to drill on the flank rather than the crest, to take advantage of any possible tilting of the accumulation, as long as the flanks of the structure have a dip greater than the tilt factor.
Later tectonic movement can also cause a static accu- mulation in a structural trap to become subject to dynamic conditions. This can result in severe modification of the initial accumulation. Figure 19 illustrates how oil can mi- grate to another structure if tilting takes place, causing oil to be spilled from the earlier-filled structure.
Stratigraphic Traps
Stratigraphic traps have often been found to be produc- tive in one region, but barren in a similar geologic setting elsewhere. It is suggested that the direction of hydrody- namic flow is a prime consideration in assessing the potenti- al of such stratigraphic traps. . Where downdip water flow conditipns prevail, the water at the updip edge of a given oil accumulation in a strati- graphic trap is at a higher pressure than it would have been under completely hydrostatic conditions. Conversely, under updip flow conditions, a barrier with a given entry pressure will hold less oil column than it would have held under static conditions. This is discussed in detail below.
Influence of flow component on trap holding capacity
Under hydrostatic conditions the hydrocarbon holding capacity is defined as follows :
Pd (1) Zmax = --___--___
(grad w - grad h)
= length of oil column (feet) where Zmax Pd = displacement pressure of “leakiest”
stringer in the updip barrier (psi) = subsurface gradient of water (psi/ft) grad w
grad h = subsurface gradient of hydrocarbon (psi/ft).
If downdip flow occurs, then the water pressure in the barrier facies is higher than it would have been under static conditions. Thus an additional term is added to Equation (1) to give (2) below:
where Phyd = additional pressure difference across accumulation caused by downdip flow
HD = hydrodynamic
Inspection of (2) shows that downdip flow enhances the trap holding capacity of a given barrier. The amount of increase for medium gravity oil would be approximately 100 feet of column per each additional 10 psi of downdip flow component.
Conversely, if updip flow occurs, the trap holding ca- pacity will be reduced as the pressure at the updip facies is less than it would have been at static conditions. Con- sequently the hydrodynamic term now subtracted from Equation (1) gives Equation (3) below:
(grad w - grad h) (grad w - grad h)
Thus Zmax HD is reduced.
Therefore updip flow across potential stratigraphic traps can be “bad news” whereas downdip flow enhances such a prospect.
Exploration Philosophy for Stratigraphic Traps in Areas of Hydrodynamic Flow
Core, thin section and microscope analyses indicate that numerous thin laminations of low entry pressure leakage paths exist in many stratigraphic trap barriers. With such leaks existing in barriers, a downdip hydrodynamic c.onditi- on greatly enhances the possibility of a commercial stra- tigraphic trap accumulation. If the hydrodynamic pressure gradient is of a significantly large magnitude and if the barrier entry pressure is relatively small, then a hydrody- namic analysis need only determine if the flow has an updip or a downdip component to fully evaluate the exploration merits of the prospect.
If the flow has a definite updip component, the trap may not hold a commercial hydrocarbon accumulation unless the entry pressure of the barrier is extremely large. A reservoir pinching out into a perfect shale membrane with no interconnected silt stringers or bedding planes may possess the required large displacement pressure. However, the statistical possibility of finding such a perfect pinchout is rather remote, hence this type of prospect would have a very high exploration risk. A proper hydrodynamic analy- sis with sufficient data can determine if this seal is effective. If hydrostatic conditions prevail, or the flow has no definite

9
updip or downdip component, the prospect can be consi- dered as less attractive.
In Central and Eastern Alberta, every Viking Formation (Cretaceous) gas field from Provost to Westlock is located in area of downdip flow. In particular, the Joffre Oil Field, with 1000 ft of column, is located in a downdip flow re. @me and owes its present existence to downdip flow. This is because, as the entry pressure measurements made in the updip barrier facies show, it is only capable of holding 50 to 100 ft under static conditions. Thus over 90 percent of the accumulation is due to downdip flow.
The existence of a downdip fluid-potential environment is a critical factor responsible for the large size of oil accu- mulations in some Cretaceous Muddy Formation reservoirs of Wyoming, as shown by Stone & Hoeger (1973) and Berg (1976).
By contrast, in western Alberta there are several Viking Formation oil fields located in an area of updip flow but these are, in every case, trapped against major lithologic barriers (e.g. Ferrier and Garrington Fields, pers. comm. Hannon, 1987).
Exploiation for stratigraphic traps in a hydrodynamical- ly favorable area should result in a higher success ratio and a higher statistical probability that the oil fields found will have thicker oil columns than expected under hydrostatic conditions.
Fault Traps Oil and gas fields bounded by faults are commonly
thought to be trapped by impermeable rock, either in the fault zone or thrown against it (i.e. the seal prevents fluid flow). Smith (1966) noted that fault traps can also be trapped by capillary pressure differences on both sides of the fault. However, there are examples of pools that are hydrodynamically sealed by faults, at times with the more permeable reservoir acting as the seal and containing water updip (Eremenko, 1974).
The flow of water around a fault which is at an angle to the direction of flow is similar to the flow around a tree trunk in a stream. Some water will flow through the fault but most will flow around it. The change in gradient and diversion of flow effected by a fault in a dynamic environ- ment will often change the potential oil-trapping capability. The effect of the fault on the prospect depends upon the type of play (structural or stratigraphic) and the magnitude and direction of the regional hydrodynamic gradient.
The areal extent of the influence of a fault on the regio- nal hydrodynamic gradient approximates the area that lies within a circle with radius equal to the length of the fault and center at the mid-point of the fault. Thus the low- potential side of a fault represents a preferential environ- ment for entrapment of hydrocarbons. Of course further evaluation is needed vertically to determine which indivi- dual reservoirs may,be affected by this phenomenon. .
Unconformity Traps A reservoir that subcrops in unconformable angular
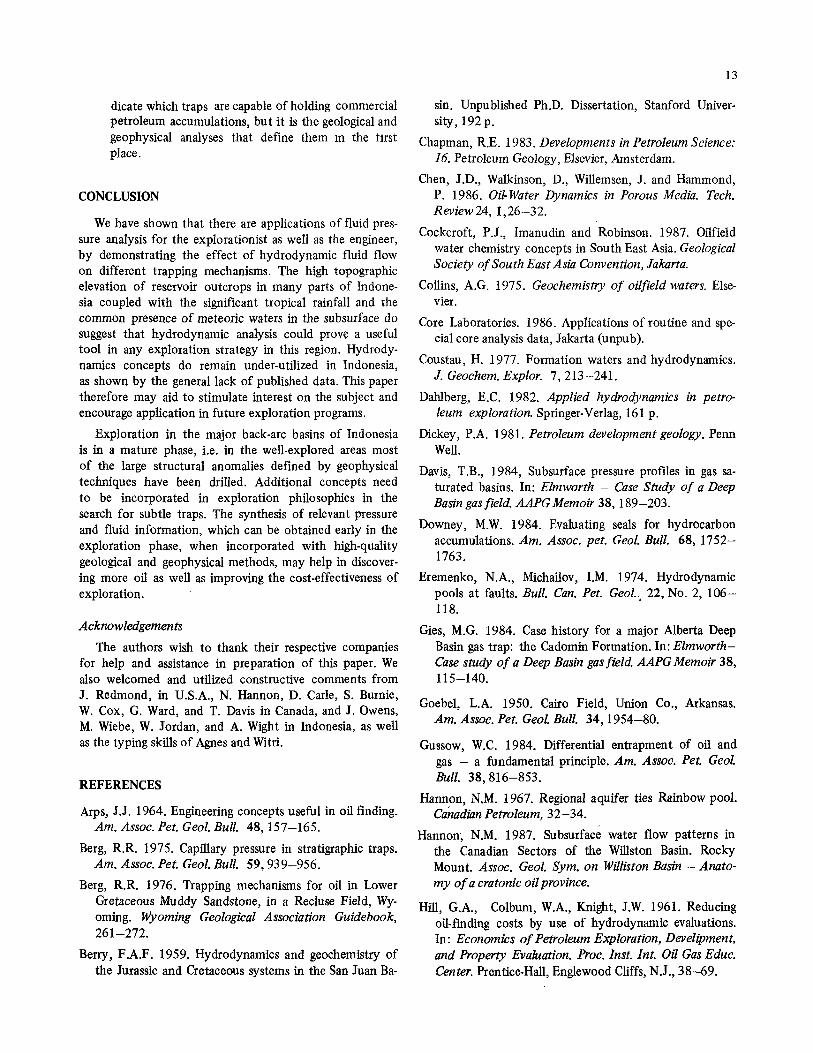
contact with an overlying bed can represent an attractive exploration target. The hydrodynamic gradient, if present, will again influence the accumulation capacity of this type of trap. A downdip water flow will substantially increase the oil-holding capacity of an unconformity trap. The Midale Field, in southeast Saskatchewan, Canada, contains an oil column of 600 ft against a regional unconformity, with entrapment being controlled by a favorable downdip flow environment (Fig. 20).
Extensive mercury injection work by Mobil and Shell indicated relatively weak entry pressures, of the order of 10-15 psi. (Hannon, 1987). These pressures could only support an oil column of approximately 100 ft if the system were static. The observed 600 ft column is more than 80 percent supported by downdip flow. Even more remarkable is the fact that this downdip flow in the Midale beds is simply a local reversal in flow direction (see Fig.20). It can be seen that flow is updip in the beds above the Midale, (Poplar and Ratcliffe Beds) and these beds are barren of oil fields. The flow direction then locally revers- es against the unconformity zone and enters the lower potential Midale Beds, flowing downdip and preserving these huge columns. In the Frobisher, Alida and Tilston Beds below the Midale, flow is again updip, and in these beds the only oil fields are small accumulations with minor columns (Mission Canyon fields). The local reversal of re- gional flow at the unconformity surface has been termed a “baffle plate” phenomenon and was first recognized by Petroleum Research Corporation in 1959. Recent work by Hannon (1987) has documented this in detail with present day control. The Midale Field remains one of the most spectacular examples of unconformity traps modified by hydrodynamic flow (both updip and downdip).
Faulted and Fractured Cap Rocks
Many prospects in tectonically disturbed regimes, such as in Indonesia, have faults or natural fractures intersecting the cap rocks and other“sea1s”. The possibility of hydro- carbons leaking out of such a prospective trap can be of a major concern to explorationists. Again the same principles apply - oil and gas will enter and leak through the barrier if the capillary pressure of the hydrocarbonkwater interface exceeds the entry pressure of the fracture or fault. Howe- ver, these entry pressures are difficult to determine, since the fractures are usually extremely heterogeneous. If such heterogeneity exists, the capillary pressure of an oil or gas accumulation must be low, in order to remain less than the lowest entry pressure in any portion of the fault or frac- ture.
The capillary pressure will be low in the upper part of a commercial hydrocarbon accumulation only if a higher datum pressure. exists in the cap-rock fracture or fault

10
gouge above the accumulation. This higher potential will tend to make the formation water flow downward through the fracture or fault. This condition could exist if the fault or fracture intercepted formations with higher potentials. In such a hydrodynamic environment, a substantial hydro- carbon accumulation could be trapped with low entry-pres- sure open. fractures or permeable fault gouge without the oil or gas leaking upward through these open channels. However, if the next formation cut by the fracture or fault has a lower datum pressure, this will reduce the potential hydrocarbon-trapping capacity of the presumed trap.
There are some instances worldwide of accumulations where oil has migrated downward to zones of lower datum pressure. The Rangely Field, Rio Blanco County, Colorado is one such example. The authors have also seen this in under-saturated oil reservoirs after significant production of a structurally lower zone.
If a faulted reservoir has a potentiometric surface higher than intake topographic elevations, this is generally unfa- vorable for fault entrapment. This could be because the high reservoir datum pressures, together with low-entry pressure faults have caused the loss of hydrocarbons to the surface by migration up the fault planes.
The amount of hydrocarbons able to move through even tiny fractures and fissures is quite remarkable. Muskat (1949) illustrated this in a hypothetical case where a single 0.001 inch open fracture overlying a 500 foot oil column would leak at a rate of 150 million barrels per year.
No Apparent Trap In the Deep Basin in western Canada, huge volumes of
oil and gas (estimated gas-in-place of 1,750 tcf) are trapped in lowporosity, low-permeability sandstone reservoirs which grade updip into porous water-saturated sands. There is no apparent seal, as gas is continuously leaking updip (Masters, 1984). The potentiometric surface indicates downdip hy- drodynamic flow, at least in the more porous sands, which increases the entry pressure requirement with respect to the migration path of the gas. In Figure 21, (after Gies, 1984) the right-hand pressure depth plot ‘‘ B ’ shows the relation- ship of the gas with the overlying water.
Note that the gas-water contact is at the top of the gas zone. This is contrasted with the conventional situation in plot “A”of Figure 25. An early theory was that high water saturation in the updip rocks could cause a ‘(water block” similar to that which occurs around a wellbore with deep invasion. For example, at 65 percent water saturation, a rock with 1 md permeability to water could have negligible permeability to gas. Currently it is though that there is a dynamic “bottleneck trap”, where the gas leaks off at a steady rate, but continuing gas generation keeps the trap full.
Another example of a field with no apparent trapping
Basin, USA (Berry, 1959).
Geopressures Where geopressured reseyoirs are juxtaposed against
normally pressured reservoirs&the trapping capacity is great- ly enhanced. Webereta1.,(19$’8) and Downey (1984) noted that trapping capacities of reservoirs on the downthrown side of growth faults are increased if higher than normal pressures exist on the uptGoown si&e (Fig. 22), under tlie influence of strong hydrodynamic flow. Thus proper analy- sis of the distribution of pressures in various fault blocks can provide a much improved assessment of trapping risk for exploration prospects.
EVALUATION OF HYDRODYNAMIC CONDITIONS
The basic techniques for evaluating hydfodynamic conditions consist of preparation of pressure depth plots and potentiometric surface maps. A step by step flow chart is depicted in Figure 23.
Data Requirements The data requirements for a successful hydrodynhic
evaluation can vary considerably. At times the pressure data from only a few wells may be sufficient to evaluate an adjacent prospect, however, usually data from many wells are needed for prospect evaluation. When only regio- nal hydrodynamic mapping to establish general-flow trends is required, a few widely spaced pressures may suffice. However, the need for greater resolution grows with the maturity of the exploration program.
The accuracy of pressure data is very important. The use nowadays of high-resolution pressure gauges has significant- ly increased the accuracy of such data. Amerada or Bourd- on-tube pressure gauge data that were the norm up to the 1980’s have an accuracy of t /-0.25 percent of pressure gauge range, whereas the current electronic gauge has an accuracy of better than 0.01 percent. With the advent of new computerized methods of test interpretation, where a simulated pressure match can be made on data that was previously unusable, more accurate reservoir pressures can be calculated (Home eta!., 1986). The utilization of tech- niques such as the pressure derivative can also enhance this process (Htein et al., 1987).
Estimates of formation pressures should be undertaken by an experienced well test interpreter, as many erroneous scenarios have been suggested as a result of the use of unstable, Final Shut-In Pressures, rather than pressures ex- trapolated to static conditions by a Horner plot or similar technique.
Data evaluation and regional trend analysis are depen- dent upon three main factors:
1. Recision of pressure data - - - closure with hyd;odynamic influences i s in the Sari Juan 2. Distribution of control points

11
3. Accuracy of*e structural and sedimentary assumptions utilized in the interpretation and contouring of inferred flow patterns.
PressureDepth Plots As prefiously described, if accurate formation pressures
from a number of wells penetrating one continuously per- meable water filled reservoir are plotted on a graph of pres- sure versus subsea depth, the plotted points fall along a specific gradient. The slope of this line corresponds to the linear increase of pressure with depth. In a static reservoir with negligible fluid flow, this slope represents the weight of the formation water per unit depth.
In a dynamic reservoir, these pressures when plotted against subsea depth may still fall along a common gradient i$ the flow is directly updip or downdip and the reservoir is continuously permeable. However, the slope of a strongly dynamic gradient will be steeper than that of the static fluid gradient when flow is downdip, and less steep when the flow is updip, as shown in Figure 8. For all pressures in a single formation from numerous wells across a basin to fall along a single gradient line (either static or dynamic), there must be continuous transmissibility across the basin (i.e. without intervening permeability barriers).
Such a situation is of course uncommon, as in most aquifers there are numerous discontinuities or interruptions to flow such as faults, facies changes, locally tight regions, local decreases in thickness, etc. Thus in most regional hydrodynamic studies, it is found that instead of a single gradient representing the formation water pressures, there are several parallel gradient lines separated by pressure drops caused by permeability reductions, as shown in Figure 24.
In this example a continuous aquifer extends from an outcrop in a region of high topographic relief and re-emer- ges at a lower elevation. The intake or recharge area on the left is a conduit for rainwater or surface water to flow through the aquifer until the discharge point is reached. Obviously this flow is very slow, usually on the order of inches per year. Two major permeability bGriers are pre- sent, and are expressed in the pressure-depth plot as discon- tinuities in the pressure systems.
In many studies, however, only a portion of the basin is available for evaluation. In such cases the flow direction can be established from the pressure-depth plot. The two barri- ers cause the gradient lines to be displaced to a lower ener- gy level, because as the water flows across the barriers there is a drop in potential due to the friction loss. Fluid flow in the subsurface is assumed to be governed by Darcy’s Law, which is dependent upon permeability. The lower the per- qeability the greater will be the pressure drop for a given flow rate. This explains why the barriers are indicated in the pressure-depth plot. In contrast, in high transmissibility regions (between the barriers) there is negligible pressure
drop, and the formation water pressures appear as conti- nuous gradient lines.
Potentiometric Surfaces The “potential” or hydraulic head in a well represents
the height above a datum to which formation water will rise in the well due to the pressure in the reservoir. These po- tentials from a number of wells define the potentiometic surface. Water will flow, if a transmissible path is available, from a zone of high potential to a zone of low potential. This is not the same as movement from zones of high to low pressure. The pressure gradient is more important than the absolute pressures.
When formation pressure and formation water density (expressed in similar units) are known, the hydraulic head can be directly calculated, and related to sea level, to pro- vide the hydraulic head. Examples of this calculation are illustrated in Figure 25, using the formula below:
HH =
P = W = E = D =
P
W m = - (D - E)
elevation of hydraulic head (feet or meters above or below sea level) bottom hole pressure (psi or kPa) Water gradient (psi per foot or kPa per meter) elevation of Kelly bushing (feet or meters) depth of producing formation (feet or meters)
The graphical technique devised by Hubbert for predicti- on of oil and gas accumulation as a function of the poten- tiometric surface and aquifer configuration is known as U.V.Z. mapping. The term U represents the oil isopotential surface, V the water isopotential surface and Z is the eleva- tion above or below a constant datum. Hubbert demons- trated that U and V are functions of fluid densities and fluid heads:
u = ( D::Do)( Ho ) Do - densityofoil Dw - density of water Ho - hydraulic head (oil)
v = ( _----_ Dwh-Do) ( H w ) Hw - hydraulic head
andU = V - Z
Slope of HC/water contact = TAFx slope of pot. surface.
The slope of the hydrocarbon-water contact, also termed the critical dip, 0, may be calculated as follows:
delta Hw _-_--- - - ( ___-_- Dw ) ( ______- ) = t a n 0 delta Z delta X Dw -Do delta X where X = horizontal distance separating data points
Z = elevation above or below a datum (e.g. sea I level).

12
Since fluid densities are usually known or can be estima- ted, and hydraulic heads are obtained from pressure mea- surements, solving for U is readily accomplished. Z values represent the structure contours mapped at top reservoir level. The V maps are potentiometric maps amplified by the TAF value so that they become maps of the conceptual sur- face of critical dip. A simple overlay of the water potential map with the structure contour map provides a graphical solution for U, the oil entrapment potential. Closed con- tours of low potential are possible areas of oil accumulati- on and the contours are possible oil/water contacts.
Preparation of Potentiometric Surface Maps
A potentiometric surface map will show the pattern of water flow through a given reservoir rock in a basin. The use of this type of map in combination with structure and isopach maps of the same reservoir will indicate areas of barriers to flow, increased or decreased transmissibility, and updip or downdip flow.
The construction of a regional potentiometric surface map is similar to that of a structure contour map. The ele- vation of the formation being studied is determined at points along its outcrop where a stream crosses the formati- on and then plotted on a map. Frequently a good idea of water flow direction can be determined from a plot of such outcrop elevations alone.
Formation pressures are then interpreted from test data, and are converted to a common datum (usually sea level). The potentiometric surface data are then contoured in the same way as structural contours are mapped. The direc- tion of flow is in the direction of potential surface drop normal to the contours. In those areas where no outcrops occur, the hydrodynamic interpretation' must be based primariIy on subsurface pressure data.
The general geology of a basin can usually be outlined prior to actual exploration. However, the interpretation of the geology becomes more accurate as more data are acquired from further wildcat drilling. The hydrodynamic interpretation similarly increases in accuracy with new data.
A regional potentiometric surface map could be pre- pared at the same time as the regional structural and stra- tigraphic maps. The regional potentiometric map can then be used to high-grade areas for detailed structural and other studies. The potentiometric map should be of the same scale as the other maps SG that overlays can be pre- pared if necessary. For example, isopach maps indicating reservoir pinchouts can be superimposed with potentio- metric surface maps in areas of downdip flow, thus in- creasing the chances of a large accumulation being found.
The gradient of the water flow is determined by the transmissibility of the aquifer. If the thickness or permeabi- lity of this aquifer changes, the gradient of water flow will also change. This will be reflected.on the potentiometric
surface map and indicate areas of anomalous permeability changes which can be associated with stratigraphic traps.
Figure 26 is an example of a regional potentiometric surface map in the Salawati Basin (Redmond and Koesoe- madinata, 1976). Regional flow from east to west is indi- cated from the potentiometric map, which is consistent with the geologic configuration of Kais Formation outcrops in the east and basin center located to the west. Obviously, during the past eleven years more data have become avai. lable which could modify this map considerably.
Regional Determination of a Hydrodynamically Favorable Area
Prior to the acquisition of acreage in a region, explora- tion staff could determine the hydrodynamically favorable areas and then concentrate further detailed geological evaluation in these areas. A lower risk could be applied to prospects in these favorable areas, especially in the case of stratigraphic plays where downdip flow exists.
If insufficient data are available to establish the flow direction, the most promising structural prospects could be drilled initially, and properly designed well test (espe- cially in the water legs!) can be taken in all aquifers (even if there are no shows or log indications of hydrocarbons). Note that, for valid pressure information, full shut-in periods are needed, even in water tests - many companies abort tests when water is found, thus eliminating valuable data measurements.
A regional trend can be established from just a few pres- sure measurements. Then, based on the regional flow pat- tern, either the most favorable stratigraphic plays could be drilled or the more marginal prospects farmed out with a provision for adequate testing.
As more pressure and water analysis data become avai- lable, the hydrodynamic map can be refined and other prospects subsequently outlined. Hydrodynamically fa-. vorable trends can usually be outlined early in the explora- tion history of an area, long before the trend is established by producing fields and dry holes.
Two important considerations must be understood be- fore hydrodynamics can be used as an effective exploration tool:
a) The first consideration is that pressure data must be accurate enough for practical hydrodynamic analysis. When drill stem tests are run properly and suitably interpreted, reliable use of these data can be accom- plished. The marginal extra cost to obtain usable pressure data from drill stem tests is more than justi- fied by the extra information gained.
b) The second consideration is that hydrodynamics is not a substitute for geological and geophysical me- thods. Pressure and hydrodynamic analysis- may in-
13
dicate which traps are capable of holding commercial petroleum accumulations, but it is the geological and geophysical analyses that define them in the tirst place.
CONCLUSION
We have shown that there are applications of fluid pres- sure analysis for the explorationist as well as the engineer, by demonstrating the effect of hydrodynamic fluid flow on different trapping mechanisms. The high topographic elevation of reservoir outcrops in many parts of Indone- sia coupled with the significant tropical rainfall and the common presence of meteoric waters in the subsurface do suggest that hydrodynamic analysis could prove a useful tool in any exploration strategy in this region. Hydrody- namics concepts do remain under-utilized in Indonesia, as shown by the general lack of published data. This paper therefore may aid to stimulate interest on the subject and encourage application in future exploration programs.
Exploration in the major back-arc basins of Indonesia is in a mature phase, i.e. in the well-explored areas most of the large structural anomalies defined by geophysical techniques have been drilled. Additional concepts need to be incorporated in exploration philosophies in the search for subtle traps. The synthesis of relevant pressure and fluid information, which can be obtained early in the exploration phase, when incorporated with high-quality geological and geophysical methods, may help in discover- ing more oil as well as improving the cost-effectiveness of exploration.
Acknowledgements The authors wish to thank their respective companies
for help and assistance in preparation of this paper. We also welcomed and utilized constructive comments from J. Redmond, in U.S.A., N. Hannon, D. Carle, S. Burnie, W. Cox, G. Ward, and T. Davis in Canada, and J. Owens, M. Wiebe, W. Jordan, and A. Wight in Indonesia, as well as the typing skills of Agnes and Witri.
REFERENCES
Arps, J.J. 1964. Engineering concepts useful in oil finding. Am, Assoc. Pet. Geol. Bull. 48,157-165.
Berg, R.R. 1975. Capillary pressure in stratigraphic traps. Am. Assoc. Pet. Geol. Bull. 59,939-956.
Berg, R.R. 1976. Trapping mechanisms for oil in Lower Gretaceous Muddy Sandstone, in a Recluse Field, Wy- oming. Wyoming Geological Association Guidebook,
Berry, F.A.F. 1959. Hydrodynamics and geochemistry of the Jurassic and Cretaceous systems in the San Juan Ba-
261-272.
sin. Unpublished Ph.D. Dissertation, Stanford Univer- sity, 192 p.
Chapman, R.E. 1983. Developments in Petroleum Science: 16. Petroleum Geology, Elsevier, Amsterdam.
Chen, J.D., Walkinson, D., Willemsen, J. and Hammond, P. 1986. Oil-Water Dynamics in Porous Media. Tech. Review 24, 1,26-32.
Cockcroft, P.J., Imanudin and Robinson. 1987. Oilfield water chemistry concepts in South East Asia. Geological Society of South East Asia Convention, Jakarta.
Collins, A.G. 1975. Geochemistry of oilfield waters. Else- vier.
Core Laboratories. 1986. Applications of routine and spe- cial core analysis data, Jakarta (unpub).
Coustau, H. 1977. Formation waters and hydrodynamics. J. Geochem. Explor. I, 213-241.
Dahlberg, E.C. 1982. Applied hydrodynamics in petro- leum exploration. Springer-Verlag, 16 l p.
Dickey, P.A. 1981. Petroleum development geology. Penn Well.
Davis, T.B., 1984, Subsurface pressure profiles in gas sa- turated basins. In: Elmworth - Case Study of a Deep Basin gas field. AAPGMemoir 38, 189-203.
Downey, M.W. 1984. Evaluating seals for hydrocarbon accumulations. Am. Assoc. pet. Geol. Bull. 68, 1752- 1763.
Eremenko, N.A., Michailov, I.M. 1974. Hydrodynamic pools at faults. Bull. Can. Pet. Geol. .. 22, No. 2, 106- 118.
Gies, M.G. 1984. Case history for a major Alberta Deep Basin gas trap: the Cadomin Formation. In: Elmworth- Case study of a Deep Basin gas field. AAPG Memoir 38,
Goebel, L.A. 1950. Cairo Field, Union Co., Arkansas.
115-140.
Am. Assoc. Pet. Geol. Bull. 34,1954-80.
GUSSOW, W.C. 1984. Differential entrapment of oil and gas - a fundamental principle. Am. Assoc. Pet. Geol.
Hannon, N.M. 1967. Regional aquifer ties Rainbow pool. Canadian Petroleum, 32-34.
Hannon; N.M.. 1987. Subsurface water flow patterns in the Canadian Sectors of the Willston Basin. Rocky Mount. Assoc. Geol, Sym. on Williston Basin - Anato- my of a cratonic oil province.
Hill, G.A., Colbum, W.A., Knight, J.W. 1961. Reducing oil-finding costs by use of hydrodynamic evaluations. In: Economics of Petroleum Exploration, Develipment, and Proper@ Evaluation. Proc. Inst. Int. Oil Gas Educ. Center. Prentice-Hall, Englewood Cliffs, N.J., 38-69.
Bull. 38,816-853.

14
Home, R.H., Perrick, J.L., Barua, J. 1986. The use of mi- crocomputers in well test data acquisition and analysis. S.P.E. Symposium on Petroleum Indusny Applications of Microcomputers, Colorado.
Htein, N., Williams, DH., eockcroft, P.J. 1986. Applica- tion of the pressure derivative iAanalysis of Indonesian reservoirs. eoc. Indonesian Petroleum-Association 15th Annual Cbniention.
Hubbert, M.K. 1953. Entrapment of petroleum under hy- drodynamic conditions. Am. Assoc. Pgt. Geol. Bull.
Hubbert, M.K. 1967. Applications of hydrodynamics to oil exploration. 7th World Pet. Cong. Proc., ,,Mexico
Krayushkin, V.A. 1967. Effect of capillary pressure on dis- tributiqn of gas and oil occurrences in lateral migration of oil and gas. Int. Geol. Rev. 10, No. 8,lO-15.
Lalouel, P. 1979. Log mterpretation in deltaic sequences. Proc. Indonesian Petroleum Association, Eighth Annual Convefition.
Leverett? M.C. 1941. Capillary behaviour in porous solids. ALME Trans. 142,152-169.
37,1954-2026;'
City, lB , 1954-2026.
'
Martin, B. 1967. Variation des caracteres chimiques des eaux . dans les niveaux poreux duBassin de Parentis. Chron. Hydrogeol. 12,77-89.
Masters, J.A. 1984. Lower Cretaceous oil and gas in Wes- tern Canada. In: Elmworth case study of a deep basin
Mohanty, K.K., Davis, H.T., Scriven, L.E. 1987. Physics of oil entrapment in water-wet rock SPE Reservoir Engi- neering, 113-128.
Monn, M.J. 1909. The anticlinal and hydraulic theories of oil and gas accumulation. Econ. Geol. 4, No. 6 , 509- 529.
Muskat, M. .1949. Physical principles of oil^ production. McGraw-Hill, New York, 597-618
Petroleum Research Corp. 1960. Interpretation of hydro- dunamic cbnditions. Denver, Colo, Research Report -4-1 (unpub). .
' gas field. AAPGMemoir 38,l-33.
Petroleum Research Corp. 1 960. Exploration applications of pressure measurements. Denver, Colo, Research Re- port A-9 (unpub).
Redmoni, J.L. and Koesoemadinata, R.P. 1976. Walio Oil Field and the Miocene carbonates of Salawati Basin, Irian Jaya, Indonesia. Proc. Indonesian Petroleum Asso- ciation Fifth Avznual Convention.
Roach, J.W. 1963. How ,to determine oil-water contacts using one point control: World Oil, 12/63,87-90.
Schowalter, T.T. 1979. Mechanics of secondary hydrocar- bon migration and entrapment. Am. Assoc. Pet. Geol. Bull. 63,723-760.
Schowalter, T.T., and Hess, P.P. ,1982. Interpretation of subsurface hydrocarbon shows. Am. Assoc. Pet. Geol. Bull. 77,1307-1327.
Sharp, G.C. 1976. Reservoir variations at Upper Valley Field,, Garfield County, Utah. Rocky Mount. Assoc. Geol. Symposium, 325-343.
1966. Theoretical considerations of sealing and non-sealing faults. Am. Assoc. Pet. Geol. Bull. 50,
Smith, D.A.
363 -3 74.
Stone, D.S., Hoeger, R.L. 1973. Importance of hydrody- namic .factors in formation of Lower Cretaceous com- bination traps, Big Muddy-South Glenrock Area, Wyom- h g . 4 m . Assoc. Pet. Geol. Bull. 57,1714-1733.
Toth, J. 1980. Cross-Formational Gravity-Fof of Ground- water: A mechanism of the transport and accumulation of petroleum (The generalised, hydraulic theory of pe- troleum migration). In: Problems of Petroleum Migra- tion (edited by Roberts and Cardell). AAPG Studies in Geology 10.
Ward, G.S. 1986. Subnormal and abnormal formation pres- sures in the Western Canadian Sedimentary Basin. Can SOC. Pet. Geol-Ann. Convention.
Weber, K.S., Mandl, G., Pilaar, W.F., Lehner, F. and Pre- cious, R.G. 1978. Growth fault structures. 10th Off- shore Technology Conference, Paper ,3356, 1537- 1580.

15
cr 0 > -
I
.- . m a

98'0
0'E
.
1 14'
00'
E
130'
00'
E
0'00' s
8'00' s
16'0
0'
S
OU
TCR
OP
PIN
G R
ES
ER
VO
IRS
I N
DO
NE
S I A
N' A
RC
HI P
EL
AG
O
3'00'
N
0
Leg
end
:
......
.. N
EO
GE
NE
CL
AS
TIC
S
= PALE
OG
EN
E C
LA
ST
ICS
= MIOC
EN
E C
AR
BO
NA
TE
250
500
0 -
KM
S.

17
h
CAPILLARY PRESSURE EQUATIONS ( A F T E R C O R E L A B O R A T O R I E S , 1 9 8 6
P -
A t Equilibrium: Force Up = Force Dowri Force Up = 2 n r T Cose Force Down=nr2* h e (DW-DH) g
Capillary Pressure= Force/Unit Area Pc = Force Up/ n r 2 = Force D o w n l n r 2
FIGURE 3

INIT
IAL
FLU
ID D
ISTR
IBU
TIO
NS
1 .o 1
0 45
90
100%
I ~
I
s,w
4---
-
-j-
-
I I
I lrr
educ
ibe
oil +
I
Initi
al w
ater
oil
co
nt
s
1
Reg
ion
of
irred
ucib
le
wat
er
satu
ratio
n
al a
0 30
sw. %
90
100
I W
ater
free
oil
------
Wat
er fr
ee o
il
Oil
and
wat
er
---t
- W
ater
on
I y
I TY
PE
O
F PR
OD
UC
TIO
N
Rel
atio
nshi
p be
twee
n ty
pica
l co
re - de
rived
pre
ssur
e in
form
atio
n an
d flu
id p
rodu
ctio
n.
FIG
UR
E 4

RE
QU
IRE
D C
LO
S U
R E
CO
NTR
OLL
ED
BY
CA
PIL
LAR
Y P
RE
SS
UR
E
( A
FT
ER
AR
PS
, 19
64 1
EFF
EC
T O
F D
EN
SIT
Y D
IFFE
RE
NC
E
Pw
- Pg
= 1
0 P
w -P
o =03 P
w -P
o =
0.1
CAP1
LLA
RY
PR
ESSU
RE
-CU
RV
ES
a
MlN
lMlM
CLO
SU
RE
RE
QU
IRE
D F
OR
H
IGH
GR
AV
ITY
OIL
- FR
ES
H F
OR
MA
TIO
N W
ATE
R
- 2 x
GA
S t 0
.1 I rl
IGH
GR
A\
)IL
(0
.81
_.
OW G
RP
Oil
10.9
I
k-
Lu
u
LL I
CR
ITIC
AL
WA
TER
S
AT
UR
AT
ION
45
loo
MN
IMU
M
CLO
SU
RE
R
EW
IRE
D
INTE
RS
lTlT
l AL
W
ATE
R S
ATU
RA
TIO
N (
Sw
1
FIG
UR
E 5

VA
RIA
TIO
N O
F FL
UID
PR
OPE
RTI
ES D
UE
TO C
AP
ILLA
RY
DIF
FER
ENC
ES
( A
FT
ER
K
RA
YU
SH
KIN
, 1
96
7.
....
....
....
- 5, ,%
S
urf
gce
of
wat
er
..
.
.
....
...
--c
45 9G
Por
= 1
0%
sw
,~/o
P
br
= 1
5"
~
Por
= 2
0%
P
cr
= 10
%
Per
m=
I rn
d P
err
ii -60 rr
~l
Ce
rnl=
40
0 m
d P
erm
=I
mid
Htr
-
He
igh
t (
anip
litud
e) o
f st
ruct
ura
l tr
ap
Hm
-
Min
imu
ni
heig
ht n
eces
sary
for
acc
umul
atio
n of
wat
er -
free
oil
in
tra
p
Wat
er .
free
oi
l (
Sw
2
5-4
5%
)
1-1 T
ran
siti
on
zo
ne (
Sw
45 - 80
%)
Oil
-fre
e w
ate
r (S
w 8
0-1
00%
)
1-1 F1
Aq
uif
er
with
10
0% w
ater
sat
urat
ion
Flow
dir
ect
ion
of
late
ral
mig
ratio
n o
f oi
l a
nd
wat
er
Por
= 2
0%
P
erm
=400 m
d
FIG
UR
E 6

2 1
Z 0
121 Z 0 0 0
~C l -
Oc w 0 Z
~c
0
Oc w
w
--I
0
Z ~C Z
w 0 ~c 0
0 Z
0
00
I -
v
I u ~ z ~ a : o I - -C~
t-,- 10 ~ OC
~zz~ ~J
~ 0
~ o ~
/
f , ' l " ' l l l = IhJ
f / ~ ~'l'l' 'l'llll''~O'" " ~ ~
I
0 ~ 7 " . " j - -
J 7 / ~ a_
Y / / ~ ".21
o >- _ ~ 1 " - ~ ~ . . . . . . ~ . - ~
£ I ,,\o/ o
0 I 1 I I I 1 I I ~ 0
0 0 0 0 0 0 0 0 0 0 0
1.~ 33A37 E I 3 1 V M 331=1.=1 3AOSV . I . H D I 3 H
~ 2 I1.
M ~
'~ o
0 ii i i
a .
I - -
0 J
W I Z
m
la .

22
W m I a W I-
a
a
2 LL 0 I- 0 -I n I I- n W n I w a - 30
> LL 0 I- 0 W LL U W
r 0 0 0 Eu
0 0 0 0 ln
I I 0, 14 H l d 3 Q
0 0 a0
0 0 (0 .-
ul n
w a n
0 0 (u
0
0 0 v)
I F

EF
FE
CT
OF H
YD
RO
DY
NA
MIC
FLO
W O
N B
UO
YA
NC
Y F
OR
CE
IN
AN
OIL
RE
SE
RV
OIR
FO
R
CO
NS
TA
NT
HY
DR
OC
AR
BO
N C
OL
UM
N H
EIG
HT
(
AF
TE
R S
CH
OW
AL
TE
R.
19
79
1
Pb : B
UO
YA
NC
Y P
RE
SS
UR
E
WA
TE
R S
AT
UR
AT
ED
SIL
TS
TO
NE
(
LA
TE
RA
L C
ON
FIN
ING
BE
D )
/ /
: C
AP
ILL
AR
Y P
RE
SS
UR
E
UP
OlP
FL
OW
P
bu >
Pbs
1 J
W >
W
J
W
I- a s W
W
L
W > 0
4
I- S
w I
a m 2
FIG
UR
E 9
N
w

24

USE
OF
PRES
SURE
-DEP
TH F
OR
CO
RR
ELA
TIO
N
( A
FTE
R D
ICK
EY
, lQ
8l.
)
Dep
th B
elow
I
Sea
Lev
a1
Wel
l i
Wel
l 2
Ft
I W
ell 3
“aA 0 3A
2450
1 1
I I
I I
80
0
850
900
950
I00
0
toso
44
00
Pre
ss
ure
, p
si
FJG
UR
E 1
1

2 6
Z 0 I
I-
--I
0 ^
< o o
< o O - m
LIJ
<
m ~ m
0 0 ~
O ~ P
z ~ 0 - . i
I - < 0 i
LI= i
i== Z IJJ 13 i
. . . . . • :. :::il "
....... ~:~ ililili!il:iii::!::!l .... :::::::::::::::::::::::::::::::::::::::::::::::::::::
/ T I---
~5:":> .".'.. ?)w..~i?:?;5;".:-:5:.'.'?.':~. I I (b
/ " I i a:
I I " '> 4 m j - > > . . . . . ILl lad W
~ J u J
~1 I , I i \ ~ ._ E I I I ) ~ o
~gl ) i ) I y ,~J
~SiiF~:~i~!:~i:!!i~i~i:i!2?51: ~: """" " '
' I I
~.:. 5:;...|;.~.~;.~ .::,.;;:.:..I :;. j.'.- :,:..~ I;:.;.....g.... ;.; :'.: :. ;; >;.:...?;:i;.;.5..-.::..:.::#.:~ ~?;::i;i~;~: :i ;:;;-:: I.:: :; ;;. ~: .;;:: ~. ~. :i :F.~ ::.?2;~ :!:;i;;~i;-?:i::i;;.(~i: ;,I
" • ~'-- 5.?:.:. .. . . "4.. : : 2. '-' ' ~.5... '.'..:'.:.: ? .".9-..);:'.'; :5.'Z .. • ,}
' ~:"~!! ~::::::::i!:?:::: :: :i:::: :::::::::::::::::::::: f: :~::: ::::~:::i:~il ~i: : ===================================================::: ::/:i:::::::ii!: !
~: ~ :::::?.::: :::::I::-:>::~?: ~:::::.-:::/ :i>:::::::~: i:: . l l~_r~..:....:?~v:.;:..-'.>:..;..:.~s::'- " '; :"":;:"I ....... • ~..'":.:<~.::.":::. I :::?.::.:.
~ J ' / .~" a. ~ -- I I ~L// ~'~.\~
~ - - - ' - - ' - ...."1 >,~"
o 0 o o
I J I
/ _&"
(oesqns ~ea~) Z
0 L L
g
v
bJ
0 O9 0 bJ
CL

0
-1000
c
0
0 '? n 3-2000
a - Q
0 c - N -3000
-40
00
IDE
NT
IFIC
AT
ION
OF
CO
NT
INU
ITY
OF
A H
YD
RO
CA
RB
ON
PH
AS
E I
N
DE
LTA
IC C
HA
NN
EL
SA
ND
ST
ON
ES
(
AFT
ER
PE
TRO
LEU
M R
ES
EA
RC
H C
OR
PJ
."
no
n -
oil
bo
rin
g
Del
taic
S
and
C
hann
els
@ -3820
1000
I4
50
1900
2350
2 800
PR
ES
SU
RE
(p
ail
FIG
UR
E 13

IDE
NTI
FIC
ATI
ON
OF
CO
NTI
NU
OU
S Z
ON
ES
OF
HIG
H T
RA
NS
MIS
SIB
ILIT
Y
( A
FTE
R P
ETR
OLE
UM
RE
SE
AR
CH
CO
RP.
)
TR
EN
D A
TR
EN
D
C
/ P
= 2
65
0 ',
I '
TR
EN
D
-1000
w
1oc
@-
98
5
P.2
28
0
ps
i a
- 50
0'
+I0
00
0
- 0
u
0 -
1 oo
a n a m c
0
u c - N -2
00
0
-30
00
I000
15
00
2
00
0
23
00
3
00
0
PR
ES
SU
RE
(p
si)
FIG
UR
E 1
4
MA
P
VIE
W
RE
EF
F
AC
IES
T
RA
P
\
I .
1
N
00

29
SUBSURFACE MAP OF THE UPPER VALLEY RESERVOIR SHOWING TILTED OIL ACCUMULATION OFFSET TO THE SOUTH
( AFTER SHARP, 1976
N
4 UPPER VALLEY FIELD, UTAH
Oi l - Woter contoct sloping 3 d e g r e e s to the southwest
*@0 Structure contour, / feet above sea level
0 OIL PRODUCTION
/-
2 Kms 0 1
2 MILES
FIGURE 15

TILT
ED
CO
NTA
CTS
IND
UC
ED
BY
PR
OD
UC
TIO
N
CR
OS
S-S
EC
TIO
N
THR
OU
GH
TH
E C
AIR
O,
AR
KA
NS
AS
OIL
FIE
LD (
Goe
bel,
19
50
)
OR
IGIN
AL
OIW
CO
NT
AC
T
(-7
54
0)
-----_
--
/--z--
--
DE
NS
‘E
LIM
ES
TO
NE
7
CA
IRO
, A
RK
.
1.
DO
MA
L S
TR
UC
TU
RE
WIT
H
OR
IGIN
AL
LY
HO
RIZ
ON
TA
L O
IL-W
AT
ER
C
ON
TA
CT
.
2.
PR
OD
UC
TIO
N O
F N
EIG
HB
OR
ING
PO
OL
IN
DU
CE
D
AR
TIF
ICIA
L
TIL
T O
F
OIL
-WA
TE
R
INT
ER
FA
CE
.
3.
PE
RIO
D O
F A
DJ
US
TM
EN
T W
AS
TW
EL
VE
YE
AR
S.
4.
TIL
T O
F
10
0 F
EE
T P
ER
M
ILE
.
FIG
UR
E 1
6
w 0

31
h
m
a
t 2 8 z z
0
.. .. ..
..
.. ..

TIL
TE
D O
IL-W
ATE
R
CO
NT
AC
T W
ITH
CH
AN
GIN
G R
OC
K C
HA
RA
CT
ER
IST
ICS
(a
fte
r A
aps,
19
64
WA
TE
R-F
RE
E O
IL
PRO
DU
CTI
ON
A
BO
VE
TH
IS
CO
NTA
CT t
WE
LL
-I
S
I
IES
10 0 K 0
SW
%
100
I I
WE
LL -
2
SP
I I I I I I I
,R' I I
FRE
E W
ATE
R S
UR
FAC
E lC R
o 0
S
wo/
~ 10
0
PO
RO
SIT
Y
= . 2
0%
P
ER
ME
AB
ILIT
Y
= 400 rn
d
10 0 y 0
Sy%
10
0 I I I I I I I
WE
LL- 3
I .o 0 0
Sw
%
100
I
= 10
Yo
POR
OSI
TY
POR
OSI
TY
= 15
%
PE
RM
EA
BIL
ITY
=
60
rnd
PE
RM
EA
BIL
ITY
=
1 m
d
32

33
MODIFICATION OF AN OIL ACCUMULATION DUE TO TECTONISM
AND MOVING WATER ( After Collins ,1975 1
1 BEFORE TECTONISM
I AFTER TECTONISM
TECTONIC TILTIN(3
4. UPLIFT J 7
FIGURE 19 1
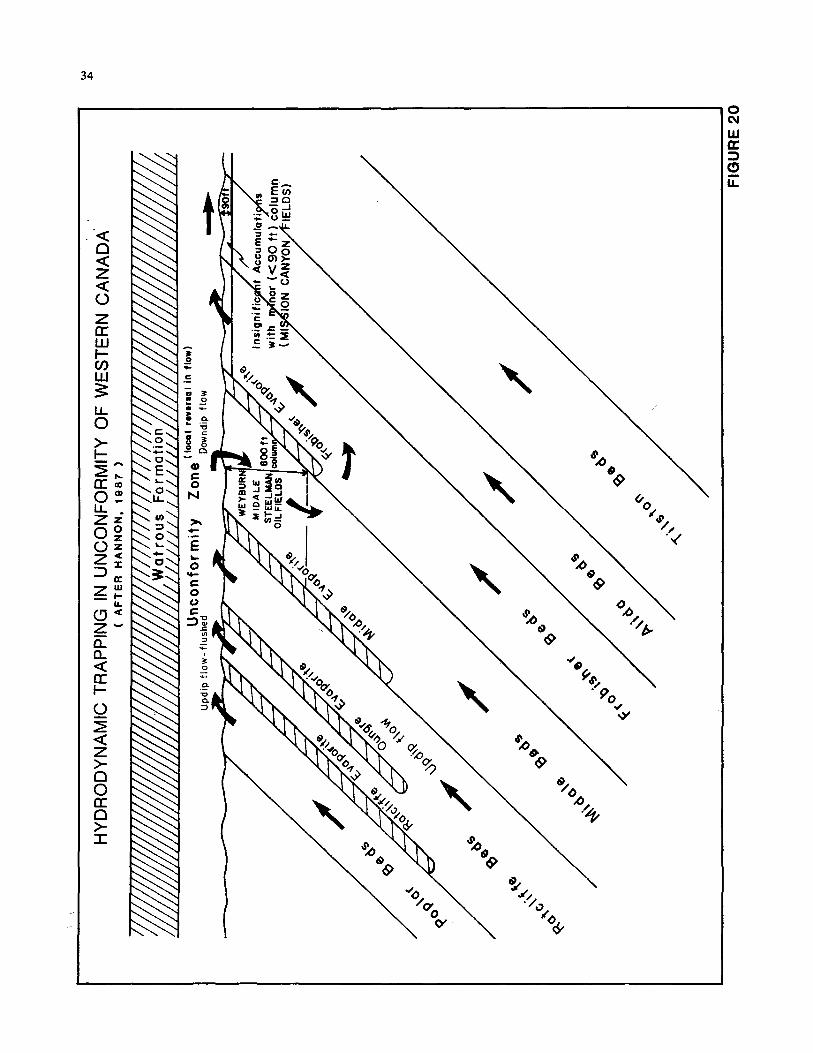
34
CL a. Q a I-
0 I Q z > 0
>- I
n a n
0 (u
W a 3 (3 iz

PR
ES
SU
RE
-DE
PT
H
RE
LA
TIO
NS
HIP
S B
ET
WE
EN
CO
NV
EN
TIO
NA
L A
ND
D
EE
P B
AS
IN G
AS
TR
AP
S
( A
FT
ER
G
IES
. 1
08
4
CO
NV
EN
TIO
NA
L G
AS
TR
AP
v
PR
ES
SU
RE
,
I
l- W a
a 1
B
DE
EP
BA
SIN
GA
S
TR
AP
PR
ES
SU
RE
,
FIG
UR
E' 2
1
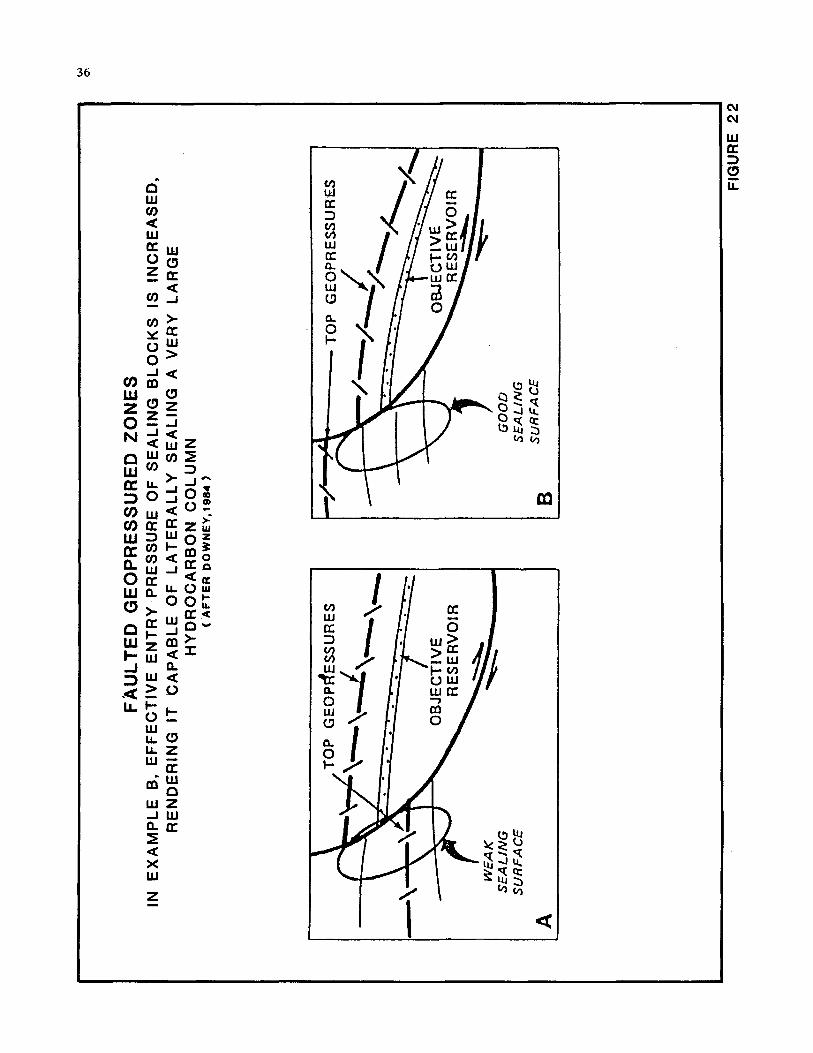
FA
UL
TE
D G
EO
PR
ES
SU
RE
D Z
ON
ES
IN
EX
AM
PL
E B
, E
FF
EC
TIV
E E
NT
RY
PR
ES
SU
RE
OF
SE
AL
ING
BL
OC
KS
IS
IN
CR
EA
SE
D,
RE
ND
ER
ING
IT
CA
PA
BL
E O
F L
AT
ER
AL
LY
SE
AL
ING
A
VE
RY
L
AR
GE
H
YD
RO
CA
RB
ON
CO
LU
MN
(
AF
TE
R D
OW
NE
Y.1
984
1
SU
RF
AC
E
A
GO
OD
S
EA
LIN
G
SU
RF
AC
E
B
FIG
UR
E 2
2

37
FLOW CHART FOR HYDRODYNAMIC STUDlES
DATA BASE
DATA SCREEN
FORMATION PRESSURES FROM DST , RFT
WATER ANALYSES OR .RW STUDIES
NG ELIMINATION AND RANKING OF ELIMINATION OF CONTAMINATED WATERS I
PRESSURE-DEPTH PLOTS
ESTIMATION OF RESERVOIR CONTINUTY I IDENTIFICATION OF LOCAL PRESSURE SYSTEMS
POTENTIOMETRIC SURFACE MAPPING
CONVERT PRESSURES TO POTENTIOMETRIC SURFACE RECOGNITION OF BARRIERS, ANOMALIES
DEFINE REGIONAL FLOW PATTERNS
HYDROCARBON ENTRAPMENT MAPPING
COMPUTER MODELLING
INTEGRATION WITH GEOLOGICAL DATA,
LOCATION OF FAVORED SITES FOR ACCUMULATION
IF FEASIBLE AND COST EFFECTIVE, MODEL
FLUID FLOW WITH RESERVOIR SIMULATOR
REGIONAL SYNTHESIS COMBINE WITH REGIONAL DATA AND KNOW LEDGE
PROSPECT RECOMMENDATION
I RANK PROSPECTS IN ORDER OF PRIORITY I
FIGURE 23

38
WATER INTAKE AREA
I k- a. w n a
m w u)
I3 v)
1
I I
I I \ \
PRESSURE SYSTEM 2
\ r -\ \ -.
\ -.\ \.I A p 2 1 \
SYSTEM 3
PRESSURE / DEPTH PLOT
a High Perrneobility
a Low Perrneobility
Flow Direction
PRESSURE ---+
PRESSURE-DEPTH RELATIONSHIP FOR A SEMI - CONTINUOUS AQUIFER ACROSS A BASIN(WITH TWO MAJOR PERMEABILITY BARRIERS)
FIGURE 2

I
1500
-
1000
-
500 -
Sea
Le
vel
.-
w
L
2 -5
00
-
2 !- -1
000
-
U >
w -1
500
-
-200
0 -
-2500 --
CA
LCU
LATI
ON
OF
SLO
PE
OF
PO
TE
NT
IOM
ET
RIC
SU
RFA
CE
A
CR
OS
S A
BA
SIN
INT
AK
E A
REA
\:
::3:
....
..
...
....
..
...
....
....
~ ....
. ..
...
....
. ..
..
....
. ..
...
A :::::
::::,
....
. ..
...
....
. ..
. ....
..
. ..
..
...
....
..
...
....
..
...
....
..
..
..
..
..
....
. ..
...
....
..
..
RLS
ER
VO
IR
n
U
C
A B
C D
E
F
M
EA
SU
RE
D
PR
ES
SU
RE
( P
SIG
)
0
10
32
1
19
1
79
6
43
3
87
EL
EV
AT
ION
( K
8 )
I6 80
I3
00
1
05
0
10
0
4 5
0
I0
0
(FE
ET
AM
SL
)
GA
UG
E D
EP
TH
( F
t K
B
) 0
2500
3050
17
00
1500
75
c
0.433
0. 430
0.43G
0.43
0 0.
433
0.4 33
WA
TER
GR
AD
IEN
T (
PS
I /F
OO
T
1
PO
T E
NT
IOM
ET
RIC
+
I68
0
+I
20
0
+7
70
+
25
0
-50
-450
SU
R F
A C
E 1
S.L.
DA
TUM
FLO
W
FIG
UR
E 2
5

KA
lS F
OR
MA
TIO
N P
OTE
NTI
OM
ETR
IC S
UR
FAC
E
( A
FT
ER
RE
DM
ON
D E
T A
L 1
878
P 0
FIG
UR
E 2
6