applications of advanced composites to steel bridges… · 2017-12-22 · these bridges, and the...
TRANSCRIPT

APPLICATIONS OF ADVANCED COMPOSITES TO STEEL BRIDGES:
A CASE STUDY ON THE ASHLAND BRIDGE (DELAWARE-USA)
by
Michael J. Chajes Angela P. Chacon
Matthew W. Swinehart Daniel R. Richardson
Gary C. Wenczel Wei Liu
Department of Civil and Environmental Engineering College of Engineering University of Delaware
MARCH 2005
Delaware Center for Transportation University of Delaware
355 DuPont Hall Newark, Delaware 19716
(302) 831-1446
DCT 181
APPLICATIONS OF ADVANCED COMPOSITES TO STEEL BRIDGES:
A CASE STUDY ON THE ASHLAND BRIDGE (DELAWARE-USA)
by
Michael J. Chajes Angela P. Chacon
Matthew W. Swinehart Daniel R. Richardson
Gary C. Wenczel Wei Liu
Department of Civil and Environmental Engineering
College of Engineering University of Delaware
Newark, DE 19716
DELAWARE CENTER FOR TRANSPORTATION University of Delaware
Newark, Delaware 19716
This work was sponsored by the Delaware Center for Transportation and was prepared in cooperation with the Delaware Department of Transportation. The contents of this report reflect the views of the authors who are responsible for the facts and accuracy of the data presented herein. The contents do not necessarily reflect the official views of the Delaware Center for Transportation or the Delaware Department of Transportation at the time of publication. This report does not constitute a standard, specification, or regulation.

The Delaware Center for Transportation is a university-wide multi-disciplinary research unit reporting to the Chair of the Department of Civil and Environmental Engineering, and is co-sponsored by the University of Delaware and the Delaware Department of Transportation.
DCT Staff
Ardeshir Faghri Jerome Lewis Director Associate Director
Wanda L. Taylor Lawrence H. Klepner Sandi Wolfe Assistant to the Director T2 Program Coordinator Secretary
DCT Policy Council
Robert Taylor, Co-Chair Chief Engineer, Delaware Department of Transportation
Eric Kaler, Co-Chair
Dean, College of Engineering
The Honorable Tony DeLuca Chair, Delaware Senate Transportation Committee
The Honorable Richard Cathcart
Chair, Delaware House of Representatives Transportation Committee
Timothy K. Barnekov Dean, College of Human Resources, Education and Public Policy
Michael J. Chajes
Chair, Civil and Environmental Engineering
Ralph A. Reeb Director of Planning, Delaware Department of Transportation
Stephen Kingsberry
Director, Delaware Transit Corporation
Shannon Marchman Representative of the Director of the Delaware Development Office
Roger Roy
Representative, Transportation Management Association
Jim Johnson Executive Director, Delaware River & Bay Authority
Delaware Center for Transportation University of Delaware
Newark, DE 19716 (302) 831-1446

APPLICATIONS OF ADVANCED COMPOSITES TO STEEL BRIDGES:
A CASE STUDY ON THE ASHLAND BRIDGE
(DELAWARE-USA)
by Michael J. Chajes, Angela P. Chacon, Matthew W. Swinehart,
Daniel R. Richardson, Gary C. Wenczel, and Wei Liu
March 2005
2
Executive Summary The rehabilitation of steel bridges using advanced composite materials offers the possibility of a short-term retrofit or long-term solution for bridge owners faced with deficient structures. Several laboratory studies conducted at the University of Delaware have shown that carbon-fiber-reinforced polymer (CFRP) plates can be used to effectively strengthen steel bridge girders. Initial studies focused on many issues including force transfer and development, fatigue durability of the CFRP/steel bond, long-term durability of the CFRP/steel bond under sustained load, and methods for preventing corrosion between the CFRP plate and the steel. Once the feasibility of the strengthening method had been thoroughly examined, two field demonstration projects were initiated in Delaware. The first field application was performed in 2000 on a concrete slab-on-steel girder bridge located on Interstate 95. The second field application was performed in 2002 on a typical through-girder bridge (Bridge 1-119). The baseline behavior of the second bridge was determined from a diagnostic pre-test, and a post-test was used to quantify the effect of the rehabilitation. This report presents details of the second field application, including a comparison of the pre- and post-rehabilitation test results. Finally, the post-rehabilitation response of the bridge is compared to theoretical predictions. Bridge 1-119, also known as the Ashland Bridge, carries State Route 82 over Red Clay Creek in Delaware. The steel through girder bridge with a 100-foot (30.5 m) simple span has a concrete deck supported on 19 floor beams that are spaced 6 feet (1.83 m) on center and span 27 feet (8.23 m) between through girders.
DelDOT determined that the concrete deck and floor beams showed significant deterioration and deemed the bridge structurally deficient. Prior to rehabilitation in June of 2002, UD conducted load tests to document the baseline behavior of the bridge. Two floor beams were retrofitted with CFRP plates on the bottom of the tension flange, and the concrete deck was replaced in two sections on November 25 and December 2. CFRP plates were bonded to the floor beams after the concrete deck was removed and before a new deck was cast. As such, the CFRP plates help the floor beams resist both dead and live loads. In June of 2003, a post-test was performed to evaluate the effectiveness of the rehabilitation, specifically the performance of the CFRP plates for improvements in stiffness and load distribution. The CFRP plates, which were composed of unidirectional carbon fibers and a vinyl-ester resin matrix, were applied to the bottom face of two floor beams. The pultruded plates used can be manufactured to any desired length and were 1.46 in. (37 mm) wide by 0.21 in. (5.3 mm) thick. Several 1.46 in. (37 mm) wide plates were used to make up the full width of the flange.
Diagnostic load tests were performed before and after rehabilitation. The pre-test was conducted on June 13, 2002, and the post-test on June 24, 2003. In both tests, strain transducers were used to measure the strain on selected floor beams and on the through girders. Two three-axle DelDOT dump trucks were filled with sand and used as the controlled live loads. The diagnostic load tests measured strains in the floor beams and through girder as controlled live loads caused by the two three-axle dump trucks were driven in different configurations over the bridge. These configurations were varied during six tests, including five semi-static tests and a dynamic test. Identical test configurations were conducted for both the pre- and post-tests.
Based on this study, it was found the application of CFRP plates did increase the stiffness and load distribution of the two retrofitted floor beams on Ashland Bridge, and the resulting improvements matched well with values found using the method of transformed sections.
3
Comparison of diagnostic load test results both before and after rehabilitation of the Ashland Bridge shows that the use of advanced composite materials was effective in decreasing the live load strain experienced by the rehabilitated floor beam. Retrofitted floor beam strains decreased by 5.5% due to the CFRP plate application. The tests confirmed that the bridge deck and floor beams are currently acting compositely, and a post-repair distribution factor of 0.32 was found for the floor beams. Furthermore, the distribution factor was slightly higher for the floor beams rehabilitated with CFRP plates, indicating an increase in stiffness due to the CFRP application. The distribution factor was confirmed using a simply supported beam model.
In addition to the CFRP rehabilitation, MMFX rebar was used in the concrete deck because of its resistance to corrosion. It should be noted that the original design called for stainless clad rebar. However, due to the inability to get the needed rebar in a timely fashion, the contractor received approval to use MMFX rebar instead. To study its performance, corrosion monitoring was carried out on Bridge 1-119 using V2000 sensors, which exploit the electrochemical reaction that occurs when active corrosion is present as a means to detect this type of damage. To effectively evaluate the performance of the MMFX rebar, a comparative study of different types of rebar was conducted. Four types of bars were studied: MMFX, stainless clad, epoxy-coated, and normal steel rebars. Two sets of 6-inch short bars were embedded in the deck. Voltage and current readings were taken on a regular basis. The following observations were made about the corrosion behavior of the four types of rebar:
• MMFX and normal steel rebar behave similarly.
• Stainless clad bars yielded unstable corrosion readings which are strongly dependent upon ambient temperature.
• Epoxy-coated bars have relatively high voltage readings but very low current readings through the entire monitoring process.
• For epoxy-coated bar, the integrity of the coating is very important—the rebar is vulnerable to corrosion when the coating is damaged but not if the coating is intact. Some specimens were purposely damaged in the study.
To date, only the short-term behavior of the bars has been studied. The advantages of the corrosion-resistive bars may not be obvious until the bridge has been in service for a considerably longer period of time. Continued monitoring will be beneficial to the understanding of the long-term behavior of different types of bars in real-world environments. Overall, the findings of this project are contributing to ongoing research on the use of advanced composite materials for rehabilitation purposes. Testing and monitoring of the Ashland Bridge should be continued, as future results will be very useful in understanding the long-term behavior of the advanced composite material. (Note: Some of the instrumentation was damaged in the floods of 2003 and 2004.) This executive summary is followed by a report describing the project. In addition, during the summers of 2002 and 2003, undergraduate researchers through the NSF-REU Program in Bridge Engineering at the University of Delaware Center for Innovative Bridge Engineering worked on the project. Their reports are included as appendices as follows:
• Appendix I—Bridge Rehabilitation Using Advanced Composites, Matthew W. Swinehart (Rice University). This report covers pre-testing and the rehabilitation.

4
• Appendix II—Using Advanced Composite Materials in the Ashland Bridge Rehabilitation, Angela P. Chacon (New Mexico State University). This report covers post-testing and compares the pre- and post-tests.

5
1. ABSTRACT
The rehabilitation of steel bridges using advanced composite materials offers the possibility of a short-term retrofit or long-term solution for bridge owners faced with deficient structures. Several laboratory studies conducted at the University of Delaware have shown that carbon-fiber-reinforced polymer (CFRP) plates can be used to effectively strengthen steel bridge girders. Initial studies focused on many issues including force transfer and development, fatigue durability of the CFRP/steel bond, long-term durability of the CFRP/steel bond under sustained load, and methods for preventing corrosion between the CFRP plate and the steel. Once the feasibility of the strengthening method had been thoroughly examined, two field demonstration projects were initiated in Delaware. The first field application was performed in 2000 on a concrete slab on steel girder bridge located on Interstate 95. The second field application was performed in 2002 on a typical through-girder bridge. The baseline behavior of the second bridge was determined from a diagnostic pre-test, and a post-test was used to quantify the effect of the rehabilitation. This paper presents details of the second field application, including a comparison of the pre- and post-rehabilitation test results. Finally, the post-rehabilitation response of the bridge will be compared to theoretical predictions.
2. INTRODUCTION
The US infrastructure is aging, and many steel bridges are reaching the end of their service life. As such, the need for repair or replacement of these bridges is increasing. Innovative techniques and materials are being sought to alleviate the problem. There are high costs associated with repair or replacement of these bridges, and the application of advanced composite materials for use in bridge rehabilitation is an up-and-coming solution. According to the most recent National Bridge Inventory (NBI), of the 591,220 US bridges that undergo mandatory bi-annual inspections, 44,650 steel bridges are classified as structurally deficient. These steel bridges constitute nearly 55% of the structurally deficient bridges[1]. Bridge deterioration occurs for many reasons, the most predominant being exposure to the environment over extended periods of time. Both concrete and steel superstructures are vulnerable to environmental degradation over time, and both can benefit from the application of advanced composite materials. Concrete rehabilitation has been the primary focus of research involving the use of composite materials [2]. It is now recognized that composites provide a potential solution for steel girder deterioration as well. Advanced composite materials, such as CFRP plates, can be used in various applications because they can be engineered to optimize their performance for a specific application [3]. High strength-to-weight ratios along with corrosion resistance are appealing factors contributing to the interest in the use of composite materials. In addition, the ease of application when compared to that of applying a steel plate introduces cost savings associated with labor and time and also minimizes disruptions to the traveling public. Reduction in member capacity or increases in deflection due to added dead load are not of concern because the plates will not significantly increase the weight of the member as can occur with conventional steel cover plates [4]. The disadvantages associated with many new materials are high initial cost and lack of long-term testing. Both of these disadvantages are associated with advanced composites; however, it is believed that with more frequent use, costs will decrease, and through more testing a durability record can be proven. This paper focuses on the 2002 rehabilitation of Delaware’s Ashland Bridge using advanced composite materials.
3. BACKGROUND
Initial studies conducted at the University of Delaware (UD) were part of an NCHRP-IDEA investigation and involved adhesive durability testing and load capacity studies. Small-scale steel beams were retrofitted using various plate configurations, and strength increases of greater than 50% were found. Testing of a actual deteriorated bridge girder showed increases in strength and stiffness as well [5]. In a follow-up project at UD, several laboratory studies were conducted that focused on issues of appropriate adhesive type, force transfer and development, fatigue durability of the CFRP/steel bond, and

6
long-term durability of the CFRP/steel bond under sustained load [2]. The work culminated in a full-scale field application in 2000 that involved the retrofit of one girder of an I-95 bridge in Delaware [6]. The retrofit design, adhesive selection, and application process used were based on the laboratory results. The process proved successful and was used for the Ashland Bridge rehabilitation described in this paper. Recent load tests conducted on this bridge (summer of 2003) indicate that the bond of the CFRP plates to the steel girder remains sound after three years. One additional UD study involving CFRP plates bonded to a steel substrate looked at issues of proper surface preparation and galvanic corrosion [3]. This work showed the need to properly prepare the surface of the steel prior to application by sandblasting the surface and applying a cleaning solvent. Galvanic corrosion is a concern when carbon-fiber-based composite materials are bonded to steel. Galvanic corrosion occurs when materials of dissimilar carbon contents come in contact. West [3] found that using an intermediate layer between the materials, such as an insulating layer, was effective. An intermediate layer of glass fiber fabric was used on both the I-95 and Ashland Bridge retrofits.
4. REHABILITATION OF DELAWARE’S ASHLAND BRIDGE
4.1 Description of the Ashland Bridge The Ashland Bridge carries State Route 82 over Red Clay Creek in Delaware. The steel through girder bridge with a 100-foot (30.5 m) simple span is shown in Fig. 1. The concrete deck is supported on 19 floor beams (W24 X 100 sections) that are spaced 6 feet (1.83 m) on center and span 27 feet (8.23 m) between through girders.
Fig. 1 – Ashland Bridge
The Delaware Department of Transportation (DelDOT) determined that the concrete deck and floor beams showed significant deterioration, and as such the bridge was deemed structurally deficient. Prior to rehabilitation in June of 2002, UD conducted load tests to document the baseline behavior of the bridge. Two floor beams were retrofitted with CFRP plates on the bottom of the tension flange, and the concrete deck was replaced in two sections on November 25 and December 2 [7]. CFRP plates were bonded to the floor beams after the concrete deck was removed and before a new deck was cast. As such, the CFRP plates help the floor beams resist both dead and live loads. In June of 2003, a post-test was performed to evaluate the effectiveness of the rehabilitation, specifically the performance of the CFRP plates for improvements in stiffness and load distribution. 4.2 Bridge Rehabilitation - CFRP Plate Application For the Ashland Bridge, the CFRP plates were applied to the bottom face of two floor beams. The CFRP plates used were composed of unidirectional carbon fibers and a vinyl-ester resin matrix. The pultruded plates used can be manufactured to any desired length and were 1.46 in. (37 mm) wide by 0.21 in. (5.3 mm) thick. Several 1.46 in. (37 mm) wide plates were used to make up the full width of the flange. The CFRP plate sections used for the rehabilitation can be seen in Fig. 2.

7
Fig. 2 – CFRP Plate Segments.
In the rehabilitation, nearly the entire length of the floor beam was retrofitted with the CFRP plates. The width of the final plate was made up of six individual plates. Six inch staggered joints were used for each segment. The end connection of each staggered plate was beveled to a 45-degree angle to eliminate peel stresses induced by the joint [2]. Peel-off of the plates is a failure mode that has occurred during plate testing, especially at the maximum moment region of the girders [4]. Wood blocks were used to keep the larger plate segments together during construction as well as provide a location for clamping. Once assembled, the bonding surface of the plates was sanded to aid with adhesive bonding. Abrasive blasting and application of a surface cleaning solvent were used to prepare the floor beam. Glass-fiber fabric was used as the intermediate layer. The plates were applied in individual plate segments using a two-part epoxy, clamped in place and allowed to cure for 24 hours at ambient temperature.
5. DIAGNOSTIC LOAD TESTING PROCEDURE: PRE- AND POST-REHABILITATION
Diagnostic load tests were performed on the Ashland Bridge before and after rehabilitation. The pre-test was conducted on June 13, 2002, and the post-test on June 24, 2003. In both tests, strain transducers were used to measure the strain on selected floor beams and on the through girders. Sixteen gages were used for the pre-test and twenty for the post-test. The four extra gages used in the post-test allowed both of the floor beams with CFRP plates to be monitored (only one of these two beams was tested in the pre-test). Fig. 3 shows the floor beams that were instrumented during the testing (G1, G3, G4, G5, and G9). The two floor beams retrofitted with the CFRP plates (G3 and G4) as well as a control floor beam (G5) were each instrumented with four strain transducers. Three transducers were mounted to the underside of the tension flange, two at the ends of the beam and one at mid-span. One transducer was also mounted onto the underside of the compression flange at mid-span of the beam. Instrumentation was also placed on the through girder at mid-span, the quarter span, and near the end bearings.
Fig. 3 – Locations of Instrumented Floor Beams (1 foot = 0.3048 m).

8
Two three-axle DelDOT dump trucks (#2750 and #2873) were filled with sand and used as the controlled live loads. For the post-test, the total weight of Truck # 2750 was 58,110 lbs. (260 kN), and the rear axle group weighed 41,740 lbs. (187 kN). Truck # 2873 was slightly heavier with a total weight of 58,470 lbs. (262 kN) and had a rear axle group weight of 42,760 lbs. (191 kN). The test trucks used for the post-rehabilitation test were 7 percent lighter than those used in the pre-test. As such, a ratio of 1.07 needs to be applied when pre-test data is compared to post-test data. The diagnostic load tests measured strains in the floor beams and through girder as controlled live loads caused by the two three-axle dump trucks were driven in different configurations over the bridge. These configurations were varied during six tests. Five of the six tests (Tests 1–5) were semi-static tests conducted at 5 mph while the dynamic test (Test 6) was conducted at 35 mph (15.6 m/s). Data was collected at 5 Hz for semi-static testing and at 20 Hz for dynamic testing. For the single truck load tests (Tests 1, 2, and 3), Truck #2750 crossed the bridge first. For the side-by-side tests (Tests 4 and 5), this truck was in the left lane as the trucks headed west. The six tests are summarized in Table 1. Identical test configurations were conducted for both the pre- and post-tests.
Table 1 – Summary of load tests. Test No. Description No. of Trucks Truck Speed
1 Left lane One at a time Semi-static 2 Right lane One at a time Semi-static 3 Center One at a time Semi-static 4 Side-by-side Two at once Semi-static 5 Side-by-side Two at once Semi-static 6 Center One at a time Dynamic
During the load tests, data collection was initiated just before the first truck’s front wheels were on the bridge. The first truck drove over the bridge, and as the rear wheels of the first truck came off the bridge the second truck drive over the bridge. The test continued until the second truck was off the bridge. This was done so that the repeatability of the data could be checked. Tests 1 and 2 were single lane tests where trucks were driven in the center of the marked lanes. In Test 3 the trucks crossed in the middle of the roadway. The side-by-side tests (4 and 5) were conducted with both trucks on the bridge, one in each lane, ideally staying at the same speed and directly next to each other as the trucks were driven over the bridge. All load tests were conducted with the trucks traveling west.
6. LOAD TEST RESULTS
6.1 Through Girder Behavior
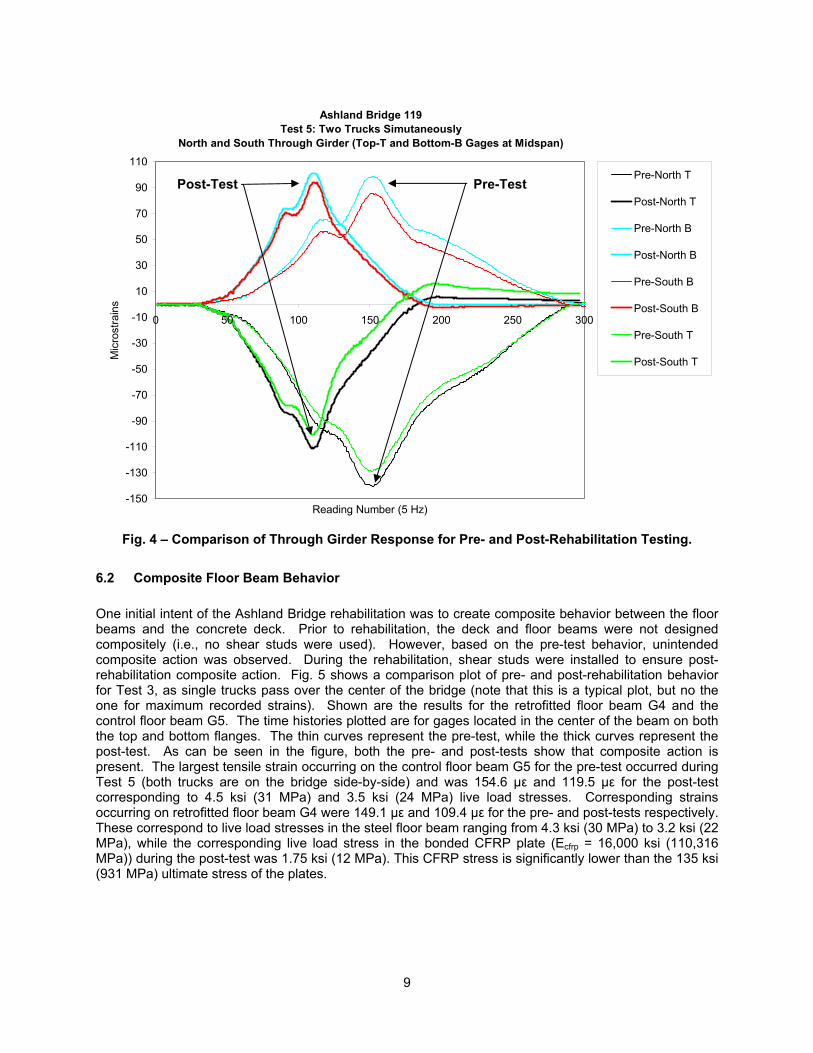
The through girder behavior was similar for both the pre-test and post-test. The largest compression and tensile strain on the through girder in both tests occurred at mid-span. The strain gages were on the top and bottom flanges of the through girder, and the peak strains occurred during the test when both trucks were on the bridge. The peak strains for the pre-test were -140.5 and 98.7 µε. Peak strains for the post-test were -110.7 and 101.3 µε. These strains correspond to live load steel stresses ranging from 3.3 to 4.7 ksi. Fig. 4 shows a comparison of the through girder response for the two tests (in this all future plots, B and T signify bottom and top flange gages respectively). This plot shows a typical time-strain history for the through girder when both trucks crossed the bridge simultaneously. From this figure it is apparent that the trucks were traveling faster during the post-test. It also shows that the neutral axis changed slightly. This could be due to the deck replacement.
9
Ashland Bridge 119 Test 5: Two Trucks Simutaneously
North and South Through Girder (Top-T and Bottom-B Gages at Midspan)
-150
-130
-110
-90
-70
-50
-30
-10
10
30
50
70
90
110
0 50 100 150 200 250 300
Reading Number (5 Hz)
Mic
rost
rain
s
Pre-North T
Post-North T
Pre-North B
Post-North B
Pre-South B
Post-South B
Pre-South T
Post-South T
Fig. 4 – Comparison of Through Girder Response for Pre- and Post-Rehabilitation Testing.
6.2 Composite Floor Beam Behavior One initial intent of the Ashland Bridge rehabilitation was to create composite behavior between the floor beams and the concrete deck. Prior to rehabilitation, the deck and floor beams were not designed compositely (i.e., no shear studs were used). However, based on the pre-test behavior, unintended composite action was observed. During the rehabilitation, shear studs were installed to ensure post-rehabilitation composite action. Fig. 5 shows a comparison plot of pre- and post-rehabilitation behavior for Test 3, as single trucks pass over the center of the bridge (note that this is a typical plot, but no the one for maximum recorded strains). Shown are the results for the retrofitted floor beam G4 and the control floor beam G5. The time histories plotted are for gages located in the center of the beam on both the top and bottom flanges. The thin curves represent the pre-test, while the thick curves represent the post-test. As can be seen in the figure, both the pre- and post-tests show that composite action is present. The largest tensile strain occurring on the control floor beam G5 for the pre-test occurred during Test 5 (both trucks are on the bridge side-by-side) and was 154.6 µε and 119.5 µε for the post-test corresponding to 4.5 ksi (31 MPa) and 3.5 ksi (24 MPa) live load stresses. Corresponding strains occurring on retrofitted floor beam G4 were 149.1 µε and 109.4 µε for the pre- and post-tests respectively. These correspond to live load stresses in the steel floor beam ranging from 4.3 ksi (30 MPa) to 3.2 ksi (22 MPa), while the corresponding live load stress in the bonded CFRP plate (Ecfrp = 16,000 ksi (110,316 MPa)) during the post-test was 1.75 ksi (12 MPa). This CFRP stress is significantly lower than the 135 ksi (931 MPa) ultimate stress of the plates.
Post-Test Pre-Test

10
Ashland BridgeTest 3: Single Truck
Floor Beams G4 (CFRP) & G5 Center Gauges Adjusted for Weight
106.8108.5
87.8 90.0
103.1105
80.7 81.3
-20
0
20
40
60
80
100
120
0 50 100 150 200 250 300 350
Reading Number (5 Hz)
Mic
rost
rain
s
Pre-Test G5 BPost-Test G5 BPre-Test G5 TPost-Test G5 TPre-Test G4 B CFRPPost-Test G4 T CFRPPre-Test G4 T CFRPPost-Test G4 T CFRP
Fig. 5 – Comparison of Pre- and Post-Rehabilitation Test Behavior, Test 3.
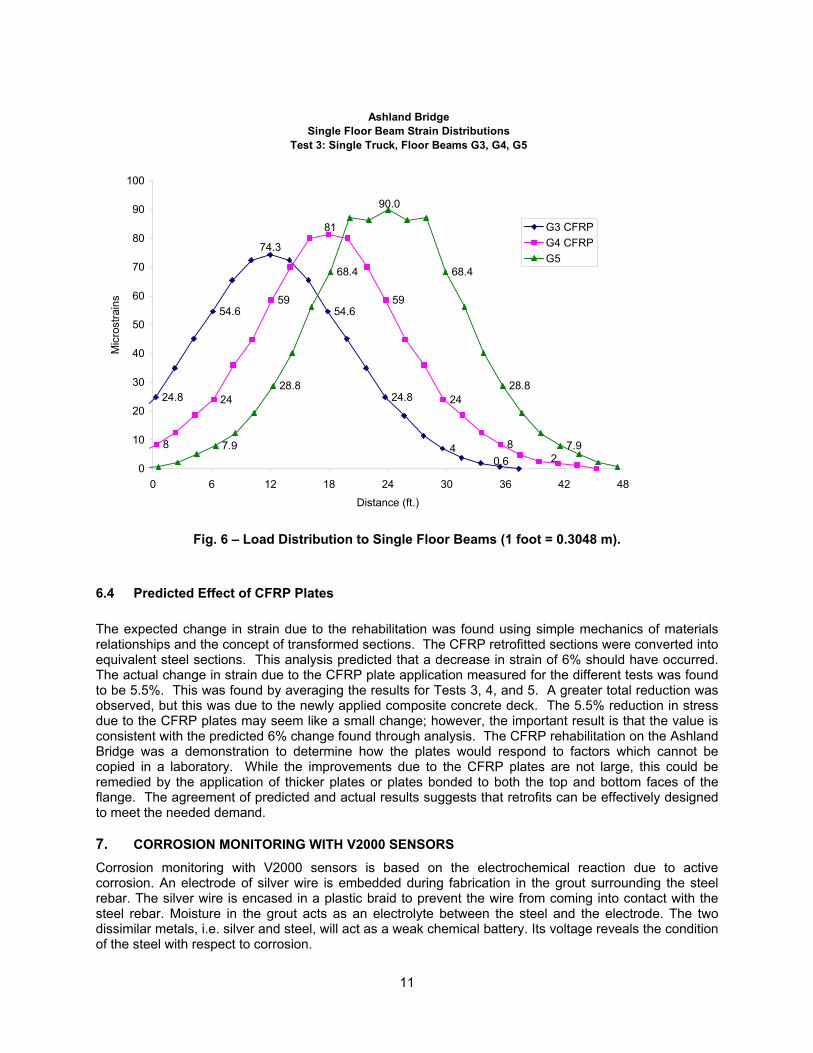
6.3 Load Distribution to Floor Beams Fig. 6 shows the distribution of strain due to the weight from the rear axle group to individual floor beams as the test truck travels across the bridge (post-repair). Shown in this graph is the distribution for the three instrumented floor beams during Test 3. This distribution of strain was evaluated using only the rear axle group. To help to isolate the effect of the rear axle group, only the strain values collected after the peak strain value was reached were used for distribution calculations. The data was also shifted from a time-strain plot to a distance-strain plot. This method of determining strain distribution was found to be reliable and not significantly influenced by the presence of the front axle weight because the axle spacing is more than 14 feet (4.3 m). From Fig. 6, the percentage of the peak strain from the total strain due to the rear axle group on individual floor beams was found to average 32% (i.e., a distribution factor of 0.32). During Test 3, retrofitted floor beams G3 and G4 peaked at 74.3 µε and 81.0 µε respectively. An idealized simply supported model was used to find the maximum moment due to an entire truck loading (rear tandem loads only). This moment was converted to strain using Hooke’s Law and then scaled by 32%. This yielded 70.0 µε, which is in close agreement with what the beam actually experienced. In general, rehabilitated floor beams G3 and G4 increased in stiffness, and their load distributions were slightly higher than for the control floor beam G5. Similar analyses conducted for Tests 4 and 5 yielded similar results. A distribution factor was also found for the post-test bridge condition. In this case, the distribution factor was found to be 0.40. Since the deck of Ashland Bridge was replaced, it is likely that that the new deck would distribute load more efficiently to the floor beams (as is the case).
11
Ashland BridgeSingle Floor Beam Strain Distributions
Test 3: Single Truck, Floor Beams G3, G4, G5
0.6
24.8
4
24.8
54.654.6
74.3
2
24
5959
81
24
88
68.4 68.4
90.0
7.97.9
28.8 28.8
0
10
20
30
40
50
60
70
80
90
100
0 6 12 18 24 30 36 42 48
Distance (ft.)
Mic
rost
rain
s
G3 CFRPG4 CFRPG5
Fig. 6 – Load Distribution to Single Floor Beams (1 foot = 0.3048 m).
6.4 Predicted Effect of CFRP Plates The expected change in strain due to the rehabilitation was found using simple mechanics of materials relationships and the concept of transformed sections. The CFRP retrofitted sections were converted into equivalent steel sections. This analysis predicted that a decrease in strain of 6% should have occurred. The actual change in strain due to the CFRP plate application measured for the different tests was found to be 5.5%. This was found by averaging the results for Tests 3, 4, and 5. A greater total reduction was observed, but this was due to the newly applied composite concrete deck. The 5.5% reduction in stress due to the CFRP plates may seem like a small change; however, the important result is that the value is consistent with the predicted 6% change found through analysis. The CFRP rehabilitation on the Ashland Bridge was a demonstration to determine how the plates would respond to factors which cannot be copied in a laboratory. While the improvements due to the CFRP plates are not large, this could be remedied by the application of thicker plates or plates bonded to both the top and bottom faces of the flange. The agreement of predicted and actual results suggests that retrofits can be effectively designed to meet the needed demand. 7. CORROSION MONITORING WITH V2000 SENSORS
Corrosion monitoring with V2000 sensors is based on the electrochemical reaction due to active corrosion. An electrode of silver wire is embedded during fabrication in the grout surrounding the steel rebar. The silver wire is encased in a plastic braid to prevent the wire from coming into contact with the steel rebar. Moisture in the grout acts as an electrolyte between the steel and the electrode. The two dissimilar metals, i.e. silver and steel, will act as a weak chemical battery. Its voltage reveals the condition of the steel with respect to corrosion.

12
Voltage ranges for normal steel:
< 300mV no corrosion activity 300mV ~ 400mV corrosion has begun
> 400mV active corrosion
Two arrays of corrosion sensors were embedded in the bridge deck.
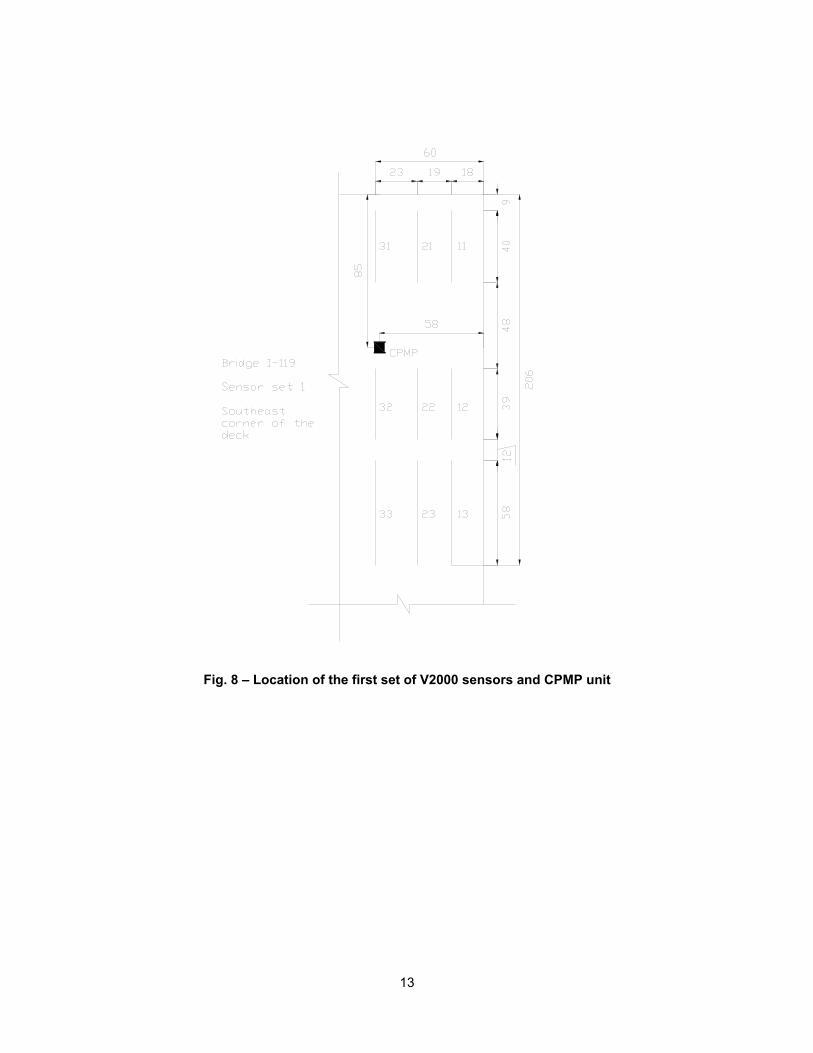
For the retrofit of Bridge 1-119, two floor beams were retrofitted with CFRP plates on the bottom of the tension flange and the concrete deck was replaced in two sections on November 25 and December 2. Figure 7 shows a photo of the bridge deck before pour. V2000 corrosion sensors are highlighted in the figure. Their exact locations are shown in Figures 8 and 9. An instrumentation box located underneath the bridge provides access to all these and other sensors.
Fig. 7 – Bridge deck before pour. V2000 sensors are highlighted in the picture.
13
Fig. 8 – Location of the first set of V2000 sensors and CPMP unit
14
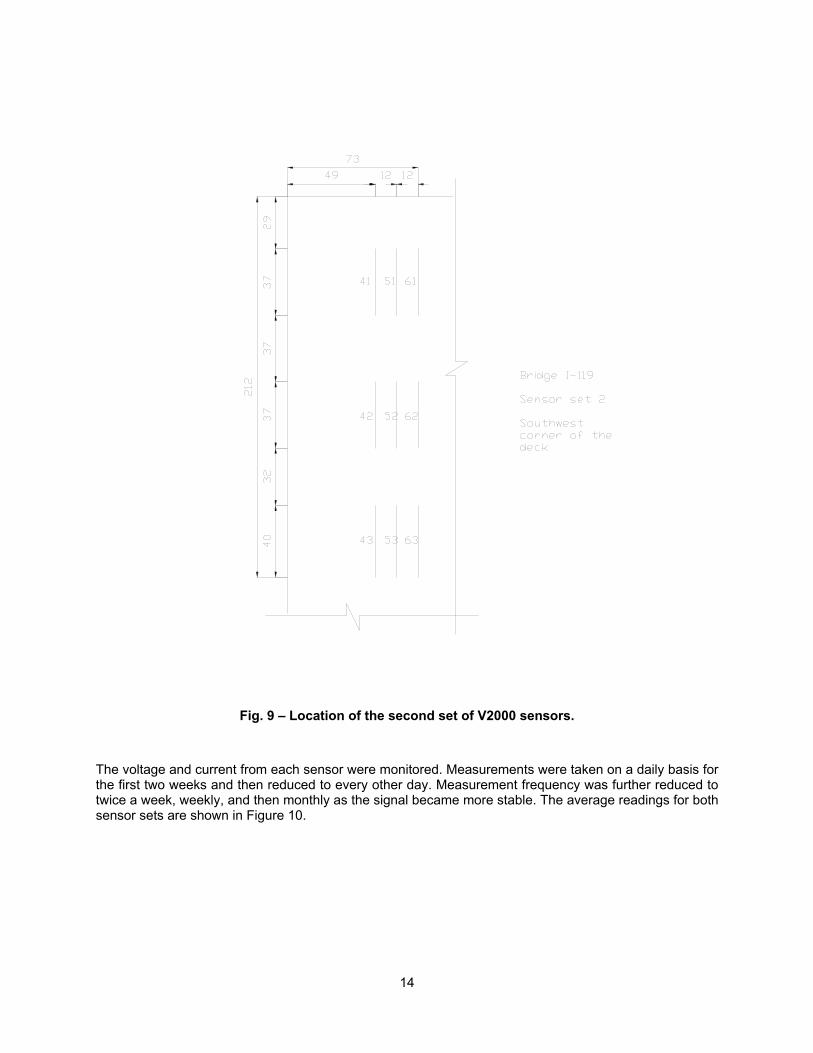
Fig. 9 – Location of the second set of V2000 sensors.
The voltage and current from each sensor were monitored. Measurements were taken on a daily basis for the first two weeks and then reduced to every other day. Measurement frequency was further reduced to twice a week, weekly, and then monthly as the signal became more stable. The average readings for both sensor sets are shown in Figure 10.

15
Fig. 10 – Average voltage and current readings as functions of time. Also shown in the figure are the daily average temperature and precipitation.
Readings were very high immediately after the pour, indicating active surface corrosion (as expected). Both voltage and current decreased steadily until finally reached into a stable region. The readings were affected by ambient temperature but showed basically not dependence on ambient moisture or precipitation. At around 250 days after the pour, the average current of sensor set 2 decreased dramatically and went back to normal in about a month while everything else, including voltage from the same set of sensors, appeared to be normal during that time. There is no definite explanation for this phenomenon. But it was suspected that an electrical connection went bad, i.e. introduced a large connection resistance, during that time. The current measurement depends strongly on the internal resistance of the circuit while voltage does not.
Bridge 119
0
100
200
300
400
500
600
700
800
900
1000
0 100 200 300 400 500 600
Time (days)
Volta
ge (m
V)
10
100
1000
10000
100000
Cur
rent
(uA
)
Average Daily TemperatureDaily PrecipitationAverage MMFX Votage Reading (Sensor Set 1)Average MMFX Votage Reading (Sensor Set 2)Average MMFX Current Reading (Sensor Set 1)Average MMFX Current Reading (Sensor Set 2)
16
Bridge 119
100
1000
10000
100000
0 200 400 600 800 1000 1200
Voltage (mV)
Cur
rent
(uA
)
Region Iday 1 to day 250
Region IIafter day 250
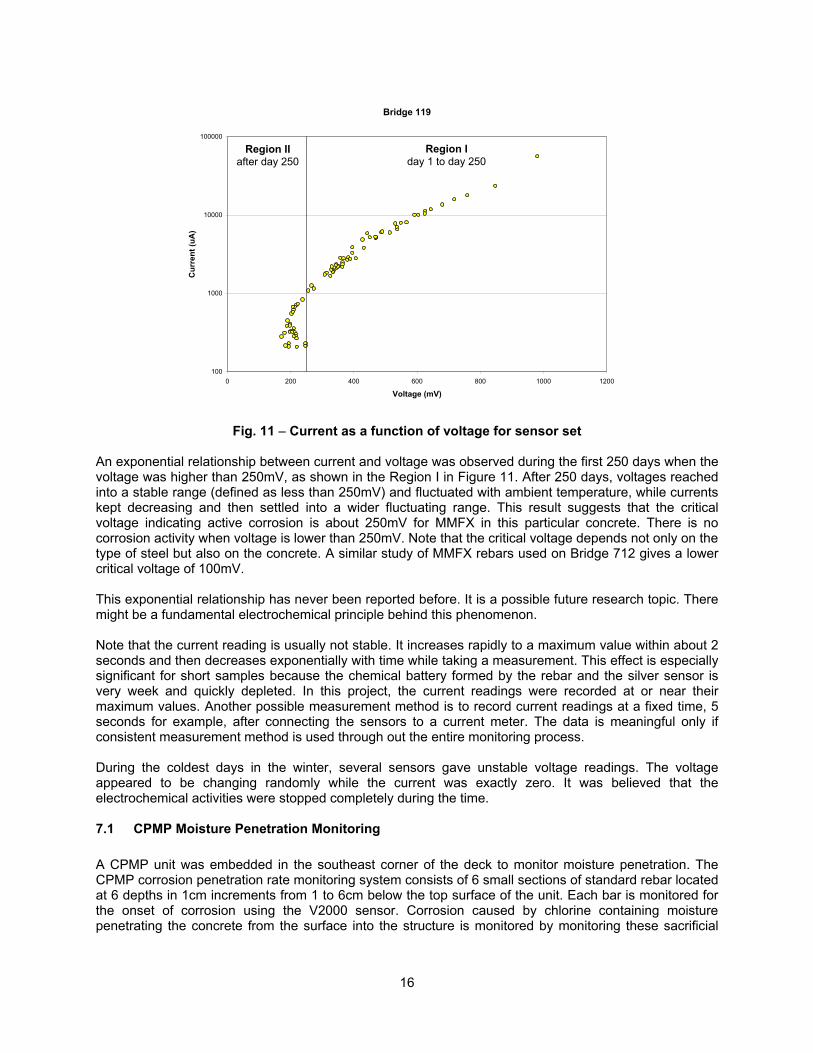
Fig. 11 – Current as a function of voltage for sensor set An exponential relationship between current and voltage was observed during the first 250 days when the voltage was higher than 250mV, as shown in the Region I in Figure 11. After 250 days, voltages reached into a stable range (defined as less than 250mV) and fluctuated with ambient temperature, while currents kept decreasing and then settled into a wider fluctuating range. This result suggests that the critical voltage indicating active corrosion is about 250mV for MMFX in this particular concrete. There is no corrosion activity when voltage is lower than 250mV. Note that the critical voltage depends not only on the type of steel but also on the concrete. A similar study of MMFX rebars used on Bridge 712 gives a lower critical voltage of 100mV. This exponential relationship has never been reported before. It is a possible future research topic. There might be a fundamental electrochemical principle behind this phenomenon. Note that the current reading is usually not stable. It increases rapidly to a maximum value within about 2 seconds and then decreases exponentially with time while taking a measurement. This effect is especially significant for short samples because the chemical battery formed by the rebar and the silver sensor is very week and quickly depleted. In this project, the current readings were recorded at or near their maximum values. Another possible measurement method is to record current readings at a fixed time, 5 seconds for example, after connecting the sensors to a current meter. The data is meaningful only if consistent measurement method is used through out the entire monitoring process. During the coldest days in the winter, several sensors gave unstable voltage readings. The voltage appeared to be changing randomly while the current was exactly zero. It was believed that the electrochemical activities were stopped completely during the time. 7.1 CPMP Moisture Penetration Monitoring A CPMP unit was embedded in the southeast corner of the deck to monitor moisture penetration. The CPMP corrosion penetration rate monitoring system consists of 6 small sections of standard rebar located at 6 depths in 1cm increments from 1 to 6cm below the top surface of the unit. Each bar is monitored for the onset of corrosion using the V2000 sensor. Corrosion caused by chlorine containing moisture penetrating the concrete from the surface into the structure is monitored by monitoring these sacrificial
17
bars. Ideally, maintenance crew gets early warning when moisture penetrates into the structure and reaches the depths of each small rebar. Typically, the top bars have higher voltage than the bottom bars since top bars are closer to the top surface of the bridge deck. However, a reverse trend was observed for the CPMP unit on Bridge 119. The geometry configuration of the CPMP unit is such that bars 1, 3, and 5 are on one side of the unit while bars 2, 4, and 6 are on the other side. The number of the bar is also the depth of the bar below the top surface of the unit. For example, bar 4 is 4cm below the top surface and is located in the middle of bars 2 and 6. It was observed that the following simple expressions are usually true except for some disturbances from time to time:
• V1< V3<V5 , and • V2< V4<V6 .
The possible reasons for this reverse trend are:
• There is a galvanized plate at the bottom of the deck that might be corrosion sensitive. The corrosion monitoring data may be affected by this plate. Bottom sensors are closer to the plate and therefore give higher readings.
• The bridge deck is thin and the bottom bars are very close to the bottom surface of the deck. The moisture level may be higher at the bottom.
There is no definite correlation between the two groups of bars, which indicates that moisture penetration is highly location dependent. 7.2 Comparative Study of MMFX, Stainless Clad, Epoxy-coated, and Normal Steel Rebars A comparative study of different types of rebars was conducted on Bridge 119. Four types of bars were studied: MMFX, stainless clad, epoxy-coated, and normal steel rebars. Two sets of 6-inch short bars were embedded in the deck. Voltage and current readings were taken on a regular basis. The following facts have been observed:
• MMFX and normal steel rebar behave similarly.
• Stainless clad bars yielded unstable corrosion readings which are strongly dependent upon ambient temperature.
• Epoxy-coated bars have relatively high voltage readings but very low current readings through the entire monitoring process.
• For epoxy-coated bar, the integrity of the coating is very important—the rebar is vulnerable to corrosion when the coating is damaged but not if the coating is intact. Some specimens were purposely damaged in the study.

18
Epoxy Coated Bars
0
100
200
300
400
500
600
700
800
900
0 100 200 300 400 500 600
Time (days)
Volta
ge (m
V)
0
20
40
60
80
100
120
140
160
180
Cur
rent
(uA
)
Perfect (V)Damaged (V)Perfect (I)Damaged (I)
Fig. 12 – Comparison of a perfect epoxy-coat bar and a damaged one. The result shows that the expoxy-coated bar is vulnerable to corrosion when its coating is damaged.
Up to now, only the short term behavior of the bars has been studied. The advantages of the corrosion-resistive bars may not be obvious until the bridge has been in service for a considerable long period of time. Continued monitoring will be beneficial to the understanding of the long-term behavior of different types of bars in real-world environments.
8. CONCLUSIONS
Based on this study, it was found the application of CFRP plates did increase the stiffness and load distribution of retrofitted floor beams on Ashland Bridge, and the resulting improvements matched well with values found using the method of transformed sections. Comparison of diagnostic load test results both before and after rehabilitation of the Ashland Bridge shows that the use of advanced composite materials was effective in decreasing the live load strain experienced by the rehabilitated floor beam. Retrofitted floor beam strains decreased by 5.5% due to the CFRP plate application. The tests confirmed that the bridge deck and floor beams are currently acting compositely, and a post-repair distribution factor of 0.32 was found for the floor beams. Furthermore, the distribution factor was slightly higher for the floor beams rehabilitated with CFRP plates, indicating an increase in stiffness due to the CFRP application. The distribution factor was confirmed using a simply supported beam model. These findings contribute to the ongoing research of the use of advanced composite materials for rehabilitation purposes. Testing and monitoring of the Ashland Bridge should be continued, as future results will be very useful in understanding the long-term behavior of the advanced composite material. (Note: Some of the instrumentation was damaged in the floods of 2003 and 2004.)

19
9. ACKNOWLEDGEMENT
The work was primarily supported by the Delaware Department of Transportation. We would also like to thank supported by the National Science Foundation under Grant No. EEC-0139017, “Research Experiences for Undergraduates in Bridge Engineering” for their support of two NSF-REU Fellows who also worked on this project.
10. REFERENCES
[1] Federal Highway Administration (FHWA). “Tables of Frequently Asked NBI Information.” <http://www.fhwa.dot.gov/bridge/britab.html> Washington, D.C., 2002.
[2] Miller, T. C., “The Rehabilitation of Steel Bridge Girders Using Advanced Composite Materials.” Master’s Thesis. 2000, University of Delaware, Newark, Delaware.
[3] West, T., “Enhancements to the Bond Between Advanced Composite Materials and Steel for Bridge Rehabilitation.” Master’s thesis. 2001, University of Delaware, Newark, Delaware.
[4] Liu, X., Silva, P., and Nanni, A., “Rehabilitation of Steel Bridge members with FRP Composite Materials.” Proc., CCC 2001, Composites in Construction, Porto, Portugal, Oct. 10-12, 2001, J. Figueiras, L. Juvandes and R. Furia, Eds., pp. 613-617
[5] Mertz, D. R., and Gillespie, J. W., Jr., NCHRP-IDEA Final Report, Rehabilitation of Steel Bridge Girders Through the Application of Advanced Composite Materials (Contract No. NCHRP-93-ID011), Transportation Research Board, 1996, Washington, D.C.
[6] Miller, T.C., Chajes, M.J., Mertz, D.R., and Hastings, J., "Strengthening of a Steel Bridge Girder Using CFRP Plates," Journal of Bridge Engineering, ASCE, 6(6), 2001, 514-522.
[7] Chajes, M., and Swinehart, M., “Bridge Rehabilitation Using Advanced Composites: Ashland Bridge SR-82 Over Red Clay Creek,” Center for Innovative Bridge Engineering, University of Delaware, Newark, Delaware, 2002.

Appendix I
Bridge Rehabilitation Using Advanced Composites
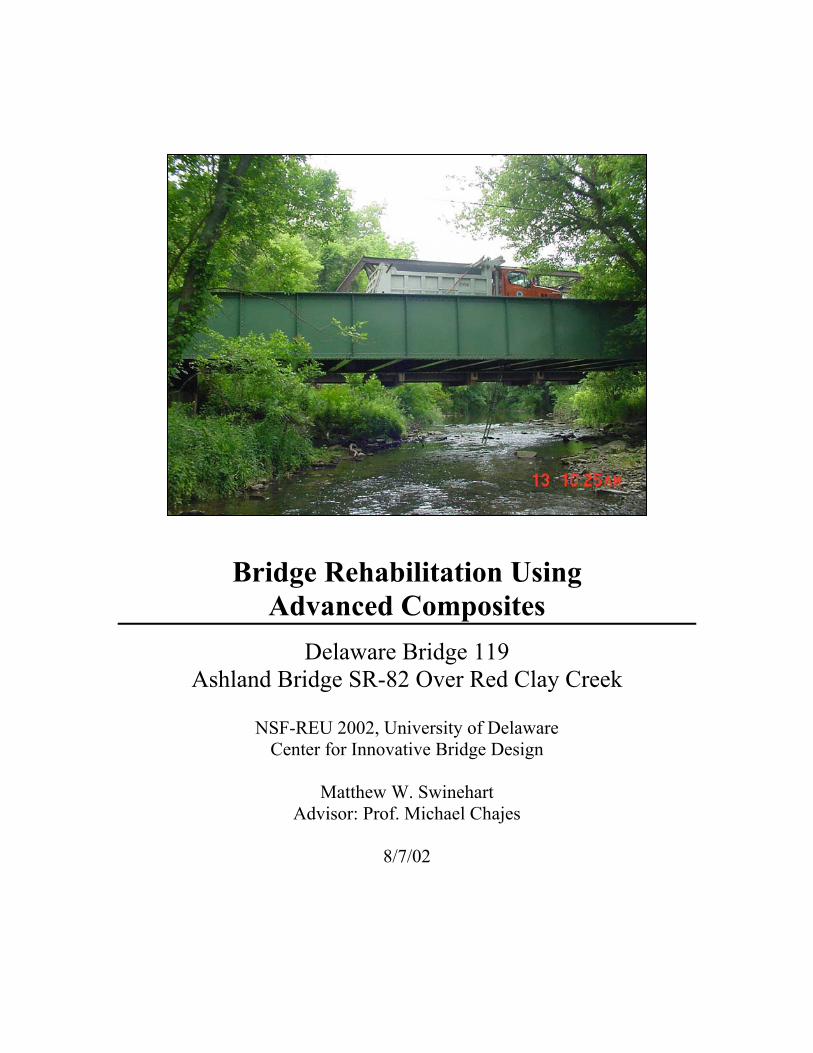
Delaware Bridge 119 Ashland Bridge SR-82 Over Red Clay Creek
NSF-REU 2002, University of Delaware
Center for Innovative Bridge Design
Matthew W. Swinehart Advisor: Prof. Michael Chajes
8/7/02
Swinehart 2
Table of Contents
I. Acknowledgements………………………………………………………..3 II. List of Tables……………………………………………………………...4 III. List of Figures……………………………………………………………..5 IV. Abstract.…………………………………………………………………...6 V. Introduction………………………………………………………………..7 VI. Background/Motivation………………………………………………….10 VII. Methods……………………………………………………….………….12 VIII. Results and Discussion………………………………………………......15 IX. Conclusions………………………………………………………………29 X. Recommendations for Future Research………………………………….30 XI. References….…………………………………………………………….31

Swinehart 3
I. Acknowledgments I would like to thank the National Science Foundation Research
Experiences for Undergraduates program for its financial support. Without its assistance this summer program at the University of Delaware would not exist. I would like to thank Dr. Michael Chajes for his patient and invaluable support and assistance. The time he invested in this project is greatly appreciated. I would like to acknowledge Degang Li for giving me access to the in-service data that he collected for the bridge and creating Table 8 and Figure 14, as well as Gary Wenczel and Danny Richardson of the Department of Civil and Environmental Engineering at University of Delaware for preparing and setting up the equipment for the load test of the Ashland Bridge. Judd Galloway, a fellow summer researcher from the University of Massachusetts at Amherst, was also invaluable during the load test and data analysis. He also created Figure 7 and took the photographs of the load test used in this paper.
Finally, I would like to thank Diane Kukich, the NSF-REU program coordinator for her continued guidance and enthusiasm.
Swinehart 4
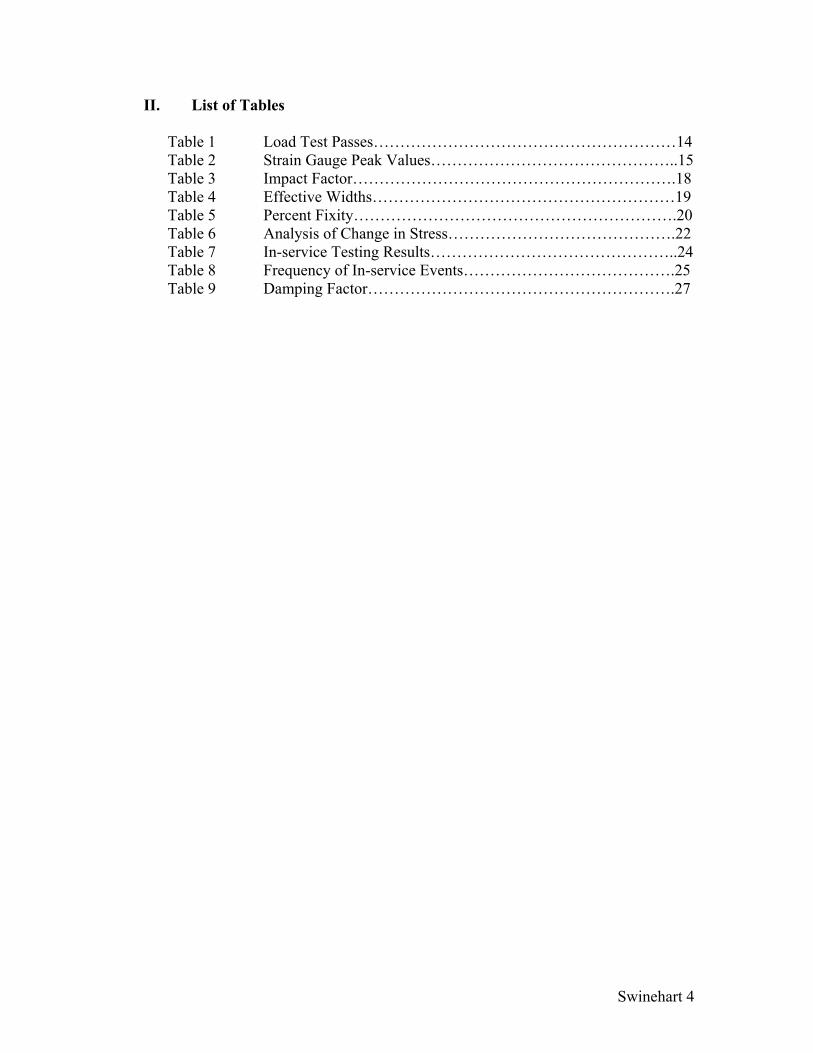
II. List of Tables
Table 1 Load Test Passes…………………………………………………14 Table 2 Strain Gauge Peak Values………………………………………..15 Table 3 Impact Factor…………………………………………………….18 Table 4 Effective Widths…………………………………………………19 Table 5 Percent Fixity…………………………………………………….20
Table 6 Analysis of Change in Stress…………………………………….22 Table 7 In-service Testing Results………………………………………..24 Table 8 Frequency of In-service Events………………………………….25 Table 9 Damping Factor………………………………………………….27

Swinehart 5
III. List of Figures
Figure 1 Advanced Composite Fibers (1)………………………………….7 Figure 2 Advanced Composite Fibers (2)………………………………….7
Figure 3 Location of Ashland Bridge………………………………………8 Figure 4 Attaching Composite Laminates………………………………….9 Figure 5 Replacement of a Concrete Deck………………………………..11 Figure 6 Typical Strain Gauge…………………………………………….12 Figure 7 Location of Strain Gauges……………………………………….13 Figure 8 Diagram of Truck Wheel Weights……………………………….13 Figure 9 Data Acquisition System for Load Test………………………….14 Figure 10 Simple Model of Deck and Beam………………………………..16 Figure 11 Load Test Graph…………………………………………………17 Figure 12 Neutral Axis Graph………………………………………………21 Figure 13 Histogram of In-Service Monitoring…………………………….25 Figure 14 Histogram of In-Service Strain Frequency………………………26 Figure 15 Damping Factor Graph…………………………………………..27

Swinehart 6
IV. Abstract
The continued decline of the nation’s bridge infrastructure has created the need for repair and rehabilitation techniques involving innovative materials. The importance of advanced composites in bridge rehabilitation is increasingly being realized in both research and application. This project focuses on the issues of rehabilitating a steel girder bridge with carbon fiber reinforced polymer (CFRP) plates. Delaware Department of Transportation (DelDOT) Bridge 119, the Ashland Bridge on State Route 82 over Red Clay Creek, is central to this project. In order to quantify any improvement in stiffness, durability, or overall performance of the bridge, a non-destructive load test was conducted by the University of Delaware with the assistance of DelDOT personnel prior to rehabilitation. The load test was used to quantify the baseline behavior for the bridge.
The analysis included the determination of the existing structure’s overall
response to truck loads including strain in the through girders and floor beams, the bridge’s period of vibration and damping, the impact factor associated with the bridge under dynamic loading, percent fixity of the floor beams, and the effective width of the floor beams. The rehabilitation of the bridge will consist of replacing the concrete deck and bonding CFRP plates to the underside of the floor beams. The expected change in stress due to the rehabilitation has been predicted using transformed sections. This calculation quantifies the success of the rehabilitation because the floor beams are the critical factors due to their suspected deterioration.

Swinehart 7
V. Introduction
The nation’s transportation infrastructure, especially highways and bridges, is currently in need of major improvements, repair, and rehabilitation. Many existing bridges were built in the highway construction frenzy of the 1950’s and 1960’s. These structures were built to last about 50 years, thus there are thousands of bridges that will need to be repaired or replaced in the very near future. The most common type of bridge built during this era consists of steel bridge girders supporting concrete decks, similar to the design found in the Ashland Bridge (West, 2001).
The unique properties of advanced composites such as FRP enable them to be
extremely useful in a wide variety of applications. Fiber reinforced polymers consist of a matrix and fibers that serve to make the composite strong in any direction in both tension and compression (refer to Figures 1-2 below). Each composite is engineered to best fit its practical application (West, 2001). Advantages of this design include its light weight, a high strength to weight ratio, and resistance to environmental factors, elevated temperatures, chemical corrosion, and abrasion. FRP has many advantages specific to bridge construction including its ability to be used year-round (Tang, 1997).
Figure 1 – Fibers are strong when pulled along the fiber direction (left), however they are very weak when pulled at right angles to the fiber direction.
Figure 2 - The matrix in a fiber reinforced polymer gives the material strength in any direction.
The main disadvantages of advanced composites are their high initial cost, a high
manufacturing cost, an untested long-term durability record in real world environments, lack of ductility, lack of design standards, untested fire resistance, and

Swinehart 8
the possibility of shrinkage or debonding of the FRP laminates (Tang, 1997). However, the higher cost should continue to decrease as the materials are more frequently used in rehabilitation and construction (Chajes, 2001)
FRP and other composites have been used in the aerospace, ship construction, and
automotive industries ever since the end of World War II. Advanced composites also have domestic and recreational uses such as fishing rods, bath tubs, golf clubs, and tennis racquets (Tang, 1997).
Structural engineering applications include seismic retrofit of columns by
wrapping them in sheets of FRP, rehabilitation of bridges, replacement of concrete decks with composite decks, new construction of generally smaller bridges including pedestrian bridges. As far as long term applications, Switzerland has used advanced composites extensively in bridge construction and rehabilitation (including rehabilitation of steel bridges) for more than six years. In 1998, 735.5 million pounds of FRP was used in general construction applications (Tang, 1997).
The use of FRP in bridge rehabilitation has become increasingly common in
recent years. Most bridges that have been repaired using these materials are made of concrete. Glass fabric is also used in rehabilitation involving CFRP laminates to separate the steel and CFRP and to prevent any degradation or deterioration caused by direct contact between the two (West, 2001).
The project discussed herein deals with the Ashland Bridge that carries Delaware
State Route 82 over Red Clay Creek. It is a steel girder bridge with a concrete deck. It has an open span of 100 feet that sits on non-composite floor beams. Figure 1 shows the bridge’s location in Northern Delaware.
Figure 3 - Location of Ashland Bridge
The Ashland Bridge is the second steel bridge in Delaware to be rehabilitated
using carbon fiber reinforced polymers. The Ashland Bridge, has a deteriorated
Swinehart 9
concrete deck and DelDOT had further determined that the structural integrity of the floor beams was suspect and needed rehabilitation.
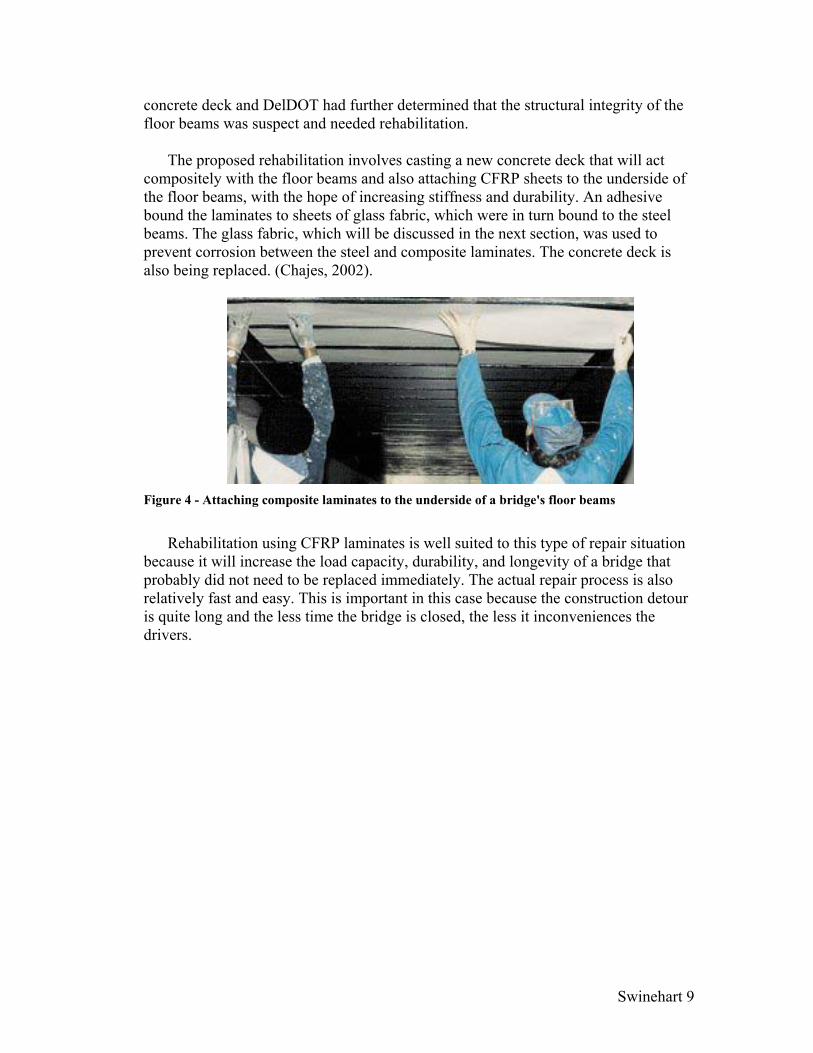
The proposed rehabilitation involves casting a new concrete deck that will act
compositely with the floor beams and also attaching CFRP sheets to the underside of the floor beams, with the hope of increasing stiffness and durability. An adhesive bound the laminates to sheets of glass fabric, which were in turn bound to the steel beams. The glass fabric, which will be discussed in the next section, was used to prevent corrosion between the steel and composite laminates. The concrete deck is also being replaced. (Chajes, 2002).
Figure 4 - Attaching composite laminates to the underside of a bridge's floor beams
Rehabilitation using CFRP laminates is well suited to this type of repair situation
because it will increase the load capacity, durability, and longevity of a bridge that probably did not need to be replaced immediately. The actual repair process is also relatively fast and easy. This is important in this case because the construction detour is quite long and the less time the bridge is closed, the less it inconveniences the drivers.
Swinehart 10
VI. Background/Motivation
Rehabilitation using CFRP retrofit is most likely to be used on a bridge that is already nearing the end of its lifespan. The rehabilitation would serve to continue the usable life of the bridge in the short term until a replacement is built. Previous researchers at the University of Delaware have done testing on small-scale and large-scale practical applications of CFRP rehabilitation of steel bridges. It has been established that the bonding of CFRP laminates to steel bridge girders does increase the strength and stiffness of those members (West, 2001). The rehabilitation time has also been shown to be short compared to conventional repair methods (Miller, 2000).
Trent Miller of the University of Delaware published his thesis in 2000, focusing
on the force transfer, fatigue resistance, and durability of rehabilitation using CFRP. He also analyzed the full-scale rehabilitation of an existing steel bridge girder. There had been concerns that the shear strength of the adhesive was not sufficient enough to prevent debonding between the CFRP laminate and steel. However, the fatigue life of the adhesive studied by Miller was estimated to be approximately 305 years, well beyond the normal lifespan of the rehabilitated bridge. The test parameters that were used to determine the fatigue life of the bond were outside the scope of the actual fatigue experienced in practical applications, further minimizing the occurrence of debonding between the CFRP laminate and the steel. On one such test, there was no evidence of debonding after 2.55 million cycles that caused a maximum shear stress of 1000 psi at the ends of the bonded plates (Miller, 2000).
Another durability concern when using advanced composites such as CFRP is its
reactions to environmental forces such as wind, rain, ice, ice salt, freezing and thawing, and extreme temperatures. However, studies have confirmed the durability of CFRP and the CFRP/steel bond when used in bridge rehabilitation under a variety of separated environmental conditions (Mertz, 1996).
Todd West, also of the University of Delaware, pursued information on how
galvanic corrosion, surface preparation, and bond performance is related to CFRP rehabilitation of steel bridges. His experimental data were largely from full-scale rehabilitation and non-destructive load testing. West’s concerns regarding galvanic corrosion were largely due to the major differences in the galvanic properties of steel and carbon. Since they would connect to form a circuit if used in direct contact with each other, West stresses that some type of intermediate layer, such as fiberglass, must be used in any installation of CFRP on steel. He demonstrated that the glass fiber layer did indeed eliminate the current connection and provided adequate insulation to prevent galvanic corrosion. (West, 2001)
He also discovered the need to adequately prepare the steel surface before
applying adhesive or other layers. Cleaning with a solvent and abrasive blasting of all bonding surfaces were shown to be good methods of preparing the materials, as long as the blasting was under a specific pressure limit as to not damage the advanced composite materials. West learned that the adhesive did not corrode under a series of
Swinehart 11
environmental tests using salt water, although the composite did experience some degradation near the bond layer. (West, 2001)
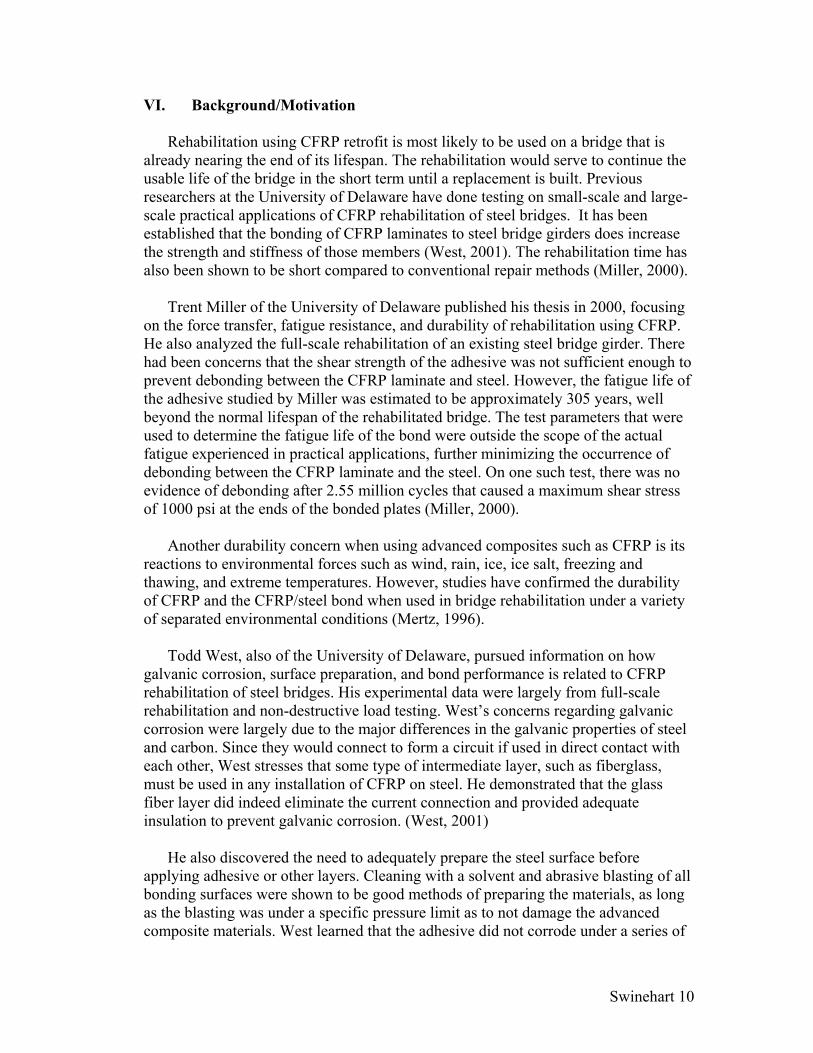
In 1999, researchers at the University of Delaware, led by Dr. Michael Chajes,
analyzed the rehabilitation of Bridge 1-192 on Old Milltown Road in New Castle County, Delaware. This steel girder bridge is simply-supported with one lane of traffic. The concrete deck had deteriorated and was replaced with a glass fiber reinforced polymer (GFRP) slab (Chajes, 2001).
Figure 5 - Replacement of a Concrete Bridge Deck with a GFRP slab
The same type of load test that was used in this project was conducted on Bridge
1-192 after the deck was replaced. From this test and the subsequent analysis the University of Delaware researchers concluded that the composite deck was functioning within normal parameters although the deck and steel girders were not acting in composite action (Chajes, 2001)

Swinehart 12
VII. Methods
This section presents and discusses the methods used during the load tests conducted on Bridge 119 in New Castle County, Delaware. The tests were performed on June 13, 2002 by Dr. Michael Chajes, Danny Richardson, and Gary Wenczel of the Civil and Environmental Engineering Department at the University of Delaware and Delaware Department of Transportation personnel.
The objective of the test was to evaluate the performance of the bridge
substructure (i.e. floor beams and girders) when subjected to normal and overloaded conditions. This allows predictions to be made about the rehabilitation and to compare the results with DelDOT’s simple analytical model. After the post-test is completed, it will be possible to use the pre-test outlined here to gauge the effectiveness of the rehabilitation. Field testing provides more accurate assessments of bridges than those generated by non-site specific calculations because it incorporates a variety of factors and variables that are unknown with theoretical calculations.
Strain gauges were used to measure the strain of several floor beams, the girders,
and a rocker as each load test was conducted. The testing equipment consisted of the strain gauges, a power supply, a data acquisition system, and a laptop.
Figure 6 - Typical Strain Gauge from Load Test

Swinehart 13
Figure 7 - Location of Strain Gauges During Load Test
Six consecutive load tests were conducted using two DelDOT dump trucks full of
sand. The first test was conducted on the left lane of the bridge heading west. The first dump truck (#2945), weighing 60,550 lbs. (front axle weight of 14,780 lbs. and back axles weight of 45,770 lbs.), slowly rolled over the bridge. Once the first dump truck was off the bridge the second truck was slowly driven across. The second truck (#2958) weighed 59,850 lbs. (front axle weight of 15,050 lbs. and back axles weight of 44,800 lbs.).
Figure 8 - Diagram of Truck Wheel Weights (all weights are in pounds)
The second and third load tests were conducted in the same manner as the first,
except the trucks drove over the right lane of the bridge in the second test and over

Swinehart 14
the middle in the third test. Both dump trucks, one in each lane, were simultaneously driven over the bridge during the fourth and fifth load tests. For the last test, each truck was driven separately down the center of the bridge at high speed (dynamic loading). The truck passes are summarized in Table 1.
Table 1 - Load Test - Passes Path # Description # of Trucks Truck Speed
1 Left lane 1 Semi-static 2 Right lane 1 Semi-static 3 Center 1 Semi-static 4 Side-by-side 2 Semi-static 5 Side-by-side 2 Semi-static 6 Center 1 Dynamic
Figure 9 - Data Acquisition System for Load Test
Bridge 119 has a posted load capacity of 15 tons. However, as this test demonstrated, it is able to withstand much larger loads. The measured strains ranged from zero to approximately 225 microstrains. This maximum is within the standard limits for the steel structure (Chajes, 2002).

Swinehart 15
VIII. Results and Discussion
The load test generated six sets of data corresponding to the six truck paths the bridge was subjected to. Graphs of strain versus time were created from these data. Strain readings were grouped into graphs with similar readings from other gauges.
As each truck begins over the bridge (at distance equal to zero), the strain at each
gauge is zero. With the trucks traveling at a constant speed, the gauges respond to the proximity of each truck axle. For example, as the front axle of the first truck approaches gauge 292, the strain at that gauge increases, reaching a peak when the axle is directly above the gauge. Likewise, the back axles (two axles with a center-to-center spacing of four feet.) produce a larger peak when the axles are centered over the gauge, with an increase in strain before the peak and a decrease after. Since the two trucks are spaced enough on the bridge to avoid overlapping in causing strains, a similar two-peak curve occurs as the second truck crosses the bridge.
The largest strain experienced by either through girder was 140.5 microstrains
from gauge 294 during pass five, which involved both trucks crossing the bridge side-by-side. Similarly, the largest strain experienced by a through girder during a single truck pass was 96.98 microstrains from gauge 291 during pass one. The largest strain experienced by a floor beam was 228.9 microstrains on gauge 314 during pass four. Also, the largest strain measured in a floor beam during a single-truck pass was 169.5 microstrains on gauge 314 during pass one.
Table 2 contains the entire set of minimum and maximum values for every gauge
during each pass. Note that the gauge numbers in italics correspond to gauges on the through girder, while those not italicized are for the floor beams or the support (298 and 314).
Table 2 - Strain Gauge Peak Values Pass Min./ Transducer
Max. 298 314 294 339 316 291 304 533 1 Min. -42.96 -169.50 -39.48 -1.83 -2.79 -96.98 -0.56 -1.17 Max. 1.15 7.27 2.32 25.59 61.87 1.24 21.99 39.90 2 Min. -95.08 -78.34 -89.99 -1.83 -1.12 -43.24 -1.13 -1.17 Max. 3.44 2.80 1.74 62.15 26.76 0.00 50.74 20.54 3 Min. -74.46 -126.50 -67.35 0.00 -0.56 -72.27 -0.56 -0.59 Max. 2.29 3.92 1.74 47.52 47.94 0.00 37.77 38.14 4 Min. -119.70 -228.90 -133.50 -0.61 -0.56 -137.10 -0.56 -0.59 Max. 2.29 2.24 0.00 93.83 89.74 -0.62 74.42 68.07 5 Min. -127.70 -218.20 -140.50 -0.61 -1.67 -128.50 -0.56 -1.17 Max. 4.58 3.92 1.74 98.70 85.29 1.85 77.24 66.90 6 Min. -87.63 -144.90 -77.80 -3.66 -4.46 -75.97 -2.26 -2.93 Max. 9.74 11.19 6.70 53.01 49.61 6.18 43.41 38.73

Swinehart 16
345 293 315 296 292 534 346 312 1 Min. -1.52 -1.70 0.00 -59.19 -2.33 -3.88 -1.86 -9.89 Max. 0.76 0.57 11.09 4.74 79.34 1.11 75.80 0.00 2 Min. -1.52 -0.57 0.00 -0.59 -2.33 -2.22 -1.24 -2.75 Max. 3.05 3.96 4.43 1.18 76.43 1.66 75.18 3.30 3 Min. -1.52 -0.57 0.00 0.00 -2.92 -7.21 -1.86 -9.34 Max. 2.29 2.26 6.65 2.96 108.50 0.00 105.00 0.55 4 Min. -2.29 -0.57 0.00 0.00 -4.08 -6.65 -1.86 -7.69 Max. 3.81 3.96 12.19 5.33 151.70 0.00 149.10 0.55 5 Min. -1.52 -0.57 -0.55 -0.59 -4.08 -6.10 -1.24 -9.34 Max. 3.81 3.96 11.09 5.33 154.60 1.11 149.10 0.00 6 Min. -1.52 -0.57 0.00 0.00 -4.67 -6.65 -3.73 -8.24 Max. 2.29 2.26 6.65 3.55 119.60 0.00 105.00 0.55
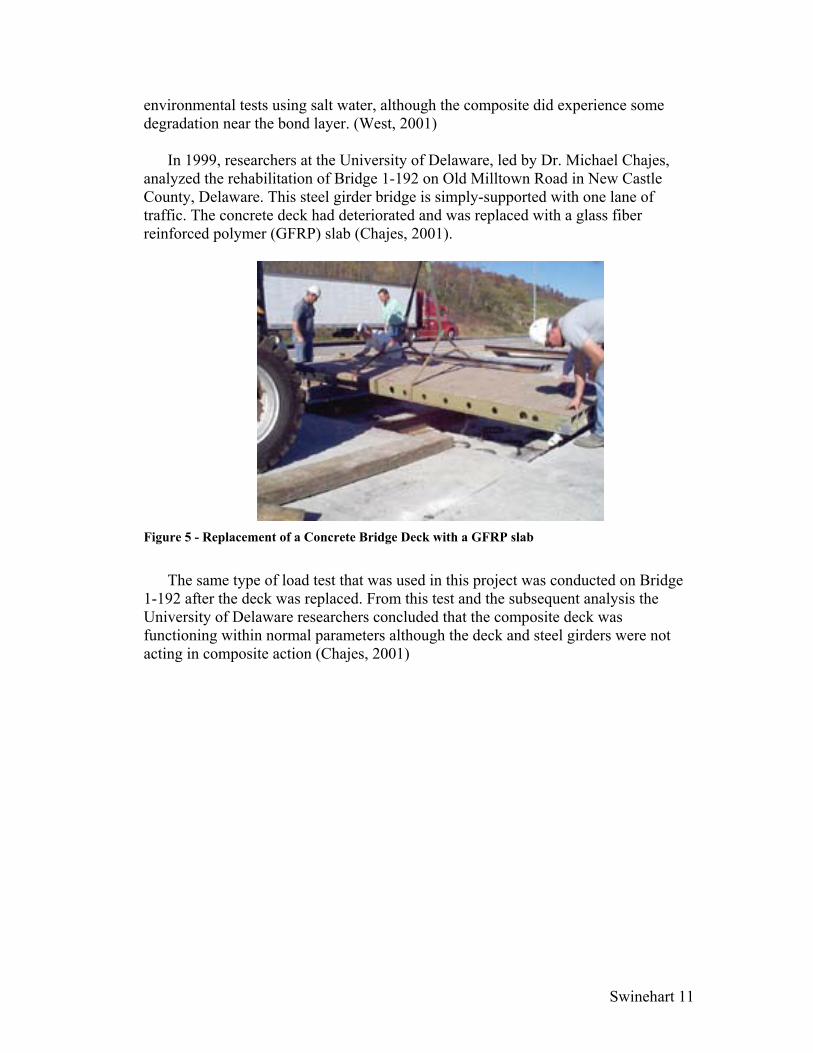
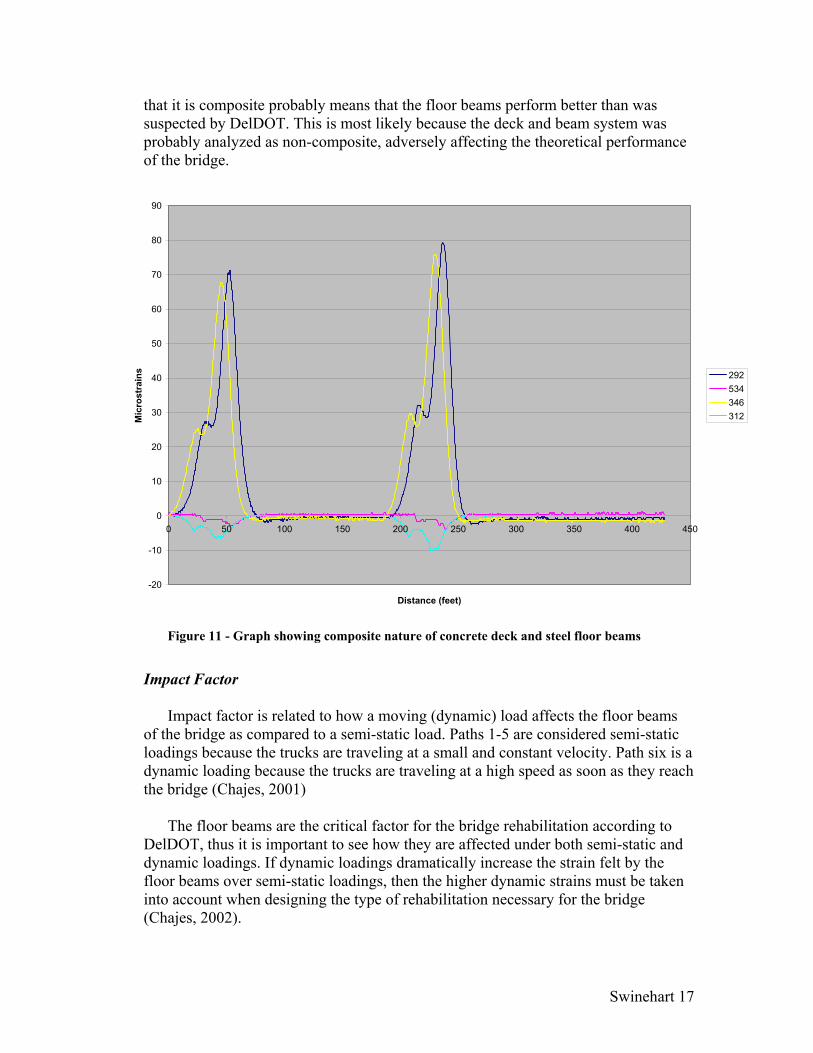
Composite vs. Non-composite It is important to determine if the concrete deck and steel floor beams are working in composite action, because many other calculations depend on whether this system acts as a composite or non-composite. In Figure 9, a graph of path four that includes floor beam gauges 292, 534, 346, and 312, the typical composite nature of the deck and floor beams is shown. Gauges 292 and 346 are on the bottom in the middle of two different floor beams while gauges 534 and 312 are on the top in the middle of those two floor beams.
Figure 10 – Simple Model of Concrete Deck and Steel Floor Beam Cross-section
If the system was non-composite it would be expected that the deck and beam
would each have their own distinct neutral axis. This would result in a graph that was a mirror image across the x-axis. For the same floor beam and gauge position, each bottom gauge would have the mirror image of the curve of the top gauge. Figure 10 clearly shows that this is not the case.
Instead, the top and bottom gauges do not produce identical and flipped curves.
Thus, there is only one neutral axis for both the deck and floor beam and it is closer to the center of gravity, and therefore closer to the deck (the top). This means the system must be acting as a composite and should be analyzed as such. The discovery
Swinehart 17
that it is composite probably means that the floor beams perform better than was suspected by DelDOT. This is most likely because the deck and beam system was probably analyzed as non-composite, adversely affecting the theoretical performance of the bridge.
-20
-10
0
10
20
30
40
50
60
70
80
90
0 50 100 150 200 250 300 350 400 450
Distance (feet)
Mic
rost
rain
s 292534346312
Figure 11 - Graph showing composite nature of concrete deck and steel floor beams
Impact Factor
Impact factor is related to how a moving (dynamic) load affects the floor beams
of the bridge as compared to a semi-static load. Paths 1-5 are considered semi-static loadings because the trucks are traveling at a small and constant velocity. Path six is a dynamic loading because the trucks are traveling at a high speed as soon as they reach the bridge (Chajes, 2001)
The floor beams are the critical factor for the bridge rehabilitation according to
DelDOT, thus it is important to see how they are affected under both semi-static and dynamic loadings. If dynamic loadings dramatically increase the strain felt by the floor beams over semi-static loadings, then the higher dynamic strains must be taken into account when designing the type of rehabilitation necessary for the bridge (Chajes, 2002).

Swinehart 18
The impact factor for the floor beams and through girders were determined by using selected gauge values for paths three (static or semi-static loading) and six (dynamic loading). These paths were chosen because they both had one truck on the bridge at a time traveling down the center. The gauges for the through girder (304, 533, 339, 316) were chosen because they were all on the bottom of the girder. The gauges for the floor beam calculation (292, 346) were also both on the bottom, as well as in the middle of their respective beams. These selections allowed for average readings between similar gauges.
The maximum measured strain values for path three and path six are in the rows
labeled ‘Static (3)’ and ‘Dynamic (6)’, respectively, in Table 3. The static and dynamic values were both averaged for each set of gauges. The dynamic average was then divided by the static average to obtain dynamic/static ratios for the through girder and floor beams. One was then subtracted for each of these ratios to determine the impact factors.
Table 3 - Impact Factor Gauge 339 316 304 533 292 346 Static Average (3) 47.52 47.94 37.77 38.14 108.5 105Dynamic Average(6) 53.01 49.61 43.41 38.73 119.6 105 Static Average for 304, 533, 339, 316 42.84 Dynamic Average for 304, 533, 339, 316 46.19 Static Average for 292 and 346 106.75 Dynamic Average for 292 and 346 112.30 Dynamic/Static Ratio for Through Girder 1.08 Dynamic/Static Ratio for Floor Beam 1.05 Impact Factor for Through Girder 0.08 Impact Factor for Floor Beam 0.05
The calculated impact factors show that the bridge is affected by dynamic
loading. In other words, dynamic loads cause more strain (stress), although the increase from semi-static to dynamic loading is minimal at .08 for the through girders and .05 for the floor beams.
Effective Widths of Floor Beams
The effective width of a floor beam represents the total distance over which a
beam supports loads. This value is the distance that, with a uniform strain distribution, will have the same effect as the varying test data. The distance of influence, which is equal to half of the effective width, is the distance between the point where the floor beam is fully loaded and the point where it is completely
Swinehart 19
unloaded when a moving load is applied. Since the effective width depends on how well the deck distributes loads to the floor beams, it is also related to the stiffness of the deck. An infinitely stiff deck would provide equal distribution to each floor beam and the load on an individual beam would be much less. [Chajes, 2001]
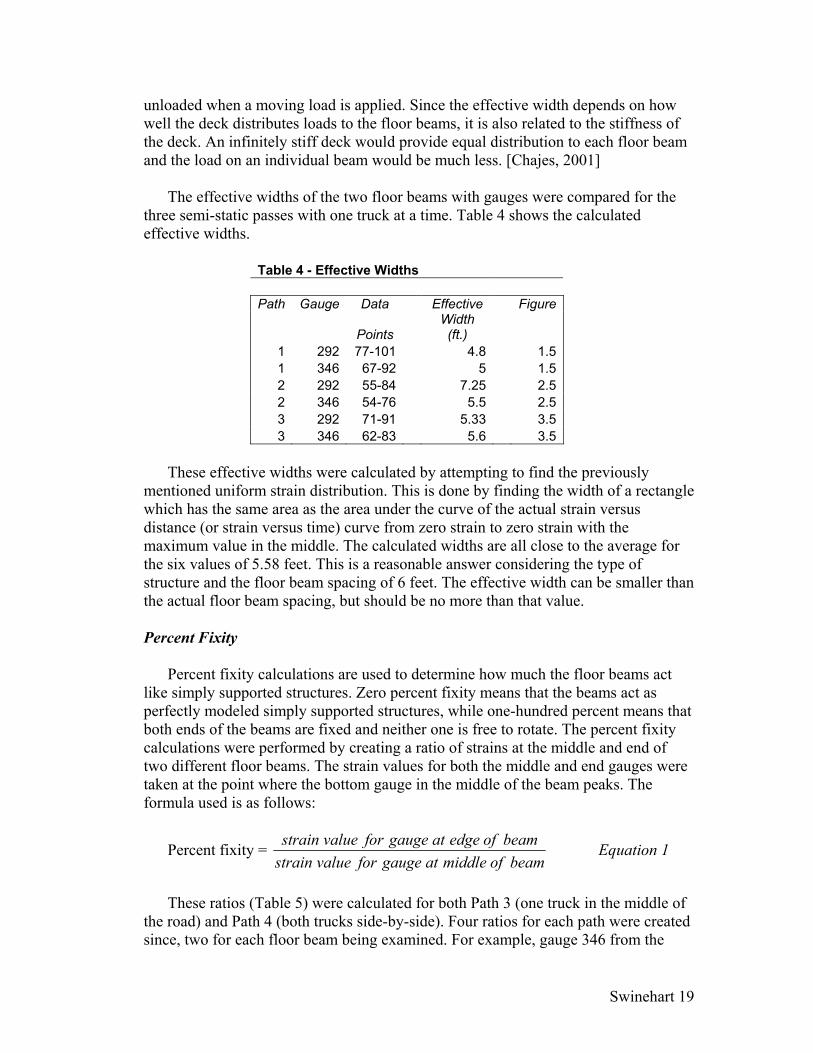
The effective widths of the two floor beams with gauges were compared for the
three semi-static passes with one truck at a time. Table 4 shows the calculated effective widths.
Table 4 - Effective Widths Path Gauge Data Effective Figure
Points Width (ft.)
1 292 77-101 4.8 1.51 346 67-92 5 1.52 292 55-84 7.25 2.52 346 54-76 5.5 2.53 292 71-91 5.33 3.53 346 62-83 5.6 3.5
These effective widths were calculated by attempting to find the previously
mentioned uniform strain distribution. This is done by finding the width of a rectangle which has the same area as the area under the curve of the actual strain versus distance (or strain versus time) curve from zero strain to zero strain with the maximum value in the middle. The calculated widths are all close to the average for the six values of 5.58 feet. This is a reasonable answer considering the type of structure and the floor beam spacing of 6 feet. The effective width can be smaller than the actual floor beam spacing, but should be no more than that value.
Percent Fixity
Percent fixity calculations are used to determine how much the floor beams act
like simply supported structures. Zero percent fixity means that the beams act as perfectly modeled simply supported structures, while one-hundred percent means that both ends of the beams are fixed and neither one is free to rotate. The percent fixity calculations were performed by creating a ratio of strains at the middle and end of two different floor beams. The strain values for both the middle and end gauges were taken at the point where the bottom gauge in the middle of the beam peaks. The formula used is as follows:
Percent fixity = beamofmiddleatgaugeforvaluestrain
beamofedgeatgaugeforvaluestrain Equation 1
These ratios (Table 5) were calculated for both Path 3 (one truck in the middle of
the road) and Path 4 (both trucks side-by-side). Four ratios for each path were created since, two for each floor beam being examined. For example, gauge 346 from the
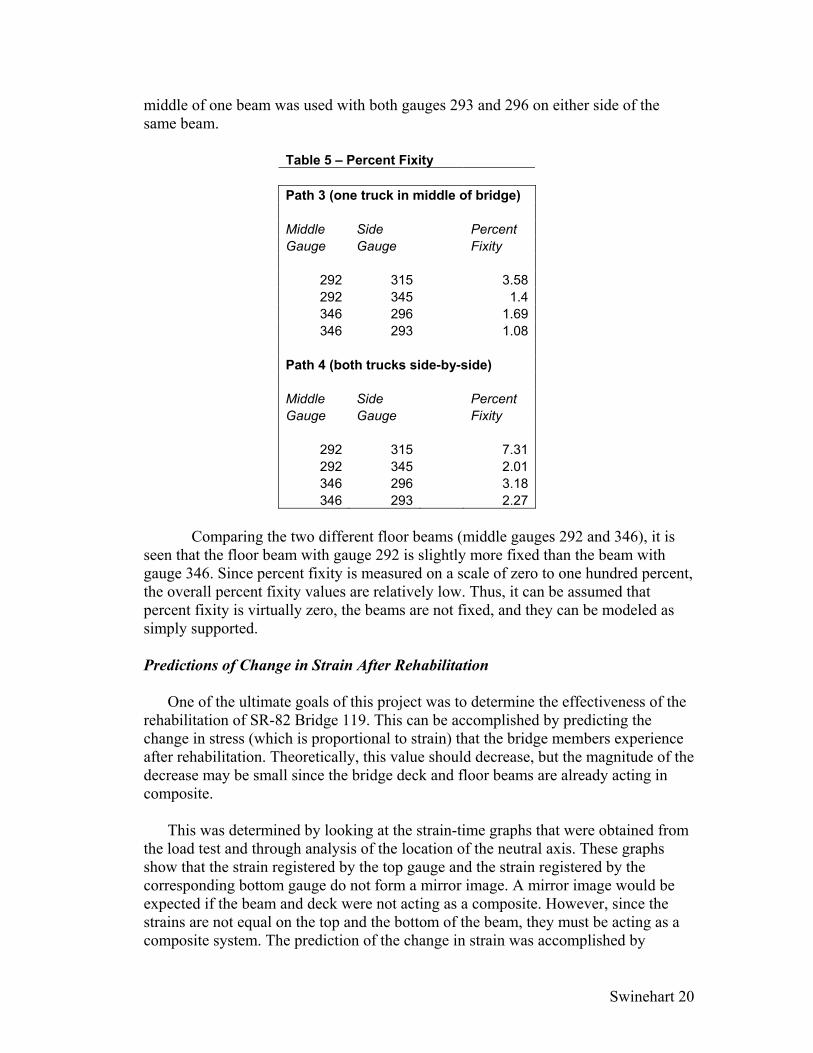
Swinehart 20
middle of one beam was used with both gauges 293 and 296 on either side of the same beam.
Table 5 – Percent Fixity Path 3 (one truck in middle of bridge) Middle Side Percent Gauge Gauge Fixity
292 315 3.58292 345 1.4346 296 1.69346 293 1.08
Path 4 (both trucks side-by-side) Middle Side Percent Gauge Gauge Fixity
292 315 7.31292 345 2.01346 296 3.18346 293 2.27
Comparing the two different floor beams (middle gauges 292 and 346), it is
seen that the floor beam with gauge 292 is slightly more fixed than the beam with gauge 346. Since percent fixity is measured on a scale of zero to one hundred percent, the overall percent fixity values are relatively low. Thus, it can be assumed that percent fixity is virtually zero, the beams are not fixed, and they can be modeled as simply supported.
Predictions of Change in Strain After Rehabilitation
One of the ultimate goals of this project was to determine the effectiveness of the
rehabilitation of SR-82 Bridge 119. This can be accomplished by predicting the change in stress (which is proportional to strain) that the bridge members experience after rehabilitation. Theoretically, this value should decrease, but the magnitude of the decrease may be small since the bridge deck and floor beams are already acting in composite.
This was determined by looking at the strain-time graphs that were obtained from
the load test and through analysis of the location of the neutral axis. These graphs show that the strain registered by the top gauge and the strain registered by the corresponding bottom gauge do not form a mirror image. A mirror image would be expected if the beam and deck were not acting as a composite. However, since the strains are not equal on the top and the bottom of the beam, they must be acting as a composite system. The prediction of the change in strain was accomplished by
Swinehart 21
transforming a section of the concrete bridge deck and steel floor beam into a simple steel section of irregular shape.
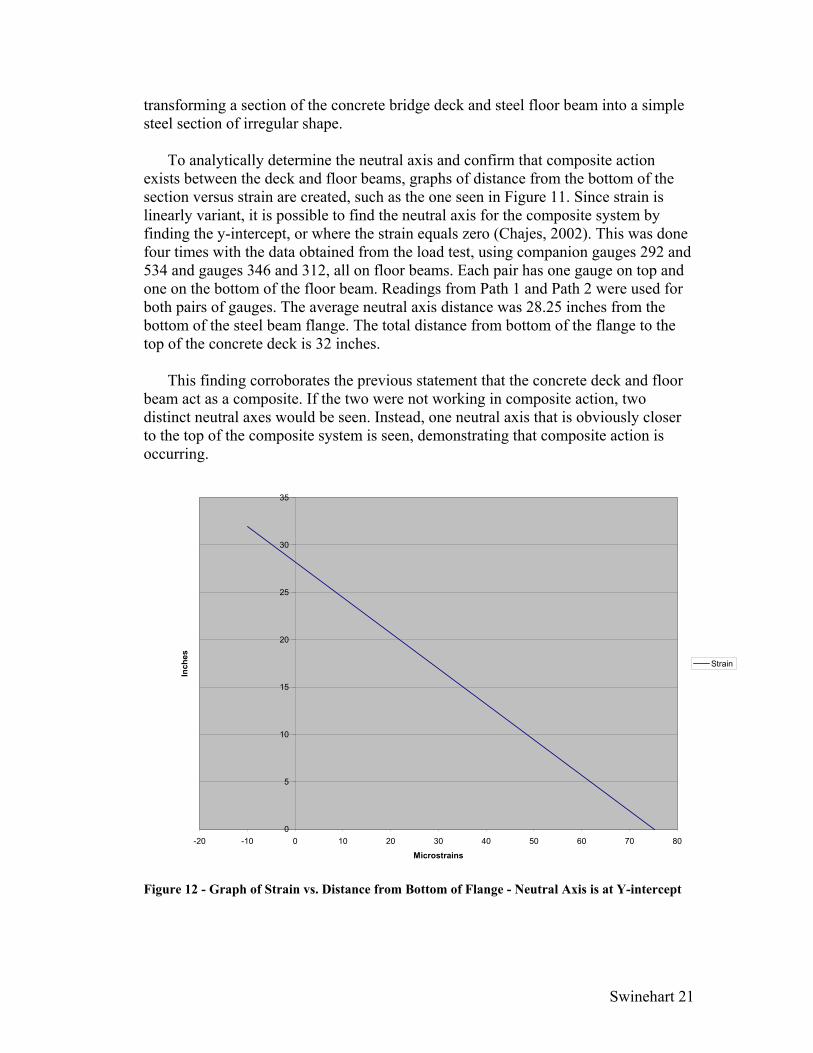
To analytically determine the neutral axis and confirm that composite action
exists between the deck and floor beams, graphs of distance from the bottom of the section versus strain are created, such as the one seen in Figure 11. Since strain is linearly variant, it is possible to find the neutral axis for the composite system by finding the y-intercept, or where the strain equals zero (Chajes, 2002). This was done four times with the data obtained from the load test, using companion gauges 292 and 534 and gauges 346 and 312, all on floor beams. Each pair has one gauge on top and one on the bottom of the floor beam. Readings from Path 1 and Path 2 were used for both pairs of gauges. The average neutral axis distance was 28.25 inches from the bottom of the steel beam flange. The total distance from bottom of the flange to the top of the concrete deck is 32 inches.
This finding corroborates the previous statement that the concrete deck and floor
beam act as a composite. If the two were not working in composite action, two distinct neutral axes would be seen. Instead, one neutral axis that is obviously closer to the top of the composite system is seen, demonstrating that composite action is occurring.
0
5
10
15
20
25
30
35
-20 -10 0 10 20 30 40 50 60 70 80
Microstrains
Inch
es
Strain
Figure 12 - Graph of Strain vs. Distance from Bottom of Flange - Neutral Axis is at Y-intercept

Swinehart 22
Consider the rehabilitated floor beam with CFRP laminate attached to its underside. Since the section is made of two different materials, it may seem to be significantly different in terms of structural properties than a section of only one material. However, strain still remains linearly variant, so the same formulas and concepts may be used in both cases. However, the neutral axis will be different in the composite section because of the changes in area distribution. Also, the two materials will probably have different values for modulus of elasticity, which will affect the stress distribution of the composite section.
A ratio of normal bending stresses was created using the different properties for
the rehabilitated and non-rehabilitated structure. The equation for the change in normal bending stress is,
old
new
IyIy
//1−=∆σ Equation 2
where y is the distance from the centroid of the cross-sectional area to the neutral axis, Inew is the moment of inertia for the transformed section, and Iold is the moment of inertia for the structure prior to rehabilitation. M, the moment is the same for both the old and new section models, thus it is omitted so that the equation produces the change in stress rather than an actual value of stress. (Hibbeler, 1994)
Table 6 - Analysis of Change in Stress I. Dimensions Using W 24x100 Steel Concrete A = 29.50 sq. in b1 = 5.58 ft. 66.96 in. I1 = 3000.00 in.^4 d2 = 8.00 in. (Height) d1 = 24.00 in. I2 = 336.11 in.^4 Formula: (b3*d2^3)/12 Composite b2 = 12.00 in. d3 = 0.21 in. I3 = 0.01 in.^4 Formula: (b4*d3^3)/12 y1 = 12.00 in. a1 = 14.75 sq. in. y2 = 28.00 in. a2 = 63.02 sq. in. Formula: b3*d2 y3 = 0.11 a3 = 1.39 sq. in. Formula: b4*d3 II. Transform Concrete into Equivalent Steel n1 = 8.50 in. Formula: Es/Ec Modular Ratio b3 = 7.88 in. Formula: b1/n1 Equivalent Width of Steel III. Moment of Inertia for Concrete and Steel) Iold = 15865.47 in.^4 Formula: (I1 + a1*d1^2) + (I2 + a2*d2^2) IV. Transform Composite Laminate into Equivalent Steel
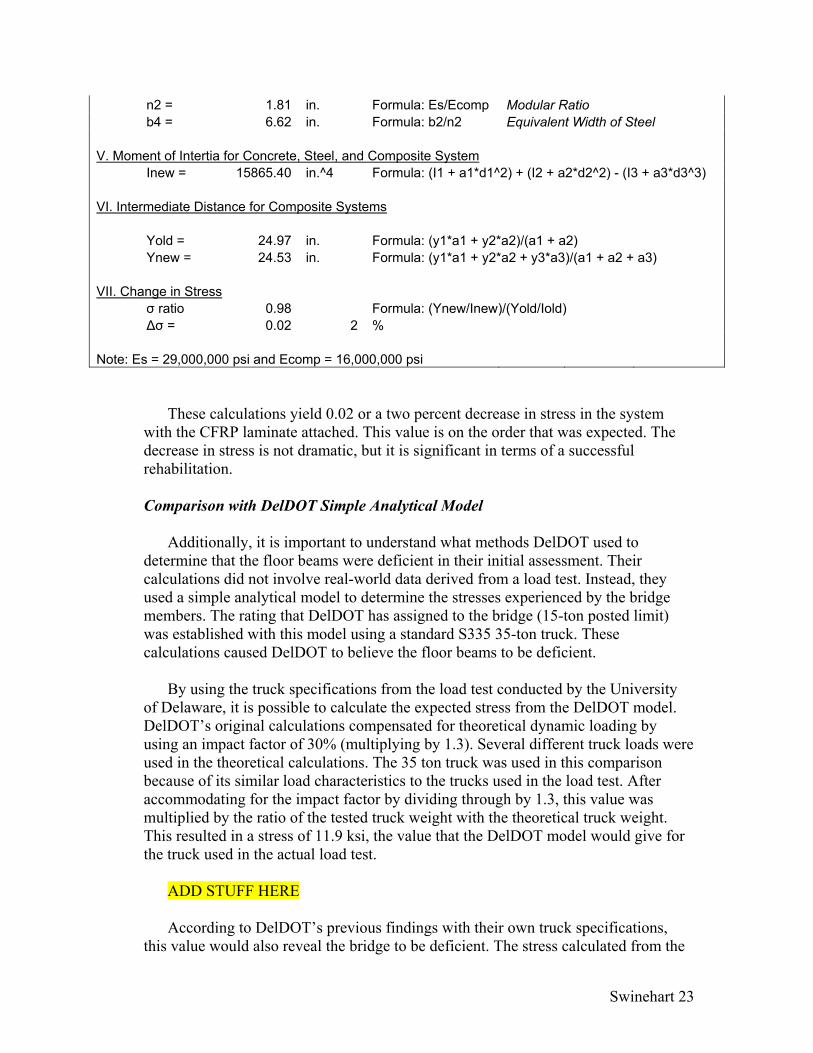
Swinehart 23
n2 = 1.81 in. Formula: Es/Ecomp Modular Ratio b4 = 6.62 in. Formula: b2/n2 Equivalent Width of Steel V. Moment of Intertia for Concrete, Steel, and Composite System Inew = 15865.40 in.^4 Formula: (I1 + a1*d1^2) + (I2 + a2*d2^2) - (I3 + a3*d3^3) VI. Intermediate Distance for Composite Systems Yold = 24.97 in. Formula: (y1*a1 + y2*a2)/(a1 + a2) Ynew = 24.53 in. Formula: (y1*a1 + y2*a2 + y3*a3)/(a1 + a2 + a3) VII. Change in Stress σ ratio 0.98 Formula: (Ynew/Inew)/(Yold/Iold) ∆σ = 0.02 2 % Note: Es = 29,000,000 psi and Ecomp = 16,000,000 psi
These calculations yield 0.02 or a two percent decrease in stress in the system with the CFRP laminate attached. This value is on the order that was expected. The decrease in stress is not dramatic, but it is significant in terms of a successful rehabilitation. Comparison with DelDOT Simple Analytical Model
Additionally, it is important to understand what methods DelDOT used to determine that the floor beams were deficient in their initial assessment. Their calculations did not involve real-world data derived from a load test. Instead, they used a simple analytical model to determine the stresses experienced by the bridge members. The rating that DelDOT has assigned to the bridge (15-ton posted limit) was established with this model using a standard S335 35-ton truck. These calculations caused DelDOT to believe the floor beams to be deficient.
By using the truck specifications from the load test conducted by the University of Delaware, it is possible to calculate the expected stress from the DelDOT model. DelDOT’s original calculations compensated for theoretical dynamic loading by using an impact factor of 30% (multiplying by 1.3). Several different truck loads were used in the theoretical calculations. The 35 ton truck was used in this comparison because of its similar load characteristics to the trucks used in the load test. After accommodating for the impact factor by dividing through by 1.3, this value was multiplied by the ratio of the tested truck weight with the theoretical truck weight. This resulted in a stress of 11.9 ksi, the value that the DelDOT model would give for the truck used in the actual load test.
ADD STUFF HERE
According to DelDOT’s previous findings with their own truck specifications, this value would also reveal the bridge to be deficient. The stress calculated from the

Swinehart 24
load test results should be similar to this value. To obtain this value, the strain must be converted to stress, using the following simple formula (Hibbeler, 1994).
εσ E= Equation 3 Using the largest recorded strain (ε ) during the load test of 228.9 microstrains
(recorded during a side-by-side truck pass) and a standard value of 29,000,000 psi for the modulus of elasticity (E), the resulting stress is 6.6 ksi. This value is significantly less than what would be expected when using DelDOT’s analytical model. Indeed, if DelDOT has used those truck specifications, they would have obtained a stress 3.6 times larger than the experimentally determined value.
This significant differenced certainly was a factor in DelDOT’s determination that
the floor beams are deficient, when if fact, it is likely that they are not. Their possible deficiency is lessened even more with the replacement of the concrete deck which will allow for more even load distribution.
In-service Monitoring
An in-service monitoring device was installed by Degang Li of the University of
Delaware on the Ashland Bridge the same day as the load test. A transducer was left on the middle of the fifth girder (the same location as gauge 292) to measure peak strains for five days, with testing ending on June 22, 2002.
The in-service monitoring system was triggered by any strain greater than 25
microstrains (threshold strain). The peak strain experienced by the gauge during this time period was 130.0 microstrains, with another large reading of 125.46 microstrains (refer to Table 7). Degang Li of the University of Delaware installed and monitored the in-service testing devices. The device records any strains larger than the value specified by the operator, as well as the time and date of the event.
Table 7 shows the peak strains recorded by the in-service transducer from June
17, 2002 to June 22, 2002. Event numbers are in chronological order Table 7 - In-service Testing Results
Event # Peak Event # Peak Event # Peak 1 87.3 13 36.4 24 26.4 2 30.9 14 27.3 25 29.1 3 106.1 15 26.4 26 28.2 4 125.5 16 31.8 27 35.5 5 93.6 17 53.6 28 30.9 6 48.2 18 48.2 29 31.8 7 28.2 19 30.9 30 39.1 8 27.3 20 39.1 31 41.8 9 39.1 21 66.4 32 54.5
10 35.5 22 54.5 33 27.3
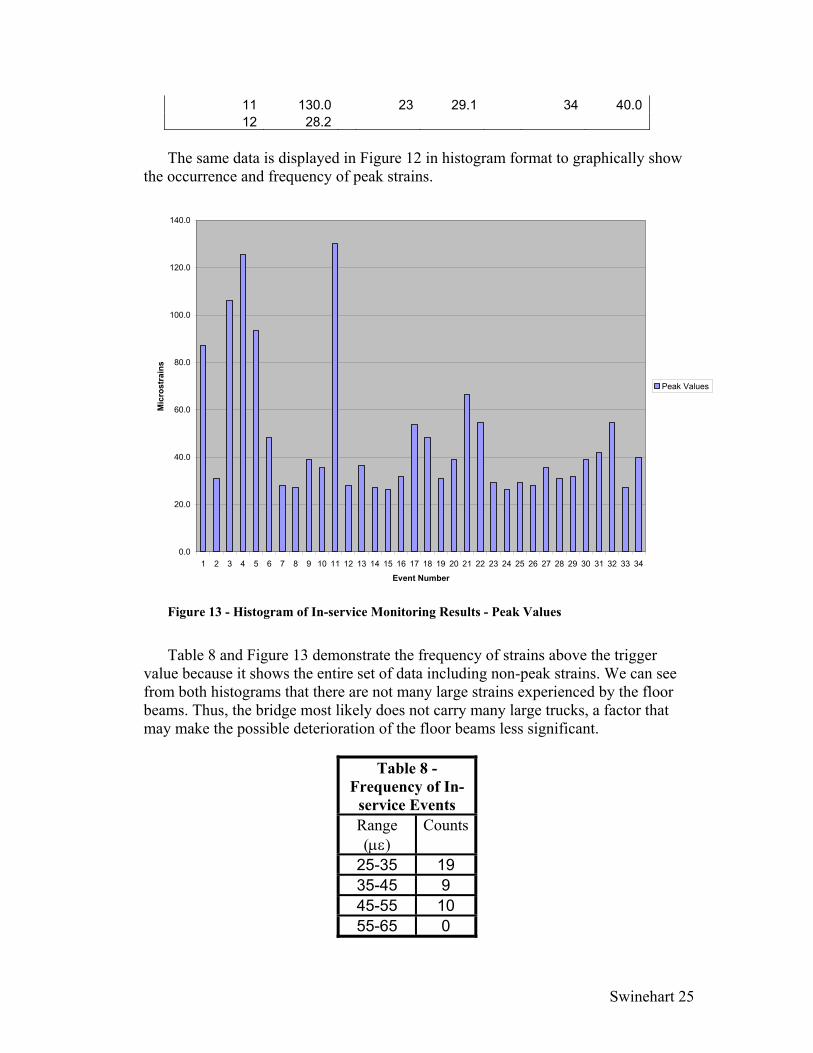
Swinehart 25
11 130.0 23 29.1 34 40.0 12 28.2
The same data is displayed in Figure 12 in histogram format to graphically show
the occurrence and frequency of peak strains.
0.0
20.0
40.0
60.0
80.0
100.0
120.0
140.0
1 2 3 4 5 6 7 8 9 10 11 12 13 14 15 16 17 18 19 20 21 22 23 24 25 26 27 28 29 30 31 32 33 34
Event Number
Mic
rost
rain
s
Peak Values
Figure 13 - Histogram of In-service Monitoring Results - Peak Values
Table 8 and Figure 13 demonstrate the frequency of strains above the trigger value because it shows the entire set of data including non-peak strains. We can see from both histograms that there are not many large strains experienced by the floor beams. Thus, the bridge most likely does not carry many large trucks, a factor that may make the possible deterioration of the floor beams less significant.
Table 8 - Frequency of In-
service Events Range (µε)
Counts
25-35 19 35-45 9 45-55 10 55-65 0
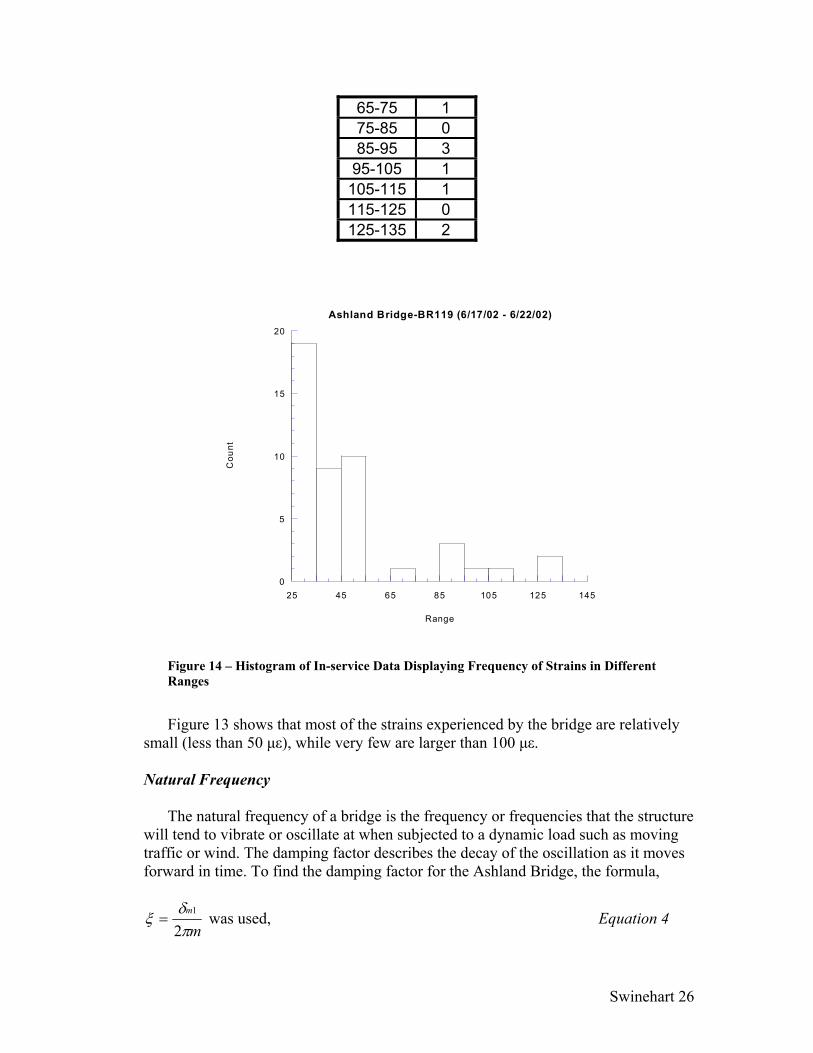
Swinehart 26
65-75 1 75-85 0 85-95 3
95-105 1 105-115 1 115-125 0 125-135 2
Figure 14 – Histogram of In-service Data Displaying Frequency of Strains in Different Ranges
Figure 13 shows that most of the strains experienced by the bridge are relatively
small (less than 50 µε), while very few are larger than 100 µε.
Natural Frequency
The natural frequency of a bridge is the frequency or frequencies that the structure will tend to vibrate or oscillate at when subjected to a dynamic load such as moving traffic or wind. The damping factor describes the decay of the oscillation as it moves forward in time. To find the damping factor for the Ashland Bridge, the formula,
mm
πδξ2
1= was used, Equation 4
0
5
10
15
20
25 45 65 85 105 125 145
Ashland Bridge-BR119 (6/17/02 - 6/22/02)
Cou
nt
Range

Swinehart 27
where 1mδ = ln
+ mn
n
VV , Equation 5
m is the number of cycles in the interval, Vn is the amplitude of vibration at any time, and Vn+m is the amplitude m cycles later. This formula was applied to gauge 533 of the dynamic loading test, path six (Clough, 1975).
The graph in Figure 14 shows the data used to determine the damping factor of the through girders. The wave-like part of the graph is what was analyzed in the calculations.
-5
0
5
10
15
20
0 50 100 150 200 250
Reading Number (20 Hz)
Mic
rost
rain
s
533
Figure 15 - Graph of the set of data used to determine the damping factor of the through girders – Path 6, Gauge 533
Table 9 - Damping Factor Path 6, Gauge 533 % Damping ξ δm1 m Vn Vn+m
6.40 0.06 0.41 1 1.76 1.17 3.22 0.03 0.41 2 1.76 1.17 2.50 0.02 1.10 7 1.76 0.59 1.00 0.01 0.69 10 1.17 0.59 1.00 0.01 1.10 19 1.76 0.59
Swinehart 28
The oscillation in Figure 14 visually demonstrates the relative flexibility of the through girders. The damping factor values in Table 9 confirm that the bridge remains oscillating for relatively long time after dynamic loadings (e.g. path six). If the bridge showed a great deal of large oscillations during normal loading, it might hurt the public’s perception of the bridge’s safety. Although normal frequencies have nothing to do with the safety of the bridge, noticeable oscillation can cause public concern and should be corrected if only to reduce this negative perception.
The plateaus in the decay seen in Figure 14 are due to the strain values being within the sensitivity of the gauge. This is one possible source of error in the damping factor calculations. To compensate, percent damping can be calculated using the midpoints of two sets of plateaus for Vn and Vn+m. This can be seen in Table 9 where m = 10. This results in what is probably the most accurate percent damping value of one percent. The period and frequency of the bridge girders can also be determined from the data contained in Figure 14. Period equals the number of seconds per complete cycle. The frequency is the inverse of the period. Bridge 119 was determined to have a period of 0.3 seconds per cycle and a frequency of 3.4 cycles per second.

Swinehart 29
IX. Conclusions
The use of advanced composites in bridge rehabilitation was shown to be a relatively easy and flexible way to improve the condition of possibly deficient steel floor beams.
The small damping factors show that the bridge vibrates for an extended
period of time after a moving vehicle crosses over it. This project highlights the fact that non-destructive load testing is essential
for accurate assessments of the health and capacity of a bridge. DelDOT’s analytical calculations were shown to be extremely conservative, because according to the load test conducted by the University of Delaware, Bridge 119 most likely was not as in need of urgent rehabilitation as was expected. If DelDOT had needed to save money and reprioritize funds for some reason, the rehabilitation could probably be delayed.
The strains experienced by the bridge members prior to the rehabilitation
are minimal and do not show an immediate need for replacement, a decrease in posted capacity, or even rehabilitation. If Delaware State did not have the money necessary to repair this bridge, it could safely wait a matter of years before replacing the concrete deck or rehabilitating the floor beams.
The floor beams and concrete deck act as a composite, even before
rehabilitation. This may explain why the calculated stress on the bridge members are significantly less than the stress determined by DelDOT’s analytical model. Composite action can cause the moment of inertia to increase, decreasing deflection, and increasing the stiffness of the bridge. However, it also changes the position of the neutral axis, somewhat offsetting the increase in stiffness.
Dynamic loading only causes a minimal change in the stresses on the
bridge. Thus, with normal traffic, the bridge responds well to moving loads.
The effective width determined for the floor beams is consistent with the
beam spacing and it demonstrates that the floor beams are probably not as deficient as DelDOT estimated.
According to the in-service monitoring data collected, the bridge
experiences little heavy truck traffic. The CFRP retrofit will be theoretically successful by reducing the stress
experienced by the supposedly deficient floor beams.
Swinehart 30
X. Recommendations for Future Research
The long-term durability of rehabilitation of steel structures using CFRP laminates must still be addressed in the field. This will only be accomplished through continuous monitoring of retrofitted bridges such as the Ashland Bridge. Through use of long-term monitoring devices such as the relatively new passive strain gauge that does not require electricity to operate, analysis of rehabilitated structures will be greatly improved.
There is still some question as to what is the flexural behavior of concrete
structures rehabilitated with advanced composites. In addition, there is little to show how the rehabilitated structure will react to repeated freeze-thaw cycles or extreme cold or hot temperatures in practical applications. Likewise, more studies on how concurrent factors such as force transfer between the steel and CFRP, environmental degradation, and fatigue effect the long-term durability of rehabilitated bridges.
Swinehart 31
XI. References
American Institute of Steel Construction, Inc. (AISC). Manual of Steel Construction LRFD. Chicago, 1970. Chajes, Michael J., Harry W. Shenton III, and William W. Finch, Jr. “Performance of Glass Fiber-Reinforced Polymer Deck on Steel Girder Bridge.” Transportation Research Record 1770 (2001): 105-12. Chajes, M.J. Professor of Structural Engineering. Personal Conversation. University of Delaware, 2002. Clough, Ray W. and Joseph Penzien. Dynamics of Sturctures. New York,: McGraw-Hill, Inc., 1975. Hibbeler, R.C. Mechanics of Materials. 2nd ed. New York: Macmillan, Inc., 1994. Mertz, D.R., and John W. Gillespie, Jr. NCHRP-IDEA Final Report: Rehabilitation of Steel Bridge Girders Through the Application of Advanced Composite Materials. (Contract NCHRP-93-I011). Washington, D.C.: Transportation Research Board, June 1996. Miller, Trent C., “The Rehabilitation of Steel Bridge Girders Using Advanced Composite Materials,” Master’s Thesis, University of Delaware, 2000. Tang, Benjamin. “The History of FRP Composites,” Presentation, Federal Highway Administration, 1997. West, T., “Enhancement to the Bond between Advanced Composite Materials and Steel for Bridge Rehabilitation,” Master’s Thesis, University of Delaware, 2001.

Appendix II

USING ADVANCED COMPOSITE MATERIALS IN
THE ASHLAND BRIDGE REHABILITATION
ANGELA P. CHACON NEW MEXICO STATE UNIVERSITY
NSF-REU 2003
UNIVERSITY OF DELAWARE CENTER FOR INNOVATIVE BRIDGE ENGINEERING
ADVISOR: DR. MICHAEL J. CHAJES
08 AUGUST 2003

2
Table of Contents
Table of Contents................................................................................................................ 2
Abstract ............................................................................................................................... 3
Introduction......................................................................................................................... 3
Background......................................................................................................................... 6
Method/Approach ............................................................................................................... 7
Ashland Bridge Rehabilitation - CFRP Plate Application.............................................. 7
Load Testing - Pre- and Post-Rehabilitation.................................................................. 8
Results & Discussion ........................................................................................................ 14
Peak Strain Values: Pre- and Post-test Comparison ..................................................... 14
Through Girder Behavior.............................................................................................. 17
Composite Floor Beam Behavior.................................................................................. 18
Floor Beam End Restraint............................................................................................. 20
Impact Factor ................................................................................................................ 21
Load Distribution to Floor Beams ................................................................................ 21
Effect of CFRP Plates - Change in Floor Beam Strain................................................. 23
Summary: Conclusions & Recommendations .................................................................. 26
Conclusions................................................................................................................... 26
Recommendations......................................................................................................... 26
Summary ....................................................................................................................... 27
Acknowledgments............................................................................................................. 27
References......................................................................................................................... 28
Appendix........................................................................................................................... 29
Load Distribution Calculation....................................................................................... 29
Impact Factor ................................................................................................................ 30

3
Abstract
There are thousands of steel bridges within the United States that are experiencing advanced levels of deterioration. This deterioration occurs because of the environmental exposure the bridges have sustained during their years in service. Because there are so many deficient structures, economically, total replacement of every deficient bridge is not an option. One alternative to total replacement is the use of advanced composite materials for retrofit or rehabilitation of bridges with deteriorated steel girders. A field demonstration in which carbon fiber-reinforced polymer (CFRP) plates were used to strengthen a steel girder bridge is presented in this paper.
The rehabilitation was performed on the Ashland Bridge on State Route 82, a
typical through girder bridge located over the Red Clay Creek in New Castle County, DE. This research serves as a field implementation to document the application of advanced composites for in-service steel bridge girder rehabilitation as well as a demonstration of the effectiveness of such a repair. The baseline behavior of the bridge was determined from a pre-test preformed in June of 2002, rehabilitation occurred in November of 2002, and a post-test performed in June of 2003. The rehabilitation of the bridge consisted of replacing the concrete deck and the bonding of CFRP plates to the tension flange of two floor beams. The change in stress due to the CFRP plates was found to be 5%, which agrees well with the predicted change found using transformed sections. There is limited research involving the actual application of advanced composites to an in-service steel structure. As such, the research done on the Ashland Bridge serves as an example of the success and benefits of using advanced composite materials for steel girder rehabilitation.
Introduction
The nation’s infrastructure is ageing and many of today’s steel bridges are reaching the end of their service life. As such, the need for repair or replacement of these bridges is increasing. Innovative techniques and materials are being sought to alleviate the problem. There are high costs associated with repair or replacement of these bridges, therefore the application of advanced composite materials for use in bridge rehabilitation is an up-and-coming solution. According to the most recent National Bridge Inventory (NBI) listing there 44,650 bridges classified as structurally deficient which are constructed with a steel superstructure. These steel bridges make up nearly 55% of the total 81,437 bridges classified as structurally deficient. These ratings are made by the Federal Highway Administration and specifically implemented through the mandatory bi-annual inspection that every bridge of the total 591,220 bridges in the NBI must undergo (FHWA).

4
Bridge deterioration occurs for many reasons. The most prominent reason being exposure to the elements over extended periods of time. Both concrete and steel experience problems due to environmental conditions and both can benefit by the use of advanced composite materials. Concrete rehabilitation or replacement has been the predominant focus of research involving the use of composite materials (Miller, 2000). It is now being realized that composite materials pose a realistic solution for the problem of steel girder deterioration as well.
Advanced composite materials, such as CFRP plates, can be used in various
applications because they can be engineered to optimize their performance for a specific application (West, 2001). High strength-to-weight ratios along with corrosion resistance are appealing factors contributing to the interest in the use of composite materials. In addition, the ease of application when compared to that of applying a steel plate introduces cost savings associated with labor, time, and inconveniences to the traveling public. Reduction in member capacity or increases in deflection are not of concern because the plates will not significantly increase the weight of the member as can occur with conventional steel cover plates (Liu, 2001). The disadvantages associated with any new material are high initial cost and the lack of long-term testing. Advanced composite materials exhibit both, however it is believed with continual and more frequent use costs will decrease and through more testing a durability record will be proven.
In recent years structural rehabilitation using advanced composite materials has
become more common. This rehabilitation has occurred in various ways. Such ways are the replacement of concrete decks with composite decks and using fiber reinforced polymer (FRP) sheets to wrap member such as columns to delay deterioration due to spalling or for seismic retrofit.
This paper focuses on the rehabilitation of the Ashland Bridge using advanced
composite materials. The Ashland Bridge carries State Route 82 over Red Clay Creek. It is a steel through girder bridge. Figure 1 and Figure 2 shows the Ashland Bridge as it looks today and Figure 3 shows the floor beam layout of the bridge’s members. The members indicated on the floor beam layout as well as the through girders were instrumented for testing. The two floor beams indicated with CFRP (G3 CFRP and G4 CFRP) were rehabilitated with CFRP plates.

5
Figure 1. Ashland Bridge, looking North-West
Figure 2. Ashland Bridge, looking East
Figure 3. Floor beam layout of the Ashland Bridge.
The span length of the two through girders is 100 feet and the floor beams span 27
feet and carry the concrete deck. There are 19 floor beams (W24 X 100 sections) spaced 6 feet on center on the Ashland Bridge.
6
The Delaware Department of Transportation (DelDOT) determined the concrete
deck and floor beams showed significant deterioration and as such the Ashland Bridge was deemed structurally deficient. Prior to rehabilitation in June of 2002 the University of Delaware conducted load tests to document the baseline behavior of the bridge. Two floor beams were retrofitted with CFRP plates on the bottom of the tension flange and the concrete deck was replaced in two sections on November 25 and December 2 (Chajes, 2002). The CFRP plates were bonded to the floor beams after the concrete deck was removed and before a new deck was cast. As such, the CFRP plates help the floor beams resist both dead load and live loads. In June of 2003 a post-test was performed to evaluate the effectiveness of the rehabilitation, specifically the performance of the CFRP plates for improvements in strength and stiffness.
The Ashland Bridge is the second steel bridge in Delaware to be rehabilitated
using CFRP plates. A CFRP repair was performed in the summer of 2000 on an I-95 bridge (Bridge 1-704). Both retrofits were done to demonstrate the rehabilitation process as well as quantify improvement in stiffness and strength. The use of CFRP plates was appropriate for use on the Ashland Bridge because they allowed for fast and easy rehabilitation of deficient structural elements. Understanding the use of advanced composite materials is significant in engineering because repair and retrofit will always be considered before a decision is made as to replace a bridge or not. Improvements in materials and techniques are evident. One such improvement will be the use of advanced composite materials.
Background
The deterioration of a member on a steel bridge does not always lead to replacement of the member. In most cases the deterioration is such that rehabilitation can be done. Research and testing can lead to more efficient ways to conduct this rehabilitation. The use of advanced composite materials is one method of rehabilitation. Extensive work is needed when rehabilitation occurs. This work incorporates costs, labor, machinery and time. Using advanced composite materials will impact all of these factors. While there are high costs associated with advanced composite materials today, there are costs savings associated with their use. These arise because it is less labor intensive to apply the composites rather than it is to apply a steel plate. This is because composites weigh approximately 1/10 that of steel. In addition to weight, the application is easier because lighter equipment is needed in terms of lifts and machinery. The application is also simpler because adhesives are used rather than welding or bolting. Time savings occur because of the simple process for rehabilitation. This allows for fewer closures of bridge lanes and eases the burden on the public using the bridge. There is limited research on the use of advanced composite materials for steel girder rehabilitation. The research that has been conducted has shown promise in both laboratory and field applications.
7
Studies have been conducted at the University of Delaware on several topics such as surface preparation, bond durability, appropriate adhesives, and field application. In 2000, Trent Miller of the University of Delaware wrote a Master’s thesis on the retrofit of one girder of an I-95 bridge (Bridge 1-704) in Delaware. This retrofit incorporated studies for selecting the proper bonding agent and selecting an application process that would be efficient for field implementation. This process identified was used for the Ashland Bridge rehabilitation and is summarized in the following section. Load tests were conducted on Bridge 1-704 during the summer of 2003 for a separate NSF-REU project. During the testing, strain transducers were also mounted to the bridge to evaluate the bond of the CFRP plates. Results from these tests indicate the bond of the CFRP plates to the steel girder is still good as strains from the CFRP plates were comparable to those on adjacent girders.
Todd West, also of the University of Delaware, did further studies on CFRP
plates concerning issues of proper surface preparation and galvanic corrosion. These studies showed the need to properly prepare the surface of the steel prior to application by sand blasting the surface and applying a cleaning solvent. West’s results were based on small-scale laboratory testing. Galvanic corrosion is a concern with the use of carbon fiber based composite materials. Galvanic corrosion occurs when materials of dissimilar carbon contents come in contact. To control this issue West found that using an intermediate layer between the materials, such as an insulating layer, would control the problem of galvanic corrosion. The intermediate layer used for this testing, as well as on the Ashland Bridge, was a glass fiber fabric.
Additional studies were conducted as part of an NCHRP-IDEA investigation at
the University of Delaware included adhesive durability testing and load capacity were studied. This research involved small-scale tests where steel beams were retrofitted using different plate configurations. Strength increases of greater than 50% were found on average for the retrofit. Testing on typical American Standard I shape deteriorated steel girders were also tested and showed increases in strength and stiffness as well (Mertz and Gillespie 1996).
Method/Approach
Ashland Bridge Rehabilitation - CFRP Plate Application
For the Ashland Bridge, the CFRP plates were applied to the bottom face of two floor beams. The CFRP plates are a composite material composed of unidirectional carbon fibers and a vinyl-ester resin matrix. The plates are 37-mm wide X 5.25-mm thick (1.46 in. X .21 in.) produced in a pultrusion process. The material cost is dependent on the amount of material produced. These plates can be manufactured to any desired length. As such, long, thin plates can be produced and cut to length. Several 37-mm

8
wide plates were used to make up the full width of the flange for this study because it is less expensive to produce only one size of plate for small projects. The CFRP plate sections used for the rehabilitation can be seen in Figure 4.
Figure 4. CFRP plate segments.
In the rehabilitation, nearly the entire length of the floor beam was retrofitted with
the CFRP plates. This CFRP plate were divided into four plate segments for simplifying the application procedure. Each segment was five feet length. The width of the final plate was made up of six individual plates. Six inch staggered joints were used for each of the four plate segments. The end connection of each staggered plate was beveled to a 45-degree angle to eliminate peel stresses induced by the joint (Miller 2000). Peel off of the plates is a failure mode that has occurred during plate testing, especially at the maximum moment region of the girders (Liu 2001). Wood blocks were used to keep the larger plate segments together as well as provide a location for clamping. Once assembled, the bonding surface of the plates was sanded to aid with adhesive bonding. Abrasive blasting was used for the floor beam preparation as well as a surface cleaning solvent. Glass fiber fabric was used as the intermediate layer. The plates were applied in individual plate segments using two-part epoxy, clamped in place and allowed to cure for 24 hours at ambient temperature. Once cured, the excess adhesive was removed from the plates.
Load Testing - Pre- and Post-Rehabilitation
Diagnostic load tests were performed on the Ashland Bridge before and after rehabilitation. The pre-test was completed on June 13, 2002 and the post-test on June 24, 2003. In both tests strain transducers were used to measure the strain on selected floor beams and selected locations on the through girders. The strain transducers were mounted in one of two ways. Those on the tension flange were clamped while those on the compression flange or those on the CFRP plates were placed on with adhesive. Before application onto the compression flange the paint was ground off so as to ensure proper bonding. The surface of the CFRP plates was cleaned before the gages were placed. The adhesive used was Ciba Araldite AV 8113. Bridge Diagnostic Inc., Structural Testing System was used for data acquisition during load testing.
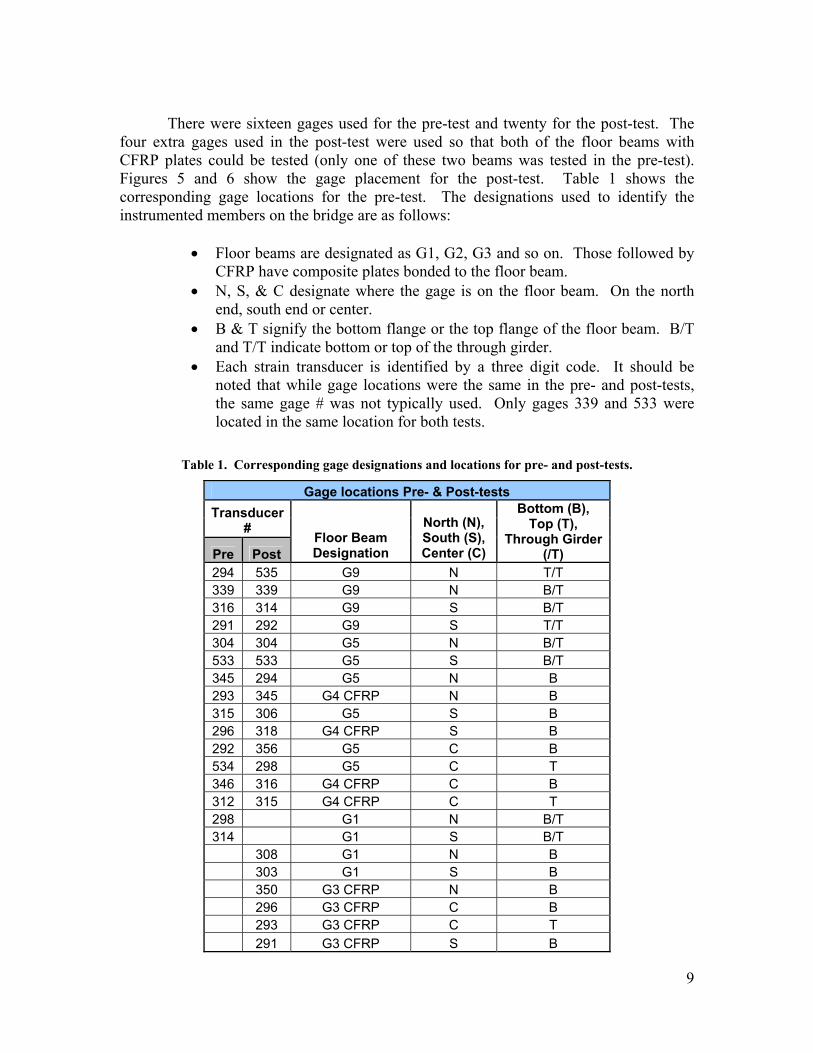
9
There were sixteen gages used for the pre-test and twenty for the post-test. The
four extra gages used in the post-test were used so that both of the floor beams with CFRP plates could be tested (only one of these two beams was tested in the pre-test). Figures 5 and 6 show the gage placement for the post-test. Table 1 shows the corresponding gage locations for the pre-test. The designations used to identify the instrumented members on the bridge are as follows:
• Floor beams are designated as G1, G2, G3 and so on. Those followed by
CFRP have composite plates bonded to the floor beam. • N, S, & C designate where the gage is on the floor beam. On the north
end, south end or center. • B & T signify the bottom flange or the top flange of the floor beam. B/T
and T/T indicate bottom or top of the through girder. • Each strain transducer is identified by a three digit code. It should be
noted that while gage locations were the same in the pre- and post-tests, the same gage # was not typically used. Only gages 339 and 533 were located in the same location for both tests.
Table 1. Corresponding gage designations and locations for pre- and post-tests.
Gage locations Pre- & Post-tests Transducer
#
Pre Post Floor Beam Designation
North (N), South (S), Center (C)
Bottom (B), Top (T),
Through Girder (/T)
294 535 G9 N T/T 339 339 G9 N B/T 316 314 G9 S B/T 291 292 G9 S T/T 304 304 G5 N B/T 533 533 G5 S B/T 345 294 G5 N B 293 345 G4 CFRP N B 315 306 G5 S B 296 318 G4 CFRP S B 292 356 G5 C B 534 298 G5 C T 346 316 G4 CFRP C B 312 315 G4 CFRP C T 298 G1 N B/T 314 G1 S B/T 308 G1 N B 303 G1 S B 350 G3 CFRP N B 296 G3 CFRP C B 293 G3 CFRP C T 291 G3 CFRP S B

10
The two floor beams retrofitted with the CFRP plates (G3 and G4) as well as a
control floor beam (G5) were each instrumented with four strain transducers. Three transducers were mounted to the underside of the tension flange, two at the ends of the beam and one at mid-span. One transducer was also mounted onto the underside of the compression flange at mid-span of the beam. Instrumentation was also placed on the through girder at mid-span, the quarter span and near the end bearings. Details of the transducer locations can be found in Figures 5 and 6. Figure 5 shows the location of the instrumented floor beams on bridge and Figure 6 shows the locations of the gages on the floor beam and through girder.
Figure 5. Locations of instrumented floor beams.

11
Figure 6. Detail locations of gages on instrumented members.
Two three-axle DelDOT dump trucks were filled with sand and used as the
controlled live loads. The trucks were weighed on site with Intercomp portable truck scales accurate to within +/-10 pounds. For the post-test, the total weight of Truck # 2750 was 58,110 lbs. and the rear axle group weighed 41,740 lbs. Truck # 2873 was slightly heavier with a total weight of 58,470 lbs. and had a rear axle group weight of 42,760 lbs. The test trucks used for the post-rehabilitation test were slightly lighter than those used in the pre-test. As such, a ratio of the pre-test to the post-test was found so the data from the tests could be compared. The results from the post test are adjusted by a factor of 1.073 to compensate for the differences in the rear axle group truck weight. The axle spacing and weights of the test trucks for both tests are shown in Figure 7.

12
Figure 7. Test trucks' axle spacing and weight.
The diagnostic load tests measured strain in the floor beams and through girder as
controlled live loads caused by the two three-axle dump trucks were driven in different configurations over the bridge. These configurations were varied during six tests. Five of the six tests (Tests 1-5)were semi-static tests conducted at 5 mph while the dynamic test (Test 6) was conducted at 35 mph. Data was collected at 5 Hz for semi-static testing and at 20 Hz for dynamic testing. For the single truck load tests (Tests 1, 2, and 3), Truck #2750 crossed the bridge first. For the side-by-side tests (Tests 4 and 5), this truck was in the left lane as the trucks headed west. The six tests are summarized in Table 2. The same tests were conducted for both the pre- and post-test.

13
During the load tests, data collection initiated just before the first truck’s front wheels were on the bridge. The first truck drove over the bridge and as the rear wheels of the first truck came off the bridge the second truck drive over the bridge. The test continued until the second truck was off the bridge. This was done so repeatability of the data could be checked. Tests 1 and 2 were single lane tests where trucks were driven in the center of the marked lanes. In Test 3 the trucks crossed in the middle of the roadway. The side-by-side tests were done with both trucks on the bridge, one in each lane, ideally staying at the same speed and directly next to each other as the trucks were driven over the bridge. All load tests were conducted with the trucks traveling west. Figure 8 shows the wheel configurations for each of the six passes.
Table 2. Summary of load tests.
Test No. Description No. of Trucks Truck Speed
1 Left lane One at a time Semi-static 2 Right lane One at a time Semi-static 3 Center One at a time Semi-static 4 Side-by-side Two at once Semi-static 5 Side-by-side Two at once Semi-static 6 Center One at a time Dynamic
Pass 4 & 5
LaneWestboundEastbound
Lane
Pass 3 & 6
Pass 2Pass 1
Figure 8. Test pass wheel configurations.

14
Results & Discussion
Peak Strain Values: Pre- and Post-test Comparison The entire set of peak values for both the pre- and post-tests are shown in Tables 3 & 4. The post test values have been adjusted (scaled up by 1.073) to account for difference in truck weights between the pre- and post-tests. Tension and compression are represented by positive and negative values respectively. These tables also show designation information regarding the location of the gage on the bridge.

Table 3. Peak strain values: Pre-test.
Pre-Test Peak Strain Values
Pass 1 Pass 2 Pass 3 Pass 4 Pass 5 Pass 6 Transducer
#
Pre Post Floor Beam Designation
North (N),
South (S),
Center (C)
Bottom (B), Top
(T), Through Girder
(/T) Min. Max. Min. Max. Min. Max. Min. Max. Min. Max. Min. Max.
294 535 G9 N T/T -39.5 2.3 -90.0 1.7 -67.4 1.7 -133. 0.0 -140.5 1.7 -77.8 6.7
339 339 G9 N B/T -1.8 25.6 -1.8 62.2 0.0 47.5 -0.6 93.8 -0.6 98.7 -3.7 53.7
316 314 G9 S B/T -2.8 61.9 -1.1 26.8 -0.6 47.9 -0.6 89.7 -1.7 85.3 -4.5 49.6
291 292 G9 S T/T -97.0 1.2 -43.2 0 -72.3 0 -137.1 -0.6 -128.5 1.9 -76.0 6.2
304 304 G5 N B/T -0.6 22.0 -1.1 50.7 -0.6 37.8 -0.6 74.4 -0.6 77.2 -2.3 43.4
533 533 G5 S B/T -1.2 39.9 -1.2 20.5 -0.6 38.1 -0.6 68.1 -1.2 66.9 -2.9 38.7
345 294 G5 N B -1.5 0.8 -1.5 3.1 -1.5 2.3 -2.3 3.8 -1.5 3.8 -1.5 2.3
293 345 G4 CFRP N B -1.7 0.6 -0.6 4.0 -0.6 2.3 -0.6 4.0 -0.6 4.0 -0.6 2.3
315 306 G5 S B 0 11.1 0 4.4 0 6.7 0 12.2 -0.6 11.1 0 6.7
296 318 G4 CFRP S B -59.2 4.7 -0.6 1.2 0 3.0 0 5.3 -0.6 5.3 0 3.6
292 356 G5 C B -2.3 79.3 -2.3 76.4 -2.9 108.5 -4.1 151.7 -4.1 154.6 -4.7 119.6
534 298 G5 C T -3.9 1.1 -2.2 1.7 -7.2 0.0 -6.7 0.0 -6.1 1.1 -6.7 0
346 316 G4 CFRP C B -1.9 75.8 -1.2 75.2 -1.9 105.0 -1.9 149.1 -1.2 149.1 -3.7 105.0
312 315 G4 CFRP C T -9.9 0 -2.8 3.3 -9.3 0.6 -7.7 0.6 -9.3 0.0 -8.2 0.6

16
Table 4. Peak strain values: Post-test
Adjusted Post-Test Peak Strain Values
Pass 1 Pass 2 Pass 3 Pass 4 Pass 5 Pass 6 Transducer
#
Pre Post Floor Beam Designation
North (N),
South (S),
Center (C)
Bottom (B), Top
(T), Through
Girder (/T) Min. Max. Min. Max. Min. Max. Min. Max. Min. Max. Min. Max.
294 535 G9 N T/T -37.1 1.2 -78.4 4.8 -58.1 5.4 -110.1 3.0 -110.7 6.0 -67.6 9.0
339 339 G9 N B/T -1.3 28.8 0 72.6 -1.3 52.3 -0.7 100.0 -0.7 101.3 -7.8 56.2
316 314 G9 S B/T -3.6 65.4 -2.4 29.4 -2.4 47.4 -1.2 99.1 -2.4 94.3 -7.2 51.6
291 292 G9 S T/T -66.3 19.4 -32.6 9.4 -51.3 11.9 -7.3 16.9 -100.1 16.3 -65.7 13.8
304 304 G5 N B/T -4.8 22.4 -0.6 66.5 -1.2 47.2 -0.6 88.3 0 91.3 -6.7 64.1
533 533 G5 S B/T -4.4 57.9 -1.9 -0.1 -1.9 42.2 0 87.5 -2.5 83.7 -5.0 52.9
345 294 G5 N B -0.6 1.2 -1.2 3.1 -0.6 1.2 0 4.4 -0.6 4.4 -1.2 1.9
293 345 G4 CFRP N B 0 3.3 0 6.5 -0.8 4.1 -0.8 7.4 -0.8 7.4 0 5.7
315 306 G5 S B 0.6 12.8 0 4.9 -1.2 6.7 -0.6 13.4 -0.6 12.8 -0.6 7.9
296 318 G4 CFRP S B 0 6.3 -0.6 1.9 0.0 3.2 -0.6 6.3 -0.6 6.3 -0.6 3.8
292 356 G5 C B -7.9 50.4 -1.4 72.7 -2.2 90.0 -2.2 118.0 -2.2 119.5 -5.8 105.8
534 298 G5 C T -0.6 4.3 -0.6 6.2 -0.6 7.3 -1.2 9.8 -1.2 9.2 0.0 6.8
346 316 G4 CFRP C B -4.8 52.6 -0.6 62.2 -0.1 81.3 -1.2 108.9 -1.2 109.4 -3.6 92.1
312 315 G4 CFRP C T -1.8 0 0 5.4 -0.6 4.8 -1.2 6.5 -0.6 6.5 -1.2 5.9
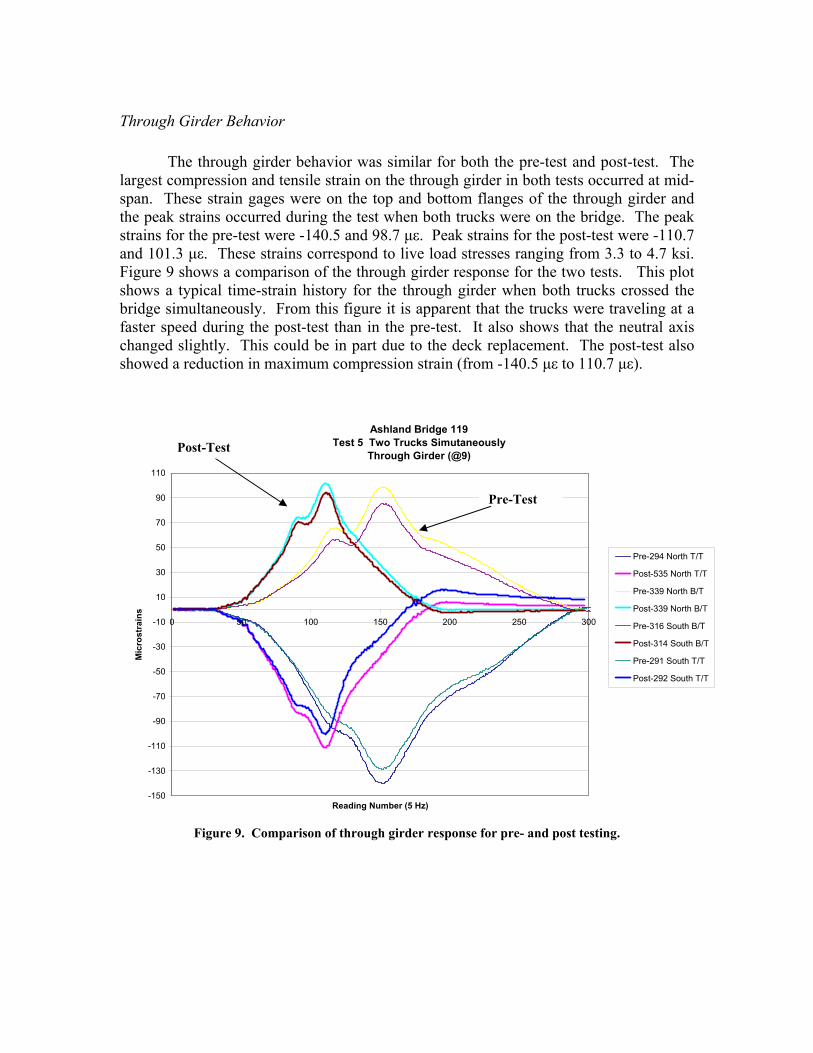
Through Girder Behavior The through girder behavior was similar for both the pre-test and post-test. The
largest compression and tensile strain on the through girder in both tests occurred at mid-span. These strain gages were on the top and bottom flanges of the through girder and the peak strains occurred during the test when both trucks were on the bridge. The peak strains for the pre-test were -140.5 and 98.7 µε. Peak strains for the post-test were -110.7 and 101.3 µε. These strains correspond to live load stresses ranging from 3.3 to 4.7 ksi. Figure 9 shows a comparison of the through girder response for the two tests. This plot shows a typical time-strain history for the through girder when both trucks crossed the bridge simultaneously. From this figure it is apparent that the trucks were traveling at a faster speed during the post-test than in the pre-test. It also shows that the neutral axis changed slightly. This could be in part due to the deck replacement. The post-test also showed a reduction in maximum compression strain (from -140.5 µε to 110.7 µε).
Ashland Bridge 119 Test 5 Two Trucks Simutaneously
Through Girder (@9)
-150
-130
-110
-90
-70
-50
-30
-10
10
30
50
70
90
110
0 50 100 150 200 250 300
Reading Number (5 Hz)
Mic
rost
rain
s
Pre-294 North T/T
Post-535 North T/T
Pre-339 North B/T
Post-339 North B/T
Pre-316 South B/T
Post-314 South B/T
Pre-291 South T/T
Post-292 South T/T
Figure 9. Comparison of through girder response for pre- and post testing.
Post-Test
Pre-Test
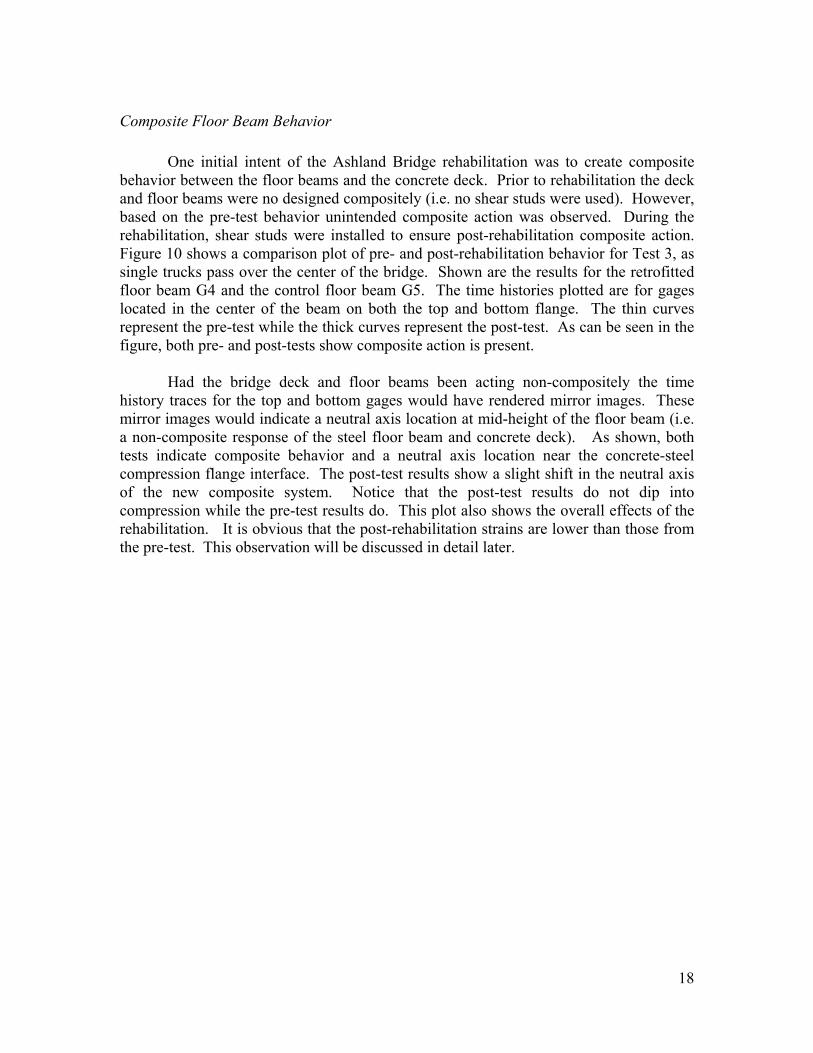
18
Composite Floor Beam Behavior One initial intent of the Ashland Bridge rehabilitation was to create composite behavior between the floor beams and the concrete deck. Prior to rehabilitation the deck and floor beams were no designed compositely (i.e. no shear studs were used). However, based on the pre-test behavior unintended composite action was observed. During the rehabilitation, shear studs were installed to ensure post-rehabilitation composite action. Figure 10 shows a comparison plot of pre- and post-rehabilitation behavior for Test 3, as single trucks pass over the center of the bridge. Shown are the results for the retrofitted floor beam G4 and the control floor beam G5. The time histories plotted are for gages located in the center of the beam on both the top and bottom flange. The thin curves represent the pre-test while the thick curves represent the post-test. As can be seen in the figure, both pre- and post-tests show composite action is present.
Had the bridge deck and floor beams been acting non-compositely the time
history traces for the top and bottom gages would have rendered mirror images. These mirror images would indicate a neutral axis location at mid-height of the floor beam (i.e. a non-composite response of the steel floor beam and concrete deck). As shown, both tests indicate composite behavior and a neutral axis location near the concrete-steel compression flange interface. The post-test results show a slight shift in the neutral axis of the new composite system. Notice that the post-test results do not dip into compression while the pre-test results do. This plot also shows the overall effects of the rehabilitation. It is obvious that the post-rehabilitation strains are lower than those from the pre-test. This observation will be discussed in detail later.
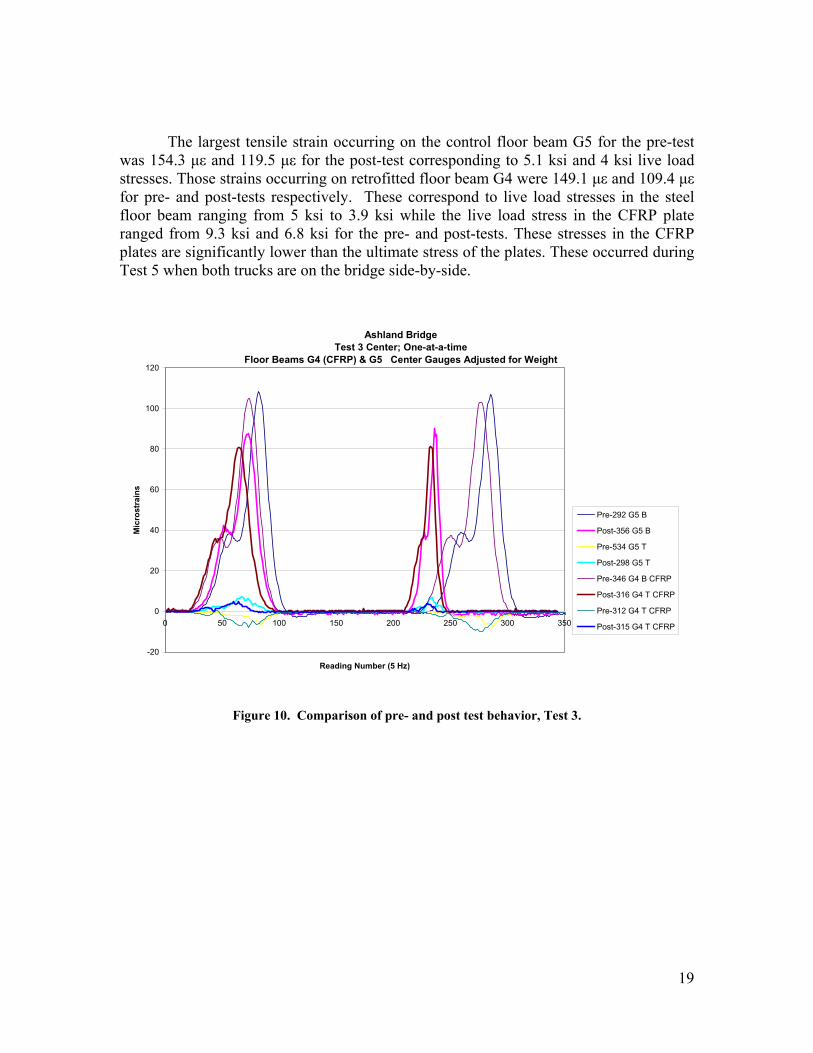
19
The largest tensile strain occurring on the control floor beam G5 for the pre-test
was 154.3 µε and 119.5 µε for the post-test corresponding to 5.1 ksi and 4 ksi live load stresses. Those strains occurring on retrofitted floor beam G4 were 149.1 µε and 109.4 µε for pre- and post-tests respectively. These correspond to live load stresses in the steel floor beam ranging from 5 ksi to 3.9 ksi while the live load stress in the CFRP plate ranged from 9.3 ksi and 6.8 ksi for the pre- and post-tests. These stresses in the CFRP plates are significantly lower than the ultimate stress of the plates. These occurred during Test 5 when both trucks are on the bridge side-by-side.
Ashland Bridge Test 3 Center; One-at-a-time
Floor Beams G4 (CFRP) & G5 Center Gauges Adjusted for Weight
-20
0
20
40
60
80
100
120
0 50 100 150 200 250 300 350
Reading Number (5 Hz)
Mic
rost
rain
s
Pre-292 G5 B
Post-356 G5 B
Pre-534 G5 T
Post-298 G5 T
Pre-346 G4 B CFRP
Post-316 G4 T CFRP
Pre-312 G4 T CFRP
Post-315 G4 T CFRP
Figure 10. Comparison of pre- and post test behavior, Test 3.

20
Floor Beam End Restraint
It is accurate to mode the floor beams as simply supported because very little end restraint was observed during testing. This amount of end restraint was found by calculating the percent fixity of the floor beams. The very small amount of support fixity exhibited by the Ashland Bridge means the floor beam behave like a simply supported beam. One hundred percent fixity means the ends are acting as if they were fixed and not free to rotate. The percent fixity was found by taking the ratio of the strain at the edge of the beam to the strain at the center of the beam when the center gage peaked. In completely fixed connections the end span strain and support strain are equal in magnitude and opposite in sign. Figure 11 can be used to evaluate support fixity of the control floor beam G5. Note in the figure that the strains at the ends of the floor beams are close to zero and not in compression. As such, there is apparently no end fixity. The reason the gages do not read zero strain is that they were not placed directly at the floor beam end. They were placed 21 inches inside from the through girder.
Floor Beam End RestraintPecent Fixity
Test 3Floor Beam G5
-10
0
10
20
30
40
50
60
70
80
90
0 50 100 150 200 250 300
Reading Number (5 Hz)
Mic
rost
rain
s
356 center306 side
Figure 11. Support fixity: control floor beam G5

21
Impact Factor The sixth test pass conducted was performed at higher speeds so that dynamic load effects could be determined. The impact factor is the ratio of the dynamic to static strains. This ratio shows if the strain sustained by the bridge is significantly increased due to dynamic loading. The analysis for impact factors can be found in the Tables A-1 and A-2 in the appendix for both the pre-test and post-test response. In the analysis the impact factors were found for both the through girders and the floor beams. The impact factors for the pre-test were lower than those found during the post-test. Pre-test impact factors were 8% and 5% for the through girder and floor beam respectively. While the post test were 19% and 16% respectively. This increase in impact is most likely due to the difference in speed the test trucks were traveling from the pre- to post-tests. Results have shown the speeds of the post tests were greater than those of the pre-test; as such this may have increased the impact to the bridge.
Load Distribution to Floor Beams
Figure 12 shows the distribution of strain due to the weight from the rear axle group to individual floor beams as the test truck travels across the bridge. Shown in this graph is the distribution for the three instrumented floor beams during Test 3. This distribution of strain was evaluated using only the rear axle group. To help to isolate the effect of the rear axle group, only the strain values collected after the peak strain value was reached were used for distribution calculations. The data was also shifted from a time-strain plot to a distance-strain plot. To accomplish this the speed at which the truck was traveling was determined and the time-scale was changed to distance (corresponding to the location of the rear axle group). This method of determining strain distribution was found to be reliable and not significantly influenced by the presence of the front axle weight because the axle spacing is more than 14 feet. At this spacing the results show that very little strain from the front axle is going to be distributed into the floor beam. This can be seen in the figure. Once a distance of 12 feet or two floor beams is surpassed, little strain is distributed into the instrumented floor beam.
From Figure 12, the percentage of the peak strain from the total strain due to the
rear axle group on individual floor beams was found to be on average 32%. Retrofitted floor beams G3 and G4 peaked at 74.3 µε and 81 µε respectively during Test 3 which consisted of a single truck crossing down the middle of the bridge. An idealized simply-supported model was used to find the maximum moment due to the center truck loading. This moment was converted to strain using Hooke’s Law and then scaled by 32%. This yielded 70 µε which is in close agreement with what the beam actually experienced. In general the rehabilitated floor beams G3 and G4 increased in stiffness and their load distributions were slightly higher than the control floor beam G5. Similar analyses

22
conducted for Tests 4 and 5 yielding similar results. The process used to calculate the load distribution can be found in the Appendix.
Ashland BridgeSingle Floor Beam Strain Distributions
Test 3; Single Trucks One-at-a-time Floor Beams G3 (CFRP), G4 (CFRP) & G5
74.3
54.6 54.6
24.8
4
24.8
0.6
8 8
24
81
59 59
24
2
28.828.8
7.9 7.9
90.0
68.468.4
0
10
20
30
40
50
60
70
80
90
100
0 6 12 18 24 30 36 42 48
Distance (ft.)
Mic
rost
rain
s
G3 CFRPG4 CFRPG5
Figure 12. Load distribution to single floor beams.
The distribution found for the post-test can be used to estimate the distribution for the pre-test. Using the un-rehabilitated floor beam G5 and scaling the truck weights a peak strain value comparison can be performed. A comparison for gage #356 (#292 in the pre-test) is shown in Table 5. Since the deck of Ashland Bridge was replaced, it is likely that that the new deck would distribute load more efficiently to the floor beams. This efficiency would lead to a lower distribution to each floor beam after rehabilitation because a better deck will spread out the loads rather than allowing it to be concentrated over a specific floor beam. This improvement would contribute to the reduction in strain experienced by the floor beams. The ratio of the pre- to post-test peak strain values can be used to find the distribution that would have been present on the old, non-composite deck. On average the strains from the pre-test were 26% greater than the strain found on the post test. This would lead one to believe that the load distribution factor for the pre-tests would also be 26% greater than the post test. This increase would be consistent with a 40% load distribution factor for the deteriorated concrete deck. Table 5 summarizes the evaluation for both the pre- and post-test.

23
Table 5. Estimation of pre-test load distribution.
Peak Strain Comparison Test 3 Test 4 Test 5 Pre 108.5 151.7 154.6 Post 90 118 119.5
Ratio Pre/Post 1.21 1.29 1.29 Average 1.26
Post Distribution Factor 32% Pre Distribution Factor (32% * 1.26) 40%
Effect of CFRP Plates - Change in Floor Beam Strain The expected change in strain due to the rehabilitation was found using simple mechanics of materials relationships and the concept of transformed sections. The sections were converted into equivalent steel sections. This analysis estimated a decrease in strain of 6% should have occurred. Shown in Figure 13 is the cross section of the floor beam-concrete deck-CFRP composite system. The dimensions indicated were used in the transformed section analysis. Properties for the analysis are included in the Table 6 and Figure 13 is shows the cross-section before transformation.
Table 6. Transformed Section Analysis Properties.
Before Transformation Steel Area (in2) 29.5Moment of Inertia (in4) 3,000
After Transformation Into steel
Neutral axis from bottom (in.) 22.96Moment of Inertia with out CFRP (in4) 8514Moment of Inertia with CFRP (in4) 9030n=Es/Ec 9Es (psi) 29,000,000ECFRP (psi) 16,000,000
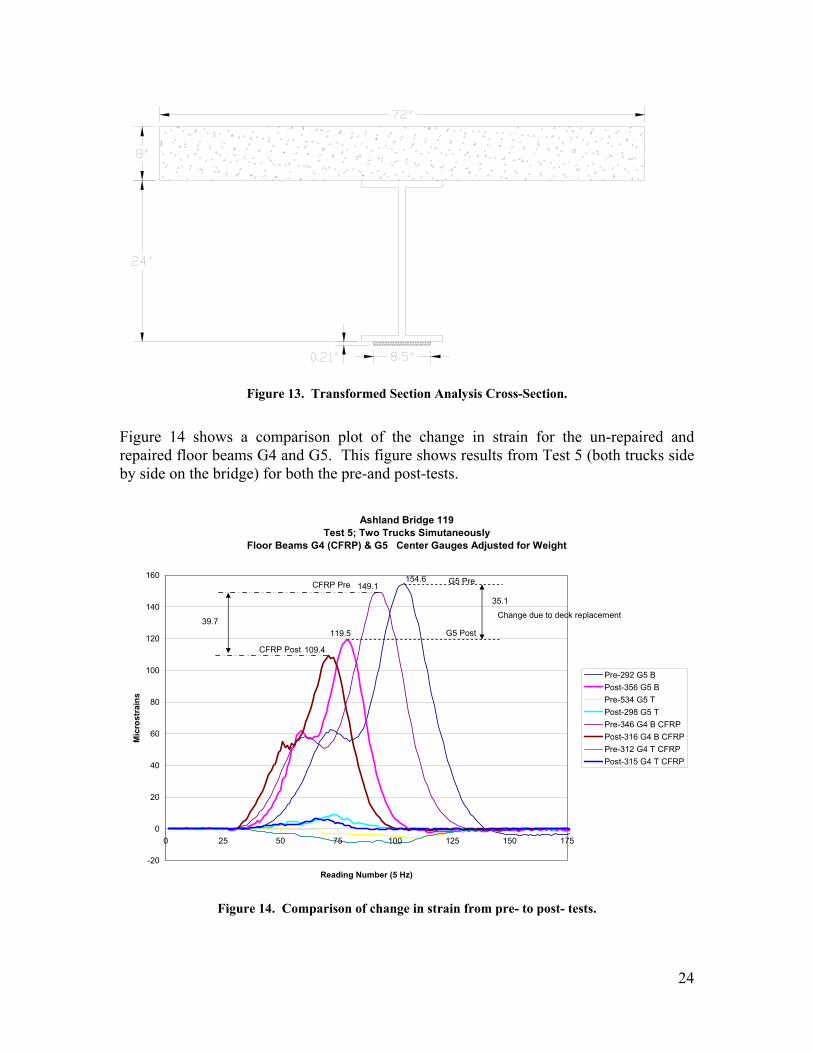
24
Figure 13. Transformed Section Analysis Cross-Section.
Figure 14 shows a comparison plot of the change in strain for the un-repaired and repaired floor beams G4 and G5. This figure shows results from Test 5 (both trucks side by side on the bridge) for both the pre-and post-tests.
Ashland Bridge 119 Test 5; Two Trucks Simutaneously
Floor Beams G4 (CFRP) & G5 Center Gauges Adjusted for Weight
154.6
119.5
149.1
109.4
-20
0
20
40
60
80
100
120
140
160
0 25 50 75 100 125 150 175
Reading Number (5 Hz)
Mic
rost
rain
s
Pre-292 G5 BPost-356 G5 BPre-534 G5 TPost-298 G5 TPre-346 G4 B CFRPPost-316 G4 B CFRPPre-312 G4 T CFRPPost-315 G4 T CFRP
CFRP Post
CFRP Pre
35.1
39.7
G5 Pre
G5 Post
Change due to deck replacement
Figure 14. Comparison of change in strain from pre- to post- tests.

25
This plot shows the post rehabilitation strain in retrofitted floor beam G4 decreased by 39.7 µε. However, this decrease is not solely due to the application of the CFRP plates. The control floor beam G5 also showed a decrease in strain (35.1 µε). This indicates that the new deck is contributing to the decrease in strain in the retrofitted floor beams. The contribution of the concrete deck to the decrease in strain for the retrofitted floor beam G4 was found using the ratio of peak values for the un-retrofitted beam as a scaling factor as shown below.
1.1496.1545.119 x=
µε2.115=x The variable x represents the estimated strain that would have occurred in floor
beam G4 had the CFRP plates not been applied. The change in strain of interest, that is due to the CFRP plate application was
found using the estimated peak strain accounting for the concrete deck replacement and the actual peak strain of the rehabilitated floor beam G4. This was found as follows:
%505.02.115
4.1092.115==
−=∆ε
The overall change in strain due to the CFRP plate application for the different
tests was found to be 5.5%. This was found by averaging the results for Tests 3, 4 and 5. This change may seem like a small reduction in strain because of the CFRP plates. However, the important result is that the value is consistent with the predicted 6% change found through analysis. The CFRP rehabilitation on the Ashland Bridge was a demonstration to determine how the plates would respond to factors which cannot be copied in a laboratory. While the improvements due to the CFRP plates are not large, this could be remedied by the application of thicker plates or plates bonded to both the top and bottom faces of the flange. The agreement of predicted and actual results suggests that retrofits can accurately be designed to meet the needed demand.
26
Summary: Conclusions & Recommendations
Conclusions
Comparison of diagnostic load test results both before and after rehabilitation of the Ashland Bridge show that the use of advanced composite materials were effective in causing a decrease in live load strain experienced by the rehabilitated floor beam. Floor beam strains decreased by 5.5% due to the CFRP plate application. A greater reduction was observed but this was due to the newly applied composite concrete deck. The tests confirmed that the bridge deck and floor beams are acting compositely.
A 32% distribution of strain to each floor beam was found. This distribution was based on the strains due to the rear axle group. This distribution was slightly higher for the floor beams rehabilitated with CFRP plates indicating an increase in stiffness due to the application. The distribution was confirmed using an ideal simply supported model.
Recommendations
In future rehabilitation using CFRP plates it would be recommended that the joint locations of the plates be looked at in more detail. It would be preferred that the staggered joints of the plate sections do not occur at the location of maximum moment as was the case in the Ashland Bridge. This location is not desirable because the plates may be vulnerable at this joint. It is a possibility that the large strains occurring at the maximum moment region would induce peeling of the plates. This peeling would then make the plates less effective thus comprising the integrity of the entire rehabilitation. While this has not had an impact on the Ashland Bridge it is an issue that needs to be studied in detail for future rehabilitations.
It is recommended for future work that, if possible, separate tests be performed between rehabilitation stages. One test after the concrete deck is placed, then another following the CFRP plate application. The separate tests would allow for a clear distinction of how the new concrete deck and CFRP plates are independently affecting the bridge behavior. Note that this was not possible in this case sine the plates were bonded before the new deck was applied. For future work it is recommended that more of the bridge length be instrumented with center floor beam gages so that data can be obtained from numerous floor beams as the truck is driving off bridge. Collection of this data will assess the floor beam response to only the rear axle group. Optimization of plate design and locations could also be looked at for future work. This optimization can be done in several ways. For cost purposes, possibly using fewer plates can be researched. Instead of the outside of the tension flange plates could be placed on the inside or both. It could be studied whether full flange width plates are

27
necessary or not. Another possible plate application arises for bridges with complex connections. For these, the locations of the maximum moment can be determined and examined to see if only those locations can be retrofitted. Design optimization is a task that, for large scale projects, could be very cost effective.
Summary Overall it was found the application of CFRP plates did increase the strength and stiffness of the retrofitted floor beams on Ashland Bridge and these results matched well with the estimated values found using the method of transformed sections. These findings will contribute to the ongoing research of the use of advanced composite materials for rehabilitation purposes. Future testing and monitoring of the Ashland Bridge should be continued as it would be very useful in understanding the long-term behavior of the advanced composite material.
Acknowledgments This material is based on work supported by the National Science Foundation under Grand No. EEC-0139017, “Research Experiences for Undergraduates in Bridge Engineering,” at the University of Delaware. I would also like to acknowledge all those who helped make this paper possible. My advisor, Dr. Chajes, thank you for allowing me to work on this project and for all of your help and patience during this summer. This research has proven to be an invaluable experience and your expertise more so. Diane, thank you for keeping our summer organized and on time. Gary Wenzel and Danny Richardson, thank you for all of your hard work and time during bridge testing and for always helping out whenever I had a question. And of course, my fellow REU research students for all of your work with my bridge testing and for keeping every minute during this experience fun, interesting and exciting.

28
References Chajes, M., and Swinehart, M. (2002). “Bridge rehabilitation using advanced composites Ashland Bridge SR-82 over Red clay Creek.” Center for Innovative Bridge Engineering. University of Delaware, Newark, Delaware. Federal Highway Administration (FHWA). (2002). “Tables of frequently asked NBI information.” <http://www.fhwa.dot.gov/bridge/britab.html> Washington, D.C. Liu, X., Silva, P., and Nanni, A. (2001). “Rehabilitation of Steel Bridge members with FRP Composite Materials.” Proc., CCC 2001, Composites in Construction, Porto, Portugal, Oct. 10-12, 2001, J. Figueiras, L. Juvandes and R. Furia, Eds., pp. 613-617 Mertz, D. R., and Gillespie, J. W., Jr. (1996). NCHRP-IDEA final report Rehabilitation of steel bridge girders through the application of advanced composite materials (Contract No. NCHRP-93-ID011), Transportation Research Board, Washington, D.C. Miller, T. C. (2000). “The rehabilitation of steel bridge girders using advanced composite materials.” Master’s thesis. University of Delaware, Newark, Delaware. West, T. (2001). “Enhancements to the bond between advanced composite materials and steel for bridge rehabilitation.” Master’s thesis. University of Delaware, Newark, Delaware.

29
Appendix
Load Distribution Calculation
• The actual velocity of the truck was found for each test pass in three ways for Tests 3, 4, and 5:
o Using the time required for the truck to cross the bridge knowing the length of the bridge and axle spacing of the test trucks. Done for a floor beam and a through girder.
o Using the peak strains knowing the axle spacing of the test trucks. • The velocities were checked for consistency and averaged for the
test run.
• The strains for Tests 3, 4, and 5 were plotted versus time for gages at mid-span on the bottom flange.
• The time scale for each tests was shifted so that time zero occurred at the peak strain.
• The strains occurring after the peak strain were isolated; this isolated the strains occurring from the real axle group.
• These strains were mirrored across the zero time axis. • The time scale was then converted to distance beginning from the zero time axis.
The zero time axis was changed to the distance across the bridge to the specific floor beam that the gage was mounted to.
• This yielded distributions similar to that of Figure 12 for the three test passes. • The load distribution to each floor beam was found by taking the percent of the
peak strain to the total strain of the curve occurring at each floor beam.
• The result was confirmed by comparison to a simply supported model where the maximum moment was found and converted to strain and scaled by the load distribution found from the plot.
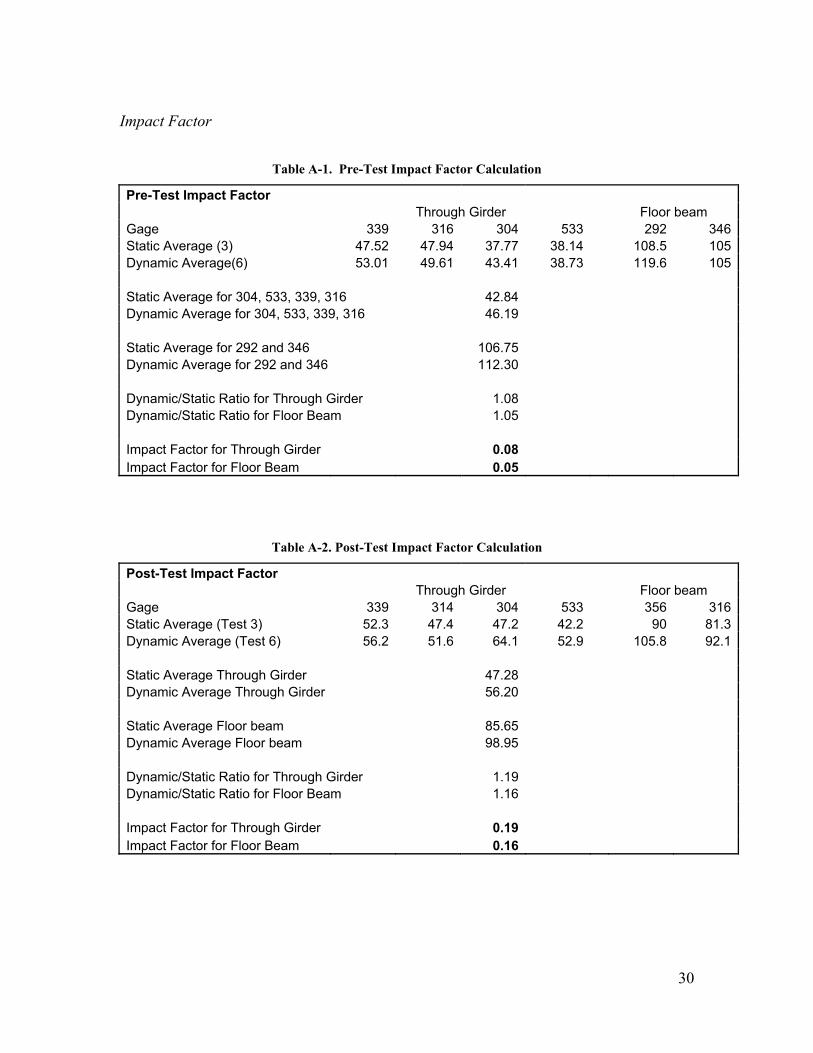
30
Impact Factor
Table A-1. Pre-Test Impact Factor Calculation
Pre-Test Impact Factor Through Girder Floor beam Gage 339 316 304 533 292 346Static Average (3) 47.52 47.94 37.77 38.14 108.5 105Dynamic Average(6) 53.01 49.61 43.41 38.73 119.6 105 Static Average for 304, 533, 339, 316 42.84 Dynamic Average for 304, 533, 339, 316 46.19 Static Average for 292 and 346 106.75 Dynamic Average for 292 and 346 112.30 Dynamic/Static Ratio for Through Girder 1.08 Dynamic/Static Ratio for Floor Beam 1.05 Impact Factor for Through Girder 0.08 Impact Factor for Floor Beam 0.05
Table A-2. Post-Test Impact Factor Calculation
Post-Test Impact Factor Through Girder Floor beam Gage 339 314 304 533 356 316Static Average (Test 3) 52.3 47.4 47.2 42.2 90 81.3Dynamic Average (Test 6) 56.2 51.6 64.1 52.9 105.8 92.1 Static Average Through Girder 47.28 Dynamic Average Through Girder 56.20 Static Average Floor beam 85.65 Dynamic Average Floor beam 98.95 Dynamic/Static Ratio for Through Girder 1.19 Dynamic/Static Ratio for Floor Beam 1.16 Impact Factor for Through Girder 0.19 Impact Factor for Floor Beam 0.16
Delaware Center for Transportation
University of Delaware Newark, Delaware 19716
AN EQUAL OPPORTUNITY/AFFIRMATIVE ACTION EMPLOYERThe University of Delaware is committed to assuring equal opportunity to all persons and does not discriminate on the basis of race, color, gender, religion, ancestry, national origin, sexual orientation, veteran statutes, age, or disability in its educational programs, activities, admissions, or employment practices as required by the Title IX of the Education Amendments of 1972, Title VI of the Civil Rights Act of 1964, the Rehabilitation Act of 1973, the Americans with Disabilities Act, other applicable statutes and University policy. Inquiries concerning these statutes and information regarding campus accessibility should be referred to the Affirmative Action Officer, 305 Hullihen Hall, (302) 831-2835 (voice), (302) 831-4563 (TTD)