applications icp-ms trace elemental analysis hydrocarbon ... · hydrocarbon processing industry...
TRANSCRIPT

Applications of ICP-MS for
Trace Elemental Analysis in the
Hydrocarbon Processing Industry
Fundamentals and Applications to the Petrochemical Industry
Outline
• Some background and fundamentals of ICPMS
• Proposed ICPMS method for ASTM• Preliminary Results for D7111-11 • Preliminary Results for D5185-09
• Advantages of ICP-MS
• Summary
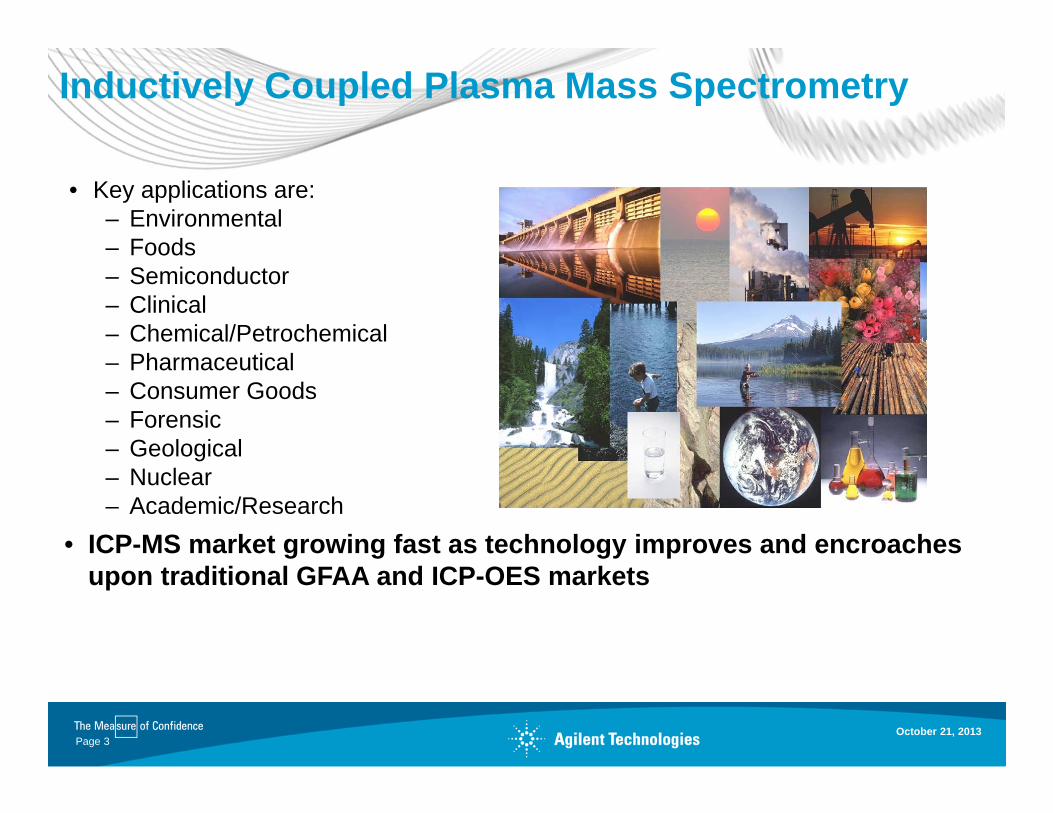
Inductively Coupled Plasma Mass Spectrometry
• Key applications are:– Environmental– Foods– Semiconductor– Clinical– Chemical/Petrochemical– Pharmaceutical– Consumer Goods– Forensic– Geological– Nuclear– Academic/Research
• ICP-MS market growing fast as technology improves and encroaches upon traditional GFAA and ICP-OES markets
October 21, 2013Page 3
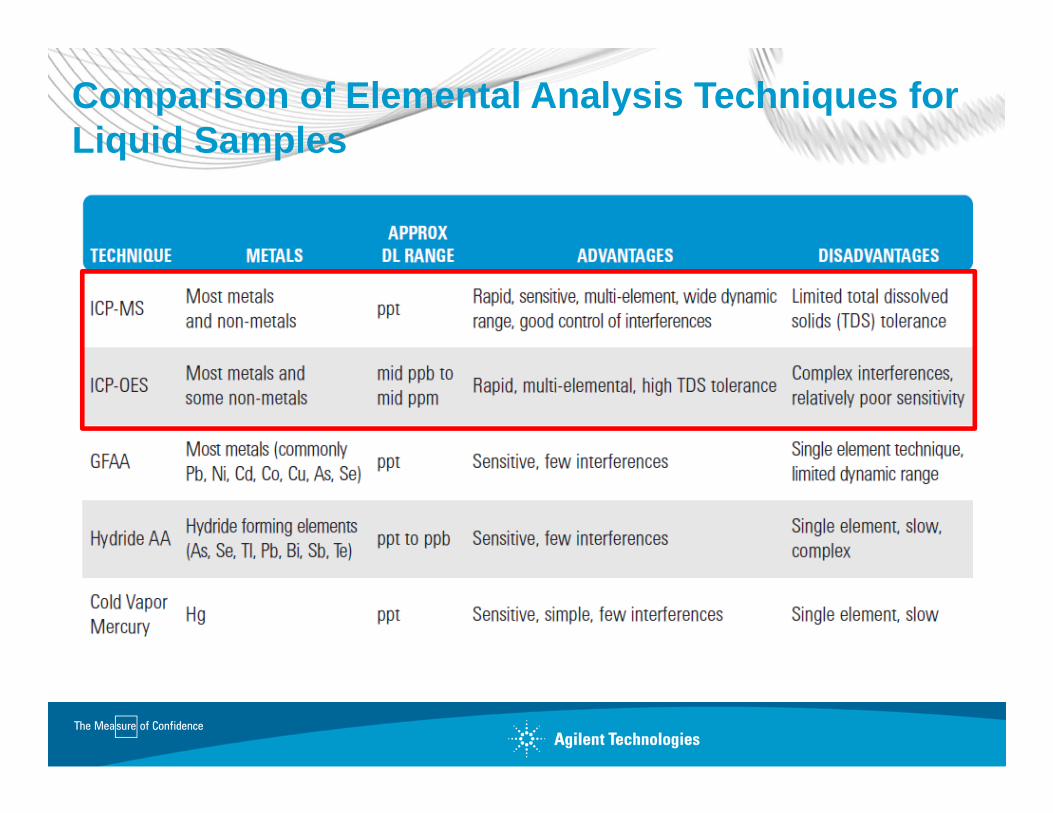
Comparison of Elemental Analysis Techniques for Liquid Samples
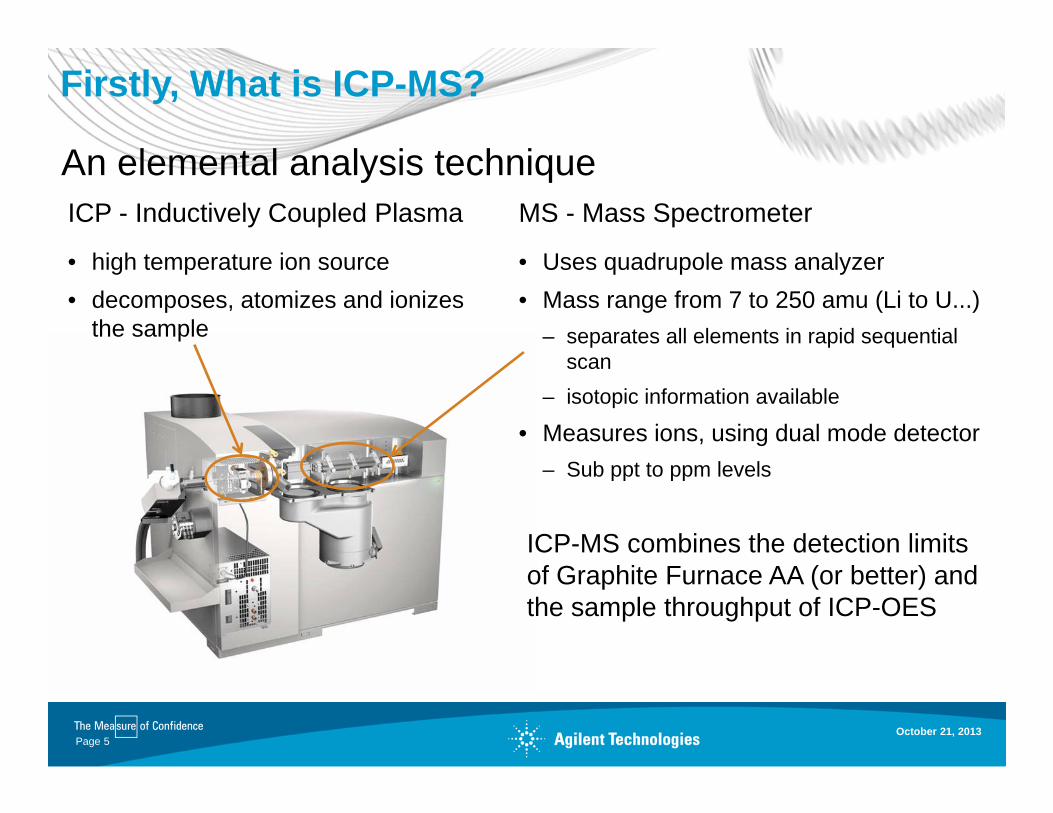
Firstly, What is ICP-MS?
ICP - Inductively Coupled Plasma
• high temperature ion source• decomposes, atomizes and ionizes
the sample
MS - Mass Spectrometer
• Uses quadrupole mass analyzer• Mass range from 7 to 250 amu (Li to U...)
– separates all elements in rapid sequential scan
– isotopic information available
• Measures ions, using dual mode detector– Sub ppt to ppm levels
An elemental analysis technique
ICP-MS combines the detection limits of Graphite Furnace AA (or better) and the sample throughput of ICP-OES
October 21, 2013Page 5
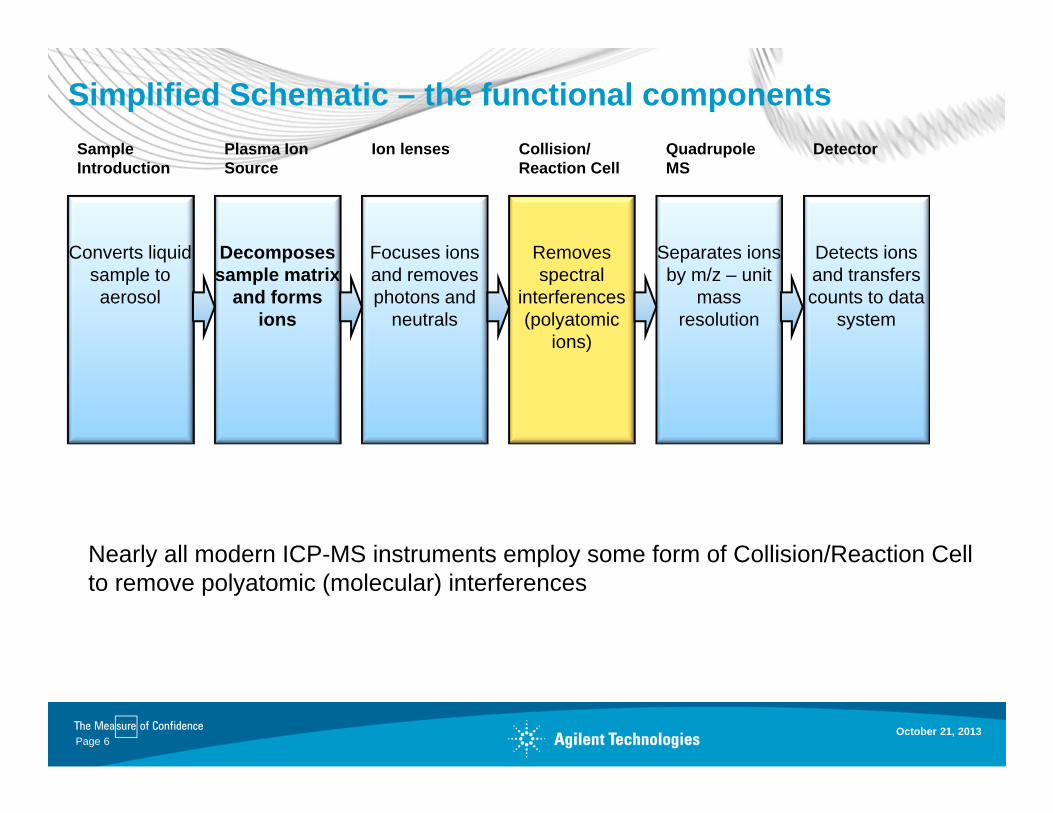
Simplified Schematic – the functional components
Converts liquid sample to aerosol
Decomposes sample matrix
and forms ions
Focuses ions and removes photons and
neutrals
Removes spectral
interferences (polyatomic
ions)
Separates ions by m/z – unit
mass resolution
Detects ions and transfers counts to data
system
Sample Introduction
Plasma Ion Source
Ion lenses Collision/ Reaction Cell
Quadrupole MS
Detector
October 21, 2013Page 6
Nearly all modern ICP-MS instruments employ some form of Collision/Reaction Cell to remove polyatomic (molecular) interferences
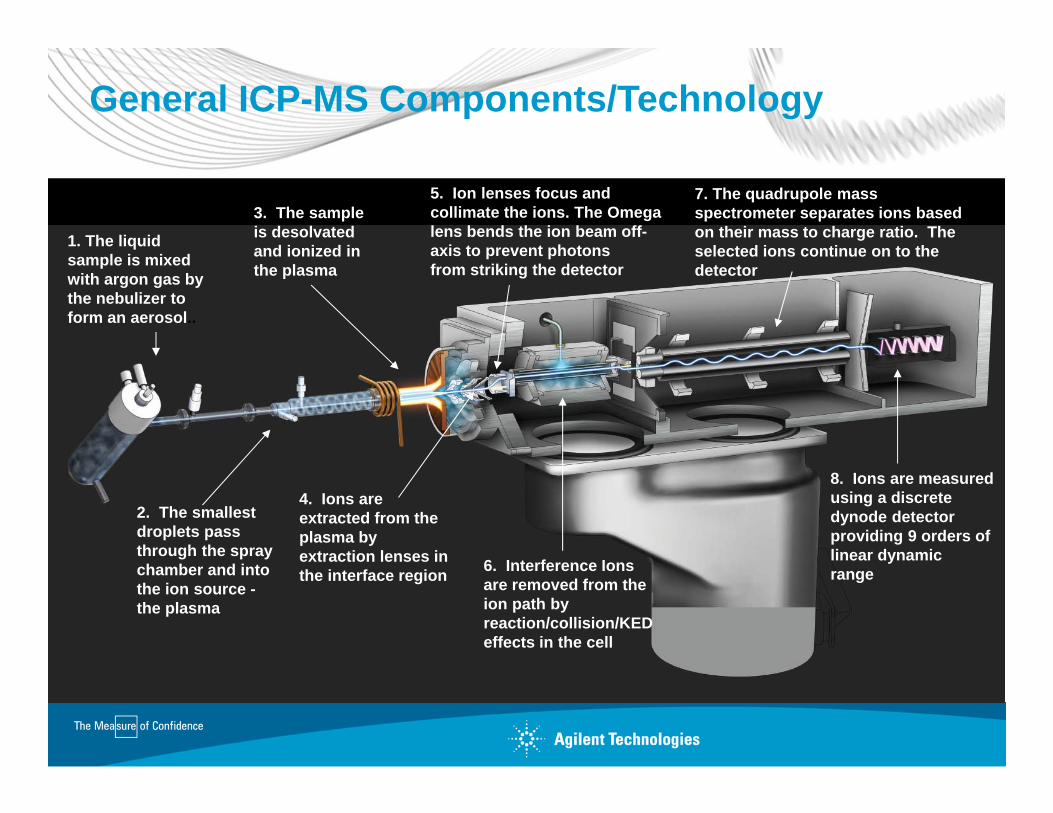
General ICP-MS Components/Technology
1. The liquid sample is mixed with argon gas by the nebulizer to form an aerosol..
2. The smallest droplets pass through the spray chamber and into the ion source -the plasma
3. The sample is desolvatedand ionized in the plasma
4. Ions are extracted from the plasma by extraction lenses inthe interface region
5. Ion lenses focus and collimate the ions. The Omega lens bends the ion beam off-axis to prevent photonsfrom striking the detector
7. The quadrupole mass spectrometer separates ions based on their mass to charge ratio. The selected ions continue on to the detector
8. Ions are measuredusing a discrete dynode detector providing 9 orders of linear dynamicrange6. Interference Ions
are removed from the ion path by reaction/collision/KED effects in the cell
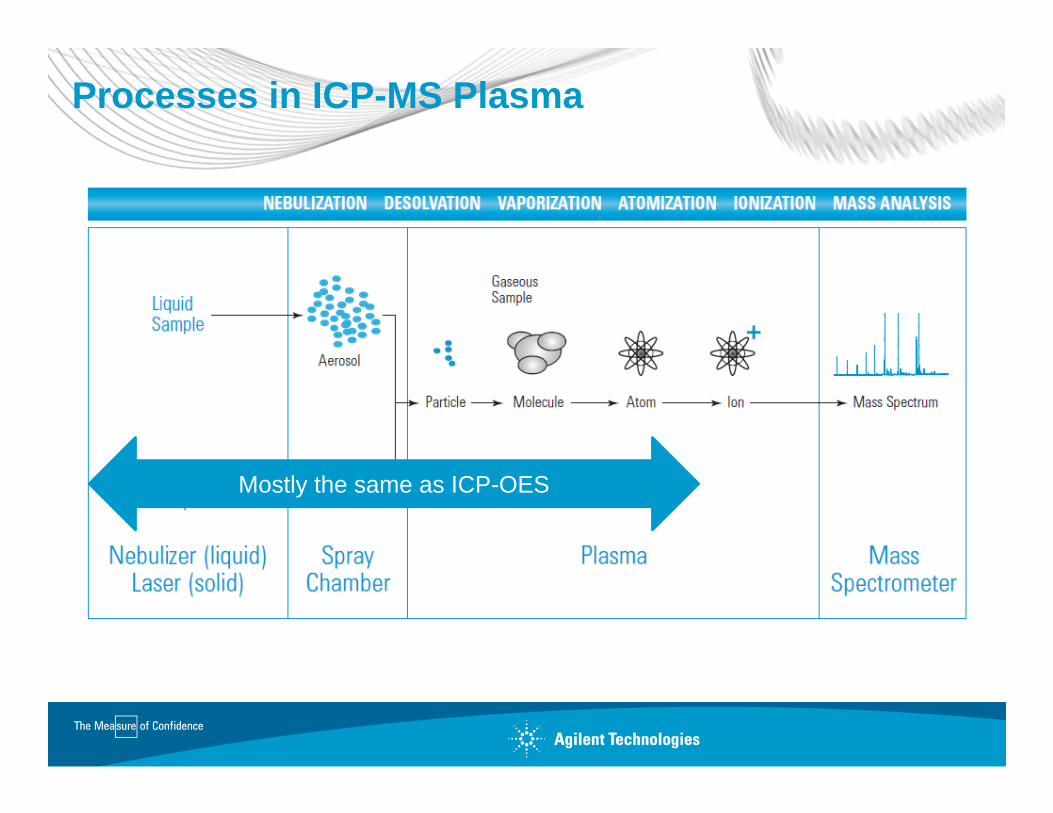
Processes in ICP-MS Plasma
Mostly the same as ICP-OES
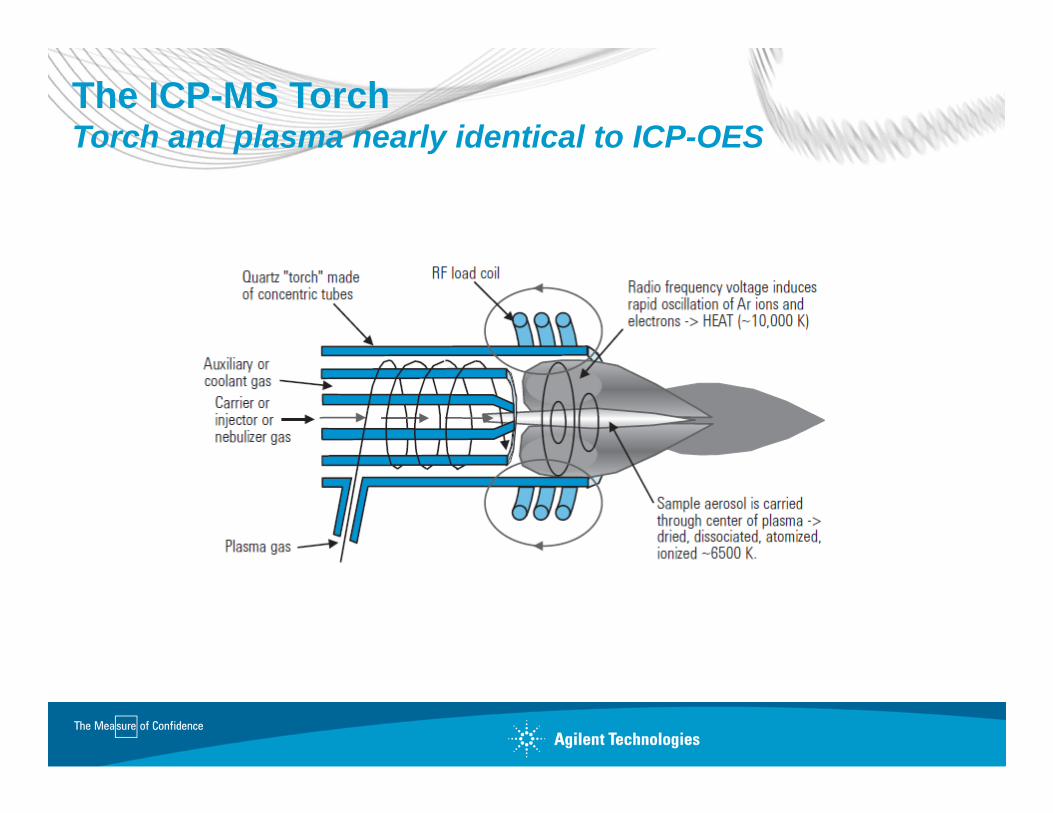
The ICP-MS TorchTorch and plasma nearly identical to ICP-OES
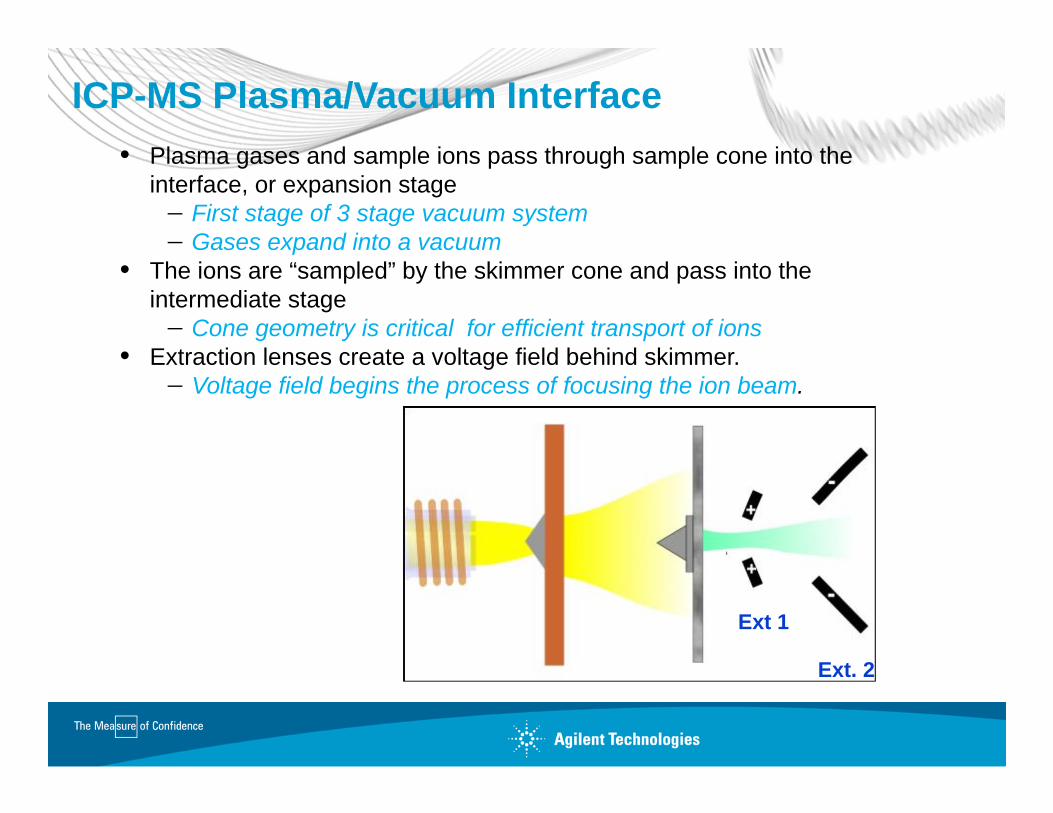
ICP-MS Plasma/Vacuum Interface• Plasma gases and sample ions pass through sample cone into the
interface, or expansion stage First stage of 3 stage vacuum system Gases expand into a vacuum
• The ions are “sampled” by the skimmer cone and pass into the intermediate stage Cone geometry is critical for efficient transport of ions
• Extraction lenses create a voltage field behind skimmer. Voltage field begins the process of focusing the ion beam.
Ext. 2
Ext 1
Energy Energy
CellEntrance
CellExit
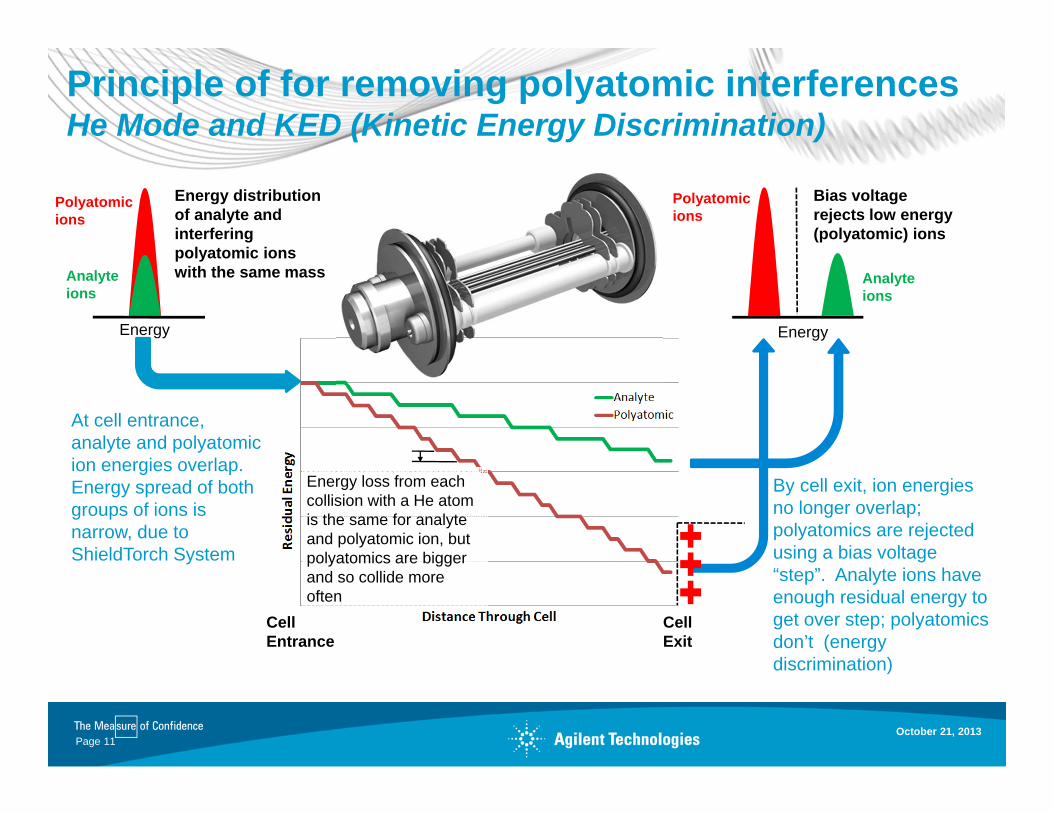
Energy loss from each collision with a He atom is the same for analyte and polyatomic ion, but polyatomics are bigger and so collide more often
At cell entrance, analyte and polyatomic ion energies overlap. Energy spread of both groups of ions is narrow, due to ShieldTorch System
Polyatomic ions
Analyteions
Polyatomic ions
Analyteions
Energy distribution of analyte and interfering polyatomic ions with the same mass
Bias voltage rejects low energy (polyatomic) ions
By cell exit, ion energies no longer overlap; polyatomics are rejected using a bias voltage “step”. Analyte ions have enough residual energy to get over step; polyatomics don’t (energy discrimination)
Principle of for removing polyatomic interferencesHe Mode and KED (Kinetic Energy Discrimination)
October 21, 2013Page 11
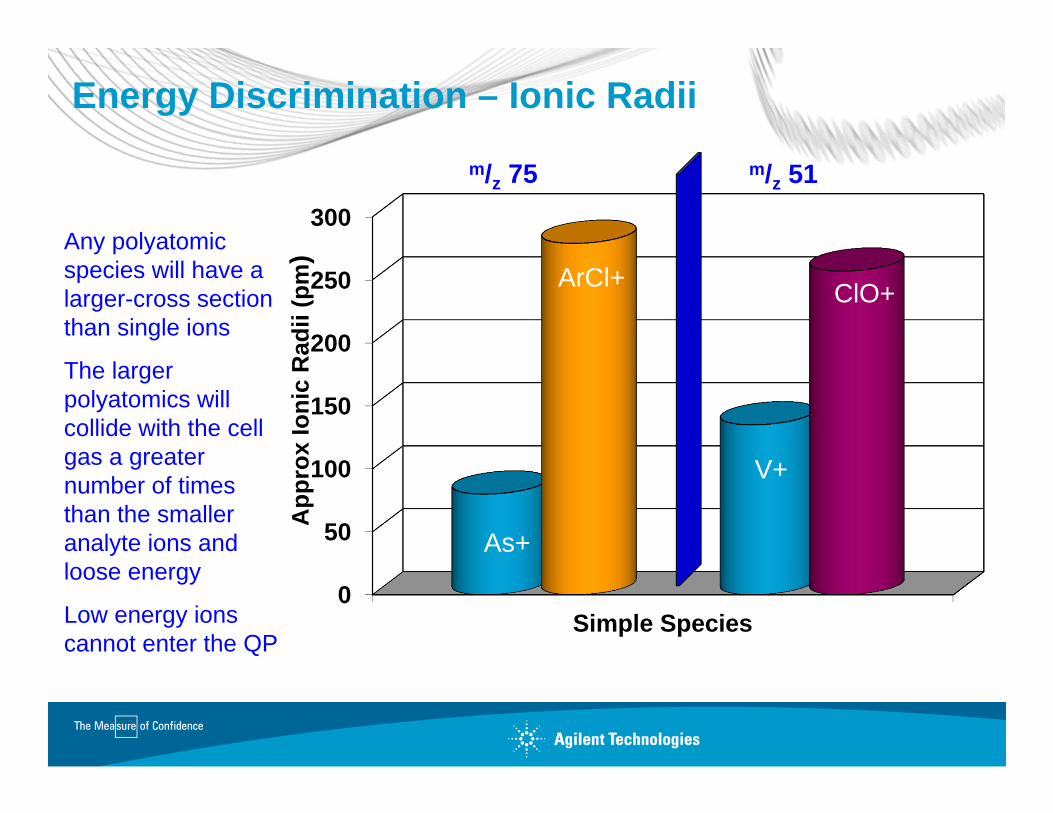
Energy Discrimination – Ionic Radii
0
50
100
150
200
250
300
Simple Species
As+
ArCl+
V+
ClO+A
ppro
xIo
nic
Rad
ii (p
m)Any polyatomic
species will have a larger-cross section than single ions
The larger polyatomics will collide with the cell gas a greater number of times than the smaller analyte ions and loose energy
Low energy ions cannot enter the QP
m/z 75 m/z 51
0
50
100
150
200
250
300
350
400
Complex Species
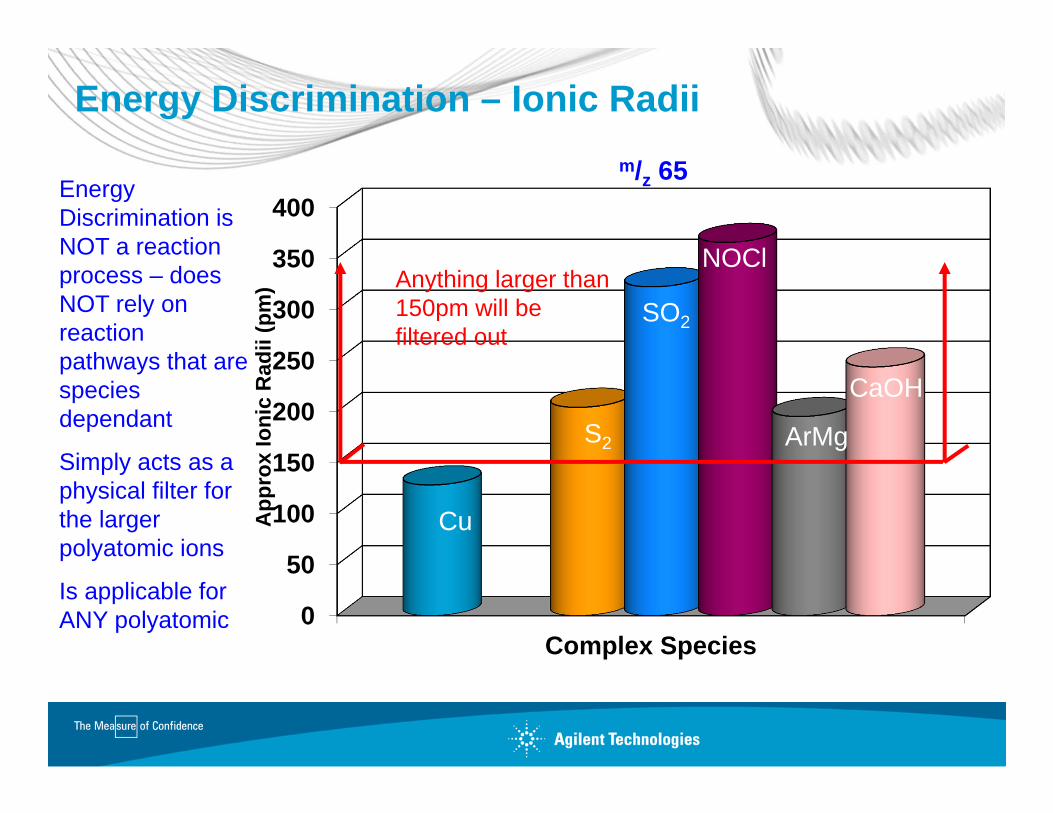
Energy Discrimination – Ionic Radii
Cu
S2
SO2
NOCl
ArMg
CaOH
App
rox
Ioni
c R
adii
(pm
)
Energy Discrimination is NOT a reaction process – does NOT rely on reaction pathways that are species dependant
Simply acts as a physical filter for the larger polyatomic ions
Is applicable for ANY polyatomic
m/z 65
Anything larger than 150pm will be filtered out
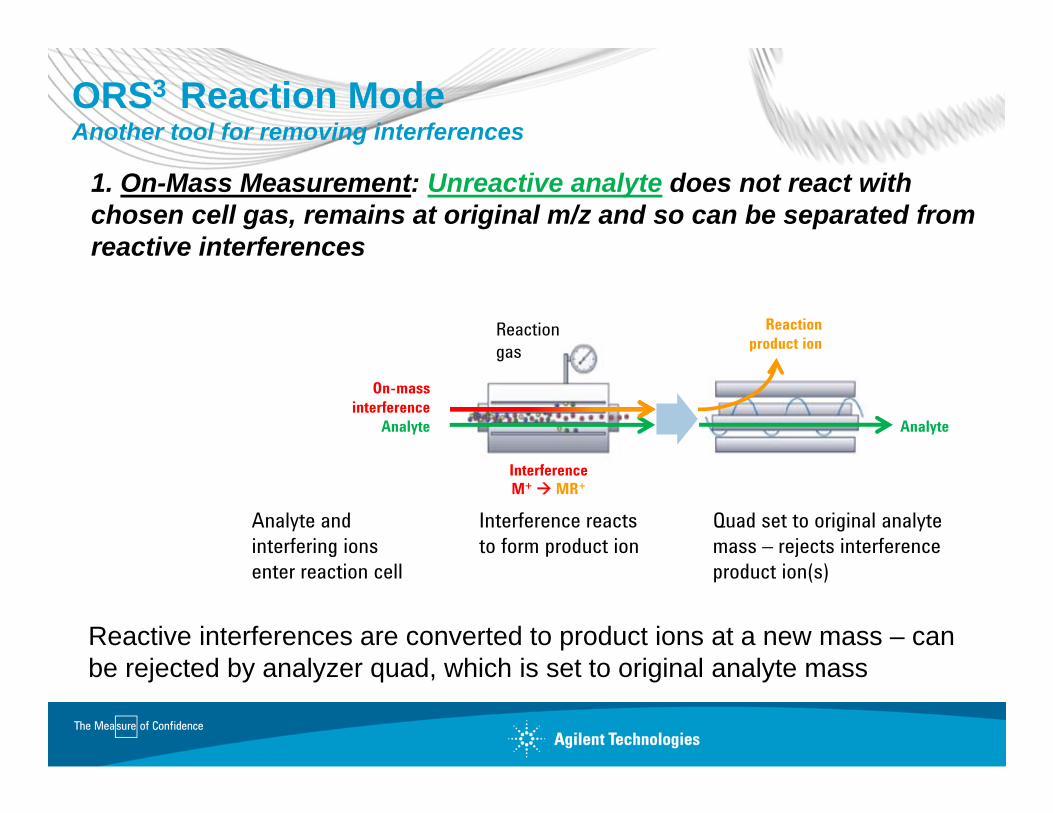
1. On-Mass Measurement: Unreactive analyte does not react with chosen cell gas, remains at original m/z and so can be separated from reactive interferences
Reactive interferences are converted to product ions at a new mass – can be rejected by analyzer quad, which is set to original analyte mass
ORS3 Reaction ModeAnother tool for removing interferences
Reaction product ion
On-mass interference
Analyte
Reaction gas
Interference M+MR+
Analyte and interfering ions enter reaction cell
Quad set to original analyte mass – rejects interference product ion(s)
Analyte
Interference reacts to form product ion
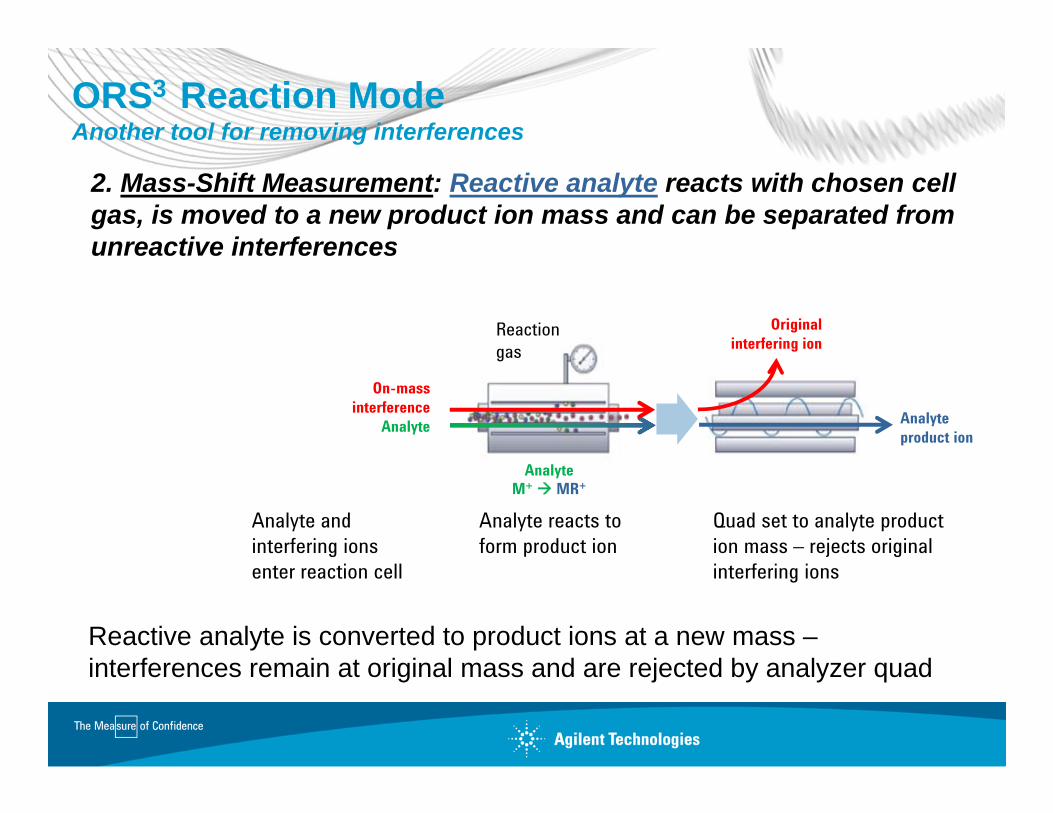
2. Mass-Shift Measurement: Reactive analyte reacts with chosen cell gas, is moved to a new product ion mass and can be separated from unreactive interferences
Reactive analyte is converted to product ions at a new mass –interferences remain at original mass and are rejected by analyzer quad
ORS3 Reaction ModeAnother tool for removing interferences
Original interfering ion
On-mass interference
Analyte
Reaction gas
Analyte M+MR+
Analyte and interfering ions enter reaction cell
Quad set to analyte product ion mass – rejects original interfering ions
Analyte product ion
Analyte reacts to form product ion
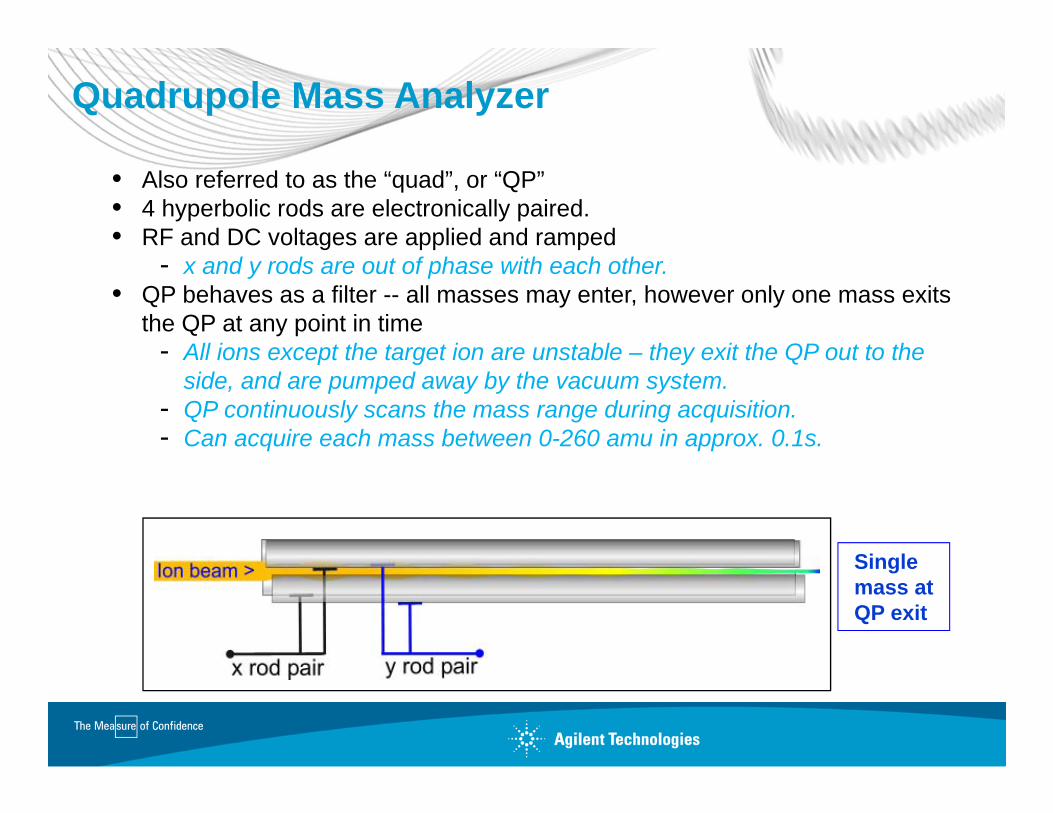
Quadrupole Mass Analyzer
• Also referred to as the “quad”, or “QP”• 4 hyperbolic rods are electronically paired.• RF and DC voltages are applied and ramped
- x and y rods are out of phase with each other.• QP behaves as a filter -- all masses may enter, however only one mass exits
the QP at any point in time- All ions except the target ion are unstable – they exit the QP out to the
side, and are pumped away by the vacuum system.- QP continuously scans the mass range during acquisition.- Can acquire each mass between 0-260 amu in approx. 0.1s.
Single mass at QP exit
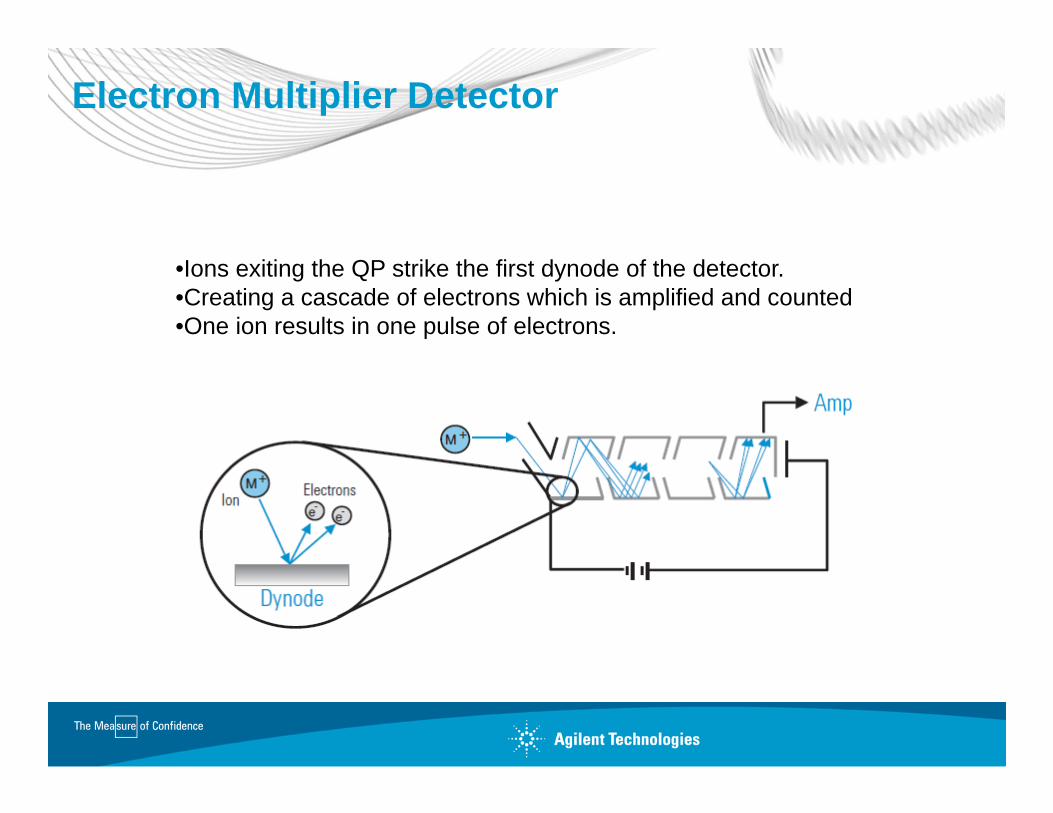
Electron Multiplier Detector
•Ions exiting the QP strike the first dynode of the detector.•Creating a cascade of electrons which is amplified and counted•One ion results in one pulse of electrons.
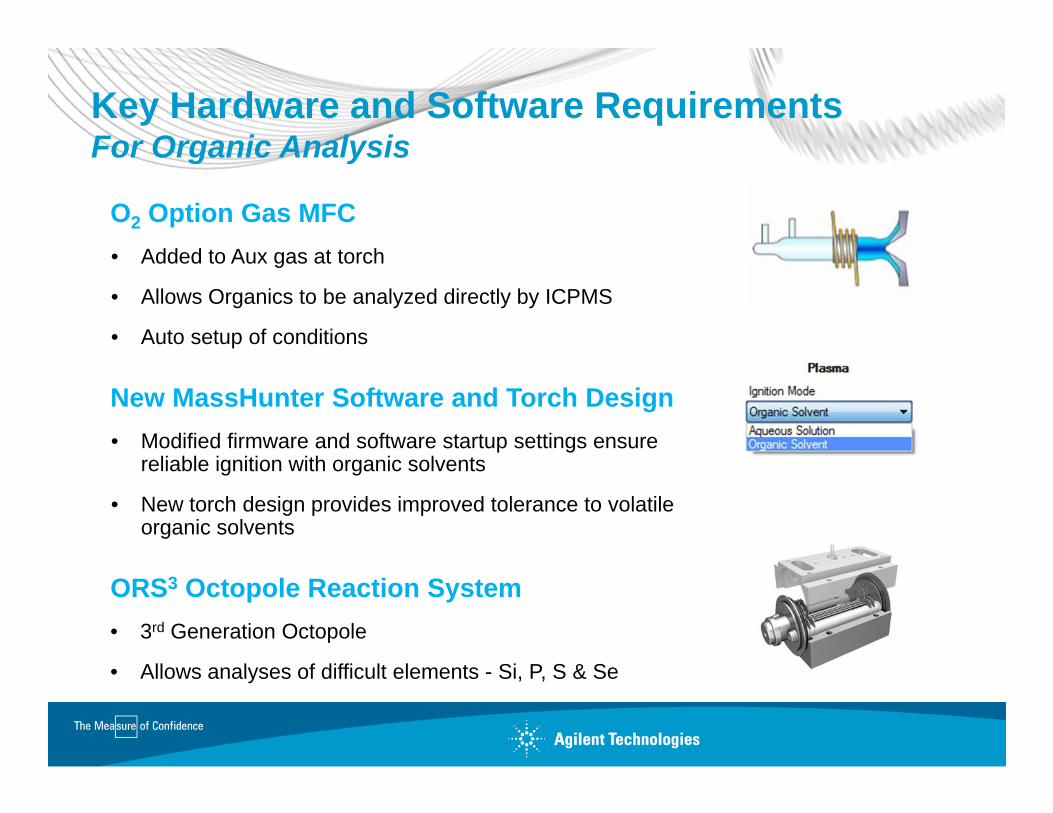
Key Hardware and Software RequirementsFor Organic Analysis
O2 Option Gas MFC • Added to Aux gas at torch
• Allows Organics to be analyzed directly by ICPMS
• Auto setup of conditions
New MassHunter Software and Torch Design • Modified firmware and software startup settings ensure
reliable ignition with organic solvents
• New torch design provides improved tolerance to volatile organic solvents
ORS3 Octopole Reaction System• 3rd Generation Octopole
• Allows analyses of difficult elements - Si, P, S & Se
Preliminary Results D7111-11
Determination of Trace Elements in Middle Distillate Fuels(Modified for ICP-MS)
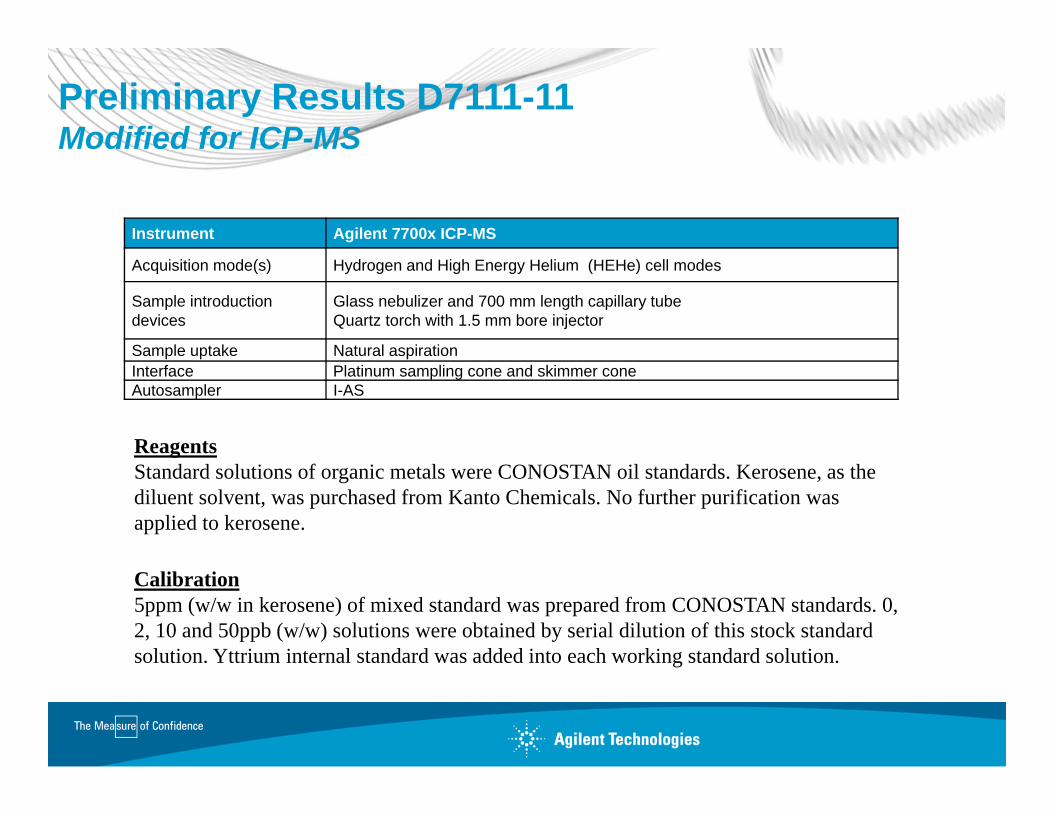
Preliminary Results D7111-11Modified for ICP-MS
Instrument Agilent 7700x ICP-MS
Acquisition mode(s) Hydrogen and High Energy Helium (HEHe) cell modes
Sample introduction devices
Glass nebulizer and 700 mm length capillary tubeQuartz torch with 1.5 mm bore injector
Sample uptake Natural aspirationInterface Platinum sampling cone and skimmer coneAutosampler I-AS
ReagentsStandard solutions of organic metals were CONOSTAN oil standards. Kerosene, as the diluent solvent, was purchased from Kanto Chemicals. No further purification was applied to kerosene.
Calibration5ppm (w/w in kerosene) of mixed standard was prepared from CONOSTAN standards. 0, 2, 10 and 50ppb (w/w) solutions were obtained by serial dilution of this stock standard solution. Yttrium internal standard was added into each working standard solution.
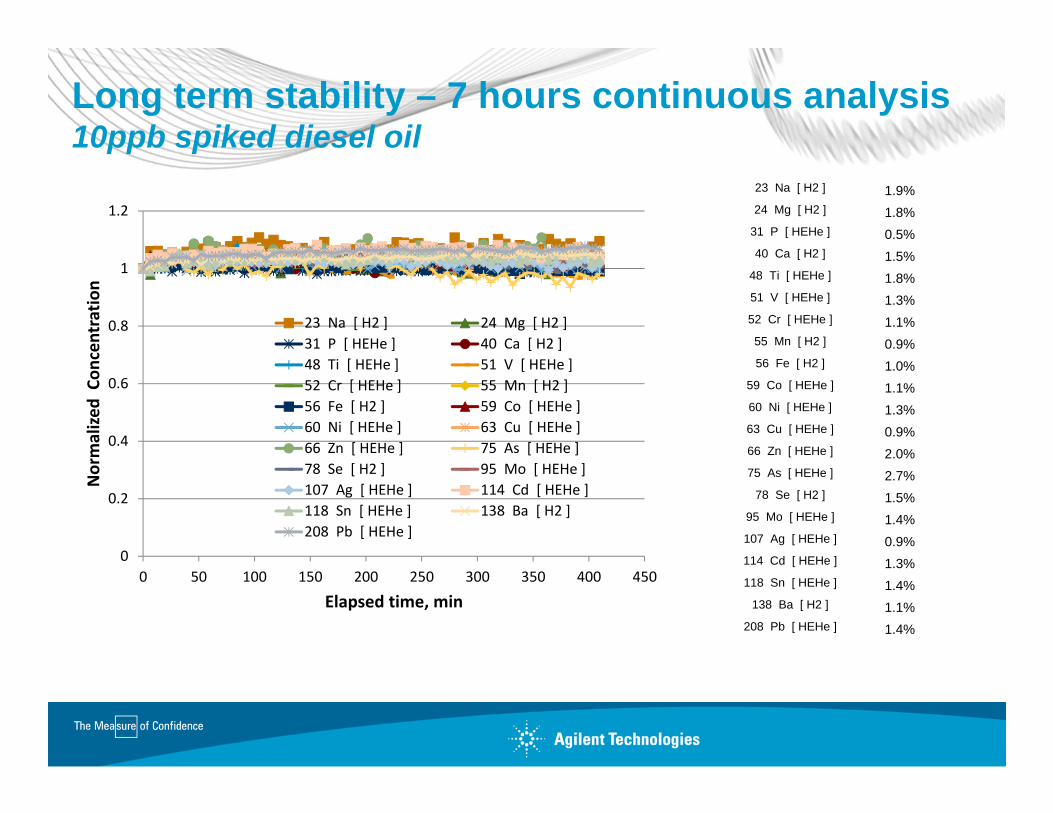
Long term stability – 7 hours continuous analysis10ppb spiked diesel oil
0
0.2
0.4
0.6
0.8
1
1.2
0 50 100 150 200 250 300 350 400 450
Normalized
Con
centratio
n
Elapsed time, min
23 Na [ H2 ] 24 Mg [ H2 ]31 P [ HEHe ] 40 Ca [ H2 ]48 Ti [ HEHe ] 51 V [ HEHe ]52 Cr [ HEHe ] 55 Mn [ H2 ]56 Fe [ H2 ] 59 Co [ HEHe ]60 Ni [ HEHe ] 63 Cu [ HEHe ]66 Zn [ HEHe ] 75 As [ HEHe ]78 Se [ H2 ] 95 Mo [ HEHe ]107 Ag [ HEHe ] 114 Cd [ HEHe ]118 Sn [ HEHe ] 138 Ba [ H2 ]208 Pb [ HEHe ]
23 Na [ H2 ] 1.9%24 Mg [ H2 ] 1.8%
31 P [ HEHe ] 0.5%40 Ca [ H2 ] 1.5%
48 Ti [ HEHe ] 1.8%51 V [ HEHe ] 1.3%52 Cr [ HEHe ] 1.1%55 Mn [ H2 ] 0.9%56 Fe [ H2 ] 1.0%
59 Co [ HEHe ] 1.1%60 Ni [ HEHe ] 1.3%63 Cu [ HEHe ] 0.9%66 Zn [ HEHe ] 2.0%75 As [ HEHe ] 2.7%
78 Se [ H2 ] 1.5%95 Mo [ HEHe ] 1.4%107 Ag [ HEHe ] 0.9%114 Cd [ HEHe ] 1.3%118 Sn [ HEHe ] 1.4%
138 Ba [ H2 ] 1.1%208 Pb [ HEHe ] 1.4%
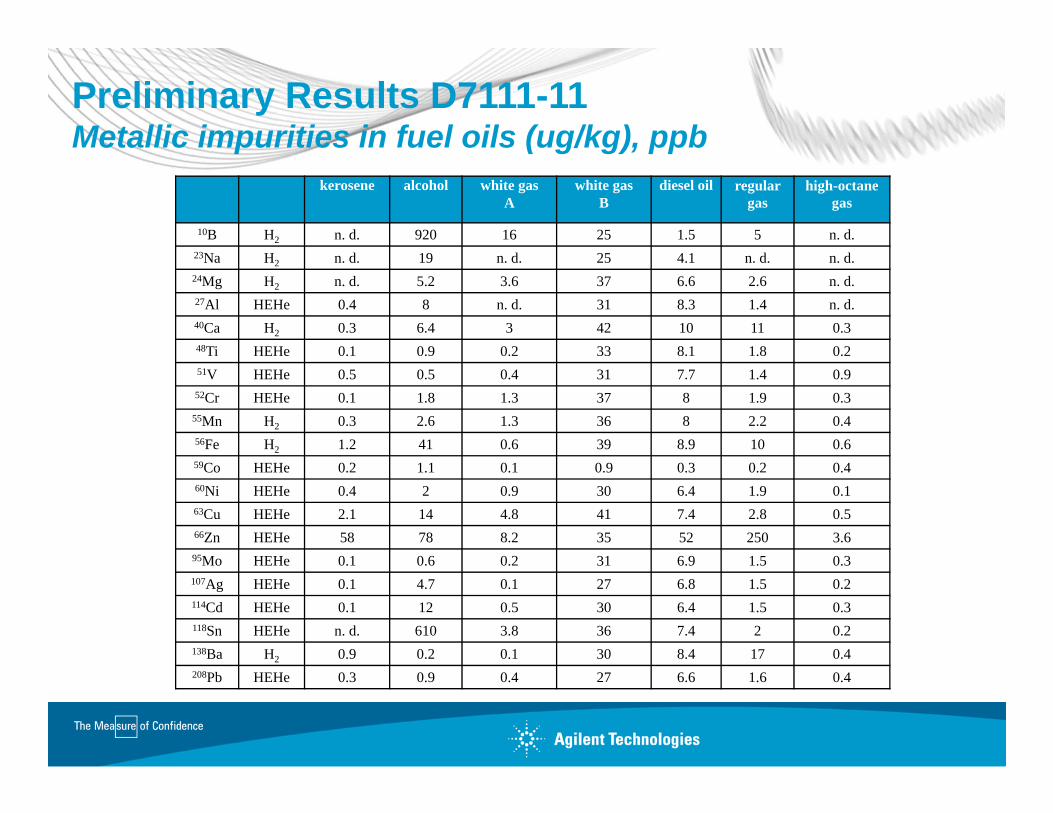
Preliminary Results D7111-11Metallic impurities in fuel oils (ug/kg), ppb
kerosene alcohol white gasA
white gasB
diesel oil regular gas
high-octane gas
10B H2 n. d. 920 16 25 1.5 5 n. d.23Na H2 n. d. 19 n. d. 25 4.1 n. d. n. d.24Mg H2 n. d. 5.2 3.6 37 6.6 2.6 n. d.27Al HEHe 0.4 8 n. d. 31 8.3 1.4 n. d.40Ca H2 0.3 6.4 3 42 10 11 0.348Ti HEHe 0.1 0.9 0.2 33 8.1 1.8 0.251V HEHe 0.5 0.5 0.4 31 7.7 1.4 0.952Cr HEHe 0.1 1.8 1.3 37 8 1.9 0.3
55Mn H2 0.3 2.6 1.3 36 8 2.2 0.456Fe H2 1.2 41 0.6 39 8.9 10 0.659Co HEHe 0.2 1.1 0.1 0.9 0.3 0.2 0.460Ni HEHe 0.4 2 0.9 30 6.4 1.9 0.163Cu HEHe 2.1 14 4.8 41 7.4 2.8 0.566Zn HEHe 58 78 8.2 35 52 250 3.695Mo HEHe 0.1 0.6 0.2 31 6.9 1.5 0.3107Ag HEHe 0.1 4.7 0.1 27 6.8 1.5 0.2114Cd HEHe 0.1 12 0.5 30 6.4 1.5 0.3118Sn HEHe n. d. 610 3.8 36 7.4 2 0.2138Ba H2 0.9 0.2 0.1 30 8.4 17 0.4208Pb HEHe 0.3 0.9 0.4 27 6.6 1.6 0.4

Recovery of Certified Elements in NIST-1634C Residual fuel oil
Element Reference mg/kg Result mg/kg Recovery
Na 37 37.7 102%
V 28.19 +‐ 0.40 28.0 99%
Co 0.1510 +‐ 0.0051 0.147 97%
Ni 17.54 +‐ 0.21 17.2 98%
As 0.1426 +‐ 0.0064 0.148 104%
Se 0.1020 +‐ 0.0038 0.102 100%
Ba 1.8 1.87 104%
Preliminary Results – D5185-09
Determination of Additive Elements, Wear Metals, and Contaminants in
Used Lubricating Oils and Determination of Selected Elements
in Base Oils(Modified for ICP-MS)
Preliminary results – D5185-09 Modified for ICP-MS
• Essentially same methodology, instrument conditions, calibration, and sample prep were used as for D7111-11
• Samples were diluted into either Kerosene or O-Xylene
• Lubricating oils were purchased from various sources on common market
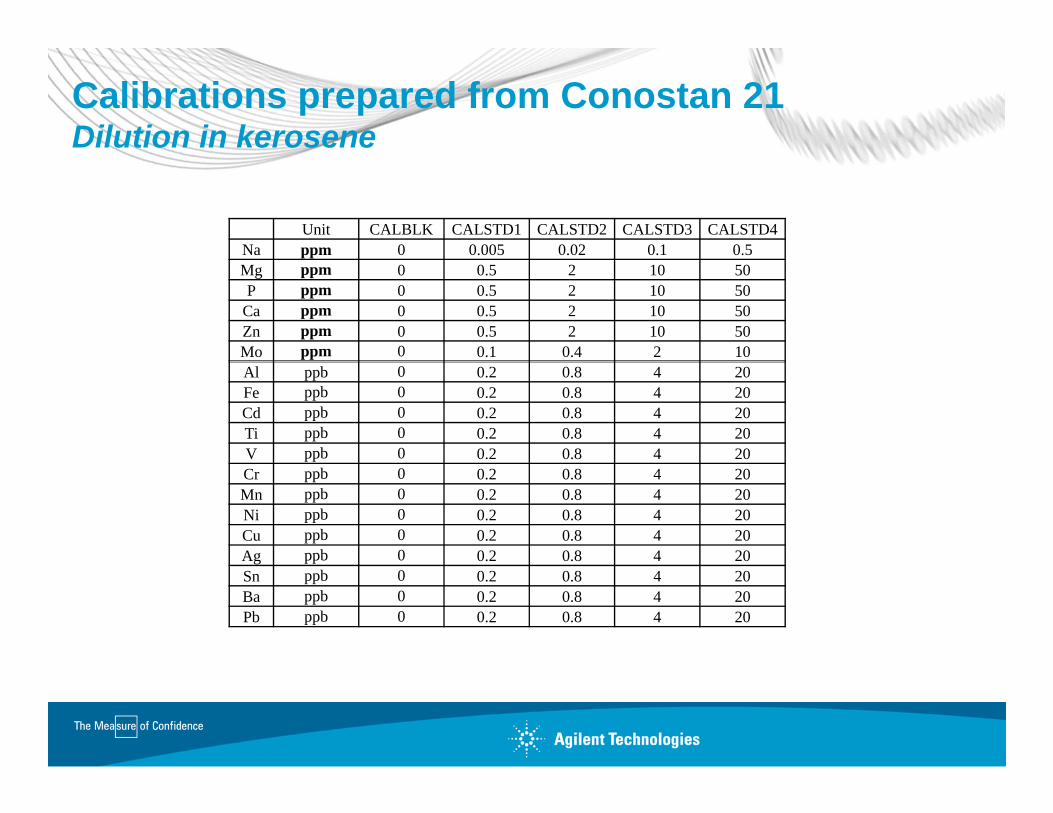
Calibrations prepared from Conostan 21Dilution in kerosene
Unit CALBLK CALSTD1 CALSTD2 CALSTD3 CALSTD4Na ppm 0 0.005 0.02 0.1 0.5Mg ppm 0 0.5 2 10 50P ppm 0 0.5 2 10 50
Ca ppm 0 0.5 2 10 50Zn ppm 0 0.5 2 10 50Mo ppm 0 0.1 0.4 2 10Al ppb 0 0.2 0.8 4 20Fe ppb 0 0.2 0.8 4 20Cd ppb 0 0.2 0.8 4 20Ti ppb 0 0.2 0.8 4 20V ppb 0 0.2 0.8 4 20Cr ppb 0 0.2 0.8 4 20Mn ppb 0 0.2 0.8 4 20Ni ppb 0 0.2 0.8 4 20Cu ppb 0 0.2 0.8 4 20Ag ppb 0 0.2 0.8 4 20Sn ppb 0 0.2 0.8 4 20Ba ppb 0 0.2 0.8 4 20Pb ppb 0 0.2 0.8 4 20
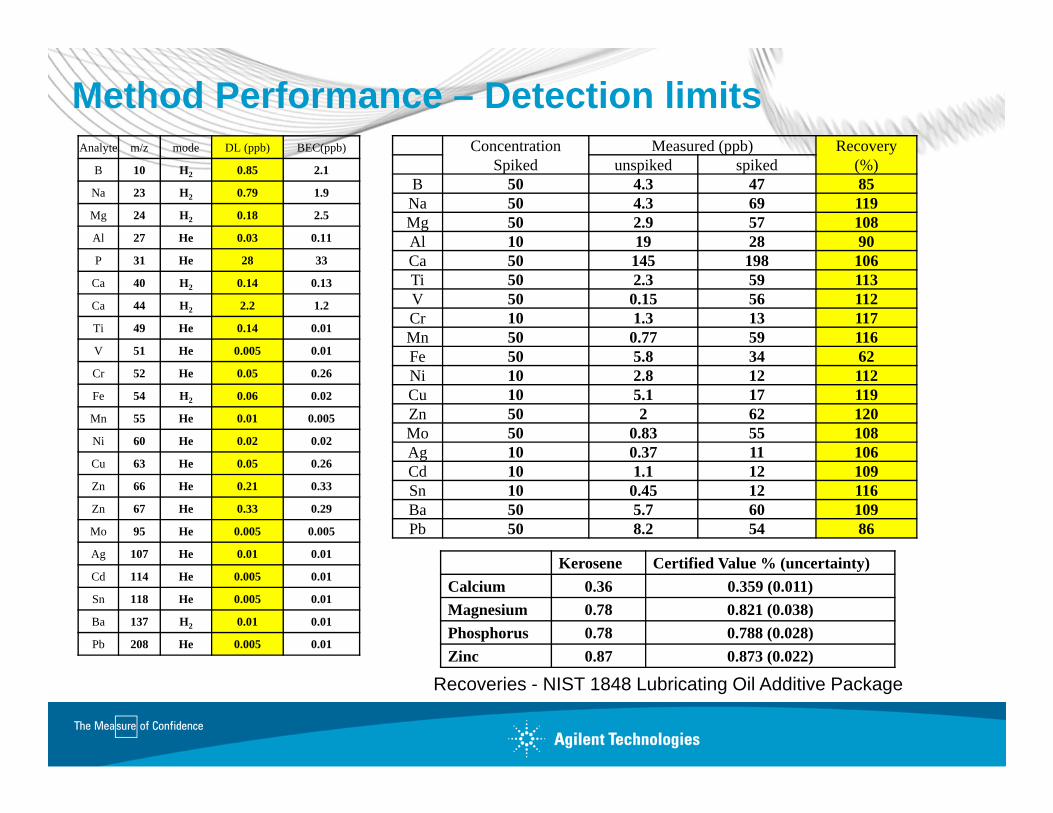
Method Performance – Detection limitsAnalyte m/z mode DL (ppb) BEC(ppb)
B 10 H2 0.85 2.1
Na 23 H2 0.79 1.9
Mg 24 H2 0.18 2.5
Al 27 He 0.03 0.11
P 31 He 28 33
Ca 40 H2 0.14 0.13
Ca 44 H2 2.2 1.2
Ti 49 He 0.14 0.01
V 51 He 0.005 0.01
Cr 52 He 0.05 0.26
Fe 54 H2 0.06 0.02
Mn 55 He 0.01 0.005
Ni 60 He 0.02 0.02
Cu 63 He 0.05 0.26
Zn 66 He 0.21 0.33
Zn 67 He 0.33 0.29
Mo 95 He 0.005 0.005
Ag 107 He 0.01 0.01
Cd 114 He 0.005 0.01
Sn 118 He 0.005 0.01
Ba 137 H2 0.01 0.01
Pb 208 He 0.005 0.01
Concentration Spiked
Measured (ppb) Recovery (%)unspiked spiked
B 50 4.3 47 85Na 50 4.3 69 119Mg 50 2.9 57 108Al 10 19 28 90Ca 50 145 198 106Ti 50 2.3 59 113V 50 0.15 56 112Cr 10 1.3 13 117Mn 50 0.77 59 116Fe 50 5.8 34 62Ni 10 2.8 12 112Cu 10 5.1 17 119Zn 50 2 62 120Mo 50 0.83 55 108Ag 10 0.37 11 106Cd 10 1.1 12 109Sn 10 0.45 12 116Ba 50 5.7 60 109Pb 50 8.2 54 86
Kerosene Certified Value % (uncertainty)Calcium 0.36 0.359 (0.011)Magnesium 0.78 0.821 (0.038)Phosphorus 0.78 0.788 (0.028)Zinc 0.87 0.873 (0.022)
Recoveries - NIST 1848 Lubricating Oil Additive Package
Summary
• ICP-MS methods can be easily adapted from existing ICP-OES methods with only minor changes.
• ICP-MS offers 2 or more orders increased sensitivity
• ICP-MS suffers fewer interferences – easily managed using CRC technology
• ICP-MS can provide isotopic information useful for confirmation

Page 29