applications for molten carbonate fuel cells - diva portal757952/fulltext01.pdf · applications for...
TRANSCRIPT

Applications for Molten
Carbonate Fuel Cells
IVAN REXED
Doctoral Thesis, 2014 KTH Royal Institute of Technology School of Chemical Science and Engineering Department of Chemical Engineering and Technology Applied Electrochemistry SE- 100 44 Stockholm, Sweden

ii
TRITA-CHE Report 2014:51 ISSN 1654-1081 ISBN 978-91-7595-326-7 Akademisk avhandling som med tillstånd av Kungliga Tekniska Högskolan i Stockholm framlägges till offentlig granskning för avläggandet av teknologie doktorsexamen fredagen den 14 november kl. 10.00 i Kollegiesalen, KTH, Brinellvägen 8, Stockholm

iii

iv

v
Abstract
Molten Carbonate Fuel cells are high temperature fuel cells suitable for distributed generation
and combined heat and power, and are today being installed on commercial basis in sizes
from 100kW to several MW. Novel applications for MCFC which have attracted interest lately
are MCFC used for CO2 separation from combustion flue gas, and high temperature
electrolysis with reversible fuel cells. In the first application, the intrinsic capability of the
MCFC to concentrate CO2 from the cathode to the anode side through the cell reaction is
utilized. In the second application, the high operating temperature and relatively simple
design of the MCFC is utilized in electrolysis, with the aim to produce a syngas mix which can
be further processed into hydrogen of synthetic fuels.
In this thesis, the effect on fuel cell performance of operating a small lab-scale molten
carbonate fuel cell in conditions which simulate those that would apply if the fuel cell was
used for CO2 separation in combustion flue gas was studied. Such operating conditions are
characterized especially by a low CO2 concentration at the cathode compared to normal
operating conditions. Sulfur contaminants in fuel gas, especially H2S, are known poisoning
agents which cause premature degradation of the MCFC. Furthermore, combustion flue gas
often contains sulfur dioxide which, if entering the cathode, causes performance degradation
by corrosion and by poisoning of the fuel cell. This makes poisoning by sulfur contaminants of
great concern for MCFC development. In this thesis, the effect of sulfur contaminants at both
anode and cathode on fuel cell degradation was evaluated in both normal and in low CO2
simulated flue gas conditions.
The results suggested that the poisoning effect of SO2 at the cathode is similar to that of H2S at
the anode, and that it is possibly due to a transfer of sulfur from cathode to anode.
Furthermore, in combination with low CO2 conditions at the cathode, SO2 contaminants cause
fuel cell poisoning and electrolyte degradation, causing high internal resistance.
By using a small lab-scale MCFC with commercial materials and standard fuel cell operating
conditions, the reversible MCFC was demonstrated to be feasible. The electrochemical
performance was investigated in both fuel cell (MCFC) and electrolysis cell (MCEC) modes.
The separate electrodes were studied in fuel cell and electrolysis modes under different
operating conditions. It was shown that the fuel cell exhibited lower polarization in MCEC
mode than in MCFC mode, and a high CO2 concentration at the fuel cell anode reduced the
polarization in electrolysis mode, which suggested that CO2 is reduced to produce CO or
carbonate.
Keywords
Molten Carbonate Fuel Cell (MCFC), poisoning, electrolyte degradation, SO2, Electrochemical
Impedance Spectroscopy (EIS), CO2 separation, button cell set-up; reversible molten
carbonate fuel cell, high temperature electrolysis.

vi

vii
Sammanfattning
Smältkarbonatbränsleceller (MCFC) är en typ av högtemperaturbränsleceller som är
anpassade för kombinerad el- och värmeproduktion i mellan-till stor skala. Idag installeras
MCFC på kommersiell basis i storlekar mellan 100kW och flera MW. En ny typ av tillämpning
för MCFC som har väckt intresse på senare tid är användandet av MCFC för CO2-avskiljning i
kombination med konventionell elproduktion genom förbränning. En annan ny tillämpning är
högtemperaturelektrolys genom användandet av reversibla bränsleceller. I det första fallet
utnyttjas att CO2 kan koncentreras från katod- till anodsidan, vilket sker genom cellreaktionen
för MCFC. I det andra fallet utnyttjas den höga arbetstemperaturen och den relativt enkla cell-
designen för att använda reversibla MCFC till elektrolys, med syfte att producera en syngas-
blandning som kan förädlas till vätgas eller till syntetiskt bränsle.
I denna avhandling studeras effekten på bränslecellens prestanda genom att operera en MCFC
i lab-skala med driftförhållanden som simulerar de som förväntas uppkomma om
bränslecellen användes för CO2-avskiljning ur rökgaser från förbränning. Dessa
driftförhållanden karaktäriseras av låg CO2-koncentration på katodsidan jämfört med normal
drift. Svavelföroreningar i bränsle, speciellt H2S, är kända för att orsaka förgiftning av anoden,
vilket i sin tur försämrar bränslecellens prestanda. Dessutom innehåller rökgaser ofta SO2,
vilket antas orsaka korrosion och förgiftning av katoden. Detta gör effekten av
svavelföroreningar till ett prioriterat ämne för utvecklingen av MCFC. I denna avhandling
undersöks effekten av svavelföroreningar på både anod- och katodsidan, i normala
driftförhållanden och i förhållanden med låg CO2 som simulerar användandet av rökgaser för
CO2-avskiljning. Resultaten tyder på att effekten av förgiftning med SO2 på katoden liknar den
med H2S på anoden, och att detta kan vara orsakat av en transport av svavel från katod till
anod. Vidare, i kombination med låg CO2 koncentration på katoden så orsakar SO2-
föroreningar elektrolytdegradering, vilket orsakar hög inre resistans.
Genom att använda en liten MCFC i lab-skala med kommersiella material och
standardförhållanden för MCFC påvisades att reversibla smältkarbonatbränsleceller kan vara
ett lovande koncept. Den elektrokemiska prestandan av både cell och separata elektroder
undersöktes både som bränslecell (MCFC)och vid elektrolys (MCEC). Resultaten visade att
cellen uppvisade lägre polarisation vid elektrolys än som bränslecell, och att ten hög CO2-
koncentration på det som är bränslecellens anodsida gav upphov till en minskad
elektrodpolarisation, vilket indikerar att CO2 reduceras för att producera CO eller karbonat.
Nyckelord
Smältkarbonatbränslecell (MCFC), förgiftning, elektrolyt-päverkan, SO2, Elektrokemisk
Impedans Spektroskopi (EIS), CO2-avskiljning, knappcell, reversibel smältkarbonatbränslecell,
högtemperatur-elektrolys.

viii

ix
List of appended papers
Paper A
Effect of sulfur contaminants on MCFC performance.
I. Rexed, C. Lagergren, G. Lindbergh. International Journal of Hydrogen Energy.
2014;39:12242-50.
Paper B
Molten Carbonate Fuel Cells for CO2 separation and segregation by retrofitting existing plants
- an analysis of feasible operating windows and first experimental findings.
I. Rexed, M. della Pietra, S. McPhail, G. Lindbergh, C. Lagergren. Submitted to International
Journal of Greenhouse Gas Control.
Paper C
Performance degradation of Molten Carbonate Fuel Cells caused by SO2 in simulated flue gas.
I. Rexed, C. Lagergren, G. Lindbergh. Manuscript.
Paper D
Electrochemical performance of reversible molten carbonate fuel cells. L. Hu, I. Rexed, C.
Lagergren, G. Lindbergh. International Journal of Hydrogen Energy. 2014;39:12323-29.
The author’s contribution the listed papers
Paper A and C: Planned the work and performed all experiments, main author of the text.
Paper B: Planned the work and performed all experiments with the button cell, main author of
the text. The experiments with single cell and gas analysis were performed by M. della Pietra.
Paper D: Contributed to the planning and execution of all experiments, participated in the
writing.

x
xi
Contents
Applications for Molten Carbonate Fuel Cells .................................................................................................... i
1. Introduction .......................................................................................................................................................... 1
1.1. Fuel cells ....................................................................................................................................................... 2
1.2. The Molten Carbonate Fuel Cell .......................................................................................................... 4
1.3. Poisoning of MCFC by contaminants ................................................................................................. 9
1.4. Carbon capture and the MCFC ........................................................................................................... 13
1.5. MCFC in power to gas ............................................................................................................................ 15
1.6. The MCFC-CONTEX project ................................................................................................................. 16
1.7. Aim of this work ...................................................................................................................................... 16
2. Experimental ...................................................................................................................................................... 17
2.1. Testing procedures for electrochemical measurements ........................................................ 17
2.2. Experimental conditions ...................................................................................................................... 22
3. Results and discussion .................................................................................................................................... 27
3.1. Fuel cell degradation by sulfur contaminants ............................................................................. 27
3.2. Operating conditions with CO2 lean oxidant gas ........................................................................ 33
3.3. Study of contaminant effects in CCS conditions ......................................................................... 38
3.4. Electrochemical performance of the reversible MCFC ............................................................ 44
4. Conclusions ......................................................................................................................................................... 51
4.1. Effect of sulfur contaminants on MCFC performance .............................................................. 51
4.2. Operating MCFC with low CO2 concentration in oxidant gas ................................................ 52
4.3. Performance degradation of Molten Carbonate Fuel Cells caused by SO2 in simulated
flue gas ....................................................................................................................................................................... 53
4.4. The reversible Molten Carbonate Fuel Cell .................................................................................. 53
5. Acknowledgements .......................................................................................................................................... 55
6. References ........................................................................................................................................................... 57

xii
1
1. Introduction
During the last century, the development of our society has been intimately connected to an
abundant supply of cheap carbon to fuel our ever-growing economy. Of the world’s total
primary energy demand 2010, fossil fuels account for just over 80%, and of the total CO2
production, the two largest consumer sectors are power generation and heating, 41%, and
transportation, 22% [1].
Compared to the pre-industrial era, the concentration of CO2 in the atmosphere has increased
by 40% and the correlation with the measured temperature increase since 1950 shows that
anthropogenic CO2 is the single most important cause of global warming. A continued
business-as-usual development and temperature increase is expected to result in more
frequent extreme weather, ocean acidification and rising sea level. [2] In perspective of this
knowledge it stands increasingly clear that we need to intensify our efforts to break our
dependency on fossil fuels.
In order to reduce CO2 emissions and mitigate climate change, internationally agreed policies
have been negotiated, such as the Kyoto protocol or the EU 20-20-20 target. The former was a
first attempt to commit developing countries to emission reduction targets. The latter is a
policy agreement of the European Union with the aim to reduce greenhouse gas emissions by
20% compared to 1990 levels, to raise the share of energy consumption from renewables by
20%, and to implement a 20% improvement in energy efficiency by 2020 [3]. However, even
with successful implementation of these goals within the EU, the International Energy Agency
(IEA) is estimating a 20% increase in cumulative CO2 emissions over the following 20 years,
with the total increase taking place outside of Europe and the OECD [4]. Together this poses a
tremendous challenge to the research community and policy makers to develop new
technology and regulations in order to mitigate global warming.
The fuel cell technology is an important part of the energy equation to reduce CO2 emissions
and to decrease our carbon footprint in sectors where the contribution to global CO2
emissions are the highest; by reducing fuel consumption in transportation, by increasing the
efficiency in power generation and by simplifying the transition from fossil to renewable fuels
on the market.
Molten carbonate fuel cells (MCFC) are high temperature fuel cells which are suitable for
distributed power generation with high efficiency conversion of energy, flexible operation and
combined heat and power (CHP) production. MCFCs are already commercially available in
medium- to large scale power generation (100kW-1MW), and the total installed capacity by
2
2012 exceeded 300MW. The main producers of MCFC technology are Fuel Cell Energy (FCE),
US, with its subsidiary FCES, Germany, and South Korean partner POSCO Energy, who are
producing fuel cells under license from FCE [5].
While the European market remains underdeveloped, demand has surged in the US and South
Korea where the absolute majority of investments in fuel cells are made. As an example,
during 2013, a 14.9MW plant in Bridgeport, CT (US) [6] and the world’s largest fuel cell plant
of 58.8MW in Hwasong City [7] (South Korea) were commissioned, and the total installations
amounted to 92MW, bringing MCFC to the position of largest fuel cell technology in the world
by 2013 in terms of MW installed [8].
However, MCFCs are now being considered from novel perspectives. The MCFC have the
unique ability of operating as an integrated CO2 concentrator and power generation unit,
which has opened for the possibility of integrating MCFC with conventional power generation
in combination with carbon capture and storage (CCS) technology for removal of CO2 from
combustion flue gas [9-13].
The MCFC is also a potential candidate for high temperature electrolysis, which is beneficial
due to reduced overvoltage and favorable thermodynamics compared to low temperature
electrolysis [14]. The reversible MCFC would have the advantage of being able to alternate
between power and fuel production and of utilizing the existing fuel cell technology, thereby
greatly lowering developments costs. However, the feasibility of operating the MCFC in
electrolysis mode is previously untested.
Currently, the largest obstacles to a continued large scale introduction of MCFC onto the
market of power generation are installation costs and life time issues related to performance
degradation. A major concern is the presence of sulfur contaminants in fuel which shortens
life time and causes the need of expensive gas cleaning installations for pre-treatment of the
fuel.
1.1. Fuel cells Fuel cells are energy conversion units, just as are batteries, internal combustion engines (ICE),
or generators. The difference lies in how the energy is supplied, how it is converted, and what
type of energy it is converted into. The ICE converts chemical energy of a fuel (e.g. petrol or
diesel) into motion of pistons through combustion, the generator converts motion into
electrical energy which can be supplied to the grid. Combine them and we can produce power
from fossil fuels, and with a slight variation to the chain we can describe the whole industry of
conventional power generation through combustion of coal, oil, and gas as well as propulsion
of vehicles. Fuel cells and batteries, on the other hand, are electrochemical energy conversion
units, which can convert chemical energy directly into electrical energy without combustion,
with the principal difference in between them that the battery carries its own energy storage

3
while the fuel cell continuously consumes fuel gas and air and releases the reaction products
formed as exhaust into the atmosphere.
All fuel cells consist of two electrodes where the electrochemical reactions occur, separated by
an electrolyte which consists of an electrically insulating, ion conducting media. This
separates the reactants and forces the electrons to travel in an external circuit to induce a
current while the ionic charge carriers migrate through the electrolyte under load to complete
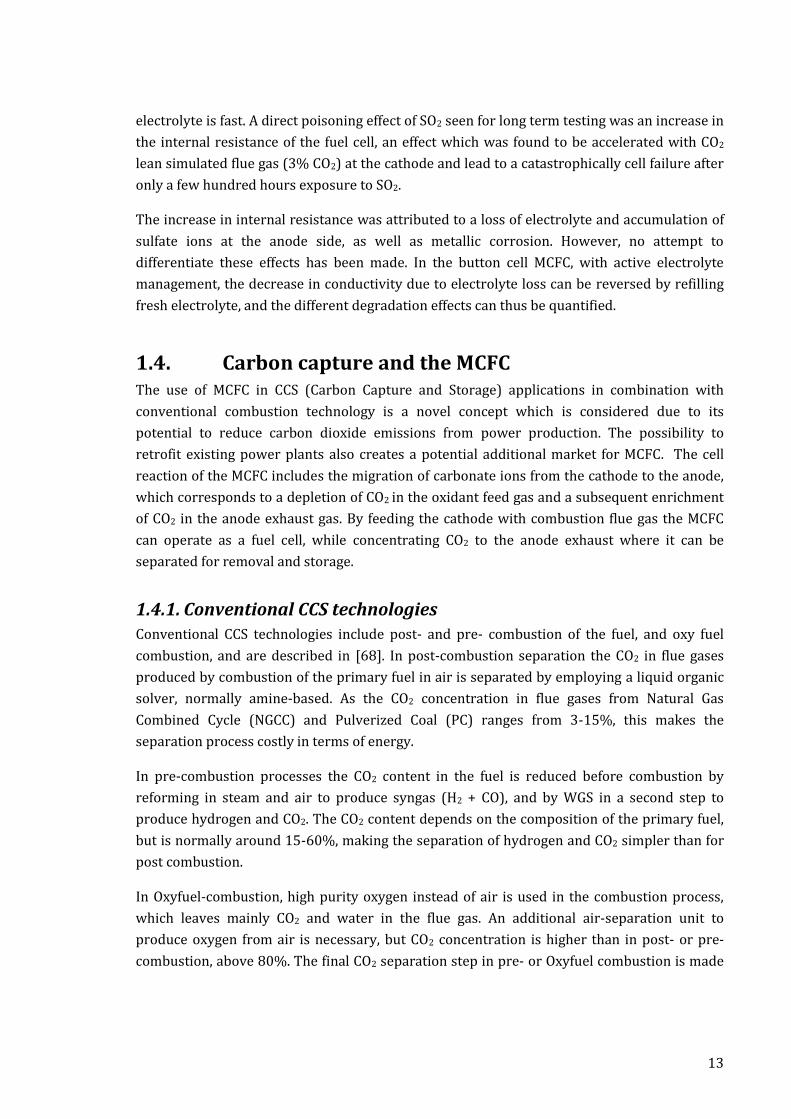
the cell reaction. The working principle of a fuel cell is shown in Figure 1-1.
Figure 1-1. The working principle of a fuel cell.
Different types of fuel cells are classified by their electrolytes, and differ in terms of electrode
materials, fuel used, electrode reactions, operating temperature and design. Low temperature
fuel cells, such as the Polymer Electrolyte Membrane Fuel Cell (PEMFC), the Alkaline Fuel Cell
(AFC), Phosphoric Acid Fuel Cell (PAFC) and Direct Methanol Fuel Cell (DMFC) all have in
common that they use aqueous or hydrated electrolytes but require expensive Pt-catalysts in
order to show good performance. High temperature fuel cells, such as the Molten Carbonate
Fuel Cell (MCFC), which operates at 600-700oC, or the Solid Oxide Fuel Cell (SOFC), which
operates at 800-1000oC, function without noble metal catalysts and can be operated with any
hydrocarbon fuel thanks to internal reforming of the fuel to hydrogen at the operating
temperature. However, due to the temperature, non-aqueous (MCFC), or even solid (SOFC)
electrolytes must be applied.
The advantages of electrochemical energy conversion are obvious. High, load-independent
efficiency, which is not restricted by the thermodynamic limit of the Carnot cycle as is a heat
engine. Clean energy and zero emissions locally; a fuel cell operated with hydrogen and
oxygen, releases only water vapor as an exhaust. No moving parts; in the fuel cell,
electrochemical reactions at the anode produce electrons which are consumed at the cathode
thus producing electricity when the external circuit is closed. As a consequence the fuel cell
also exhibit low noise and need little mechanical maintenance.
In a fuel cell, the theoretical reversible efficiency (ηrev) is the ratio of Gibbs free energy (ΔG), to
the standard enthalpy of formation (ΔH), as defined in equation (1). The theoretical efficiency
4
is highest at low temperature. However, losses decrease with higher temperature, which
makes high temperature operation beneficial nevertheless. The cause of the change in
efficiency can be seen from the relation of Gibbs free energy to the enthalpy, entropy (ΔS) and
temperature (T) (equation 2). The enthalpy of formation and entropy change are more or less
constant for a hydrogen fuel cell, so if the temperature increases from 100oC to 1000oC the
Gibbs free energy and the reversible efficiency decrease.
𝜂𝑟𝑒𝑣 =∆𝐺
∆𝐻 (1)
∆𝐺 = ∆𝐻 − 𝑇∆𝑆 (2)
The Gibbs free energy is the useful energy which can be converted to electricity in a fuel cell.
As the reaction is reversible, it is also equal to the minimum electrical energy which must be
supplied for an electrolysis process to take place. For this reason, electrolysis processes are
benefited by high temperature. The standard reversible potential (E) of a fuel cell can be
calculated from the Gibbs free energy, the number of moles of reactants, n , and the Faraday
number (F) , according to equation (3).
𝐸 =−∆𝐺
𝑛𝐹 (3)
In comparison to the combustion engine which has been developed and optimized during 100
years, the fuel cell technology is less mature, both in terms of technology and in production,
making it difficult to compete cost-wise. This has made the fuel cell to become a niche-
product, first utilized in space and military industry, where the cost is of secondary
importance, and secondly in back-up systems where demands in reliability is high or in
remote off-grid units such as mobile base station. Lately, however, certain fuel cell
technologies have reached a level of maturity where they are on the brink of competitiveness
with traditional combustion technology. Two examples are the PEMFC, which are now
available in a number of mobile applications and even in zero-emission fuel cell cars in small
series production, and the MCFC, which is already commercially available for large scale
power production.
1.2. The Molten Carbonate Fuel Cell The MCFC is a high temperature fuel cell with a molten carbonate electrolyte operating in a
temperature range of 580-700oC. The operating temperature interval is limited by poor
conductivity of the electrolyte at lower temperatures, and by accelerated corrosion and
electrolyte vaporization at higher temperatures. A principal advantage of high temperature
fuel cells is the use of cheap non-noble catalysts for electrode material. The anode of the MCFC
is made of nickel, typically alloyed with Cr or Al for microstructural stability, and the cathode
of the MCFC is made of in-situ lithiated nickel oxide.

5
The electrolyte consists of a eutectic mix of Li2K2CO3 or Li2Na2CO3, which is suspended in a
separator matrix consisting of LiAlO2, and partly in the porous gas diffusion electrodes. The
high ionic conductivity at the operating temperature allow the separator and electrodes to be
thick (0.5-0.6 mm and 0.6-1.0 mm respectively) compared to low temperature fuel cells
without causing an unacceptable voltage drop, something which is necessary for good
mechanical stability, to prevent gas cross over, and to prevent Ni-shortening in the electrolyte
[15].
MCFC systems can be operated in atmospheric or in pressurized conditions. Atmospheric
MCFC systems are operated with low current density compared to other fuel cell technologies,
due to high ohmic losses in the electrolyte and high polarization losses at the cathode.
Pressurized systems are employed to increase the power density, which is economically
beneficial, however, increased dissolution of cathode at high pressure is a problem for
pressurized systems. [16]
The theoretical efficiency of MCFC is high, >60% electrical efficiency and 90% thermal
efficiency. In practice, commercial systems have demonstrated an electrical efficiency of 45-
55% [17]. The high quality waste heat of the MCFC can be utilized for combined heat and
power operation (CHP) [18], or for co-generation, such as steam- (ST) [19, 20] or gas-turbine
(GT) [21-24] combined cycles in which overall electrical efficiencies of 60-70% may be
reached.
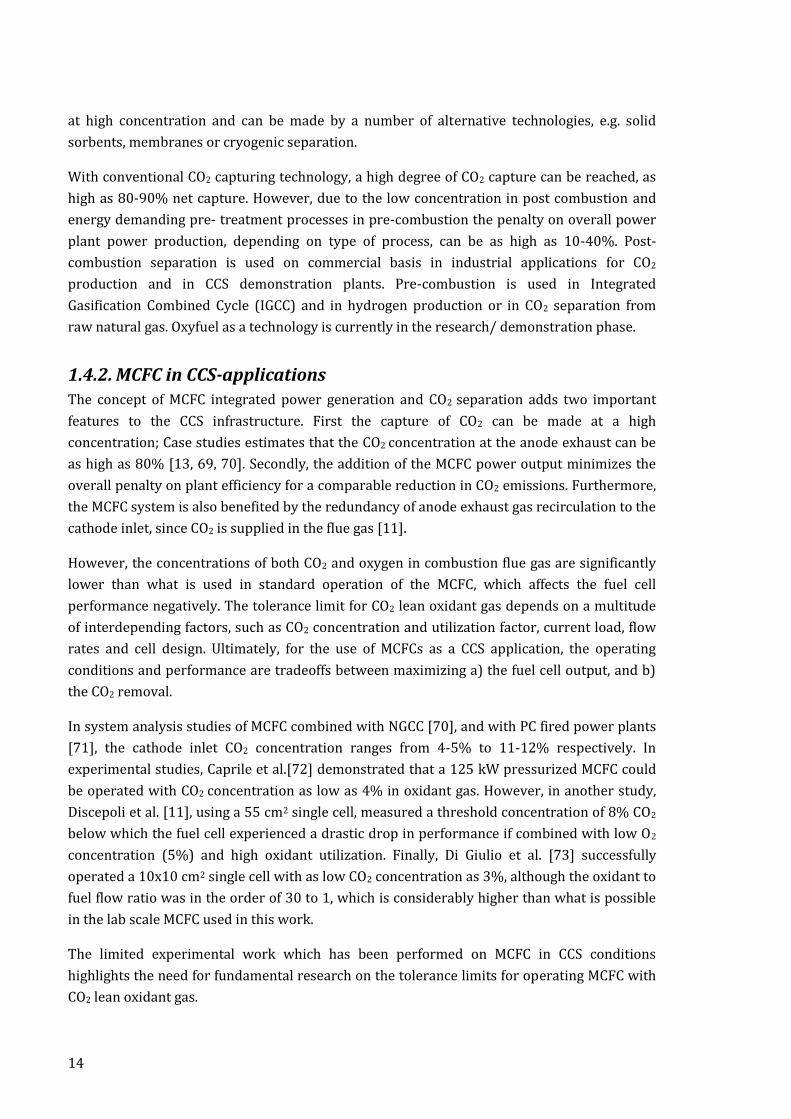
Figure 1-2. The working principle of the MCFC.
A schematic drawing show the working principle of the MCFC can be seen in Figure 1-2.
Oxygen is reduced with CO2 at the cathode, while hydrogen is oxidized at the anode to
produce water and CO2. In the electrolyte, carbonate ions provide the means of ionic transport
between the cathode and the anode. The cathode and anode reactions occur as follows.
Cathode reaction: ½O2 + CO2 +2e- CO32- (1.1)
Anode reaction: H2 + CO32- H2O + CO2 + 2e-
(1.2)

6
In the resulting cell reaction hydrogen and oxygen reacts to form water, and due to a net
transport from the cathode to the anode side, CO2 needs to be supplied to the cathode as well
as oxygen. This is in practice solved by recirculating a part of the anode exhaust, which is
passed through a catalytic burner to oxidize residual fuel in the gas before it is mixed with air
at the cathode inlet [17]. The cell reaction is as follows.
Cell reaction: H2 + ½O2 + CO2, Cat H2O + CO2, An (1.3)
An additional advantage of high temperature operation is that CO, which acts as a poison in
low temperature fuel cells, may be utilized as fuel by direct CO oxidation at the anode or
through the water-gas shift reaction (WGS). The slow kinetics of CO oxidation compared to
hydrogen oxidation, however, makes the WGS reaction more likely to occur.
CO oxidation: CO + CO32- 2CO2 + 2e- (1.4)
WGS: CO + H2O H2 + CO2 (1.5)
The operating temperature of 650oC is sufficiently high for steam reforming of hydrocarbon
fuels, i.e. methane, to hydrogen, which makes the MCFC highly flexible in terms of fuel supply.
Steam reforming is carried out over a supported Ni-catalyst, and may be performed by
external or internal reforming. In case of the former, the fuel is converted to hydrogen and CO2
before entering the fuel cell. In case of the latter, the steam reforming and the associated WGS
reaction takes place directly at the anode.
Steam reforming: CH4 + H2O 3H2 + CO (1.6)
Internal reforming uses the heat produced by the exothermic hydrogen oxidation for the
endothermic steam reforming reaction, which simplifies thermal management of the stack.
The cooling load may be reduced with as much as 50% by applying internal reforming [25].
Furthermore, when hydrogen is consumed in the anode reaction, this drives the steam
reforming reaction to the right which yield higher fuel utilization and higher overall efficiency.
In external reforming the heat form the catalytic burner can utilized for the reforming
reaction. It is used for pressurized systems, as the steam reforming is promoted by high
temperature and pressure. The water-gas shift reaction is reversible and fast and can be
assumed to be at equilibrium inside the fuel cell [26].
Carbon deposition, which is detrimental for the fuel cell, may occur through the so called
Boudouard reaction. Humidification of the fuel gas decreases the risk of carbon deposition as
it reduces the concentration of CO through the WGS reaction [27, 28].
Boudouard reaction 2CO <C> + CO2 (1.7)
The WGS reaction and the direct oxidation of CO can affect the OCV by changing the gas
composition and by causing a mixed potential, as the reversible cell potential for a hydrogen
7
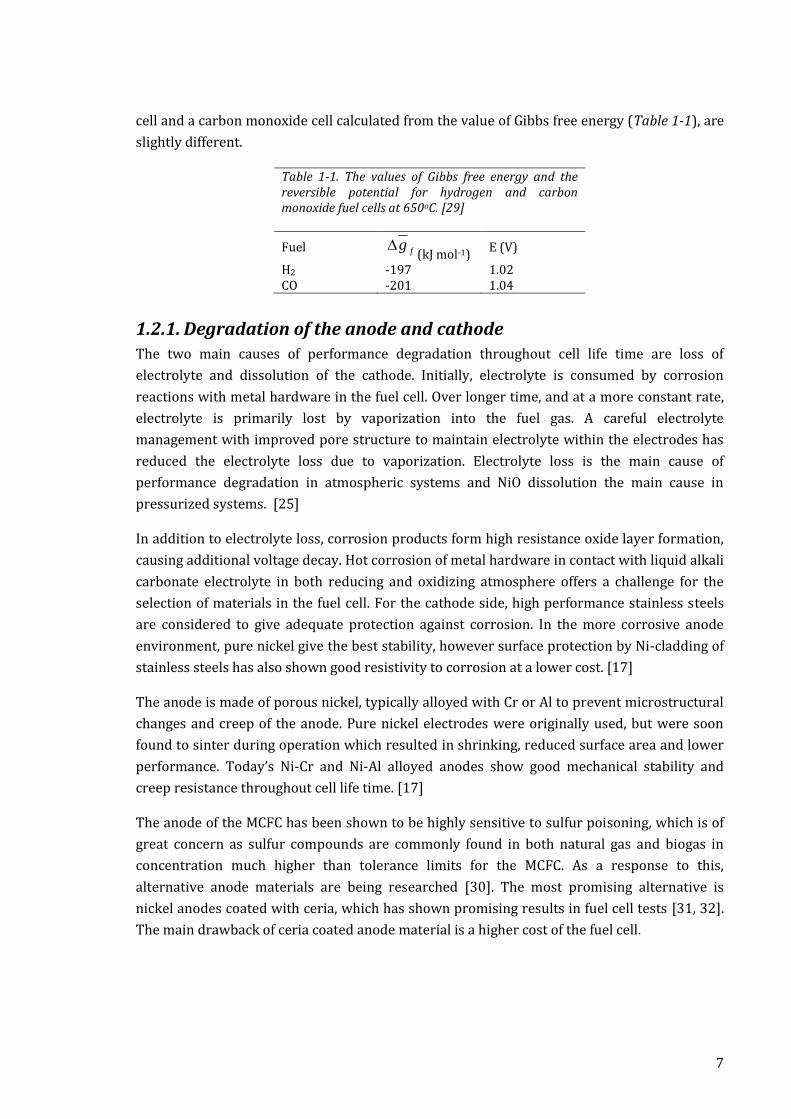
cell and a carbon monoxide cell calculated from the value of Gibbs free energy (Table 1-1), are
slightly different.
Table 1-1. The values of Gibbs free energy and the reversible potential for hydrogen and carbon monoxide fuel cells at 650oC. [29]
Fuel fg
(kJ mol-1) E (V)
H2 -197 1.02 CO -201 1.04
1.2.1. Degradation of the anode and cathode
The two main causes of performance degradation throughout cell life time are loss of
electrolyte and dissolution of the cathode. Initially, electrolyte is consumed by corrosion
reactions with metal hardware in the fuel cell. Over longer time, and at a more constant rate,
electrolyte is primarily lost by vaporization into the fuel gas. A careful electrolyte
management with improved pore structure to maintain electrolyte within the electrodes has
reduced the electrolyte loss due to vaporization. Electrolyte loss is the main cause of
performance degradation in atmospheric systems and NiO dissolution the main cause in
pressurized systems. [25]
In addition to electrolyte loss, corrosion products form high resistance oxide layer formation,
causing additional voltage decay. Hot corrosion of metal hardware in contact with liquid alkali
carbonate electrolyte in both reducing and oxidizing atmosphere offers a challenge for the
selection of materials in the fuel cell. For the cathode side, high performance stainless steels
are considered to give adequate protection against corrosion. In the more corrosive anode
environment, pure nickel give the best stability, however surface protection by Ni-cladding of
stainless steels has also shown good resistivity to corrosion at a lower cost. [17]
The anode is made of porous nickel, typically alloyed with Cr or Al to prevent microstructural
changes and creep of the anode. Pure nickel electrodes were originally used, but were soon
found to sinter during operation which resulted in shrinking, reduced surface area and lower
performance. Today’s Ni-Cr and Ni-Al alloyed anodes show good mechanical stability and
creep resistance throughout cell life time. [17]
The anode of the MCFC has been shown to be highly sensitive to sulfur poisoning, which is of
great concern as sulfur compounds are commonly found in both natural gas and biogas in
concentration much higher than tolerance limits for the MCFC. As a response to this,
alternative anode materials are being researched [30]. The most promising alternative is
nickel anodes coated with ceria, which has shown promising results in fuel cell tests [31, 32].
The main drawback of ceria coated anode material is a higher cost of the fuel cell.
8
The cathode is made of NiO, which is slightly soluble in the electrolyte (reaction 1.8).
Dissolved nickel ions diffuse into the electrolyte, and precipitates as metallic nickel forming
electronically conducting pathways between the anode and cathode.
NiO + CO2 Ni2+ + CO32- (1.8)
The solubility of NiO is managed by a combination of electrolyte composition, gas composition
and pressure and operating temperature in the electrolyte, and was early on identified as a
major obstacle to increased life time of the fuel cell, as it threatens the integrity of the fuel cell
by causing short circuiting. [33-36].
There are two main approaches to extend the stability of the cathode. The first is to change or
to modify the cathode material to decrease the solubility. LiCoO2 or LiFeO2 have been studied
as alternative electrode materials, either in binary or ternary mixtures with NiO, or as
coatings on NiO electrodes [37-39]. Although the solubility is decreased, the brittleness and
high cost of LiCoO2 and the low conductivity of LiFeO2 has prevented them to be of practical
use. The second approach is to increase the basicity of the electrolyte, which decreases the
dissolution of NiO. This can be achieved by using Li/Na eutectic carbonate melts as electrolyte
[40] or by modifying the electrolyte with alkaline metal salt additives, of which lanthanum
oxide seems the most promising alternative [41-43].
The dissolution of NiO is accelerated under high pressure operation, and consequently the cell
life time shortened, why research on alternative electrolytes has been focused on such
applications [28]. However, for atmospheric systems, it has been projected that careful
management of stack operation can minimize the dissolution of NiO, and that life time of
40 000h can be reached without Ni-shortening [16].
1.2.2. Pore structure and electrolyte management
The electrolyte distribution is decided by a balance of capillary forces and wetting properties
of the anode and cathode, which makes the pore structure of the cell components of crucial
importance for the performance of the fuel cell [44]. The gas diffusion electrodes are generally
bi-modal, so that the smaller pores are filled with electrolyte and the larger pores may
function as gas channels inside the electrode. A sub-micron porosity (<0.1 µm) of the matrix
maintains a 100% filling of electrolyte which prevents gas cross-over.
It is desirable to design the electrode pore structure so that the anode can house an excess of
electrolyte and function as an electrolyte reservoir for the fuel cell without flooding the
cathode, as electrolyte is inevitably lost during operation, and thereby extending the cell life
time [45, 46].
In smaller lab scale fuel cell set-ups, such as the one being used in this work, there are two
alternatives to solve the problem. Either the operation time is kept short, so that effect of any
change in electrolyte filling is negligible, or electrolyte must be replenished during operation.

9
As will be discussed in this thesis, consideration must be taken to the electrolyte evaporation
depending on what type of experimental set-up, i.e. button cell, single cell or stack.
1.3. Poisoning of MCFC by contaminants The flexibility towards the fuel composition makes the MCFC ideal to use for power
production from biogas as well as natural gas or reformate gas. Reformate gas can be
produced from fossil fuels, or from wood biomass. It is produced by gasification and often
employ steam reforming, why the reformate gas is typically rich on hydrogen and CO [47].
Biogas is produced by anaerobic digestion of organic residues, such as waste sludge in waste
water treatment plants, organic municipal waste, biomass from agriculture such as energy
crops, or manure. Depending on its origin, biogas may vary greatly in composition, however it
is characterized by high concentrations of methane (40-65%) and high concentrations of CO2
(30-40%) [48-50]. The lower energy density of the fuel promotes distributed heat and power
production, for which MCFCs are well suited.
The use of biogas to fuel MCFCs is desirable from an environmental perspective as it reduces
the amount of CO2 released from power production compared to if fossil based fuel would be
used. However, due to the fact that biogas, depending on its source, contains many trace
components which are directly harmful to MCFC performance and lifetime this is also of
concern for degradation of the fuel cell.
Ammonia (NH3) may be present in biogas from anaerobic digestion of organic waste matter,
however, the tolerance limit for MCFC is high, and at low concentrations it can be utilized as
fuel without significant effect on degradation [48, 51]. Halides (HCl, HF) have been reported to
be present in reformate coal gas in concentrations of 100-500 ppm and are reported to cause
corrosion and interact with electrolyte. The tolerance limit for MCFCs has been reported to be
less than 1 ppm, which can be achieved by the use of sodium aluminate sorbents [52, 53].
Siloxanes are organic silicon compounds which are used as surfactants in consumer products
and lubricants, and can be found in biogas from e.g. waste water plants. Siloxanes in gaseous
form deposit as silicate (SiO2) and deactivates the anode or reformer catalyst and block the
pore structure, leading to gradually increasing losses [54]. Siloxane is commonly removed by
non-regenerative adsorption on active carbon fixed beds [55].
Sulfur compounds are found in all biofuels in relatively high concentration since they are
produced from organic raw material. In biogas, it is most commonly present as hydrogen
sulfide (H2S), which is known to have an adverse effect on fuel cell performance and lifetime
of MCFC. The concentration of hydrogen sulfide in biogas from different sources ranges from
100-1000 ppm, with the highest concentration found in biogas from waste water [56].
Although a high sulfur content in natural gas and biogas is a problem also in conventional
power generation, due to the corrosiveness of sulfur at high temperatures, the severe penalty
on performance combined with demands for improvements in fuel cell life time incur a more
strict tolerance limit for MCFC applications, around 1 ppm sulfur in fuel gas or less [48, 57].
10
As trace amounts of sulfur are difficult and expensive to clean [58], finding tolerance criteria
and quantifying poisoning effects of trace amounts of H2S in fuel gas has therefore been a
prioritized issue for MCFC research.
1.3.1. Hydrogen sulfide in fuel gas
Hydrogen sulfide has been shown to interact with all parts of the anode, and the negative
effect on fuel cell performance is well documented. Poisoning effects have been observed at
concentrations of H2S as low as 1 ppm, although with good regenerative effect from using
hydrogen rich and high humidity gas at the anode [59]. Prolonged exposure in contaminant
conditions results in irreversible surface effects and deactivates the Ni-anode catalytic ability,
causing performance degradation [31, 57, 59-66].
Hydrogen sulfide in equilibrium with the electrolyte forms sulfate and sulfide ions which
result in a loss of electrolyte by replacement of the carbonate at the anode by sulfate or sulfide
ions (reactions 1.8 and 1.9) [57].
H2S + CO32- +3H2O SO42- +CO2 + 4H2 (1.9)
H2S + CO32- H2O + CO2 + S2- (1.10)
Nickel sulfide formation and adsorption on the nickel catalyst surface kinetically hinder the
hydrogen oxidation reaction rate and reduce the active surface area. NixSy may be formed on
the anode surface by means of chemical- (1.11) or electrochemical (1.12) reaction. Formation
of bulk nickel sulfides as well as adsorption depends on the ratio H2:H2S, however, in several
studies [59, 63] it has been pointed out that the formation of bulk nickel sulfides by chemical
reaction may be thermodynamically restricted at normal operating conditions of the MCFC.
Using thermodynamic data, Weaver and Winnick [57] calculated the limit for Ni3S2 formation,
which is more favorable than NiS, with 70% fuel utilization to be in the order of 300 ppm,
which is considerably higher than what the MCFC can tolerate. Electrochemical formation of
NixSy is more likely and the formation of nickel sulfide, predominantly Ni3S2, in H2S-
contaminated conditions after polarization of the anode, have been confirmed by XRD analysis
of post-test anode material [61] [59].
As reaction (1.12) is an electrochemical reaction, nickel sulfide formation is only possible if
the potential is more positive than the standard potential of formation. The standard potential
for NiS and Ni3S2 is -0.756 V and -0.829 V vs. SOE, respectively [31, 59, 62]. The standard
potential for hydrogen oxidation is more negative, around -1.10 V vs. SOE, which means that
nickel sulfide cannot be formed electrochemically at OCV.

11
xNi + yH2S NixSy + yH2 (1.11)
xNi +y S2- NixSy + 2xe- (1.12)
Furthermore, adsorption of hydrogen sulfide or sulfur atoms on the nickel anode surface may
occur even at low concentrations, due to the large surface area inside the porous structure.
Adsorption (reaction 1.13) or chemisorption (reaction 1.14) of H2S at the nickel surface has
been found to be the main poisoning mechanism at low concentration and at OCV [59, 65].
Ni(s) + H2S(g) Ni-H2S(ads) (1.13)
2Ni(s) + H2S(gas) Ni-HS(ads) + Ni-H(ads) Ni-S(ads) + Ni-H2(ads)
Ni-S(ads) +Ni(s) +H2(gas) (1.14)
Sulfate and sulfide ions can also be produced by oxidation of H2S if the anode potential
increases above the standard potential of formation, which are -1.073 V and -0.986 V vs. SOE
for sulfide and sulfate, respectively (reactions 1.15 and 1.16) [59].
5CO32- +4H2 + H2S S2- + 5CO2 + 5H2O + 8e- (1.15)
5CO32- + H2S SO42- + 5CO2 + H2O +8e- (1.16)
The poisoning effect is reduced in hydrogen rich fuel, as the H2S:H2 ratio makes adsorption
less favorable (reaction 1.14) and promotes desulfurization of the anode and electrolyte
(reaction 1.9 and 1.11). A high water content in the anodic gas has been shown to make the
regeneration of the fuel cell after H2S poisoning faster, by promoting desulfurization of the
electrolyte by reaction (1.10) [57, 59].
It has been found that at low concentrations of H2S and at OCV the water-gas shift reaction is
inhibited and the fuel value reduced, especially for fuel gas rich on CO [66]. Di Giulio et al. [63]
demonstrated that the main effect on OCV is due to the delayed WGS reaction when using non
equilibrium gases, and that it can be mistaken for a result of mixed potential due to hydrogen
sulfide.
Kawase et al. [60] showed that the wetting of the anode surface by the electrolyte is improved
by the addition of H2S to fuel gas and by dissolved sulfur species in the electrolyte. As a result
of the improved wetting properties the electrolyte distribution between the electrodes
changes which may increase the rate of electrolyte loss and cause a decrease of the
performance.
Furthermore, nickel sulfide formation on the nickel surface also affects the performance by
changing the morphology of the porous structure by blocking catalytic sites. [65] Operating
conditions are the subject of the design of a fuel cell, the poisoning mechanism of the anode
depends on a number of different factors such as gas composition, temperature, operating
pressure and electrolyte composition. Furthermore, these conditions might change inside the
12
fuel cell during operation, and in turn affect the poisoning mechanism. The fuel utilization,
which changes the partial pressure of reactants locally, the anode polarization, and the
wetting properties of the electrode are examples of such important factors.
1.3.2. Sulfur dioxide in oxidant gas
The effect on fuel cell performance and degradation of using flue gas is a concern for the use of
MCFC as a CCS application. As most combustible fuels to some degree consist of sulfurous
elements, combustion flue gas as well as fuel gas derived from coal, biomass or natural gas,
also often contains high concentrations of sulfur compounds.
In MCFCs, the effect of SO2 poisoning of the cathode has not been a research area in focus, as
the primary source of cathodic SO2 in a conventional MCFC plant is sulfur compounds in
anode exhaust recirculation gas. Any H2S present in the exhaust which is passed through a
catalytic burner is then oxidized into SO2 (reaction 1.17) together with residual fuel in a
catalytic burner before entering the cathode [30].
H2S +3/2 O2 H2O +SO2 (1.17)
CO32- + SO2 +1/2 O2 CO2 + SO42- (1.18)
A possible cause of anode side poisoning would then be a feedback loop of H2S to the anode
where SO2 is first dissolved into the electrolyte (reaction 1.18), then migrates to the anode
where sulfate ions can be converted to H2S (reaction 1.9) in equilibrium with the fuel gas [57,
66].
Considering the low tolerance level of MCFC for H2S at the anode, 1 ppm or less [57, 65], the
main attention has been attracted towards developing sulfur resistance anode materials, such
as ceria coatings on nickel, in combination with efficient gas cleaning of fuel gas [31, 64].
However, with the suggested application of MCFC as a concentrator device for CO2 in flue gas,
the subject of SO2 poisoning of the cathode has gained renewed interest.
The cathodic poisoning can, in addition of corrosion of metallic parts, be divided into a
primary and a secondary poisoning mechanism. The primary poisoning is the loss of
electrolyte by (reaction 1.18), and the secondary poisoning would be that of poisoning from
H2S released from the electrolyte at the anode. Indeed, in one of few earlier experimental
studies with SO2 in the oxidant gas stream a similar poisoning effect as from H2S was observed
[66]. However, little experimental work has been made to quantify this poisoning effect of SO2
in oxidant gas as compared to the effect of H2S in fuel gas.
In a recent study by Di Giulio et al. [67], the transfer mechanism of sulfur through the cell and
subsequent release of H2S at the anode was confirmed by gas analysis of anode and cathode
outlet gases. During a 1000 h test period with 50 ppm SO2 in standard oxidant gas
composition, no SO2 was detected in the cathode outlet gas, while H2S in the anode exhaust
was detected after only a few hours, which indicates that the dissolution of SO2 in the
13
electrolyte is fast. A direct poisoning effect of SO2 seen for long term testing was an increase in
the internal resistance of the fuel cell, an effect which was found to be accelerated with CO2
lean simulated flue gas (3% CO2) at the cathode and lead to a catastrophically cell failure after
only a few hundred hours exposure to SO2.
The increase in internal resistance was attributed to a loss of electrolyte and accumulation of
sulfate ions at the anode side, as well as metallic corrosion. However, no attempt to
differentiate these effects has been made. In the button cell MCFC, with active electrolyte
management, the decrease in conductivity due to electrolyte loss can be reversed by refilling
fresh electrolyte, and the different degradation effects can thus be quantified.
1.4. Carbon capture and the MCFC The use of MCFC in CCS (Carbon Capture and Storage) applications in combination with
conventional combustion technology is a novel concept which is considered due to its
potential to reduce carbon dioxide emissions from power production. The possibility to
retrofit existing power plants also creates a potential additional market for MCFC. The cell
reaction of the MCFC includes the migration of carbonate ions from the cathode to the anode,
which corresponds to a depletion of CO2 in the oxidant feed gas and a subsequent enrichment
of CO2 in the anode exhaust gas. By feeding the cathode with combustion flue gas the MCFC
can operate as a fuel cell, while concentrating CO2 to the anode exhaust where it can be
separated for removal and storage.
1.4.1. Conventional CCS technologies
Conventional CCS technologies include post- and pre- combustion of the fuel, and oxy fuel
combustion, and are described in [68]. In post-combustion separation the CO2 in flue gases
produced by combustion of the primary fuel in air is separated by employing a liquid organic
solver, normally amine-based. As the CO2 concentration in flue gases from Natural Gas
Combined Cycle (NGCC) and Pulverized Coal (PC) ranges from 3-15%, this makes the
separation process costly in terms of energy.
In pre-combustion processes the CO2 content in the fuel is reduced before combustion by
reforming in steam and air to produce syngas (H2 + CO), and by WGS in a second step to
produce hydrogen and CO2. The CO2 content depends on the composition of the primary fuel,
but is normally around 15-60%, making the separation of hydrogen and CO2 simpler than for
post combustion.
In Oxyfuel-combustion, high purity oxygen instead of air is used in the combustion process,
which leaves mainly CO2 and water in the flue gas. An additional air-separation unit to
produce oxygen from air is necessary, but CO2 concentration is higher than in post- or pre-
combustion, above 80%. The final CO2 separation step in pre- or Oxyfuel combustion is made
14
at high concentration and can be made by a number of alternative technologies, e.g. solid
sorbents, membranes or cryogenic separation.
With conventional CO2 capturing technology, a high degree of CO2 capture can be reached, as
high as 80-90% net capture. However, due to the low concentration in post combustion and
energy demanding pre- treatment processes in pre-combustion the penalty on overall power
plant power production, depending on type of process, can be as high as 10-40%. Post-
combustion separation is used on commercial basis in industrial applications for CO2
production and in CCS demonstration plants. Pre-combustion is used in Integrated
Gasification Combined Cycle (IGCC) and in hydrogen production or in CO2 separation from
raw natural gas. Oxyfuel as a technology is currently in the research/ demonstration phase.
1.4.2. MCFC in CCS-applications
The concept of MCFC integrated power generation and CO2 separation adds two important
features to the CCS infrastructure. First the capture of CO2 can be made at a high
concentration; Case studies estimates that the CO2 concentration at the anode exhaust can be
as high as 80% [13, 69, 70]. Secondly, the addition of the MCFC power output minimizes the
overall penalty on plant efficiency for a comparable reduction in CO2 emissions. Furthermore,
the MCFC system is also benefited by the redundancy of anode exhaust gas recirculation to the
cathode inlet, since CO2 is supplied in the flue gas [11].
However, the concentrations of both CO2 and oxygen in combustion flue gas are significantly
lower than what is used in standard operation of the MCFC, which affects the fuel cell
performance negatively. The tolerance limit for CO2 lean oxidant gas depends on a multitude
of interdepending factors, such as CO2 concentration and utilization factor, current load, flow
rates and cell design. Ultimately, for the use of MCFCs as a CCS application, the operating
conditions and performance are tradeoffs between maximizing a) the fuel cell output, and b)
the CO2 removal.
In system analysis studies of MCFC combined with NGCC [70], and with PC fired power plants
[71], the cathode inlet CO2 concentration ranges from 4-5% to 11-12% respectively. In
experimental studies, Caprile et al.[72] demonstrated that a 125 kW pressurized MCFC could
be operated with CO2 concentration as low as 4% in oxidant gas. However, in another study,
Discepoli et al. [11], using a 55 cm2 single cell, measured a threshold concentration of 8% CO2
below which the fuel cell experienced a drastic drop in performance if combined with low O2
concentration (5%) and high oxidant utilization. Finally, Di Giulio et al. [73] successfully
operated a 10x10 cm2 single cell with as low CO2 concentration as 3%, although the oxidant to
fuel flow ratio was in the order of 30 to 1, which is considerably higher than what is possible
in the lab scale MCFC used in this work.
The limited experimental work which has been performed on MCFC in CCS conditions
highlights the need for fundamental research on the tolerance limits for operating MCFC with
CO2 lean oxidant gas.
15
1.5. MCFC in power to gas Production of hydrogen and syngas (H2 + CO) are considered to be an integral part of the
future energy system, especially important in the transportation sector. Hydrogen serves as
an energy carrier for Fuel Cell Electric Vehicles (FCEV), and syngas is used as raw material for
production of synthetic liquid fuels by Fisher-Tropsch synthesis [74]. However, these fuels are
traditionally produced from reforming natural gas, which limits the CO2 reduction from a
well-to-wheel perspective compared to the use of renewable energy sources [75].
As an alternative to reformed natural gas, hydrogen and syngas can be produced by means of
high temperature electrolysis. In high temperature electrolysis, electricity and heat is used for
production of clean hydrogen or for co-electrolysis of steam and CO2 to produce syngas. The
reversible SOFC, also known as SOEC (Solid Oxide Electrolysis Cell), is considered to be a
promising candidate for high temperature electrolysis [14]. The SOEC is restricted to
temperatures around 1000oC due to high polarization in the electrolyte and at the electrodes
at lower temperatures, but a lower operational temperature is desirable from material
perspective as well as from the aspect of utilizing waste heat. Currently, research efforts are
being made to develop new materials for high performance electrodes and electrolytes [76].
Electrochemical reduction of CO2 to CO in molten carbonate has been suggested as a method
to produce raw material for synthetic fuels, and is seen as attractive due to that the CO2 and
the electrolysis products CO and O2 are not mixed. Kaplan et al. [77, 78] studied CO2 reduction
in Li2CO3 at 900oC, using graphite anode and Ti cathode. However, molten carbonate reduction
of CO2 has proven to be challenging due to the corrosive environment, and due to deactivation
of the CO2 reduction electrode by carbon deposition.
Furthermore, renewable energy sources are often intermittent in their production, which has
already proven to affect the electricity market in regions with low regulatory production. The
concept of power to gas means that flexible units for high temperature electrolysis can
operate in periods with high power production and low demand to increase the profitability
of hydrogen-production.
The use of MCFC for high temperature electrolysis is a novel application. In a nomenclature
corresponding to the SOEC, the concept of reversible MCFC can be denoted MCEC (Molten
Carbonate Electrolysis Cell). The MCEC operates at lower temperature than the SOEC, which
results in a higher power to heat ratio, however, the MCFC is more technically mature as a fuel
cell technology, which is beneficial from a cost perspective. The feasibility of the MCEC is
virtually untried, why studying the electrochemical performance of an MCEC in a standard
MCFC set-up is of great interest.
16
1.6. The MCFC-CONTEX project This work was performed within the MCFC-CONTEX project, which stands for MCFC catalyst
and stack component degradation and lifetime: Fuel Gas CONTaminant effects and EXtraction
strategies. The MCFC-CONTEX project focuses on the entire chain of fuel-to-energy, which
include gas cleaning, online contaminant detection, and fuel cell performance and
degradation. This work was performed under Work Package 2 which is focused on studies of
MCFC performance and degradation, especially in relation to sulfurous contaminants in fuel
gas and in air-mix used as oxidant gas in the highly innovative application area of CO2
separation. The MCFC_CONTEX project is financed under the program of FCH-JU 2008-01,
Collaborative Project no. 245171.
1.7. Aim of this work The aim of this work has been: Firstly, to identify direct damage effects of sulphur
contaminants, for both anode- and cathode side, on fuel cell performance decay and to
investigate possibilities for regeneration of poisoned components. Secondly, to analyze the
sensitivity of button cell performance to CO2 lean flue gas, and to evaluate the performance
degradation caused by SO2 in flue gas, to find suitable operational conditions for MCFC as a
CCS application.
This has been made by finding suitable conditions for fuel cell testing which simulate
combustion flue gas in fuel cell applications and to study the performance and degradation of
MCFC from sulfur contaminants.
Finally, the aim has been to investigate the technical feasibility of operating the MCFC in
reversible mode (MCEC). This has performed by electrochemical characterization of a
standard lab-scale MCFC operated as a current load.
17
2. Experimental
2.1. Testing procedures for electrochemical
measurements Electrochemical measurements were performed in a button cell. The performance was
characterized by polarization measurements and electrochemical impedance spectroscopy.
2.1.1. The button cell set-up
Measurements have been performed on circular button cells with a geometrical area of 3 cm2,
operated at atmospheric pressure and at a temperature of 650oC. The cell housing and gas
supply tubes are made of alumina and the cell is contained inside a cylindrical furnace, with
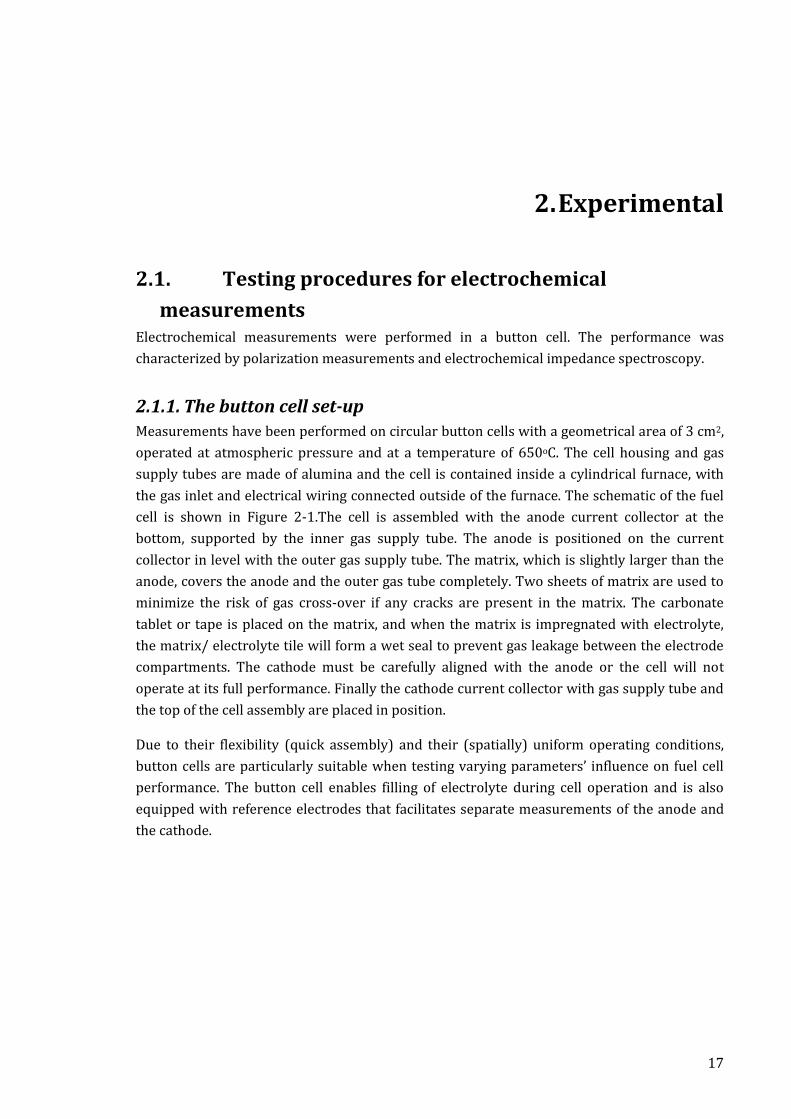
the gas inlet and electrical wiring connected outside of the furnace. The schematic of the fuel
cell is shown in Figure 2-1.The cell is assembled with the anode current collector at the
bottom, supported by the inner gas supply tube. The anode is positioned on the current
collector in level with the outer gas supply tube. The matrix, which is slightly larger than the
anode, covers the anode and the outer gas tube completely. Two sheets of matrix are used to
minimize the risk of gas cross-over if any cracks are present in the matrix. The carbonate
tablet or tape is placed on the matrix, and when the matrix is impregnated with electrolyte,
the matrix/ electrolyte tile will form a wet seal to prevent gas leakage between the electrode
compartments. The cathode must be carefully aligned with the anode or the cell will not
operate at its full performance. Finally the cathode current collector with gas supply tube and
the top of the cell assembly are placed in position.
Due to their flexibility (quick assembly) and their (spatially) uniform operating conditions,
button cells are particularly suitable when testing varying parameters’ influence on fuel cell
performance. The button cell enables filling of electrolyte during cell operation and is also
equipped with reference electrodes that facilitates separate measurements of the anode and
the cathode.
18
Figure 2-1. The button cell experimental set-up in cross-section.
The gases to anode and cathode are fed perpendicularly to the electrode surfaces, through
holes evenly distributed in the current collectors. The flow rates can be varied up to a couple
of hundreds ml per min, and typically flow rates of about 150 ml min-1 are used in order to
avoid external mass transfer limitations and to maintain uniform conditions throughout the
whole cell. Humidification of gases is controlled with a bubbler at a set temperature.
2.1.2. Electrodes
The anode and cathode are cut to 3 cm2 circular plates from the sheets of electrode material.
The electrode material was supplied from Ansaldo Fuel Cells (Italy) in paper A and D. In paper
B and C, electrode material from Ansaldo and KIST (South Korea) was used. The cathode is
metallic Ni when assembling the fuel cell, and is in-situ oxidized and lithiated during the start-
up sequence. The characteristics of the electrodes and assembly used in the fuel cell are
shown in Table 2-1.

19
Table 2-1. Button cell material data.
Characteristics of unit cell components Button cell
Cell frame material Ceramic
Size anode side current collector 3cm2
Material anode side current collector Ni
Size cathode side current collector 3cm2
Material cathode side current collector SUS-316 L
Characteristics of fuel cell components KIST Ansaldo
Anode
Thickness (mm) 0.69 0.60
Porosity 55-60% 54%
Material Ni + 5%wt Al Ni + 5%wt Cr
Cathode
Thickness (mm) 0.70 0.60
Porosity 60-65% 77%
Material Lithiated NiO Lithiated NiO
Electrolyte
Material (Li/K)2CO3 (mole% 62/38) (Li/K)2CO3 (mole% 62/38)
Fabrication Tape cast Pressed pellet
Matrix
Material γ-LiAlO2 γ-LiAlO2
Thickness (mm) 2 x 0.3 2 x 0.25
2.1.3. Current collectors
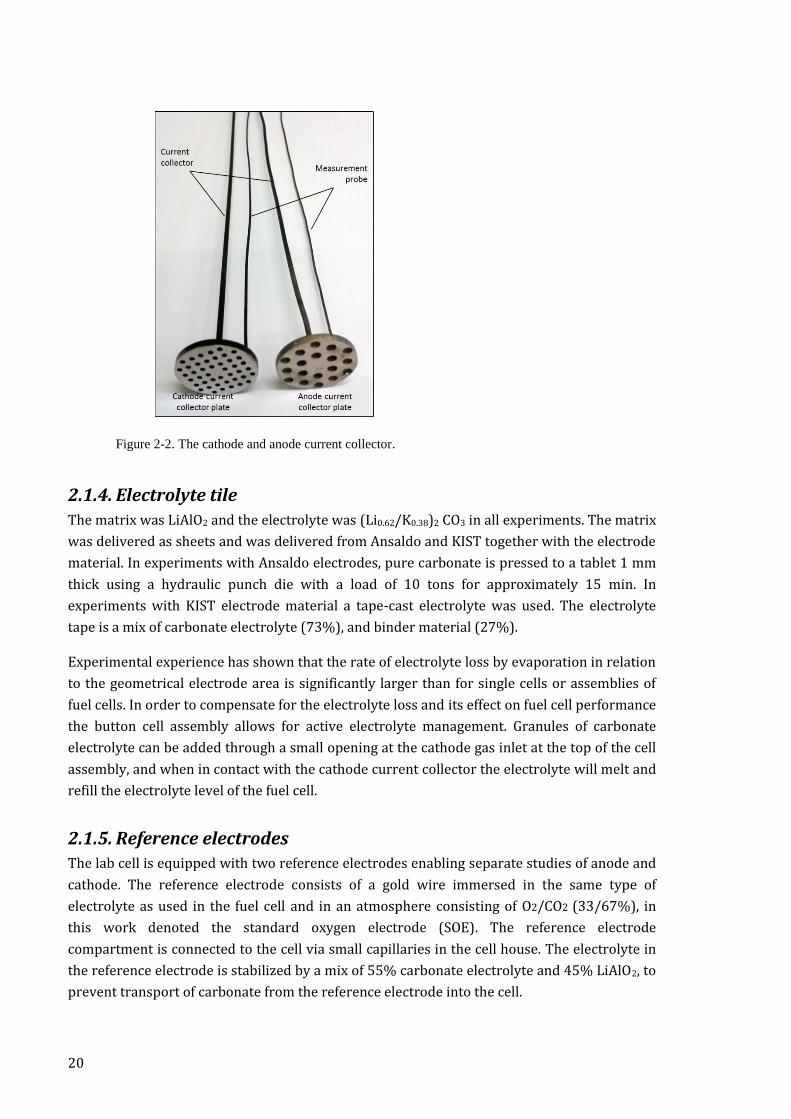
The current collectors are made in-house of nickel and stainless steel for anode and cathode
side respectively. Current collectors are made of 3 cm2 circular plates with drilled holes which
allow feed gases to access the gas diffusion electrodes. The current collectors have separate
current leads and measure probes making four-point measurements possible. The current
collectors are polished with grade 1200 abrasive paper and washed in acetone before
assembled in the fuel cell. Current collector plates from the electrode manufacturers were
provided, however, they were not feasible to use in the button cell as the current collector
plates were too thin to weld current leads and sense probes onto. In-house made current
collectors were used in all tests instead of the provided material. The design of the current
collectors can be seen in Figure 2-2.
20
Figure 2-2. The cathode and anode current collector.
2.1.4. Electrolyte tile
The matrix was LiAlO2 and the electrolyte was (Li0.62/K0.38)2 CO3 in all experiments. The matrix
was delivered as sheets and was delivered from Ansaldo and KIST together with the electrode
material. In experiments with Ansaldo electrodes, pure carbonate is pressed to a tablet 1 mm
thick using a hydraulic punch die with a load of 10 tons for approximately 15 min. In
experiments with KIST electrode material a tape-cast electrolyte was used. The electrolyte
tape is a mix of carbonate electrolyte (73%), and binder material (27%).
Experimental experience has shown that the rate of electrolyte loss by evaporation in relation
to the geometrical electrode area is significantly larger than for single cells or assemblies of
fuel cells. In order to compensate for the electrolyte loss and its effect on fuel cell performance
the button cell assembly allows for active electrolyte management. Granules of carbonate
electrolyte can be added through a small opening at the cathode gas inlet at the top of the cell
assembly, and when in contact with the cathode current collector the electrolyte will melt and
refill the electrolyte level of the fuel cell.
2.1.5. Reference electrodes
The lab cell is equipped with two reference electrodes enabling separate studies of anode and
cathode. The reference electrode consists of a gold wire immersed in the same type of
electrolyte as used in the fuel cell and in an atmosphere consisting of O2/CO2 (33/67%), in
this work denoted the standard oxygen electrode (SOE). The reference electrode
compartment is connected to the cell via small capillaries in the cell house. The electrolyte in
the reference electrode is stabilized by a mix of 55% carbonate electrolyte and 45% LiAlO2, to
prevent transport of carbonate from the reference electrode into the cell.
21
2.1.6. Start-up sequence of the MCFC
The start-up and conditioning of the fuel cell is composed of several steps. The first step is
under air, to burn off any binder material in the cell parts, with gradually inclining
temperature to just below the melting point of the electrolyte (m.p. 491oC). The second step is
at constant temperature under N2 or CO2. During the third step the temperature is increased
to operating temperature and the gases are changed to standard anode and cathode gas, and a
mechanical load of 3 kg is applied. When the electrolyte liquefies it will impregnate the matrix
and porous electrodes, and the cathode is oxidized and lithiated in contact with the molten
carbonate. After the start-up procedure is finished, the fuel cell is conditioned by applying a
constant load of 100mA cm-2 for approximately one week, until a steady state performance
has been confirmed.
2.1.7. Polarization curves
Electrochemical performance was evaluated with polarization measurements (IV-curves),
using a Solarton 1287 potentiostat. The polarization curves are performed with either
galvanostatic (i.e. constant current) or potentiostatic (i.e. constant voltage) steps. The current
interrupt technique is used to separate the ohmic losses from the polarization losses inside
the fuel cell, and to produce iR-corrected polarization curves. The purely ohmic contribution
to resistance is calculated from the instantaneous voltage drop after current is shut off,
according to Ohm’s law. Such ohmic factors are contact resistances in the interfaces between
electrode and current collector, and polarization in the electrodes and electrolyte due to
conductivity of the electrode material and electrolyte. Current interrupt is performed by a
programmable function of the potentiostat, and the duration of current interrupt was 27 µs.
2.1.8. Electrochemical Impedance Spectroscopy
Electrochemical Impedance Spectroscopy (EIS) was performed by applying a small voltage
perturbation of 10 mV to the cell at steady state with changing frequency, normally in a range
of 10 kHz to 10 mHz. This can be made in Open Circuit Voltage (OCV) or with an applied
potentiostatic offset. A frequency response analyzer (FRA), Solartron 1255, was used to
measure the current response to the change in voltage and to calculate the impedance of the
fuel cell. The impedance is normally presented in so-called Nyquist- or Bode-plots, in which
the imaginary part of the impedance is plotted against the real part or against the frequency of
the perturbation. The impedance spectra can reveal various physical properties in the fuel
cell. First, the ohmic resistance can be identified in the high frequency region, where the
imaginary part of the Nyquist-diagram is zero. Second, effects of kinetics, i.e. charge transfer
resistance, and mass transfer, i.e. diffusion resistance can be identified as separate semi-arcs
at high and low frequency. Third, the polarization resistance can be identified as the length of
the curve on the real axis. However, depending on what system is studied, and how detailed
models there are to explain a system, much more information can be extracted.
22
2.1.9. Humidification of gases
Humidification of anode and cathode gases is made by passing the feed gas through a bubble
humidifier with a set temperature. The feed gas is assumed to be fully saturated when passing
through the humidifier. The water content is determined through the tabulated value of
saturated air in a standard Mollier chart. The water mole fraction in moist air (𝑋𝐻2𝑂) and
moist content (𝑥𝐻2𝑂) can be calculated from the relative humidity (𝑅𝐻), the saturation
pressure for steam (𝑝𝑠𝑎𝑡) at a certain temperature of the humidifier, the humidifier pressure
(𝑝𝑎𝑚𝑏), and the individual gas constants of air and water vapor (𝑅𝑖) (equations 4 and 5).
𝑥𝐻2𝑂 =𝑅𝐴𝑖𝑟
𝑅𝑤
𝑝𝑠𝑎𝑡
𝑝𝑎𝑚𝑏−𝑝𝑠𝑎𝑡 (4)
𝑋𝐻2𝑂 = 𝑅𝐻⋅𝑝𝑠𝑎𝑡
𝑝𝑎𝑚𝑏 (5)
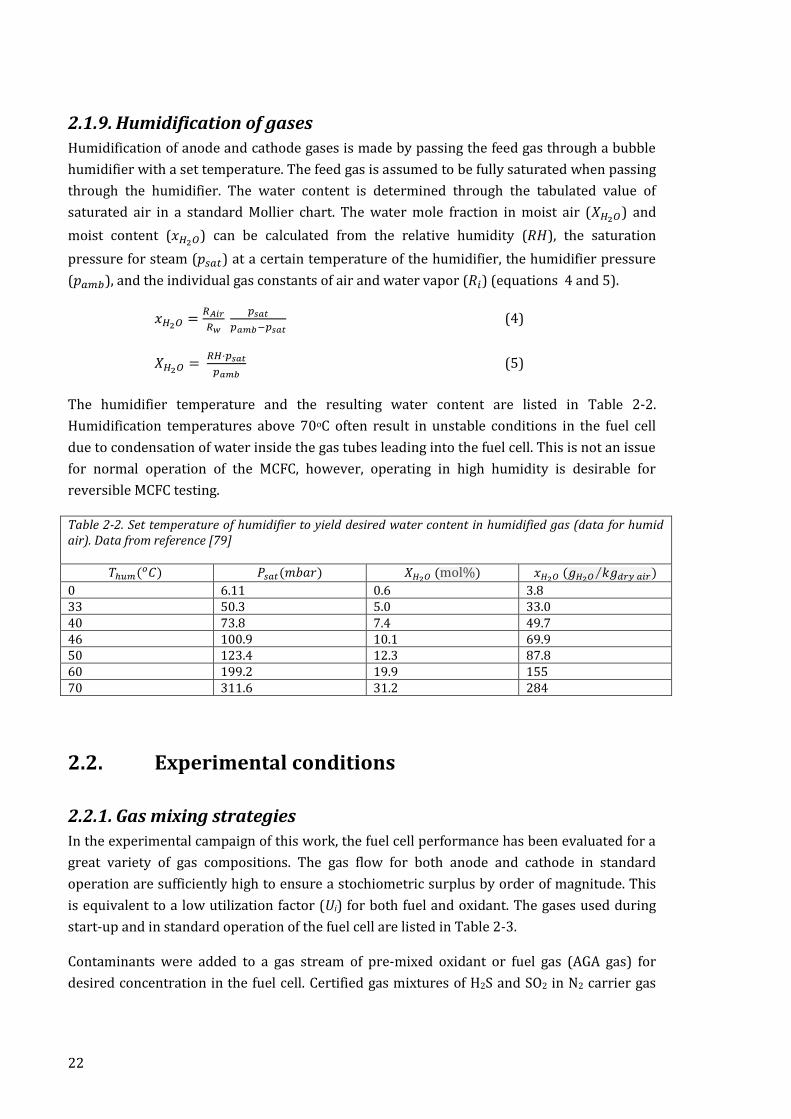
The humidifier temperature and the resulting water content are listed in Table 2-2.
Humidification temperatures above 70oC often result in unstable conditions in the fuel cell
due to condensation of water inside the gas tubes leading into the fuel cell. This is not an issue
for normal operation of the MCFC, however, operating in high humidity is desirable for
reversible MCFC testing.
Table 2-2. Set temperature of humidifier to yield desired water content in humidified gas (data for humid air). Data from reference [79]
𝑇ℎ𝑢𝑚(𝑜𝐶) 𝑃𝑠𝑎𝑡(𝑚𝑏𝑎𝑟) 𝑋𝐻2𝑂 (mol%) 𝑥𝐻2𝑂 (𝑔𝐻2𝑂 𝑘𝑔𝑑𝑟𝑦 𝑎𝑖𝑟⁄ )
0 6.11 0.6 3.8 33 50.3 5.0 33.0 40 73.8 7.4 49.7 46 100.9 10.1 69.9 50 123.4 12.3 87.8 60 199.2 19.9 155 70 311.6 31.2 284
2.2. Experimental conditions
2.2.1. Gas mixing strategies
In the experimental campaign of this work, the fuel cell performance has been evaluated for a
great variety of gas compositions. The gas flow for both anode and cathode in standard
operation are sufficiently high to ensure a stochiometric surplus by order of magnitude. This
is equivalent to a low utilization factor (Ui) for both fuel and oxidant. The gases used during
start-up and in standard operation of the fuel cell are listed in Table 2-3.
Contaminants were added to a gas stream of pre-mixed oxidant or fuel gas (AGA gas) for
desired concentration in the fuel cell. Certified gas mixtures of H2S and SO2 in N2 carrier gas
23
(AGA gas) in concentrations of approximately a hundred to a few hundreds of ppm was used.
To maintain a constant total flow rate when changing the contaminant level, or when clean
gas was used, the contaminant flow was balanced with a second flow of pure N2. The
contaminant feed was added to the anode and cathode gas stream after humidification to
avoid desulfurization, as sulfur compounds are easily scrubbed out of the gas by dissolution
into the humidifier water.
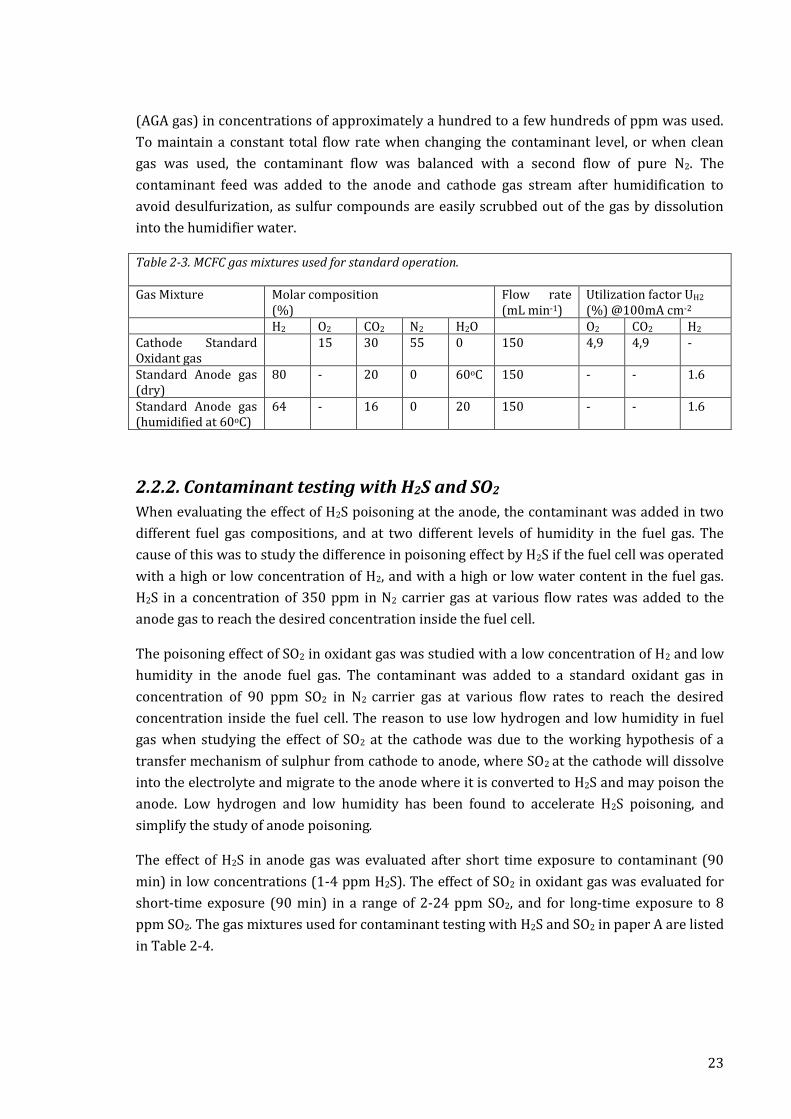
Table 2-3. MCFC gas mixtures used for standard operation.
Gas Mixture Molar composition (%)
Flow rate (mL min-1)
Utilization factor UH2 (%) @100mA cm-2
H2 O2 CO2 N2 H2O O2 CO2 H2
Cathode Standard Oxidant gas
15 30 55 0 150 4,9 4,9 -
Standard Anode gas (dry)
80 - 20 0 60oC 150 - - 1.6
Standard Anode gas (humidified at 60oC)
64 - 16 0 20 150 - - 1.6
2.2.2. Contaminant testing with H2S and SO2
When evaluating the effect of H2S poisoning at the anode, the contaminant was added in two
different fuel gas compositions, and at two different levels of humidity in the fuel gas. The
cause of this was to study the difference in poisoning effect by H2S if the fuel cell was operated
with a high or low concentration of H2, and with a high or low water content in the fuel gas.
H2S in a concentration of 350 ppm in N2 carrier gas at various flow rates was added to the
anode gas to reach the desired concentration inside the fuel cell.
The poisoning effect of SO2 in oxidant gas was studied with a low concentration of H2 and low
humidity in the anode fuel gas. The contaminant was added to a standard oxidant gas in
concentration of 90 ppm SO2 in N2 carrier gas at various flow rates to reach the desired
concentration inside the fuel cell. The reason to use low hydrogen and low humidity in fuel
gas when studying the effect of SO2 at the cathode was due to the working hypothesis of a
transfer mechanism of sulphur from cathode to anode, where SO2 at the cathode will dissolve
into the electrolyte and migrate to the anode where it is converted to H2S and may poison the
anode. Low hydrogen and low humidity has been found to accelerate H2S poisoning, and
simplify the study of anode poisoning.
The effect of H2S in anode gas was evaluated after short time exposure to contaminant (90
min) in low concentrations (1-4 ppm H2S). The effect of SO2 in oxidant gas was evaluated for
short-time exposure (90 min) in a range of 2-24 ppm SO2, and for long-time exposure to 8
ppm SO2. The gas mixtures used for contaminant testing with H2S and SO2 in paper A are listed
in Table 2-4.
24
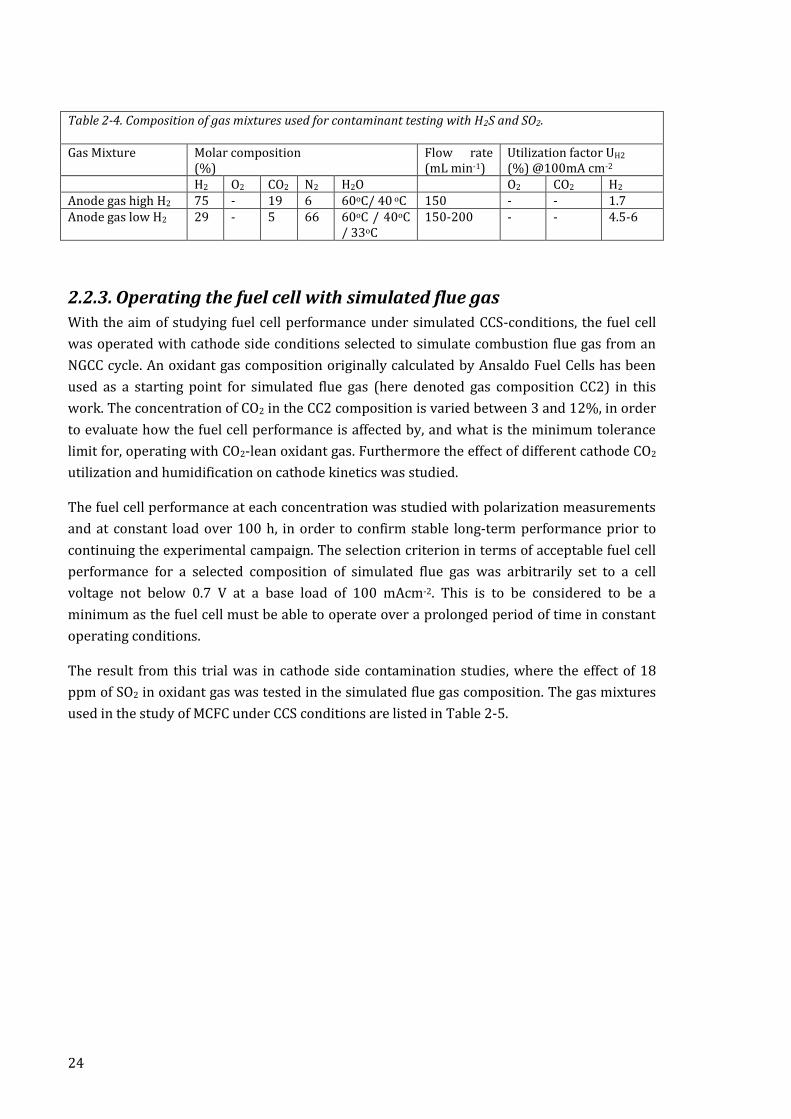
Table 2-4. Composition of gas mixtures used for contaminant testing with H2S and SO2.
Gas Mixture Molar composition (%)
Flow rate (mL min-1)
Utilization factor UH2 (%) @100mA cm-2
H2 O2 CO2 N2 H2O O2 CO2 H2 Anode gas high H2 75 - 19 6 60oC/ 40 oC 150 - - 1.7 Anode gas low H2 29 - 5 66 60oC / 40oC
/ 33oC 150-200 - - 4.5-6
2.2.3. Operating the fuel cell with simulated flue gas
With the aim of studying fuel cell performance under simulated CCS-conditions, the fuel cell
was operated with cathode side conditions selected to simulate combustion flue gas from an
NGCC cycle. An oxidant gas composition originally calculated by Ansaldo Fuel Cells has been
used as a starting point for simulated flue gas (here denoted gas composition CC2) in this
work. The concentration of CO2 in the CC2 composition is varied between 3 and 12%, in order
to evaluate how the fuel cell performance is affected by, and what is the minimum tolerance
limit for, operating with CO2-lean oxidant gas. Furthermore the effect of different cathode CO2
utilization and humidification on cathode kinetics was studied.
The fuel cell performance at each concentration was studied with polarization measurements
and at constant load over 100 h, in order to confirm stable long-term performance prior to
continuing the experimental campaign. The selection criterion in terms of acceptable fuel cell
performance for a selected composition of simulated flue gas was arbitrarily set to a cell
voltage not below 0.7 V at a base load of 100 mAcm-2. This is to be considered to be a
minimum as the fuel cell must be able to operate over a prolonged period of time in constant
operating conditions.
The result from this trial was in cathode side contamination studies, where the effect of 18
ppm of SO2 in oxidant gas was tested in the simulated flue gas composition. The gas mixtures
used in the study of MCFC under CCS conditions are listed in Table 2-5.
25
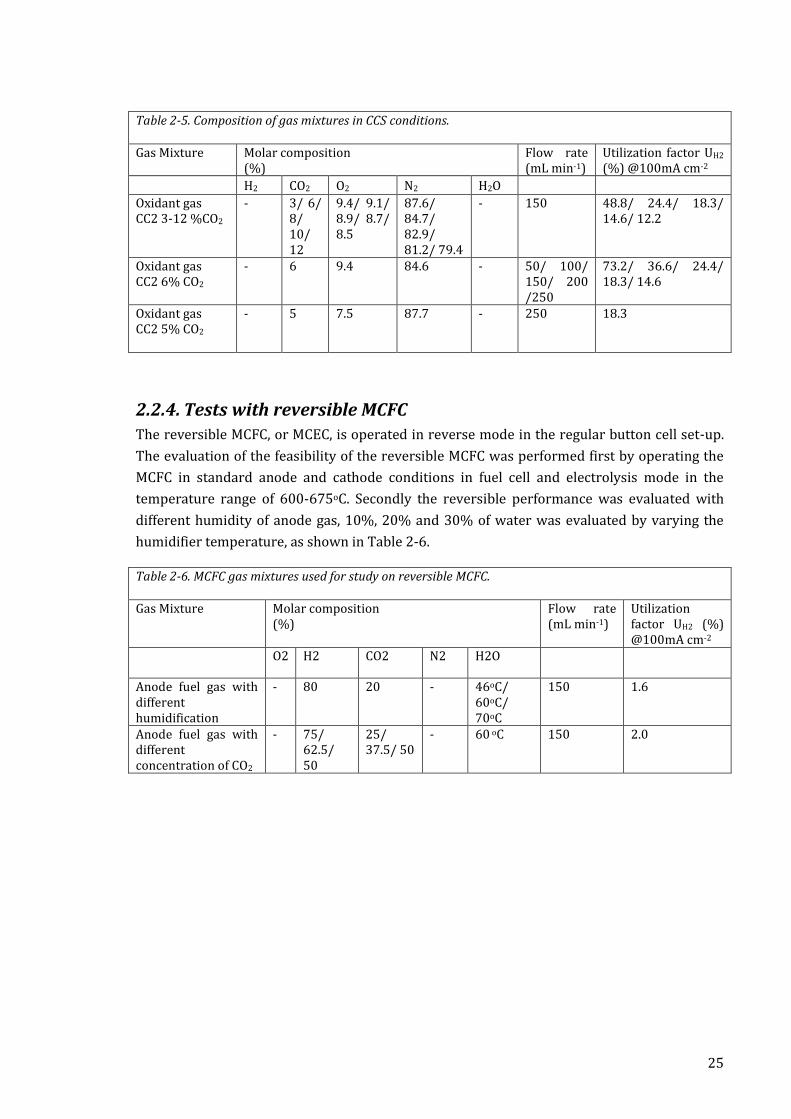
Table 2-5. Composition of gas mixtures in CCS conditions.
Gas Mixture Molar composition (%)
Flow rate (mL min-1)
Utilization factor UH2 (%) @100mA cm-2
H2 CO2 O2 N2 H2O
Oxidant gas CC2 3-12 %CO2
- 3/ 6/ 8/ 10/ 12
9.4/ 9.1/ 8.9/ 8.7/ 8.5
87.6/ 84.7/ 82.9/ 81.2/ 79.4
- 150 48.8/ 24.4/ 18.3/ 14.6/ 12.2
Oxidant gas CC2 6% CO2
- 6 9.4 84.6 - 50/ 100/ 150/ 200 /250
73.2/ 36.6/ 24.4/ 18.3/ 14.6
Oxidant gas CC2 5% CO2
- 5 7.5 87.7 - 250 18.3
2.2.4. Tests with reversible MCFC
The reversible MCFC, or MCEC, is operated in reverse mode in the regular button cell set-up.
The evaluation of the feasibility of the reversible MCFC was performed first by operating the
MCFC in standard anode and cathode conditions in fuel cell and electrolysis mode in the
temperature range of 600-675oC. Secondly the reversible performance was evaluated with
different humidity of anode gas, 10%, 20% and 30% of water was evaluated by varying the
humidifier temperature, as shown in Table 2-6.
Table 2-6. MCFC gas mixtures used for study on reversible MCFC.
Gas Mixture Molar composition (%)
Flow rate (mL min-1)
Utilization factor UH2 (%) @100mA cm-2
O2 H2 CO2 N2 H2O
Anode fuel gas with different humidification
- 80 20 - 46oC/ 60oC/ 70oC
150 1.6
Anode fuel gas with different concentration of CO2
- 75/ 62.5/ 50
25/ 37.5/ 50
- 60 oC 150 2.0

26

27
3. Results and discussion
3.1. Fuel cell degradation by sulfur contaminants Sulfur contaminant in fuel gas, especially H2S, is of major concern for the use of MCFC, as the
tolerance limit is considered to be as low as 1 ppm. However, for the use of MCFC as a CO2
concentrator device in CCS applications, also SO2 contaminant in oxidant gas is a critical issue.
The link between the two poisoning agents is the transfer mechanism of sulfur from cathode
to anode, which is assumed to contribute to the anode side poisoning. With the aim of
elucidating the effect of this transfer mechanism on the direct poisoning of the fuel cell, the
cell was exposed to 8 ppm of SO2 in the oxidant gas for 100 h. The cell was kept at a load of
100 mA cm-2 during the test period. In order to accelerate any effect on the anode side the fuel
gas composition used was low in H2 (29%) and also the humidification temperature was low
(40oC). The performance was measured continuously with I-V curves before, during, and after
the addition of SO2. Figure 3-1 show the cell voltage together with anode and cathode
measured separately; at OCV and at 100, 200 and 300 mA cm-2. The degradation in cell voltage
(Figure 3-1a) can be seen to progress during the extent of the time of exposure to SO2, with a
stronger effect at higher current density. When the oxidant gas is switched to clean gas the cell
voltage is only regenerated to a small extent, despite operating in such conditions for more
than 100 h. The regeneration of the cell voltage is smaller than expected from studies of low
concentrations of H2S in fuel gas, however, low hydrogen and low water content has been
shown to effectively reduce the voltage regeneration [59].
The anode and cathode potentials vs. SOE were measured in parallel with the cell voltage. The
effect of SO2 in oxidant gas is clearly seen on the anode (Figure 3-1b), and on the cathode
(Figure 3-1c). The anodic potential shows a larger effect of regeneration than what can be
seen for the cell, which is explained by the cathode potential which shows a continuously
decreasing trend at all current densities even after changing to clean gas. In Figure 3-2 it can
be seen that the cell polarization during the 100 h of exposure to 8 ppm SO2 increases with
exposure time to SO2 and is more pronounced at higher current density. The cathodic
contribution to the voltage degradation is increasing linearly with exposure time, while the
anodic contribution is accelerated with high current density and longer exposure time. The
effect on the anodic potential clearly indicates a poisoning effect, and a transfer of sulfur from
cathode to anode. This is assumed to progress through dissolution of SO2 and formation of
sulfate ions in the electrolyte (reaction 1.18), which migrates to the anode side where they are
converted to H2S.
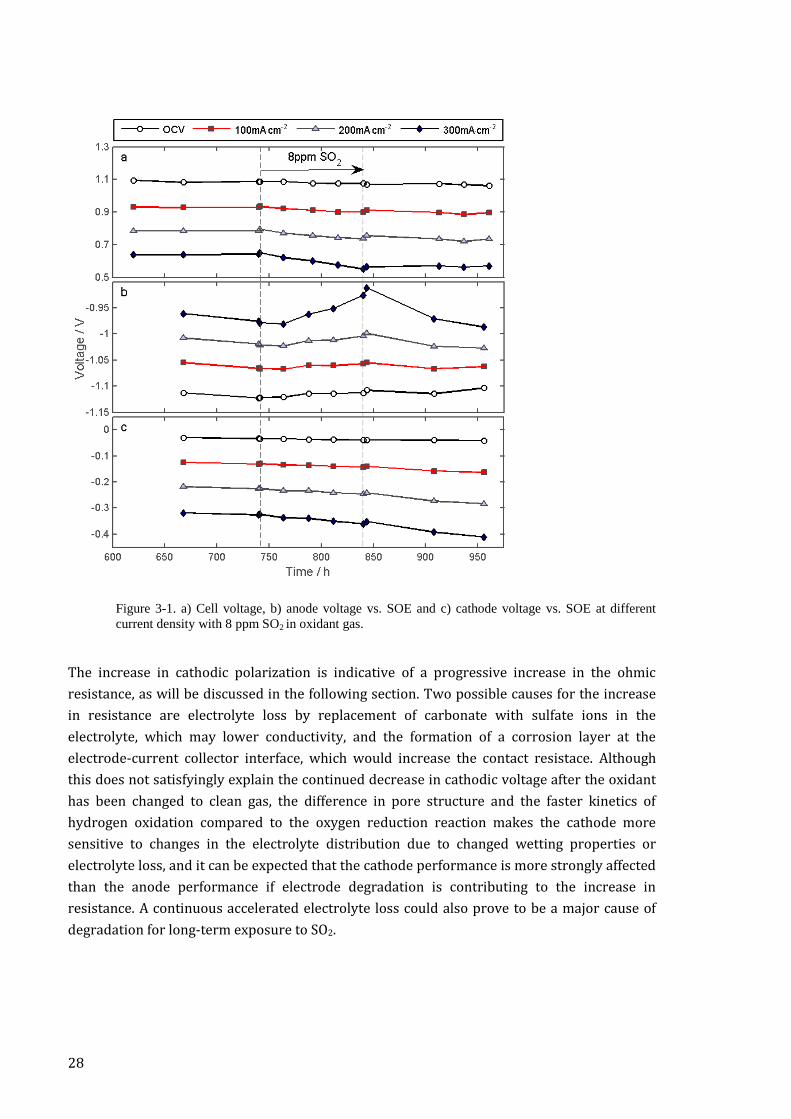
28
Figure 3-1. a) Cell voltage, b) anode voltage vs. SOE and c) cathode voltage vs. SOE at different
current density with 8 ppm SO2 in oxidant gas.
The increase in cathodic polarization is indicative of a progressive increase in the ohmic
resistance, as will be discussed in the following section. Two possible causes for the increase
in resistance are electrolyte loss by replacement of carbonate with sulfate ions in the
electrolyte, which may lower conductivity, and the formation of a corrosion layer at the
electrode-current collector interface, which would increase the contact resistace. Although
this does not satisfyingly explain the continued decrease in cathodic voltage after the oxidant
has been changed to clean gas, the difference in pore structure and the faster kinetics of
hydrogen oxidation compared to the oxygen reduction reaction makes the cathode more
sensitive to changes in the electrolyte distribution due to changed wetting properties or
electrolyte loss, and it can be expected that the cathode performance is more strongly affected
than the anode performance if electrode degradation is contributing to the increase in
resistance. A continuous accelerated electrolyte loss could also prove to be a major cause of
degradation for long-term exposure to SO2.
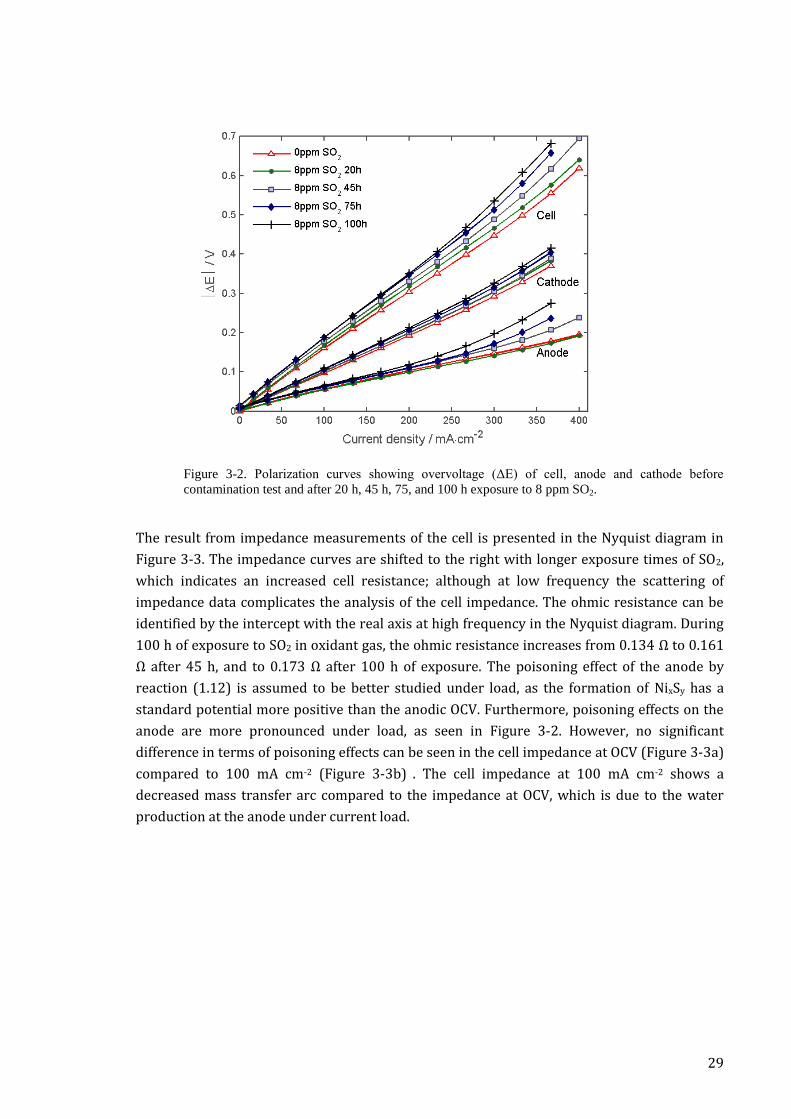
29
Figure 3-2. Polarization curves showing overvoltage (ΔE) of cell, anode and cathode before
contamination test and after 20 h, 45 h, 75, and 100 h exposure to 8 ppm SO2.
The result from impedance measurements of the cell is presented in the Nyquist diagram in
Figure 3-3. The impedance curves are shifted to the right with longer exposure times of SO2,
which indicates an increased cell resistance; although at low frequency the scattering of
impedance data complicates the analysis of the cell impedance. The ohmic resistance can be
identified by the intercept with the real axis at high frequency in the Nyquist diagram. During
100 h of exposure to SO2 in oxidant gas, the ohmic resistance increases from 0.134 Ω to 0.161
Ω after 45 h, and to 0.173 Ω after 100 h of exposure. The poisoning effect of the anode by
reaction (1.12) is assumed to be better studied under load, as the formation of NixSy has a
standard potential more positive than the anodic OCV. Furthermore, poisoning effects on the
anode are more pronounced under load, as seen in Figure 3-2. However, no significant
difference in terms of poisoning effects can be seen in the cell impedance at OCV (Figure 3-3a)
compared to 100 mA cm-2 (Figure 3-3b) . The cell impedance at 100 mA cm-2 shows a
decreased mass transfer arc compared to the impedance at OCV, which is due to the water
production at the anode under current load.

30
Figure 3-3. Nyquist diagram of cell impedance at a) OCV and b) 100 mA∙cm-2
, after different
exposure time to 8 ppm SO2 in oxidant gas. (○ 2.5 kHz, Δ 250 Hz, □ 25 Hz ◊2.5 Hz)
The short-term exposure to contaminant tests were performed with increased levels of SO2 (2,
4, 6, 8, 12, 18 and 24 ppm). Polarization curves are shown in Figure 3-4. The effect on cell
performance of SO2 in concentration lower than 12 ppm for as short time as 90 min was
negligible, and thus this data is omitted. When the SO2 concentration was increased to 18 ppm
and 24 ppm at a current density of 230 mA cm-2 the voltage drop compared to clean gas was
ΔEcell = 15 mV and 30 mV, respectively (Figure 3-4). When comparing the I-V curves for the
separate electrodes, it must first be mentioned that the reference electrode measurements
contributes to a small difference between the summation of the anodic and cathodic voltage
and the measured cell voltage. A possible explanation to this is the different exposure time for
cell and electrode measurements, as explained in the experimental procedure. However, it can
be concluded that the increase in anode polarization at 230 mA cm-2 with 18 ppm and 24 ppm
of SO2 compared to clean gas is larger than the increase in cathode polarization; ΔEan = +15 mV
and +30 mV compared to ΔEcat = -7 mV and -15 mV (Figure 3-4). The effect on the anodic
polarization is increasingly nonlinear above 100 mA cm-2 with 24 ppm of SO2 in oxidant gas,
which can be interpreted as the result of the concentration- and voltage dependent formation
of NixSy (reaction 1.12). After regeneration with clean gas for 20 h after exposure to 24 ppm of
SO2 for 90 min no remaining poisoning effect can be seen for the cell (Figure 3-4).

31
Figure 3-4. Polarization curves showing overvoltage (ΔE) of cell, anode and cathode with different
concentration of SO2 added in oxidant gas for 90 min. Regeneration with clean gas 20 h.
Figure 3-5 shows the cell voltage as a function of time during the exposure to 12, 18 and 24
ppm of SO2 and the following regeneration period. It can be seen that the rate of voltage decay
is increasing with higher concentration of SO2, but also that the voltage decay continues after
changing to clean gas for approximately the same time as the contamination period, before the
voltage is recuperated to a steady state value. This is interpreted to be an effect of
accumulated sulfate in the electrolyte which causes a delayed poisoning effect at the anode by
conversion to H2S according to the reversed reaction (1.9). The poisoning effect on the anode
is eventually reduced, as the concentration of sulfate in the electrolyte decreases and no more
H2S can be produced. Up to 12 ppm SO2 the rate of sulfate formation is not sufficient to raise
the concentration of H2S at the anode above the level where a poisoning effect is visible, and
thus no such effect is seen for the following regeneration with clean gas.

32
Figure 3-5. Cell voltage at constant load 100 mA cm-2
during exposure to 12, 18 and 24 ppm of SO2
in oxidant gas for 90 min, and the following regeneration with clean gas.
The result of the short-term contamination tests differs from that of long term exposure tests
both in the concentration at which the addition of SO2 in oxidant gas has a clearly negative
effect on cell performance, and in terms of the effect of cell regeneration. In the first
perspective, it is expected that extended exposure time results in more severe poisoning, as
sulfate dissolved into the electrolyte would accumulate in the electrolyte and create an
increasingly more harmful atmosphere at the anode. The anode polarization was effectively
regenerated with clean gas, both after long-term and short-term poisoning. This is in
agreement with was has been found in studies of poisoning of MCFC anodes by H2S in biogas
simulated fuel gas [32, 64]. However, in contrast to long-term contamination tests, no effect
was seen on the cathode after short-term contamination and regeneration with clean gas.
The effect of adding 1-4 ppm of H2S to the anode gas was tested with different anode gas
compositions with the purpose of comparing the effect of SO2 at the cathode and H2S at the
anode. The poisoning effect was measured for one composition with high concentration of H2
(75% H2, 19% CO2 and 6% N2), and one composition which was diluted with nitrogen (29%
H2, 5% CO2 and 66% N2). The anode gas was humidified at 60oC. The H2 concentration in the
anode gas affects the poisoning of the anode by changing the H2/H2S partial pressure ratio,
which is important for the competing reactions (1.9 and 1.14) A low H2 concentration will
simplify the formation of nickel sulfide and accelerate the degradation of the anode. The
polarization curves are shown in Figure 3-6. In contamination tests with the high H2
composition of anode gas, no significant effect can be seen on the polarization of the cell in the
concentrations tested. In order to accelerate the poisoning effect at low concentration of H2S,
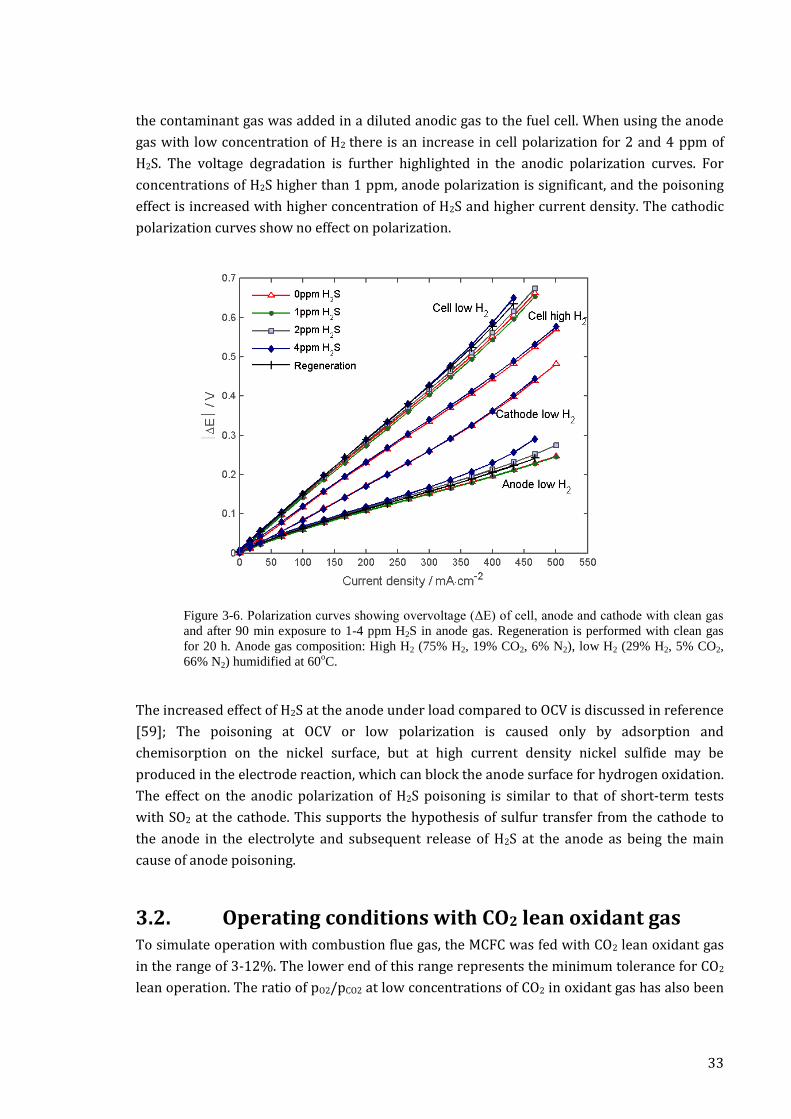
33
the contaminant gas was added in a diluted anodic gas to the fuel cell. When using the anode
gas with low concentration of H2 there is an increase in cell polarization for 2 and 4 ppm of
H2S. The voltage degradation is further highlighted in the anodic polarization curves. For
concentrations of H2S higher than 1 ppm, anode polarization is significant, and the poisoning
effect is increased with higher concentration of H2S and higher current density. The cathodic
polarization curves show no effect on polarization.
Figure 3-6. Polarization curves showing overvoltage (ΔE) of cell, anode and cathode with clean gas
and after 90 min exposure to 1-4 ppm H2S in anode gas. Regeneration is performed with clean gas
for 20 h. Anode gas composition: High H2 (75% H2, 19% CO2, 6% N2), low H2 (29% H2, 5% CO2,
66% N2) humidified at 60oC.
The increased effect of H2S at the anode under load compared to OCV is discussed in reference
[59]; The poisoning at OCV or low polarization is caused only by adsorption and
chemisorption on the nickel surface, but at high current density nickel sulfide may be
produced in the electrode reaction, which can block the anode surface for hydrogen oxidation.
The effect on the anodic polarization of H2S poisoning is similar to that of short-term tests
with SO2 at the cathode. This supports the hypothesis of sulfur transfer from the cathode to
the anode in the electrolyte and subsequent release of H2S at the anode as being the main
cause of anode poisoning.
3.2. Operating conditions with CO2 lean oxidant gas To simulate operation with combustion flue gas, the MCFC was fed with CO2 lean oxidant gas
in the range of 3-12%. The lower end of this range represents the minimum tolerance for CO2
lean operation. The ratio of pO2/pCO2 at low concentrations of CO2 in oxidant gas has also been
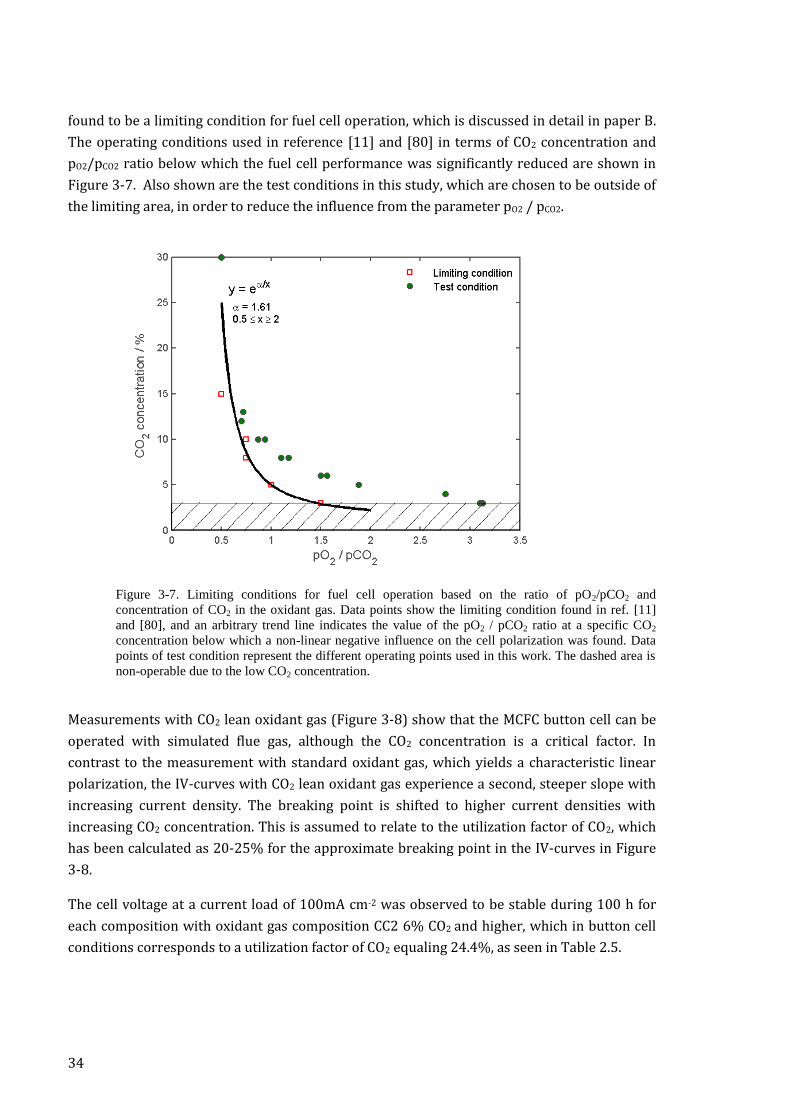
34
found to be a limiting condition for fuel cell operation, which is discussed in detail in paper B.
The operating conditions used in reference [11] and [80] in terms of CO2 concentration and
pO2/pCO2 ratio below which the fuel cell performance was significantly reduced are shown in
Figure 3-7. Also shown are the test conditions in this study, which are chosen to be outside of
the limiting area, in order to reduce the influence from the parameter pO2 / pCO2.
Figure 3-7. Limiting conditions for fuel cell operation based on the ratio of pO2/pCO2 and
concentration of CO2 in the oxidant gas. Data points show the limiting condition found in ref. [11]
and [80], and an arbitrary trend line indicates the value of the pO2 / pCO2 ratio at a specific CO2
concentration below which a non-linear negative influence on the cell polarization was found. Data
points of test condition represent the different operating points used in this work. The dashed area is
non-operable due to the low CO2 concentration.
Measurements with CO2 lean oxidant gas (Figure 3-8) show that the MCFC button cell can be
operated with simulated flue gas, although the CO2 concentration is a critical factor. In
contrast to the measurement with standard oxidant gas, which yields a characteristic linear
polarization, the IV-curves with CO2 lean oxidant gas experience a second, steeper slope with
increasing current density. The breaking point is shifted to higher current densities with
increasing CO2 concentration. This is assumed to relate to the utilization factor of CO2, which
has been calculated as 20-25% for the approximate breaking point in the IV-curves in Figure
3-8.
The cell voltage at a current load of 100mA cm-2 was observed to be stable during 100 h for
each composition with oxidant gas composition CC2 6% CO2 and higher, which in button cell
conditions corresponds to a utilization factor of CO2 equaling 24.4%, as seen in Table 2.5.
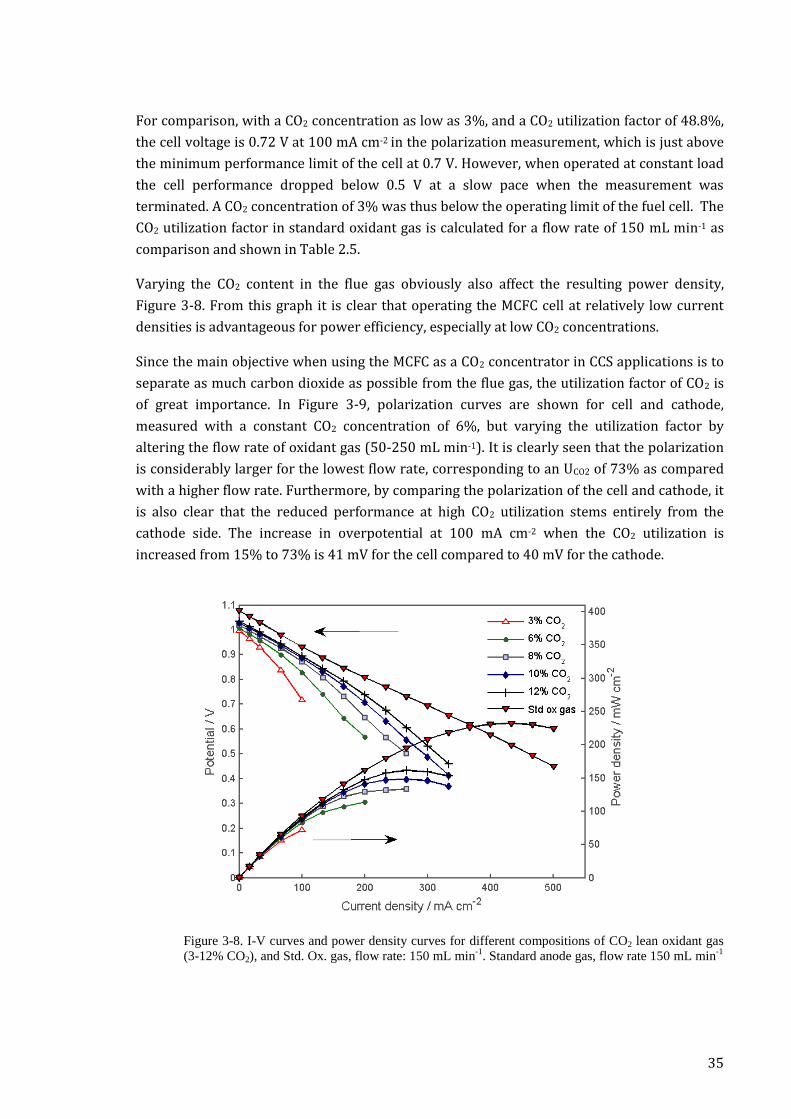
35
For comparison, with a CO2 concentration as low as 3%, and a CO2 utilization factor of 48.8%,
the cell voltage is 0.72 V at 100 mA cm-2 in the polarization measurement, which is just above
the minimum performance limit of the cell at 0.7 V. However, when operated at constant load
the cell performance dropped below 0.5 V at a slow pace when the measurement was
terminated. A CO2 concentration of 3% was thus below the operating limit of the fuel cell. The
CO2 utilization factor in standard oxidant gas is calculated for a flow rate of 150 mL min-1 as
comparison and shown in Table 2.5.
Varying the CO2 content in the flue gas obviously also affect the resulting power density,
Figure 3-8. From this graph it is clear that operating the MCFC cell at relatively low current
densities is advantageous for power efficiency, especially at low CO2 concentrations.
Since the main objective when using the MCFC as a CO2 concentrator in CCS applications is to
separate as much carbon dioxide as possible from the flue gas, the utilization factor of CO2 is
of great importance. In Figure 3-9, polarization curves are shown for cell and cathode,
measured with a constant CO2 concentration of 6%, but varying the utilization factor by
altering the flow rate of oxidant gas (50-250 mL min-1). It is clearly seen that the polarization
is considerably larger for the lowest flow rate, corresponding to an UCO2 of 73% as compared
with a higher flow rate. Furthermore, by comparing the polarization of the cell and cathode, it
is also clear that the reduced performance at high CO2 utilization stems entirely from the
cathode side. The increase in overpotential at 100 mA cm-2 when the CO2 utilization is
increased from 15% to 73% is 41 mV for the cell compared to 40 mV for the cathode.
Figure 3-8. I-V curves and power density curves for different compositions of CO2 lean oxidant gas
(3-12% CO2), and Std. Ox. gas, flow rate: 150 mL min-1
. Standard anode gas, flow rate 150 mL min-1
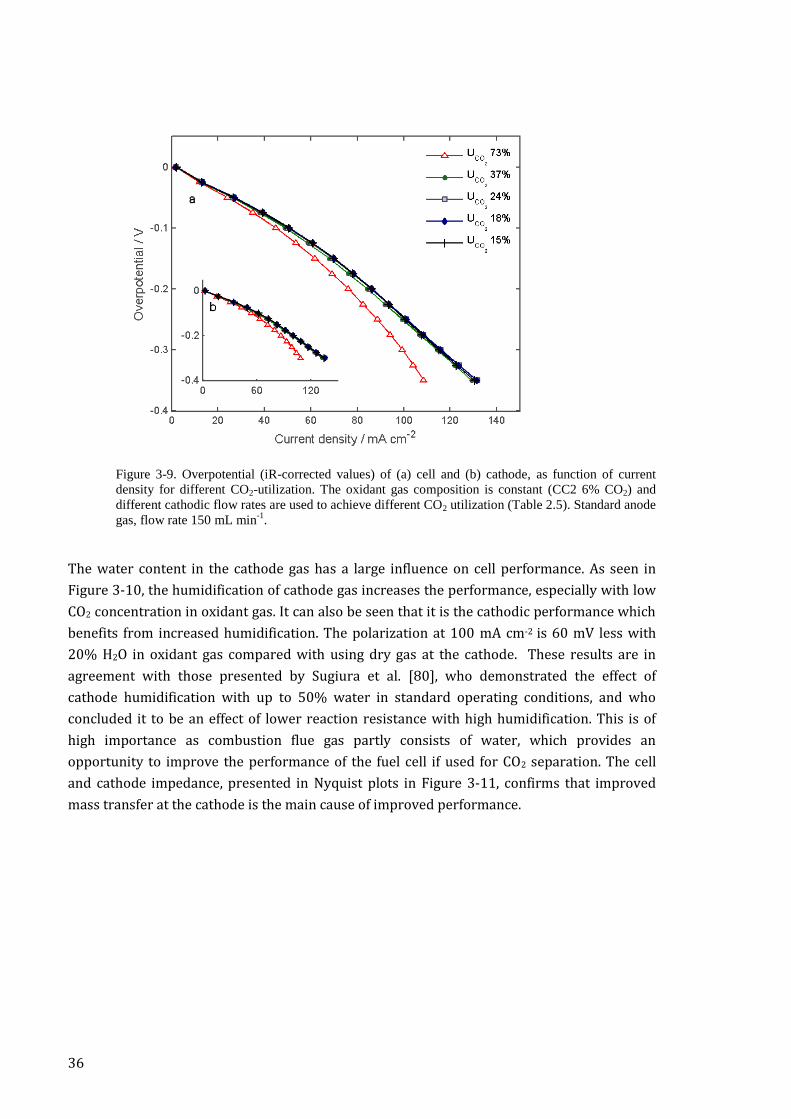
36
Figure 3-9. Overpotential (iR-corrected values) of (a) cell and (b) cathode, as function of current
density for different CO2-utilization. The oxidant gas composition is constant (CC2 6% CO2) and
different cathodic flow rates are used to achieve different CO2 utilization (Table 2.5). Standard anode
gas, flow rate 150 mL min-1
.
The water content in the cathode gas has a large influence on cell performance. As seen in
Figure 3-10, the humidification of cathode gas increases the performance, especially with low
CO2 concentration in oxidant gas. It can also be seen that it is the cathodic performance which
benefits from increased humidification. The polarization at 100 mA cm-2 is 60 mV less with
20% H2O in oxidant gas compared with using dry gas at the cathode. These results are in
agreement with those presented by Sugiura et al. [80], who demonstrated the effect of
cathode humidification with up to 50% water in standard operating conditions, and who
concluded it to be an effect of lower reaction resistance with high humidification. This is of
high importance as combustion flue gas partly consists of water, which provides an
opportunity to improve the performance of the fuel cell if used for CO2 separation. The cell
and cathode impedance, presented in Nyquist plots in Figure 3-11, confirms that improved
mass transfer at the cathode is the main cause of improved performance.

37
Figure 3-10. Polarization curves of (a) cell, and (b) cathode, for different concentration of H2O in
oxidant gas. Oxidant gas composition (CC2 6% CO2), flow rate 200 mL min-1
. Standard anode gas,
flow rate 200 mL min-1
.
Figure 3-11 EIS-curves at OCV of (a) cathode and (b) cell for different concentration of H2O in
oxidant gas. Oxidant gas composition (CC2 6% CO2), flow rate 200 mL min-1
. Standard anode gas,
flow rate mL min-1
. (○ 2.5 kHz, Δ 25 Hz, □ 2.5 Hz ◊ 0.25 Hz)
38
The results from button cell and single cell measurements provide an insight into the limiting
operating conditions for an MCFC as a CCS device. On the basis of these results, a minimum
CO2 concentration in flue gas used at the cathode of an MCFC is in the range of 3 - 5%. In order
to achieve acceptable performance with a CO2 concentration below 10%, the anodic
conditions should be optimized for high performance, which reduces the opportunities for
high fuel utilization and energy effective CO2 reduction in flue gas. If the concentration is
higher than 10%, it is considered that the lower losses at the cathode side will allow fuel cell
operation optimized for CO2 utilization.
3.3. Study of contaminant effects in CCS conditions
3.3.1. Internal resistance
The button cell MCFC was operated for 1500 h without contamination or addition of
electrolyte, and the internal resistance of the cell and of anode and cathode was measured
separately. In Figure 3-12, the ohmic resistance is shown as a function of operating time,
measured by impedance spectroscopy and by current interrupt. The result shows good
correlation between the two measurement methods.
The resistance of cell and separate electrodes can be seen to increase at a constant rate over
1500 h without any addition of electrolyte, and to decrease after refilling electrolyte. This
behavior is well known and is due to the relatively high rate of electrolyte loss in the open
chamber configuration set-up. After 1700 h of operation, electrolyte was added in increments
of 0.02 g. The cell internal resistance decreased as the electrolyte filling increased, and the
minimum coincides with the filling degree reaching its optimum value. The cathode resistance
is seen to be more sensitive to the amount of electrolyte in the cell and reached a minimum
after 0.12 g electrolyte was added. The anode, which is not as sensitive to the filling degree,
showed lower resistance even with additional electrolyte after 0.16 g.
At approximately 2300 h of operation, the SO2 contaminant was added to the oxidant gas. For
about 100 h, the internal resistance was not significantly affected, although a slight increase
can be seen in this interval. However, after 100 h of exposure to 18 ppm SO2, the internal
resistance began to increase drastically. The cell was operated with 18 ppm SO2 in oxidant gas
for 250 h until the resistance had increased four-fold, after which the cell was switched to
clean gas. As can be seen in Figure 3-12, the internal resistance continued to increase even
after clean gas was introduced at the cathode. As the increase in resistance is believed to be
related to the increased loss of electrolyte due to formation of sulfate ions, which accumulate
in the electrolyte and reduce the number of charge carriers, thereby decreasing the
conductivity, it was expected that the regeneration of the internal resistance would be low.
However, the continued increase in internal resistance after changing to clean gas was
unexpected and is assumed to be related to an accelerated loss and redistribution of
electrolyte. After 2700 h of operation, another 0.10 g of carbonate electrolyte was added to

39
the cell to reverse the situation. The result of adding additional electrolyte at this point was
drastic and is shown in Figure 3-12. The internal resistance dropped from over 1 to 0.13 Ω,
and the anode and cathode resistance decreased from 0.8 to 0.06 Ω, and 0.27 to 0.04 Ω,
respectively.
Figure 3-12. Internal resistance as a function of operating time during benchmark and refilling of
electrolyte with CC2 6% CO2 oxidant gas, and contamination by 18 ppm SO2 in CC2 5% CO2.
3.3.2. Polarization
The cell voltage at OCV at different current density is shown in Figure 3-13. The OCV was not
affected by the performance degradation during the benchmark trial, as it is not related to the
internal resistance. Although the value of the anodic OCV (Figure 3-14) showed a tendency to
drift, a total of 20 mV over 1500 h, this was not due to any change in the electrolyte filling as it
was not reversed by the refilling of electrolyte after the benchmark period, unlike the anode
polarization during current load, which can be seen for 33 mA cm-2 and for 100 mA cm-2. The
cell voltage did not show a dramatic effect of increased polarization during the 1500 h
benchmark period, as the increase in internal resistance during this time is moderate
compared to the polarization resistance.
When electrolyte was added, the effect on the anode was a reduced polarization due to lower
internal resistance. At the cathode the effect is initially the same, however, after 0.06 g of
electrolyte the addition of additional electrolyte resulted in an increased mass transfer
resistance, which had an opposite effect on the cathode polarization (Figure 3-15). The
performance of the cathode, which is more sensitive to changes in electrolyte filling than the
anode, was actually increased as the cell was starved of electrolyte due to improved diffusion

40
in the cathode, and decreased when too much electrolyte was added to the cell, while the
anode performance increased and thereafter reached a steady state. When more than 0.10 g
had been added, the same relation between reduced internal resistance and increased mass
transfer resistance caused the cell polarization first to decrease, then to increase again (Figure
3-13). The change in internal resistance and mass transfer resistance is demonstrated by EIS
analysis of the cell and separate electrodes in paper D.
At approximately 2400 h of operation, with the addition of 18 ppm of SO2 to the cathode, the
first observable effect was a decrease of the OCV. This effect is visible for the cell and for the
anode, which indicates H2S poisoning of the Ni-catalyst at the anode, in agreement with what
has been presented in paper A. The cathodic OCV, on the other hand, was not affected. After
approximately 100 h of exposure to SO2 the degradation in cell voltage during load was
accelerated, while the OCV remained unaffected. This is a result of the increased internal
resistance, as discussed above, and is assumed to be caused by an accumulation of sulfate ions
in the electrolyte. The increasing internal resistance leads towards cell failure and end of life,
and is only reversed by the addition of fresh electrolyte to the cell.
Considering the fact that the cell performance was practically fully regenerated with the
addition of fresh electrolyte, similar to the effect of adding electrolyte after the benchmark
period, this was taken as evidence that the electrolyte loss is the single most important factor
behind the performance loss during contamination with SO2.
Figure 3-13. Cell voltage from IV-curves as a function of operating time during benchmark and
refilling of electrolyte with CC2 6% CO2 oxidant gas, and contamination by 18 ppm SO2 in CC2 5%
CO2.

41
Figure 3-14. Anode potential vs. SOE from IV-curves as a function of operating time during
benchmark and refilling of electrolyte with CC2 6% CO2 oxidant gas, and contamination by 18 ppm
SO2 in CC2 5% CO2.
Figure 3-15. Cathode potential vs. SOE from IV-curves as a function of operating time during
benchmark and refilling of electrolyte with CC2 6% CO2 oxidant gas, and contamination by 18 ppm
SO2 in CC2 5% CO2.
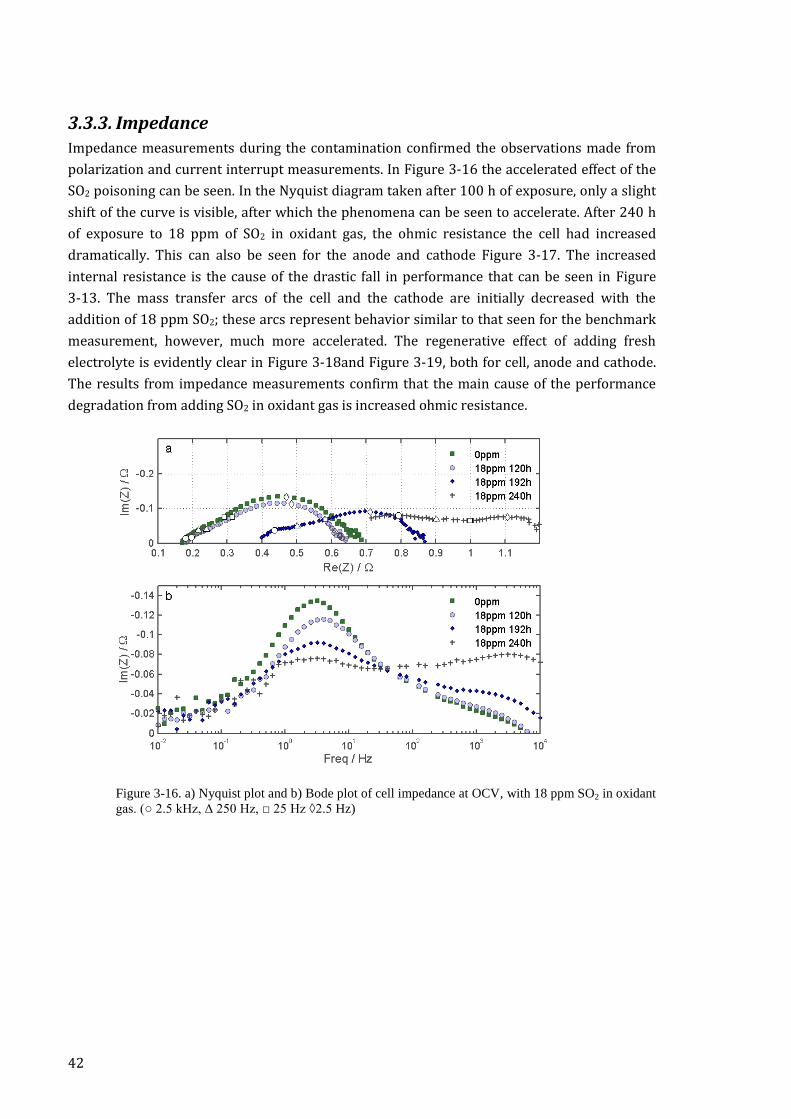
42
3.3.3. Impedance
Impedance measurements during the contamination confirmed the observations made from
polarization and current interrupt measurements. In Figure 3-16 the accelerated effect of the
SO2 poisoning can be seen. In the Nyquist diagram taken after 100 h of exposure, only a slight
shift of the curve is visible, after which the phenomena can be seen to accelerate. After 240 h
of exposure to 18 ppm of SO2 in oxidant gas, the ohmic resistance the cell had increased
dramatically. This can also be seen for the anode and cathode Figure 3-17. The increased
internal resistance is the cause of the drastic fall in performance that can be seen in Figure
3-13. The mass transfer arcs of the cell and the cathode are initially decreased with the
addition of 18 ppm SO2; these arcs represent behavior similar to that seen for the benchmark
measurement, however, much more accelerated. The regenerative effect of adding fresh
electrolyte is evidently clear in Figure 3-18and Figure 3-19, both for cell, anode and cathode.
The results from impedance measurements confirm that the main cause of the performance
degradation from adding SO2 in oxidant gas is increased ohmic resistance.
Figure 3-16. a) Nyquist plot and b) Bode plot of cell impedance at OCV, with 18 ppm SO2 in oxidant
gas. (○ 2.5 kHz, Δ 250 Hz, □ 25 Hz ◊2.5 Hz)

43
Figure 3-17. Nyquist plot of a) anode and b) cathode impedance at OCV, with 18 ppm SO2 in
oxidant gas. (○ 2.5 kHz, Δ 250 Hz, □ 25 Hz ◊2.5 Hz)
Figure 3-18. a) Nyquist plot and b) Bode plot of cell impedance at OCV, with 18 ppm SO2 in oxidant
gas and after regeneration and refilling of electrolyte. (○ 2.5 kHz, Δ 250 Hz, □ 25 Hz ◊2.5 Hz)
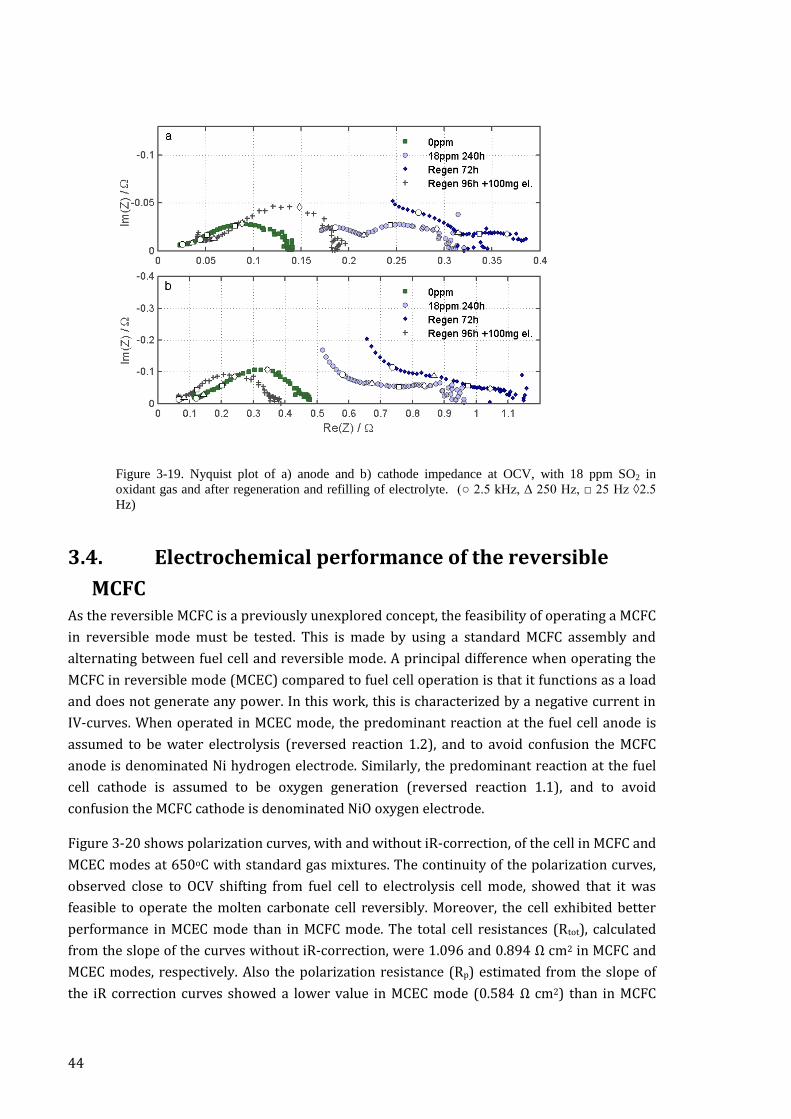
44
Figure 3-19. Nyquist plot of a) anode and b) cathode impedance at OCV, with 18 ppm SO2 in
oxidant gas and after regeneration and refilling of electrolyte. (○ 2.5 kHz, Δ 250 Hz, □ 25 Hz ◊2.5
Hz)
3.4. Electrochemical performance of the reversible
MCFC As the reversible MCFC is a previously unexplored concept, the feasibility of operating a MCFC
in reversible mode must be tested. This is made by using a standard MCFC assembly and
alternating between fuel cell and reversible mode. A principal difference when operating the
MCFC in reversible mode (MCEC) compared to fuel cell operation is that it functions as a load
and does not generate any power. In this work, this is characterized by a negative current in
IV-curves. When operated in MCEC mode, the predominant reaction at the fuel cell anode is
assumed to be water electrolysis (reversed reaction 1.2), and to avoid confusion the MCFC
anode is denominated Ni hydrogen electrode. Similarly, the predominant reaction at the fuel
cell cathode is assumed to be oxygen generation (reversed reaction 1.1), and to avoid
confusion the MCFC cathode is denominated NiO oxygen electrode.
Figure 3-20 shows polarization curves, with and without iR-correction, of the cell in MCFC and
MCEC modes at 650oC with standard gas mixtures. The continuity of the polarization curves,
observed close to OCV shifting from fuel cell to electrolysis cell mode, showed that it was
feasible to operate the molten carbonate cell reversibly. Moreover, the cell exhibited better
performance in MCEC mode than in MCFC mode. The total cell resistances (Rtot), calculated
from the slope of the curves without iR-correction, were 1.096 and 0.894 Ω cm2 in MCFC and
MCEC modes, respectively. Also the polarization resistance (Rp) estimated from the slope of
the iR correction curves showed a lower value in MCEC mode (0.584 Ω cm2) than in MCFC

45
mode (0.781 Ω cm2). Both the Rtot and the Rp values were lower in MCEC mode than in MCFC
mode, which showed that the cell operated better in electrolysis cell mode. At the same time,
the ohmic losses of the cells were similar at 0.31 Ω cm2, under these reversible operating
conditions, indicating that running the molten carbonate fuel cell reversibly did not affect the
properties of the electrode materials nor the ionic conductivity in the electrolyte, at least not
in this short-term test.
-0,6 -0,5 -0,4 -0,3 -0,2 -0,1 0,0 0,1 0,2 0,3 0,4 0,5 0,60,6
0,7
0,8
0,9
1,0
1,1
1,2
1,3
1,4
1,5
without iR-correction
with iR-correction
MCEC
Cel
l vo
ltag
e /
V
Current density / Acm-2
MCFC
Figure 3-20. Polarization curves for the cell in MCFC and MCEC mode, working at 650oC with
standard gas mixtures.
3.4.1. Electrochemical performance of the Ni hydrogen electrode
The effect of water concentration in the Ni hydrogen electrode can be seen in Figure 3-21a.
The increase of water from 10% to 30% in standard anode gas had no significant effect on the
polarization of the Ni electrode in fuel cell mode. However, in electrolysis cell mode the Ni
electrode polarization decreased gradually with increasing water content, at least for
overpotential larger than 40 mV. In the EIS spectra in Figure 3-21b, it is seen that the increase
in water content had no effect on the ohmic resistance and kinetics of the Ni electrode,
however, the size of the low-frequency arc decreased, indicating lower mass-transfer
resistance. Since water is a reactant in electrolysis cell mode, the mass-transfer resistance
decreases with the increase in water content.
The effect of CO2 concentration on the electrochemical performance of the Ni electrode was
investigated, as shown in Figure 3-22. The fuel gas consisted of different amounts of CO2
ranging from 20% to 40%, 20% H2O and H2 as balance. Although doubling the CO2 content
from 20% to 40%, no effect is seen on the polarization (Figure 3-22a-b) in fuel cell mode.
However, in the electrolysis cell mode the performance of the Ni electrode improved
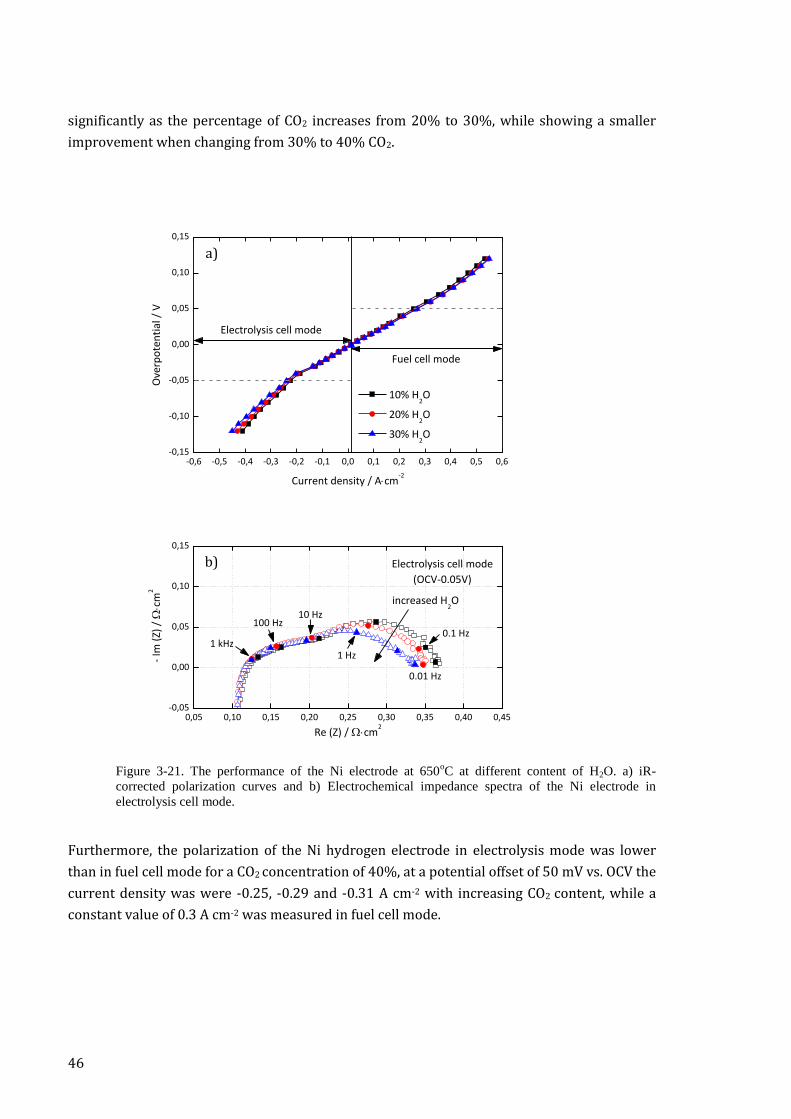
46
significantly as the percentage of CO2 increases from 20% to 30%, while showing a smaller
improvement when changing from 30% to 40% CO2.
-0,6 -0,5 -0,4 -0,3 -0,2 -0,1 0,0 0,1 0,2 0,3 0,4 0,5 0,6-0,15
-0,10
-0,05
0,00
0,05
0,10
0,15
10% H2O
20% H2O
30% H2O
Ove
rpo
ten
tial
/ V
Current density / Acm-2
Fuel cell mode
Electrolysis cell mode
0,05 0,10 0,15 0,20 0,25 0,30 0,35 0,40 0,45-0,05
0,00
0,05
0,10
0,15
0.01 Hz
0.1 Hz
1 Hz
10 Hz100 Hz
Electrolysis cell mode
(OCV-0.05V)
- Im
(Z)
/
cm
2
Re (Z) /cm2
increased H2O
1 kHz
Figure 3-21. The performance of the Ni electrode at 650oC at different content of H2O. a) iR-
corrected polarization curves and b) Electrochemical impedance spectra of the Ni electrode in
electrolysis cell mode.
Furthermore, the polarization of the Ni hydrogen electrode in electrolysis mode was lower
than in fuel cell mode for a CO2 concentration of 40%, at a potential offset of 50 mV vs. OCV the
current density was were -0.25, -0.29 and -0.31 A cm-2 with increasing CO2 content, while a
constant value of 0.3 A cm-2 was measured in fuel cell mode.
a)
b)
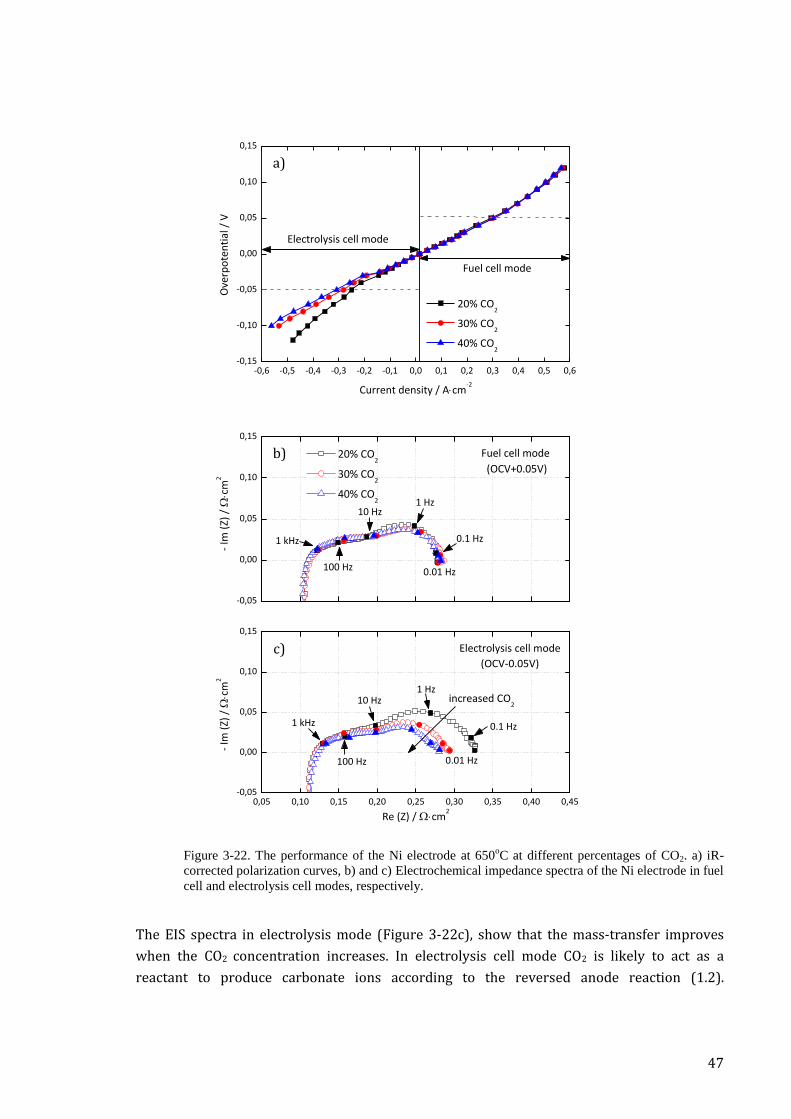
47
-0,6 -0,5 -0,4 -0,3 -0,2 -0,1 0,0 0,1 0,2 0,3 0,4 0,5 0,6-0,15
-0,10
-0,05
0,00
0,05
0,10
0,15
20% CO2
30% CO2
40% CO2
Ove
rpo
ten
tial
/ V
Current density / Acm-2
Fuel cell mode
Electrolysis cell mode
-0,05
0,00
0,05
0,10
0,15
0.01 Hz
0.1 Hz
1 Hz10 Hz
100 Hz
Fuel cell mode
(OCV+0.05V)
20% CO2
30% CO2
40% CO2
- Im
(Z)
/
cm
2
1 kHz
0,05 0,10 0,15 0,20 0,25 0,30 0,35 0,40 0,45-0,05
0,00
0,05
0,10
0,15
0.01 Hz
0.1 Hz
1 Hz10 Hz
100 Hz
- Im
(Z)
/
cm
2
Re (Z) /cm2
Electrolysis cell mode
(OCV-0.05V)
increased CO2
1 kHz
Figure 3-22. The performance of the Ni electrode at 650oC at different percentages of CO2. a) iR-
corrected polarization curves, b) and c) Electrochemical impedance spectra of the Ni electrode in fuel
cell and electrolysis cell modes, respectively.
The EIS spectra in electrolysis mode (Figure 3-22c), show that the mass-transfer improves
when the CO2 concentration increases. In electrolysis cell mode CO2 is likely to act as a
reactant to produce carbonate ions according to the reversed anode reaction (1.2).
a)
c)
b)
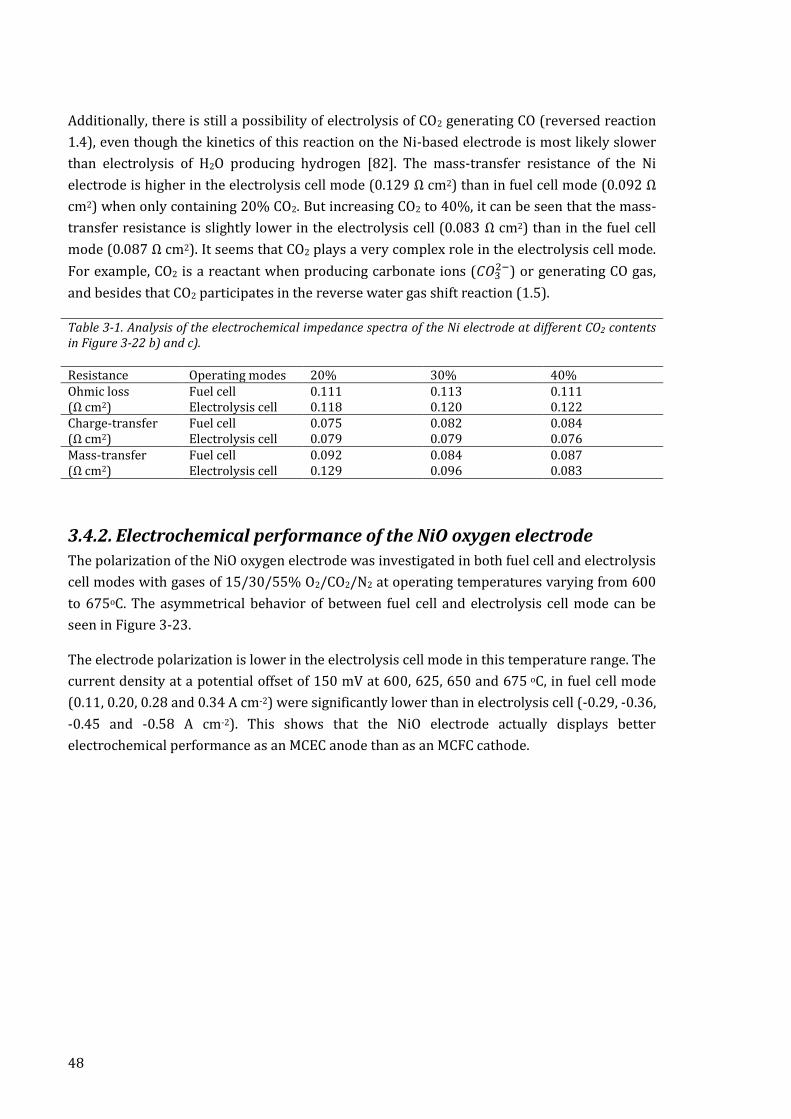
48
Additionally, there is still a possibility of electrolysis of CO2 generating CO (reversed reaction
1.4), even though the kinetics of this reaction on the Ni-based electrode is most likely slower
than electrolysis of H2O producing hydrogen [82]. The mass-transfer resistance of the Ni
electrode is higher in the electrolysis cell mode (0.129 Ω cm2) than in fuel cell mode (0.092 Ω
cm2) when only containing 20% CO2. But increasing CO2 to 40%, it can be seen that the mass-
transfer resistance is slightly lower in the electrolysis cell (0.083 Ω cm2) than in the fuel cell
mode (0.087 Ω cm2). It seems that CO2 plays a very complex role in the electrolysis cell mode.
For example, CO2 is a reactant when producing carbonate ions (𝐶𝑂32−) or generating CO gas,
and besides that CO2 participates in the reverse water gas shift reaction (1.5).
Table 3-1. Analysis of the electrochemical impedance spectra of the Ni electrode at different CO2 contents in Figure 3-22 b) and c).
Resistance Operating modes 20% 30% 40% Ohmic loss (Ω cm2)
Fuel cell 0.111 0.113 0.111 Electrolysis cell 0.118 0.120 0.122
Charge-transfer (Ω cm2)
Fuel cell 0.075 0.082 0.084 Electrolysis cell 0.079 0.079 0.076
Mass-transfer (Ω cm2)
Fuel cell 0.092 0.084 0.087 Electrolysis cell 0.129 0.096 0.083
3.4.2. Electrochemical performance of the NiO oxygen electrode
The polarization of the NiO oxygen electrode was investigated in both fuel cell and electrolysis
cell modes with gases of 15/30/55% O2/CO2/N2 at operating temperatures varying from 600
to 675oC. The asymmetrical behavior of between fuel cell and electrolysis cell mode can be
seen in Figure 3-23.
The electrode polarization is lower in the electrolysis cell mode in this temperature range. The
current density at a potential offset of 150 mV at 600, 625, 650 and 675 oC, in fuel cell mode
(0.11, 0.20, 0.28 and 0.34 A cm-2) were significantly lower than in electrolysis cell (-0.29, -0.36,
-0.45 and -0.58 A cm-2). This shows that the NiO electrode actually displays better
electrochemical performance as an MCEC anode than as an MCFC cathode.
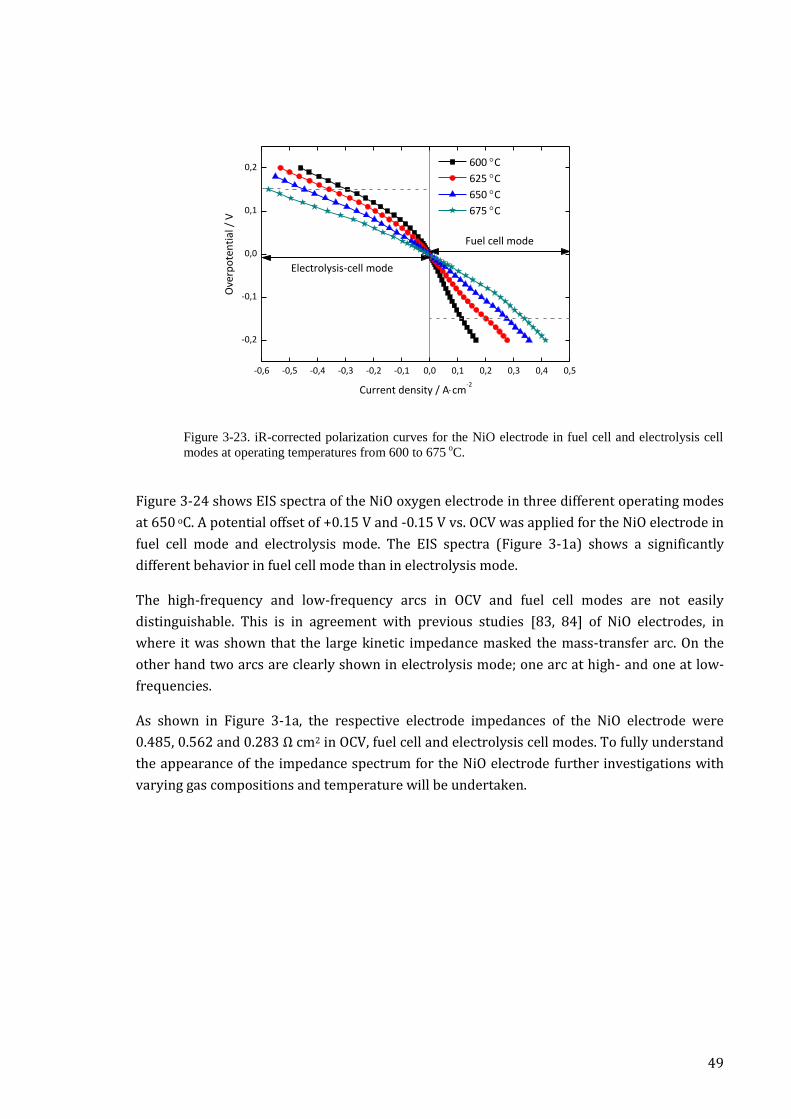
49
-0,6 -0,5 -0,4 -0,3 -0,2 -0,1 0,0 0,1 0,2 0,3 0,4 0,5
-0,2
-0,1
0,0
0,1
0,2 600 C
625 C
650 C
675 C
Ove
rpo
ten
tial
/ V
Current density / Acm-2
Fuel cell mode
Electrolysis-cell mode
Figure 3-23. iR-corrected polarization curves for the NiO electrode in fuel cell and electrolysis cell
modes at operating temperatures from 600 to 675 oC.
Figure 3-24 shows EIS spectra of the NiO oxygen electrode in three different operating modes
at 650 oC. A potential offset of +0.15 V and -0.15 V vs. OCV was applied for the NiO electrode in
fuel cell mode and electrolysis mode. The EIS spectra (Figure 3-1a) shows a significantly
different behavior in fuel cell mode than in electrolysis mode.
The high-frequency and low-frequency arcs in OCV and fuel cell modes are not easily
distinguishable. This is in agreement with previous studies [83, 84] of NiO electrodes, in
where it was shown that the large kinetic impedance masked the mass-transfer arc. On the
other hand two arcs are clearly shown in electrolysis mode; one arc at high- and one at low-
frequencies.
As shown in Figure 3-1a, the respective electrode impedances of the NiO electrode were
0.485, 0.562 and 0.283 Ω cm2 in OCV, fuel cell and electrolysis cell modes. To fully understand
the appearance of the impedance spectrum for the NiO electrode further investigations with
varying gas compositions and temperature will be undertaken.
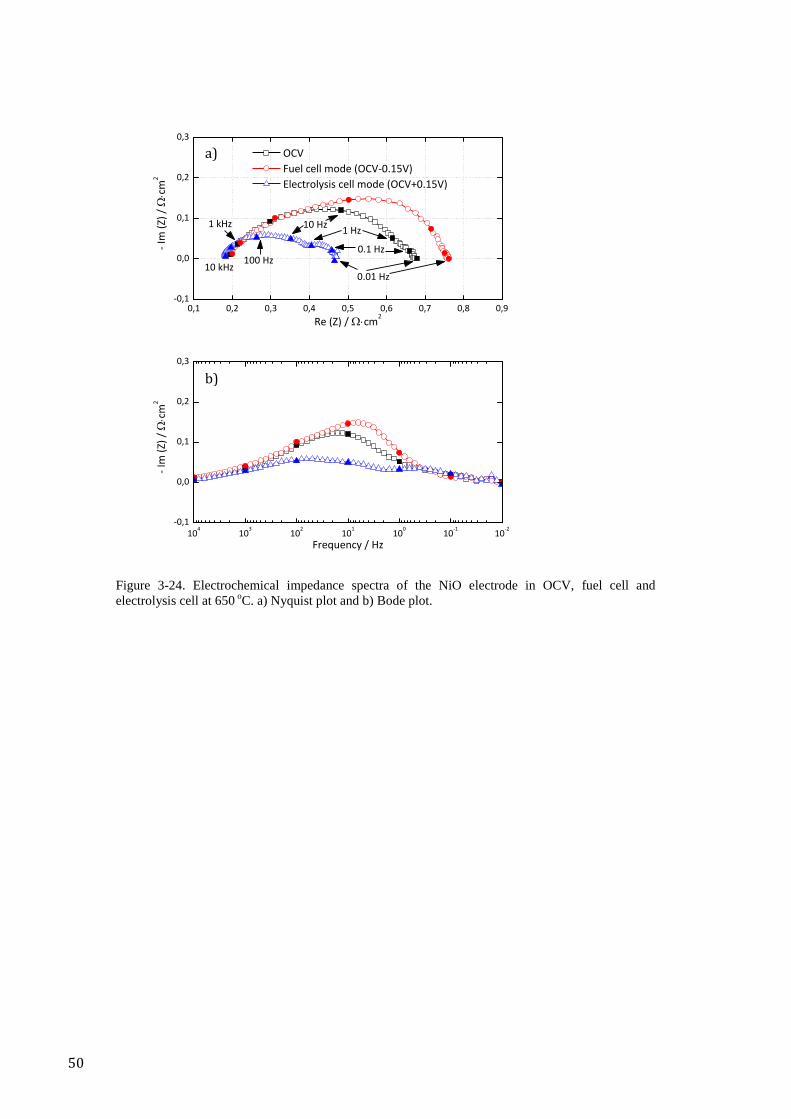
50
0,1 0,2 0,3 0,4 0,5 0,6 0,7 0,8 0,9-0,1
0,0
0,1
0,2
0,3
0.01 Hz
0.1 Hz
1 Hz10 Hz1 kHz
OCV
Fuel cell mode (OCV-0.15V)
Electrolysis cell mode (OCV+0.15V)
- Im
(Z)
/
cm
2
Re (Z) /cm2
10 kHz100 Hz
104
103
102
101
100
10-1
10-2
-0,1
0,0
0,1
0,2
0,3
- Im
(Z)
/
cm
2
Frequency / Hz
Figure 3-24. Electrochemical impedance spectra of the NiO electrode in OCV, fuel cell and
electrolysis cell at 650 oC. a) Nyquist plot and b) Bode plot.
a)
b)
51
4. Conclusions
Fuel cells for power generation are more than just a promising technology. Molten carbonate
fuel cells are currently being employed in MW-scale installations worldwide. Furthermore,
there is a potential market for MCFC in new development applications, like system integrated
power generation and carbon capture and storage, and production of synthetic fuels or
hydrogen with reversible fuel cells, which can be realized using today’s materials and
infrastructure. However, although there might not be a need of fundamental changes to the
MCFC to be utilized for these applications, there is a need for studying the behavior of the
MCFC in the operating conditions which are a consequence of these applications, just as there
is a need for further research on issues concerning performance degradation in order to
reduce the cost and improve the life-time of fuel cells in order to improve the competiveness
of MCFC compared to conventional power generation.
4.1. Effect of sulfur contaminants on MCFC
performance In paper A, the effect of anode and cathode side sulfur contaminants are evaluated. The results
show that SO2 added to the oxidant gas gives an immediate and significant effect on the anode,
which indicates a transfer mechanism of sulfur from anode to cathode. This is assumed to
occur by SO2 dissolving into the electrolyte as sulfate ions which migrate to the anode to be
released as H2S, and by poisoning of the anode catalyst by interactions between nickel and
H2S.
Long-term exposure to 8ppm SO2 at the cathode resulted in increased polarization of both
anode and cathode, with a stronger effect at high current density. The cathode polarization
increased linearly while the anode polarization was accelerating with high current density
and longer exposure time. This indicates anode side poisoning by H2S. Poisoning of the anode
was further supported by comparing the effect on the anode polarization from adding SO2 at
the cathode with the effect of adding H2S at the anode, which was similar in the two
experiments. However, impedance measurements did not reveal detailed information about
the predominant poisoning mechanism, partly due to a reoccurring disturbance in the low
frequency region in which mass transfer is studied.
In paper C, the anode side poisoning by transfer of sulfate ions and through the electrolyte
was also demonstrated by separate electrode measurements when adding SO2 in CO2 lean
oxidant gas.
52
The effect of the short-term contamination tests on anode polarization is visible for
concentrations higher than 12ppm SO2. The short exposure time shows that the transfer
mechanism of sulfur from the cathode to the anode is fast, although no detailed data on
transfer kinetics can be derived from this study. The poisoning effect is increasing with
exposure time and a delayed poisoning effect is seen after clean gas was introduced at the
cathode side for regeneration. This indicates an accumulation of sulfate in the electrolyte,
which results in an increase of H2S concentration at the anode with time.
The anode poisoning effects were largely reversible by regeneration with clean gas. The
cathode, however, experienced irreversible polarization effects after 100h exposure to 8ppm
SO2. The increase in cell resistance after long-term exposure was attributed to the cathode.
The cause may be either carbonate being replaced by sulfate by reaction with SO2 dissolved in
the electrolyte, or the build-up of a corrosion layer at the electrode-current collector interface.
The result shows that SO2 in oxidant gas is of great concern for the use of flue gas to feed the
cathode of MCFCs.
4.2. Operating MCFC with low CO2 concentration in
oxidant gas The effect on MCFC performance of operating with CO2 lean oxidant gas, simulating
combustion flue gas, was evaluated in paper B. The CO2 concentration was varied between 3
and 13%, which represents a composition ranging from NGCC to PC combustion plants. The
purpose of using oxidant gas which simulates real exhaust gas compositions was to provide an
indication of which kind of power plant that could potentially be operated with MCFC as a CCS
application. It was found that the lab scale MCFC used performed acceptably at a load of
100mA/cm2 with simulated flue gas at a concentration of 6% CO2, while the single cell
achieved an acceptable performance with a CO2 concentration of 5%. In this range, the
composition of oxidant gas is roughly equivalent to exhaust gas in gas turbine power plants.
Operating the MCFC with an oxidant gas composition with a CO2 concentration below these
values resulted in a considerable increase in polarization.
The CO2 utilization factor has a large impact on the fuel cell performance. However, in
measurements with button cell and single cell set-ups, the relative impact of this parameter
varies. In button cell measurements, a CO2 utilization factor above 50% induced a large
increase in polarization, while in single cell set-up the polarization was increased more
gradually up to a utilization factor of 70%.
The humidification of oxidant gas had a significant effect on the cathode polarization in CO2
lean conditions simulating flue gas composition. Furthermore, electrochemical impedance
spectroscopy measurements showed that a reduced mass transfer resistance was the cause of
the lower polarization. As combustion flue gas consists to some degree of water vapor, this is

53
a considered as a potential method to increase the operational range of the MCFC in CCS
conditions.
4.3. Performance degradation of Molten Carbonate
Fuel Cells caused by SO2 in simulated flue gas In paper C, a benchmark measurement with the simulated flue gas as oxidant was performed
for a duration of 1500h, showing the performance degradation due to electrolyte loss in the
button cell set-up. A contamination study with 18 ppm SO2 in oxidant gas showed that the
MCFC experiences a rapid and drastic increase in internal resistance, and a regenerative effect
with the addition of fresh electrolyte. The contaminant degradation was attributed to an
accelerated loss of electrolyte, which results in a decrease in the electrolyte conductivity.
A possible SO2 poisoning mechanism is the replacement of carbonate charge carriers in the
electrolyte by sulfate ions. Our results indicate that over long periods under CCS conditions
and with SO2 in oxidant gas, this poisoning phenomenon may be the single largest
contribution to fuel cell performance degradation. No tolerance limits for SO2 in flue gas used
at the MCFC cathode can be concluded without extensive testing in a more application-like
condition. However, these results show that the presence of SO2 in flue gas is a major concern
for the use of MCFC in the carbon capture cycle.
4.4. The reversible Molten Carbonate Fuel Cell A molten carbonate cell with commercial MCFC components was shown to be operable both
as fuel cell and electrolysis cell interchangeable, without any type of specific preparation
before reversing the current, prolonged open circuit between the two operation modes, or re-
assembly of the fuel cell. Overall, the cell even exhibited better electrochemical performance
in reversed mode than in fuel cell mode.
The Ni hydrogen electrode showed higher polarization loss in electrolysis cell mode than in
fuel cell mode at all temperatures and water contents. According to the impedance results,
this was mainly due to the larger mass-transfer polarization rather than electrode charge-
transfer polarization. CO2 has an important impact on the Ni electrode in electrolysis cell
mode. However, when increasing the CO2 content to 40%, the Ni electrode showed slightly
lower polarization in electrolysis cell mode than in fuel cell mode at same gas composition.
That is probably due to several factors, such as CO2 as a reactant for producing electrolyte or
generating CO, and also participating in the reverse water gas shift reaction.
In contrast to the Ni-electrode, the NiO oxygen electrode demonstrated significantly better
performance in reversible mode, compared to fuel cell mode. Both the charge-transfer and
mass-transfer polarization of the NiO electrode was lower in electrolysis cell mode.

54
In spite of the promising performance of MCFC in reversed operation mode, further long-term
tests of the cell are still needed to demonstrate the potential viability of the concept, as it is
difficult to predict any negative long-term effects.

55
5. Acknowledgements
First, I would like to express my gratitude towards Prof. Göran Lindbergh, for guidance and
support during my years at the department, and for pointing the direction but not controlling
every step on the way. I am also grateful for the support my supervisors provided me; Dr.
Carina Lagergren for supervising and for helping me with the complex work of planning and
interpreting experimental studies and results, and Dr. Mårten Behm for help and support, and
for being a role model in the approach to research and teaching. The Fuel Cells & Hydrogen
Joint Undertaking of the European Commission through the MCFC-CONTEX project (contract
245171), is greatly acknowledged for financial support.
I would like to thank Dr. Stephen McPhail of ENEA for an inspirational leadership within the
MCFC-CONTEX program, and for somehow managing to bring all the threads together to a
weave despite the virtual odyssey this project offered before reaching the final deliverable. I
have had the pleasure of collaborating with Massimiliano della Pietra, of Uni. of Perugia/
ENEA, whose ideas and comments about fuel cell testing have been most valued.
I would like to thank Lan Hu, KTH, for all the hours shared in the lab, and for all the work with
the fuel cell set-up, and not least for offering fresh ideas to old problems which had been
overlooked. To thank past and present colleagues at the department of Applied
Electrochemistry, thank you for good company and cooperation in the lab and offices.
Especially I would like to thank Dr. Rakel Wreland for sharing her office with me despite an
ever growing need of desk space, and Nicklas Holmström for once guiding me into the area of
experimental fuel cell work.
Of course I could not write this without mentioning Christofer; our contact has been relieving
in times of stress and heavy workload.
To my parents; Thank you for feeding me with an urge to find my own facts early in life, and
for giving me the confidence to believe in my abilities. To Jimi and Lena; thank you for taking
care of our kids whenever need be, and for always wanting them back again so soon.
Finally, and most important; To Jenny, Amos and Henry, who are my source of inspiration and
energy, without your love and support this work would not have been possible.

56
57
6. References
[1] IEA. CO2 Emissions from Fuel Combustion. Paris: Mimas, University of Manchester; 2013.
[2] IPCC. Summary for Policymakers. In: Stocker TF, Qin D, Plattner G-K, Tignor M, Allen SK,
Boschung J, et al., editors. Climate Change 2013: The Physical Science Basis Contribution of
Working Group I to the Fifth Assessment Report of the Intergovernmental Panel on Climate
Change. Cambridge, United Kingdom: Cambridge University Press; 2013.
[3] EU. The 2020 climate and energy package. The European Commission; 2014.
[4] IEA. World Energy Outlook 2013. Paris: OECD/IEA; 2013.
[5] BT Institute. 2012 Fuel Cell Technologies Market Report. In: FCT Office, editor. Washington
D.C.: Office of Energy Efficiency and Renewable Energy, U.S. Dept. of Energy; 2013.
[6] FuelCell Energy sells 15 MW fuel cell park to Connecticut utility. Fuel Cells Bulletin.
2013;2013:4-5.
[7] POSCO starts building manufacturing plant, FuelCell Energy boost. Fuel Cells Bulletin.
2013;2013:5.
[8] Carter D, Wing J. The Fuel Cell Industry Review 2013. Hertfordshire, UK2013.
[9] Cassir M, McPhail SJ, Moreno A. Strategies and new developments in the field of molten
carbonates and high-temperature fuel cells in the carbon cycle. International Journal of
Hydrogen Energy. 2012;37:19345-50.
[10] Greppi P, Bosio B, Arato E. Membranes and Molten Carbonate Fuel Cells to Capture CO2
and Increase Energy Production in Natural Gas Power Plants. Industrial & Engineering
Chemistry Research. 2013;52:8755-64.
[11] Discepoli G, Cinti G, Desideri U, Penchini D, Proietti S. Carbon capture with molten
carbonate fuel cells: Experimental tests and fuel cell performance assessment. International
Journal of Greenhouse Gas Control. 2012;9:372-84.
[12] Brenna M, Foiadelli F, Manzolini G. Grid connection of MCFC applied to power plant with
CO2 capture. International Journal of Electrical Power & Energy Systems. 2013;53:980-6.
[13] Campanari S, Chiesa P, Manzolini G. CO2 capture from combined cycles integrated with
Molten Carbonate Fuel Cells. International Journal of Greenhouse Gas Control. 2010;4:441-51.
58
[14] Laguna-Bercero MA. Recent advances in high temperature electrolysis using solid oxide
fuel cells: A review. Journal of Power Sources. 2012;203:4.
[15] Tomczyk P. MCFC versus other fuel cells-Characteristics, technologies and prospects.
Journal of Power Sources. 2006;160:858-62.
[16] EG&G Technical Services, Inc.. Fuel cell handbook [electronic resource] Morgantown, WV:
U.S. Dept. of Energy, Office of Fossil Energy, National Energy Technology Laboratory; 2004.
[17] Farooque M, Maru H. Carbonate fuel cells: Milliwatts to megawatts. Journal of Power
Sources. 2006;160:827-34.
[18] Hengeveld DW, Revankar ST. Economic analysis of a combined heat and power molten
carbonate fuel cell system. Journal of Power Sources. 2007;165:300-6.
[19] Au SF, McPhail SJ, Woudstra N, Hemmes K. The influence of operating temperature on the
efficiency of a combined heat and power fuel cell plant. Journal of Power Sources.
2003;122:37-46.
[20] Varbanov P, Klemes J, Shah R, Shihn H. Power cycle integration and efficiency increase of
molten carbonate fuel cell systems. Journal of Fuel Cell Science and Technology. 2006;3:375-
83.
[21] Massardo A, Bosio B. Assessment of molten carbonate fuel cell models and integration
with gas and steam cycles. Journal of Engineering For Gas Turbines and Power-Transactions
of the Asme. 2002;124:103-9.
[22] Bedont P, Grillo O, Massardo AF. Off-design performance analysis of a hybrid system
based on an existing molten fuel cell stack. Journal of Engineering for Gas Turbines and Power.
2003;125:986-93.
[23] Rashidi R, Dincer I, Berg P. Energy and exergy analyses of a hybrid molten carbonate fuel
cell system. Journal of Power Sources. 2008;185:1107-14.
[24] Greppi P, Bosio B, Arato E. Feasibility of the integration of a molten carbonate fuel-cell
system and an integrated gasification combined cycle. Int J Hydrog Energy. 2009;34:8664-9.
[25] Selman JR. Research, Development, and Demonstration of Molten Carbonate Fuel Cell
Systems. In: Blomen LJMJ, Mugerwa MN, editors. Fuel Cell Systems. New York: Plenum Press;
1993. p. 345-463.
[26] Clarke S, Dicks A, Pointon K, Smith T, Swann A. Catalytic aspects of the steam reforming of
hydrocarbons in internal reforming fuel cells. Catalysis Today. 1997;38:411-23.
[27] Sasaki K, Teraoka Y. Equilibria in fuel cell gases - II. The C-H-O ternary diagrams. Journal
of the Electrochemical Society. 2003;150:A885-A8.

59
[28] Yoshikawa M, Mugikura Y, Watanabe T, Ota T, Suzuki A. The behavior of MCFCs using
Li/K and Li/Na carbonates as the electrolyte at high pressure. Journal of the Electrochemical
Society. 1999;146:2834-40.
[29] Larminie J, Dicks A. Fuel Cell Systems Explained. 2nd ed. The Atrium, West Sussex,
England: John Wiley & Sons; 2003.
[30] Sammells AF, Nicholson SB, Ang PGP. Development of sulfur-tolerant components for the
Molten Carbonate Fuel Cell. Journal of the Electrochemical Society. 1980;127:350-7.
[31] Devianto H, Yoon SP, Nam SW, Han J, Lim TH. The effect of a ceria coating on the H2S
tolerance of a molten carbonate fuel cell. Journal of Power Sources. 2006;159:1147-52.
[32] Devianto H, Simonetti E, McPhail S, Zaza F, Cigolotti V, Paoletti C, et al. Electrochemical
impedance study of the poisoning behaviour of Ni-based anodes at low concentrations of H2S
in an MCFC. International Journal of Hydrogen Energy. 2012;37:19312-8.
[33] Doyon JD, Gilbert T, Davies G, Paetsch L. NiO solubility in mixed alkali/alkaline earth
carbonates. Journal of the Electrochemical Society. 1987;134:3035-8.
[34] Ota K, Mitsushima S, Kato S, Asano S, Yoshitake H, Kamiya N. Solubilities of nickel- oxide
in Molten Carbonate. Journal of the Electrochemical Society. 1992;139:667-71.
[35] Yoshioka S, Urushibata H. Simulation of cathode dissolution and shorting for molten
carbonate fuel cells. Journal of the Electrochemical Society. 1997;144:815-22.
[36] Kunz HR, Pandolfo JW. Effects of nickel oxide cathode dissolution on molten carbonate
fuel cell life. Journal of the Electrochemical Society. 1992;139:1549-56.
[37] Huang B, Chen G, Li F, Yu Q-c, Hu K-a. Study of NiO cathode modified by rare earth oxide
additive for MCFC by electrochemical impedance spectroscopy. Electrochimica Acta.
2004;49:5055-68.
[38] Lagergren C, Lundblad A, Bergman B. Synthesis and performance of LiCoO2 cathodes for
the molten carbonate fuel cell (MCFC). Journal of the Electrochemical Society. 1994;141:2959-
66.
[39] Wijayasinghe A, Bergman B, Lagergren C. LiFeO2-LiCoO2-NiO cathodes for molten
carbonate fuel cells. Journal of the Electrochemical Society. 2003;150:A558-A64.
[40] Yoshikawa M, Mugikura Y, Watanabe T, Kahara T, Mizukami T. NiO cathode dissolution
and Ni precipitation in Li/Na molten carbonate fuel cells - Distribution of Ni particles in the
matrix. Journal of the Electrochemical Society. 2001;148:A1230-A8.
[41] Matsuzawa K, Akinaga Y, Mitsushima S, Ota KI. Solubilities of NiO and LaNiO3 in Li/Na
eutectic carbonate with rare-earth oxide. Journal of Power Sources. 2011;196:5007-11.
60
[42] Ota K-i, Matsuda Y, Matsuzawa K, Mitsushima S, Kamiya N. Effect of rare earth oxides for
improvement of MCFC. Journal of Power Sources. 2006;160:811-5.
[43] Wee J-H, Lee K-Y. Overview of the effects of rare-earth elements used as additive
materials in molten carbonate fuel cell systems. Journal of Material Science. 2006;41:3585-92.
[44] Lindbergh G, Olivry M, Sparr M. Experimental investigation of the porous nickel anode in
the molten carbonate fuel cell. Journal of the Electrochemical Society. 2001;148:A411-A7.
[45] Boden A, Yoshikawa M, Lindbergh G. Influence of anode pore-size distribution and total
electrolyte filling degree on molten carbonate fuel cell performance. Journal of the
Electrochemical Society. 2008;155:B172-B9.
[46] Youn JY, Yoon SP, Han J, Nam SW, Lim TH, Hong SA, et al. Fabrication and characteristics
of anode as an electrolyte reservoir for molten carbonate fuel cell. Journal of Power Sources.
2006;157:121-7.
[47] Iaquaniello G, Mangiapane A. Integration of biomass gasification with MCFC.
International Journal of Hydrogen Energy. 2006;31:399-404.
[48] Cigolotti V, McPhail S, Moreno A. Nonconventional Fuels for High-Temperature Fuel Cells:
Status and Issues. Journal of Fuel Cell Science and Technology. 2009;6:021311-.
[49] Bove R, Lunghi P. Experimental comparison of MCFC performance using three different
biogas types and methane. Journal of Power Sources. 2005;145:588-93.
[50] Sánchez D, Monje B, Chacartegui R, Campanari S. Potential of molten carbonate fuel cells
to enhance the performance of CHP plants in sewage treatment facilities. International Journal
of Hydrogen Energy. 2013;38:394-405.
[51] Kawase M, Mugikura Y, Watanabe T, Hiraga Y, Ujihara T. Effects of NH3 and NOx on the
performance of MCFCs. Journal of Power Sources. 2002;104:265-71.
[52] Kawase M, Mugikura Y, Izaki Y, Watanabe T, Ito Y. Effects of fluoride on the performance
of MCFCs. Journal of Power Sources. 2003;124:52-8.
[53] Nunokawa M, Kobayashi M, Shirai H. Halide compound removal from hot coal-derived
gas with reusable sodium-based sorbent. Powder Technology. 2008;180:216-21.
[54] Haga K, Adachi S, Shiratori Y, Itoh K, Sasaki K. Poisoning of SOFC anodes by various fuel
impurities. Solid State Ionics. 2008;179:1427-31.
[55] Ajhar M, Travesset M, Yuce S, Melin T. Siloxane removal from landfill and digester gas - A
technology overview. Bioresource Technology. 2010;101:2913-23.
[56] Papadias DD, Ahmed S, Kumar R. Fuel quality issues with biogas energy – An economic
analysis for a stationary fuel cell system. Energy. 2012;44:257-77.

61
[57] Weaver D, Winnick J. Sulfation of the Molten Carbonate Fuel-Cell Anode. Journal of the
Electrochemical Society. 1989;136:1679-86.
[58] Hernandez S, Scarpa F, Fino D, Conti R. Biogas purification for MCFC application.
International Journal of Hydrogen Energy. 2011;36:8112-8.
[59] Zaza F, Paoletti C, LoPresti R, Simonetti E, Pasquali M. Studies on sulfur poisoning and
development of advanced anodic materials for waste-to-energy fuel cells applications. Journal
of Power Sources. 2010;195:4043-50.
[60] Kawase M, Mugikura Y, Watanabe T. The effects of H2S on electrolyte distribution and cell
performance in the molten carbonate fuel cell. Journal of the Electrochemical Society.
2000;147:1240-4.
[61] Uchida I, Ohuchi S, Nishina T. Kinetic-Studies of the Effects of H2S Impurity on Hydrogen
Oxidation in Molten (Li+K)CO3. Journal of Electroanalytical Chemistry. 1994;369:161-8.
[62] Vogel WM, Smith SW. The Effect of Sulfur on the Anodic H2 (Ni) Electrode in Fused
Li2CO3-K2CO3 at 650oC. Journal of the Electrochemical Society. 1982;129:1441-5.
[63] Di Giulio N, Bosio B, Cigolotti V, Nam SW. Experimental and theoretical analysis of H2S
effects on MCFCs. International Journal of Hydrogen Energy. 2012;37:19329-36.
[64] Ciccoli R, Cigolotti V, Lo Presti R, Massi E, McPhail SJ, Monteleone G, et al. Molten
carbonate fuel cells fed with biogas: Combating H2S. Waste Management2010. p. 1018-24.
[65] Cigolotti V, McPhail S, Moreno A, Yoon S, Han J, Nam S, et al. MCFC fed with biogas:
Experimental investigation of sulphur poisoning using impedance spectroscopy. International
Journal of Hydrogen Energy. 2011;36:10311-8.
[66] Watanabe T, Izaki Y, Mugikura Y, Morita H, Yoshikawa M, Kawase M, et al. Applicability of
molten carbonate fuel cells to various fuels. Journal of Power Sources. 2006;160:868-71.
[67] Di Giulio N, Audasso E, Bosio B, Han J, Nam SW, McPhail S, et al. The SO2 poisoning
influence on the kinetics of MCFC. In: Cigolotti V, editor. EFC2013. Rome2013. p. 257-8.
[68] IPCC. IPCC special report on carbon dioxide capture and storage. Prepared by Working
Group III of the Intergovernmental Panel on Climate Change. In: Metz B, Davidson O, Coninck
Hd, Loos M, Meyer L, editors. Cambridge, United Kingdom2005.
[69] Desideri U, Proietti S, Sdringola P, Cinti G, Curbis F. MCFC-based CO2 capture system for
small scale CHP plants. International Journal of Hydrogen Energy. 2012;37:19295-303.
[70] Chiesa P, Campanari S, Manzolini G. CO2 cryogenic separation from combined cycles
integrated with molten carbonate fuel cells. International Journal of Hydrogen Energy.
2011;36:10355-65.
62
[71] Campanari S. Carbon dioxide separation from high temperature fuel cell power plants.
Journal of Power Sources. 2002;112:273-89.
[72] Caprile L, Passalacqua B, Torazza A. Carbon capture: Energy wasting technologies or the
MCFCs challenge? International Journal of Hydrogen Energy. 2011;36:10269-77.
[73] Di Giulio N, Bosio B, Han J, McPhail SJ. Experimental analysis of SO2 effects on Molten
Carbonate Fuel Cells. International Journal of Hydrogen Energy. 2014;39:12300-8.
[74] Malek Abbaslou RM, Soltan Mohammadzadeh JS, Dalai AK. Review on Fischer- Tropsch
synthesis in supercritical media. Fuel Process Technology2009. p. 849-56.
[75] Ball M, Wietschel M. The future of hydrogen - opportunities and challenges. International
Journal of Hydrogen Energy. 2009;34:615-27.
[76] Tao Y, Nishino H, Ashidate S, Kokubo H, Watanabe M, Uchida H. Polarization properties of
La 0.6 Sr 0.4 Co 0.2 Fe 0.8 O 3 -based double layer-type oxygen electrodes for reversible
SOFCs. Electrochimica Acta. 2009;54:3309-15.
[77] Kaplan V, Wachtel E, Gartsman K, Feldman Y, Lubomirsky I. Conversion of CO2 to CO by
Electrolysis of Molten Lithium Carbonate. Journal of the Electrochemical Society
2010;157:B552-B6.
[78] Kaplan V, Wachtel E, Lubomirsky I. Titanium Carbide Coating of Titanium by Cathodic
Deposition from a Carbonate Melt. Journal of the Electrochemical Society. 2012;159:E159-
E61.
[79] Alvarez H. Energiteknik: Studentlitteratur; 2003.
[80] Sugiura K, Takei K, Tanimoto K, Miyazaki Y. The carbon dioxide concentrator by using
MCFC. Journal of Power Sources. 2003;118:218-27.
[81] Rexed I, Lagergren C, Lindbergh G. Effect of sulfur contaminants on MCFC performance.
International Journal of Hydrogen Energy. 2014;39:12242-50.
[82] Ebbesen SD, Knibbe R, Mogensen M. Co-Electrolysis of Steam and Carbon Dioxide in Solid
Oxide Cells. Journal of the Electrochemical Society. 2012;159:F482-F9.
[83] Yuh CY, Selman JR. Polarization of molten carbonate fuel cell electrodes II.
Characterization by AC impedance and response to current interruption. Journal of the
Electrochemical Society. 1991;138:3649-365.
[84] Yuh CY, Selman JR. Characterization of fuel cell electrode processes by AC impedance.
AIChE Journal. 1988;34:1949-58.

63