application of the x-ray absorption technique for
TRANSCRIPT

Application of the X-ray absorption technique for monitoring hydration and setting processes in cementitious composites
A. J. Klemm & P. Baker Glasgow Caledonian University, UK
Abstract
This paper presents an application of the X-ray absorption technique for monitoring hydration and setting processes in cementitious composites. The method, which is a relatively new approach in concrete research, is based on the measurement of attenuation of a finely collimated beam of X-rays by a sample. The absorption of X-rays by sample is proportional to the material density. Changes of density in a function of time can be related to the absorption and moisture transport within porous media. Although interpretation of the results may be very problematic, chemical and physical reactions associated with hydration may be qualitatively analysed by this technique. This paper is focused on a setting process of cement mortars modified by superabsorbent polymers. Keywords: X-ray absorption, hydration process, cementitious materials, superabsorbent polymers.
1 Introduction
1.1 Background
Application of the X-ray absorption technique for monitoring hydration and setting processes in cementitious composites is a relatively new approach in concrete research. The method is based on the measurement of attenuation of a finely collimated beam of X-rays by a sample. The absorption of X-rays by sample is proportional to the material density. Changes of density in a function of time can be related the absorption and transport of moisture in porous materials. Experimental results may be used in simulation models for predicting moisture movement at material inter phases and other macroscopic features [1].
www.witpress.com, ISSN 1743-3533 (on-line) WIT Transactions on Engineering Sciences, Vol 77, © 2013 WIT Press
doi:10.2495/MC130211
Materials Characterisation VI 241

Some attempts were also made to monitor progress of hydration process [2-4]. Although interpretation of the results may be very problematic chemical and physical reactions associated with hydration may be examined by this technique. Recorded alterations in densities of cementitious systems resulting from the formation of hydration products and microstructural changes, especially at early ages, are valuable information in the hydration process analysis.
1.2 Hydration process of Portland cement
The vast majority of cements used in the construction industry are based on Portland cement. In order to obtain its bonding properties Portland cement is mixed with water. It hardens with time and form hardened cement paste. Starting point for the reactions is the moment of water – cement contact. During the hydration process volume of pores is gradually reduced by newly created products of reaction. In the first few minutes after cement is mixed with water, the cement grains are wetted and CaSO4 and C3A are hydrated [5]. The aluminate phase reacts with gypsum, and on the surface of the grains, ettringite is formed, preventing hydration for a certain period of time. At the same time, a coat of CSH gels is formed on the surface of C3S grains. Then hydration reactions slow down for few hours (1-6 hours) depending on the conditions. When the concentration of Ca2+ ions reaches the state of oversaturation the process of CSH gel formation begins. In the next 8–14 hours C3S reacts quickly at the formation of CSH gel and Ca(OH)2, which is precipitated in the form of crystals of portlandite. A basic solid structure is formed by C-S-H gel, crystalline phases of aluminates and ferrites, and by ettringite (Figure 1).
Figure 1: Hydration products in immature cement pastes.
Simultaneously, reduction of porosity takes place and plastic structure turns into solid structure. Final set is obtained in this stage. The concentration of SO4
2- ions decreases by consuming CaSO4 in cement and ettringite begins to react with unreacted C3A to form monosulphate 3CaO.Al2O3.CaSO4.12H2O. After all ettringite has transformed to monosulphate, no CaSO4 is available for the reaction with aluminoferrite phase. The products of hydration of cement are
www.witpress.com, ISSN 1743-3533 (on-line) WIT Transactions on Engineering Sciences, Vol 77, © 2013 WIT Press
242 Materials Characterisation VI

chemically the same as products of hydration of the individual compounds under similar conditions [6, 7].
1.3 Superabsorbent polymer (SAP)
Application of superabsorbent polymers (SAP) significantly changes water management of the system and the kinetics of hydration process. SAP is a general term referring to polymers that are able to absorb and retain a large amount of water when compared to their own weight and slowly release it as the hydration process continues preventing self-desiccation [8, 9]. The importance of SAP particles is based on a process of formation of a system of fine, evenly distributed pores, which are filled with water in fresh or young concrete. These air-filled pores may be to a great extent empty in the hardened concrete, performing similarly to air-entrained pores or in a collapsed state of SAP may be filled with hydration products [10–12]. Figure 2 shows superabsorbent polymer during the water absorption phase [13].
Figure 2: Superabsorbent polymers.
The paper will present results of the X-ray absorption analysis of hydration process and early curing in cementitious mortars modified by the superabsorbent polymers.
2 Experimental method
X-ray adsorption chamber is used to measure the attenuation of a finely collimated beam of X-rays by a sample. The apparatus consists of an X-ray source (up to 70 keV) and a cadmium–zinc–telluride (CZT) high resolution detector with a range of collimators to define the spatial resolution of the system to less than 1 mm. These are supported on a movable gantry within a climate controlled chamber. A dedicated PC and software allows fully-automated measurement, data collection and processing. The PC also controls the precise location of the gantry to within 0.05 mm as well as the chamber temperature and humidity. A sample is positioned between the X-ray source and the detector. The working space in the chamber is 790 mm along the horizontal-axis, 419 mm
www.witpress.com, ISSN 1743-3533 (on-line) WIT Transactions on Engineering Sciences, Vol 77, © 2013 WIT Press
Materials Characterisation VI 243

along the vertical-axis and 368 mm between the X-ray source and detector. Figure 3 shows operation schema of the X-ray apparatus.
Figure 3: Operation schema of the X-ray apparatus.
It allows for a large sample size or a number samples to be tested in the same sequence. The location of the sample within the chamber may be determined precisely relative to the detector gantry. The movement of the gantry may then be programmed to enable the scanning of the sample at precise locations. The main advantages over other available moisture measurement systems (such as Nuclear Magnetic Resonance), include [1]: • rapid, precise measurement of the two-dimensional distribution of moisture in samples large enough to be representative of the macroscopic features; • very high spatial resolution, allowing the collection of data for fundamental research on transport coefficients and processes at material interfaces; • multi-tasking – the measurement of a number of samples sequentially.
The attenuation of X-rays in an absorbing medium is governed by Beer’s law: (1) where: I0 is the incident X-ray intensity; I is the transmitted X-ray intensity; µ is the mass attenuation coefficient; ρ is the density of the medium; x its thickness.
The attenuation coefficient can be determined experimentally by measuring the intensities I0 and I of the X-ray beam reaching a detecting device without and with an absorber of thickness x interposed. In an attempt to analyse changes that occur during curing, water movement in cementitious specimens has been continuously monitored in the X-ray environmental chamber. Since the X-ray absorption is proportional to the density of the materials through which the X-rays are passing, a low w/c ratio (denser) paste absorbs more X-rays than a higher w/c ratio paste that is associated with the reduced counts throughout the thickness of the specimen. Similarly, a paste, which has dried out absorbs less X-rays than the same paste under its initial saturated [2].
X –ray source Sample
Detector
X-ray
www.witpress.com, ISSN 1743-3533 (on-line) WIT Transactions on Engineering Sciences, Vol 77, © 2013 WIT Press
244 Materials Characterisation VI
3 Materials tested
For the purpose of this research cement was mixed with fine sand at 1:1 and 2:1 sand/cement ratio (s/c by weight). Throughout the investigation an even total water to cement ratio of 0.45 was maintained for all mixes: reference samples (R1 and R2) and samples with SAP additions (A1, B1, C1, A2, B2, C2). Three types of SAPs were used in concentration of 0.25 % by weight of cement content. The effective water to cement ratio (w/c)eff for mixes containing SAPs was lower than total water to cement ratios (w/c) due to water absorption by SAPs. Detailed information about mix composition is presented in Table 1.
Table 1: Cement mortar composition.
Mix code A1 B1 C1 R2 A2 B2 C2
s/c 1:1 1:1 1:1 1:1 2:1 2:1 2:1 2:1 (w/c)tot 0.45 0.45 0.45 0.45 0.45 0.45 0.45 0.45
(w/c)eff 0.45 0.42 0.43 0.37‐0.39
0.45 0.42 0.43 0.37‐0.39
SAP [%]
0 0.25 0.25 0.25 0 0.25 0.25 0.25
Portland fly ash cement CEM II/B-V 32.5R was used in this study. All polymers have absorption capacity of 200-250 ml/g in demineralised water. However, their absorption characteristics in cement paste solution differ significantly; approximately 10 g/g for SAP A, 5 g/g for SAP B and 25-30 g/g for SAP C [13].
4 Experimental results and analysis
The measurements in the X-ray absorption chamber commenced approximately 15 minutes after water addition and the intensities I0 (incident X-ray intensity) and I (transmitted X-ray intensity) were measured. The location of the sample within the chamber was determined precisely by a series of ‘dry’ runs. The sealed transparent containers (70 x 70 x 70 mm) used for the mortar tests were located on a stand within the chamber, separated by metal spacer and a scanning sequence was carried out. The scans across the samples were taken at approximately half-way up the container: The minimum achievable interval between the start of successive scans was 20–30 minutes. Figure 4 shows samples positions inside the X-ray absorption facility. The natural logarithm of the detector count has been used as a metric which is inversely proportional to the density multiplied by the mass attenuation coefficient, assuming constant incident X-ray intensity during the test. The increase in the detector count represents a reduction in density or the attenuation coefficient.
www.witpress.com, ISSN 1743-3533 (on-line) WIT Transactions on Engineering Sciences, Vol 77, © 2013 WIT Press
Materials Characterisation VI 245

Figure 4: Samples position in the X-ray absorption chamber.
The profiles of measured attenuations of X-ray beam by samples with sand to cement ratio 1:1 are shown in Figure 5. Results represent recordings from the initial 24 hours for each sample approximated by polynomials’ of fourth degree.
Figure 5: X-ray absorption results for mortar mixes with sand to cement ratio 1:1 for initial 24 hours.
Due to the fact that samples were completely sealed during the measurements and there was no evaporation from their surfaces, desorption of SAPs was probably delayed and not as intense as in normal curing conditions. By the time of first readings (15 min) a significant part of the mixing water could have been absorbed by the superabsorbent polymers. In the first fifteen hours after water
7
7.2
7.4
7.6
7.8
8
0:00 3:00 6:00 9:00 12:00 15:00 18:00 21:00 0:00
Ln (Count)
Time (hours)
R A B C
www.witpress.com, ISSN 1743-3533 (on-line) WIT Transactions on Engineering Sciences, Vol 77, © 2013 WIT Press
246 Materials Characterisation VI

addition densification has been observed. This trend has changed in the following hours. The results obtained for sample A have indicated lower density and for samples B higher density than the reference sample. During the first day of hydration mix containing SAP C has followed the pattern of reference sample in first day of hydration. Almost instantaneous absorption of high amount of water was responsible for the similarities in behaviour. This water was gradually released leading to formation of a denser CSH network. Results shown in Figure 6 represent daily average of recordings for each sample during the first six weeks. Rather insignificant changes have been recorded during testing, however some densification has been observed from the fourth week for all samples. Between second and third week sample C has started to more resemble sample A, while sample B shown some similarities to the reference sample R. This could be attributed to delayed water desorption of SAP C in cementitious composites.
Figure 6: X-ray absorption results for mortar mixes with sand to cement ratio 1:1.
Figure 7 presents the X-ray absorption results for mortar mixes with sand to cement ration 2:1 for the initial 24 hours. The higher values have given an indication of less denser microstructure than for samples with 1:1 sand to cement ratio. This may be associated with lower percentage of cement paste in the mixes. Moreover, the change in densification trend has been observed, similarly to samples with 1:1 ratio, after about fifteen hours. Since cement used in the study contained substantial fly ash addition, the large amounts of aluminates appeared in the mixes. Thus, when aluminates have started to react with calcium hydroxide, this could have inverted the values trend. Similarly to samples with s/c 1:1, the resemblance of the reference samples R and B is well pronounced. After the period of 12 hours significant increase in densities has taken place in all samples. Lower densities have been recorded for sample B, which absorbs water in the smallest quantities and then slowly release
7.27.37.47.57.67.77.87.98.08.18.2
0 7 14 21 28 35 42
Ln (Count)
Days
R A B C
www.witpress.com, ISSN 1743-3533 (on-line) WIT Transactions on Engineering Sciences, Vol 77, © 2013 WIT Press
Materials Characterisation VI 247
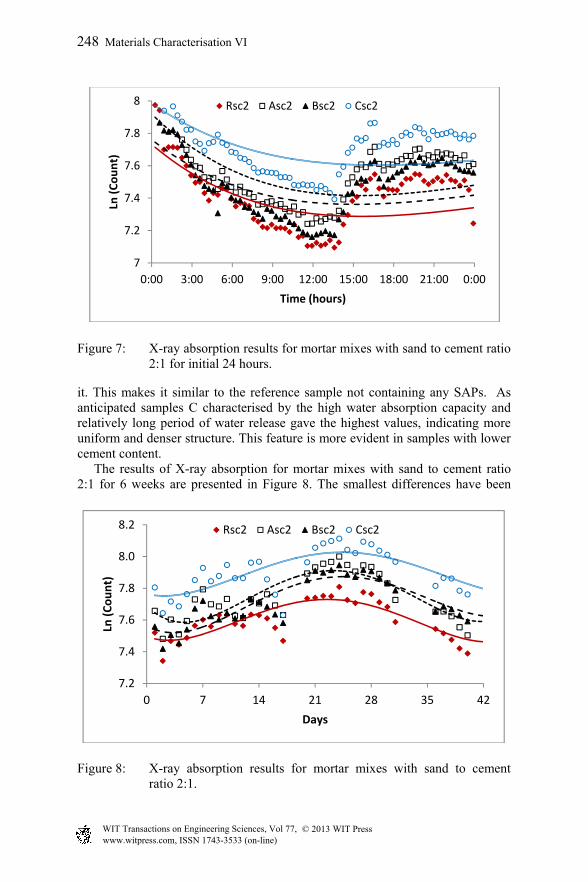
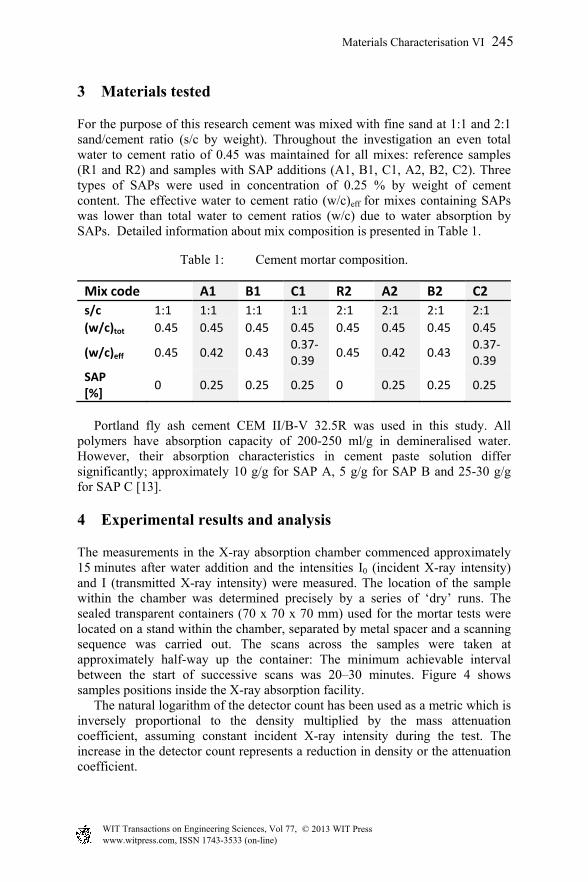
Figure 7: X-ray absorption results for mortar mixes with sand to cement ratio 2:1 for initial 24 hours.
it. This makes it similar to the reference sample not containing any SAPs. As anticipated samples C characterised by the high water absorption capacity and relatively long period of water release gave the highest values, indicating more uniform and denser structure. This feature is more evident in samples with lower cement content. The results of X-ray absorption for mortar mixes with sand to cement ratio 2:1 for 6 weeks are presented in Figure 8. The smallest differences have been
Figure 8: X-ray absorption results for mortar mixes with sand to cement ratio 2:1.
7
7.2
7.4
7.6
7.8
8
0:00 3:00 6:00 9:00 12:00 15:00 18:00 21:00 0:00
Ln (Count)
Time (hours)
Rsc2 Asc2 Bsc2 Csc2
7.2
7.4
7.6
7.8
8.0
8.2
0 7 14 21 28 35 42
Ln (Count)
Days
Rsc2 Asc2 Bsc2 Csc2
www.witpress.com, ISSN 1743-3533 (on-line) WIT Transactions on Engineering Sciences, Vol 77, © 2013 WIT Press
248 Materials Characterisation VI

observed for reference sample referring to highest density of mix. An increase in densities has been observed for samples modified by SAPs, although of much bigger magnitude and earlier for sample A. Results obtained after 6 weeks of curing for samples A and B is comparable; however sample C has shown less dense structure. This phenomenon has been recorded at every point for sample with sand to cement ratio 2:1, indicating different absorption/desorption characteristics than SAP A and SAP B.
5 Summary
The recorded values refer to the sealed system, comprising; newly created hydration products, water absorbed by the polymers, free water, pores and some unreacted cement particles. Prolonged period of time leads to more water being consumed for creation of smaller volume of solid phase. Therefore, after the initial densification of internal structure, a steady decrease has been observed. The process is very complex, particularly in case of blended cements and its understanding requires further thorough investigation. Undoubtedly absorption/desorption of water by SAPs has a strong impact on the kinetics of hydration process and consequently on formation of microstructure. Even though the quantitative assessment of densities is not possible a qualitative analysis can be successfully performed by the X-ray absorption technique. The most pronounced differences between samples have been observed during the first 24 hours when the water desorption processes are the most intense. This applies to both cement to sand ratios, however the results were more consistent for mixes with lower cement content. High cement content and hence higher percentage of superabsorbent polymers makes the water management more complex and more difficult to analyse. The characteristic feature, clearly identifiable from X-ray absorption, was the similarity between samples R and B as well as samples A and C. The latter contained SAPs with higher water absorption capacities and hence the stronger effect on microstructure formation. X-ray absorption may also find an application in the assessment of water desorption of SAPs in cementitious matrices. A sudden increase in X-ray absorption gives an indication of the intensified CSH formation and thus increased water release.
References
[1] Baker, P. H., Bailly, D., Campbell, M., Galbraith, G. H., McLean, R. C., Poffa, N., Sanders, C. H., The application of X-ray absorption to building moisture transport studies. Measurement, 40, 951-959 (2007).
[2] Bentz, D. P., Hansen, K. K., Preliminary observations of water movement in cement pastes during curing using X-ray absorption. Cement and Concrete Research, 30, 1157-1168 (2000).
www.witpress.com, ISSN 1743-3533 (on-line) WIT Transactions on Engineering Sciences, Vol 77, © 2013 WIT Press
Materials Characterisation VI 249

[3] Benz D.P., Hansen, K.K., Madsen H.D., Vallee F., Griesel E.J., Drying/hydration in cement pastes during curing. Materials and Structures, 24, 557-565, (2001).
[4] Hu J., Stroeven P., X-ray absorption study of drying cement paste and mortar, Cement and Concrete Research, 33, 397-403, (2003).
[5] Cerny R., Rovnanikova P., Transport processes in concrete, London: Spon Press (2002).
[6] Bogue R..H., Lerch W., Hydration of Portland cement compounds, Industrial Engineering Chemistry, 837-847 (1934).
[7] Neville A.M., Properties of concrete, Harlow: Longman Group Ltd. (1995). [8] Jensen O. M., Hansen P. F., ‘Water-entrained cement-based materials I.
Principles and theoretical background’, Cement and Concrete Research, 31, 647-654 (2001).
[9] Jensen O. M., Hansen P. F., Water-entrained cement-based materials II. Experimental observations, Cement and Concrete Research, 32, 973-978 (2002).
[10] Reinhardt H. W., Assmann A, Enhanced durability of concrete by superabsorbent polymers, Proc. Int. Symp. Brittle Matrix Composites 9, Warsaw (2009).
[11] Mönnig S., Lura P., ‘Superabsorbent Polymers – An Additive to Increase the Freeze-Thaw Resistance of High Strength Concrete, Advances in Construction Materials, V, 351-358 (2007).
[12] Klemm A.J., Sikora K., The effect of cement type on the performance of mortars modified by superabsorbent polymers, Conference Proceedings the 3rd ICCRRR, Cape Town, South Africa, (2012).
[13] Sikora K., The effect of superabsorbent polymers on the properties of cementitious mortars containing fly ash, PhD Thesis, Glasgow Caledonian University, (2013).
www.witpress.com, ISSN 1743-3533 (on-line) WIT Transactions on Engineering Sciences, Vol 77, © 2013 WIT Press
250 Materials Characterisation VI