application of the simplified biogeochemical process (simplb) model to determine the impact of...
TRANSCRIPT
S
A(d
KD
a
A
R
R
1
A
P
K
A
S
B
F
J
1
TtcpeaaDacM
0d
e c o l o g i c a l m o d e l l i n g 2 0 5 ( 2 0 0 7 ) 265–269
avai lab le at www.sc iencedi rec t .com
journa l homepage: www.e lsev ier .com/ locate /eco lmodel
hort communication
pplication of the simplified biogeochemical processSIMPLB) model to determine the impact of acidiceposition on a Japanese cedar forest soil
azuo Ito ∗
epartment of General System Engineering, Osaka Prefectural College of Technology, Saiwai 26-12, Neyagawa-shi, Osaka, Japan
r t i c l e i n f o
rticle history:
eceived 1 September 2005
eceived in revised form
1 February 2007
ccepted 20 February 2007
ublished on line 5 April 2007
eywords:
a b s t r a c t
The simplified biogeochemical process model (SIMPLB model) for determination of the
impact of acidic deposition was applied to a Japanese cedar forest at Mt. Myougi in Gunma
Pref. in central Japan. This dynamic model characterizes the biogeochemical processes of
net nutrient cycling as the reduction ratio, K(RED), which is the ratio of the return by min-
eralization of litterfall to the root uptake of nutrients. The SIMPLB model estimates these
biogeochemical processes from the nitrate concentration of the soil solution, without it
being necessary to measure other biogeochemical parameters. About 1 year of observed
data and values simulated by the model on the basis of soil data measured at the applica-
cidic deposition
IMPLB model
iogeochemical process
orest soil
apanese cedar
tion site were compared to evaluate the SIMPLB model. The results showed that the SIMPLB
model can use the yearly average K(RED) value for the long-term prediction of soil acidifica-
tion. At the study site, the forest trees are about 38 years old, and the soil, an Andosol, is a
black soil common in Japan. The SIMPLB model predicted soil chemistry changes until 2035
according to a deposition scenario.
cation site.
. Introduction
he prediction of acidification of forest soil and freshwa-er by acidic deposition is the focus of much interest. Manyomputer simulation models have been developed for thisurpose. MAGIC (Cosby et al., 1985) and SAFE (Sverdrupt al., 1995) are dynamic models that have been accepteds useful tools with many applications. Other models suchs the SO-Model (Alewell and Manderscheid, 1998) and theayCent-Chem model (Hartman et al., 2007) have been
pplied to some forest ecosystems. It is important to consideromplex biogeochemical processes in developing a model.odels that incorporate detailed biogeochemical processes∗ Tel.: +81 72 820 8567; fax: +81 72 821 0134.E-mail address: [email protected].
304-3800/$ – see front matter © 2007 Elsevier B.V. All rights reserved.oi:10.1016/j.ecolmodel.2007.02.017
© 2007 Elsevier B.V. All rights reserved.
(e.g., RESEM; De Vries et al., 1995) can predict acidificationwith high accuracy. Typically, however, such models requirethe input of data for many parameters, the acquisition ofwhich involves much time and trouble. Thus, a convenientprediction model should simplify complex biogeochemicalprocesses.
In the MAGIC and SAFE models, biogeochemical processesare estimated by using data previously obtained by detailedexperimental measurements of forest production at the appli-
The purpose of this study was to develop a new model inwhich biogeochemical processes were simplified, and to applythe model to an actual forest soil to evaluate the simplification.

i n g
266 e c o l o g i c a l m o d e l l2. Model description
The simplified biogeochemical process model (the SIMPLBmodel) for the prediction of soil acidification is a dynamicmodel similar to the MAGIC and SAFE models. The basic con-cept of the model follows that of Reuss (1980) as well as thatof the MAGIC model. The soil chemical processes evaluated bythe SIMPLB model are cation exchange reactions between thesoil solution and the soil matrix, dissolution of cations fromsoil particles (chemical weathering), hydrolysis of aluminumhydroxide, adsorption of sulfate ions onto soil particles, andthe equilibrium reaction between carbon dioxide and soilwater. The biogeochemical processes evaluated by the SIM-PLB model are nutrient uptake by roots and mineralizationof fallen leaves and branches (litterfall) by decomposition bymicroorganisms, and nitrification by microorganisms. Cationexchange is modeled by the Gaines–Thomas equation (Gainesand Thomas, 1953), as in many other models. The hydrogenion was used as the comparison ion for ease of calculation, asfollows:
HXn
MX= S
(HM
)[H+]n
[Mn+](1)
where Mn+ represents Al3+, Ca2+, Mg2+, Na+, and K+, respec-tively. MX and HX represent cations adsorbed on the soilmatrix. S(H/M) is a selectivity coefficient here, and is notstrictly constant, but dependent on pH, as has been pointedout on the basis of measurements in 12 Japanese forestsoils (Shindo and Hakamada, 1998). However, because the pHdependency is small, the selectivity coefficient is consideredto be constant in this simplified model. The amount of cationsentering the soil solution by chemical weathering of the soilwas measured by the experimental method of van Grinsvenand van Riemsdijk (1991). The adsorption reaction of the sul-fate ion is expressed by the Langmuir equation. Reportedvalues for the dissolution constant for carbon dioxide in soilwater (Harned, 1943) and aluminum hydroxide in soil (Hem,1968) are used.
The biogeochemical process was simplified as follows.Most nitrate in the soil is not involved in ion exchange, adsorp-tion, or weathering; instead, the nitrate concentration in thesoil is mostly determined by mineralization of the litterfall bythe action of microorganisms (NO3(L)), root uptake by trees(NO3(R)), and deposition (NO3(D)). It was assumed that mostammonium in the soil is converted into nitrate because ofthe relatively high nitrification rate in this forest. Thus, bothnitrate (NO3(D)) and ammonium (NH4(D)) deposition providesoil nitrate. Therefore, nitrate (NO3(S)) in the soil is determinedas follows:
NO3(S) = NH4(D) + NO3(D) + NO3(L) − NO3(R) (2)
The total amount of nitrate supplied by mineralization lessthat removed by root uptake is referred to as net nitrate,
NO3(NET). Then, NO3(NET) can be written asNO3(NET) = NO3(L) − NO3(R) = NO3(L) − NO3(L)K(RED)
(3)
2 0 5 ( 2 0 0 7 ) 265–269
K(RED) = NO3(L)NO3(R)
(4)
Here, the reduction ratio, K(RED), which is the ratio of thenitrate returned to the soil by mineralization of the litterfall(NO3(L)) to the root uptake (NO3(R)) of nitrate, expresses thenet reduction of nitrate. The nitrate concentration in the soilis shown by the next equation.
NO3(S) = NH4(D) + NO3(D) + NO3(L)(
1 − 1K(RED)
)(5)
The nitrogen content of the litterfall of various trees has beenreported many times, as well as the contents of other nutrientsin the litterfall (e.g., Kawada, 1989). Therefore, by measuringonly the amount of nitrate ion in the soil, the reduction ratioK(RED) can be obtained. In addition, the reduction ratio ofother nutrients was presumed to be determined in the sameway as that of nitrate. Thus,
nutrients (NET) = nutrients(L)(
1 − 1K(RED)
)(6)
Few accepted data on sodium content are available, but thesodium content in the litterfall is usually much lower than thatof other elements. In a detailed discussion, the mineraliza-tion of roots must be considered. However, because the valueis very small in relation to the mineralization of fallen leavesand branches, it is disregarded here. As mentioned above, thenotable feature of this simplified model is that biogeochemicalprocesses are estimated from only the NO3
− ion concentra-tion in the soil at a site. The one-layer implementation ofthe SIMPLB model is applied to the layer from the surface to15 cm depth, but the SIMPLB model can be easily expanded forapplication to multiple layers.
3. Data from the model application site
The SIMPLB model was applied to an actual forest soil, andthe validity of its simplification of the biogeochemical pro-cesses was evaluated. The site is a Japanese cedar (Cryptomeriajaponica) forest on Mt. Myougi in Gunma Pref., about 50 kmnorth of Tokyo in central Japan. This Japanese cedar foresthas been studied previously (e.g., Wakamatsu et al., 2001).The age of trees is 38 years, and the Andosol soil is a blacksoil common in Japan. Some soil data and deposition datafor this site were previously reported (Takahashi et al., 1997;Wakamatsu et al., 1998). The rates of cation release by weath-ering, the Langmuir equation constant for the sulfate ion,and the amount of exchangeable aluminum were measuredby using a soil sample provided by Wakamatsu. The modelwas applied only to the surface soil (0–15 cm depth), becausemost of the root system of the Japanese cedar is in the surfacelayer. The values for throughfall and open-air deposition atthe site are shown in Table 1. The deposition scenario used inthe simulation postulated an increase in deposition until 2015,
based on the calculations of Klimont et al. (2001), and a subse-quent decrease (Table 2). The decrease after 2015 was used toconfirm the model’s response. Table 3 shows the dissolutionconstant of aluminum hydroxide, the amount of exchangeable
e c o l o g i c a l m o d e l l i n g 2 0 5 ( 2 0 0 7 ) 265–269 267
Table 1 – Deposition data of cations and anions used in the long-term simulation
Type of deposition Deposition (equiv. ha−1 year−1) pH
Ca2+ Mg2+ K+ Na+ NH4+ SO4
2− NO3− Cl−
Throughfall 622 256 464 146 427 619 622 549 4.74Open area 180 39 31 117 588 493 565 246 4.40
Data from Takahashi et al. (1997).
Table 2 – Deposition scenario for SO42−, NO3
−, and NH4+
used in the long-term simulation
Year Deposition (equiv. ha−1 year−1)
SO42− NO3
− NH4+
2005 562 644 6702015 660 757 7872025 562 644 6702035 464 531 553
Scenario based on the estimation of Klimont et al. (2001).
Table 3 – Soil parameters used in the simulation
Parameter Values
Depth (m) 0.15a
Bulk density (kg m−3) 672b
Cation exchange capacity (mequiv. kg−1) 240a
Exchangeable Ca2+ (mequiv. kg−1) 55a
Exchangeable Mg2+ (mequiv. kg−1) 4a
Exchangeable Na+ (mequiv. kg−1) 0.5a
Exchangeable K+ (mequiv. kg−1) 3a
Log solubility of Al(OH)3 (gibbsite) 9.3c
SO42− adsorption, half-saturation (mequiv. m−3) 268d
SO42− adsorption, maximum capacity (mequiv. kg−1) 12.3d
Weathering rate, Ca2+ (mequiv. m−2 year−1) 160d
Weathering rate, Mg2+ (mequiv. m−2 year−1) 10.1d
Weathering rate, Na+ (mequiv. m−2 year−1) 53.1d
Weathering rate, K+ (mequiv. m−2 year−1) 34.2d
a Data from Wakamatsu et al. (1998).b
cctfu
Data from Kawada (1989).c Data from Hem (1968).d Data measured in our laboratory.
ations, CEC, the base saturation, the weathering rate of each
ation, and the Langmuir constant for sulfate at the applica-ion site. The reduction ratio, K(RED) in the Japanese cedarorest at the application site was 0.75, which was calculatedsing the average annual litterfall value (Kawada, 1989). TheTable 4 – Comparison between observed soil data and values si
Variable June–October
Observed Model Obse
K+ (mmol/l) 0.114 0.100 0.0Ca2+ (mmol/l) 0.214 0.149 0.1NO3
−(mmol/l) 0.513 0.289 0.2pH (mmol/l) 5.80 5.80 5.8
equilibrium constant K of the hydrolysis reaction of aluminumhydroxide in this model was 109.35 for microcrystalline gibb-site (Hem, 1968). The ammonium ion in soil solution was lessthan 0.002 mmol/l, so most ammonium in this forest soil hadbeen converted to nitrate.
4. Application and evaluation of theSIMPLB model
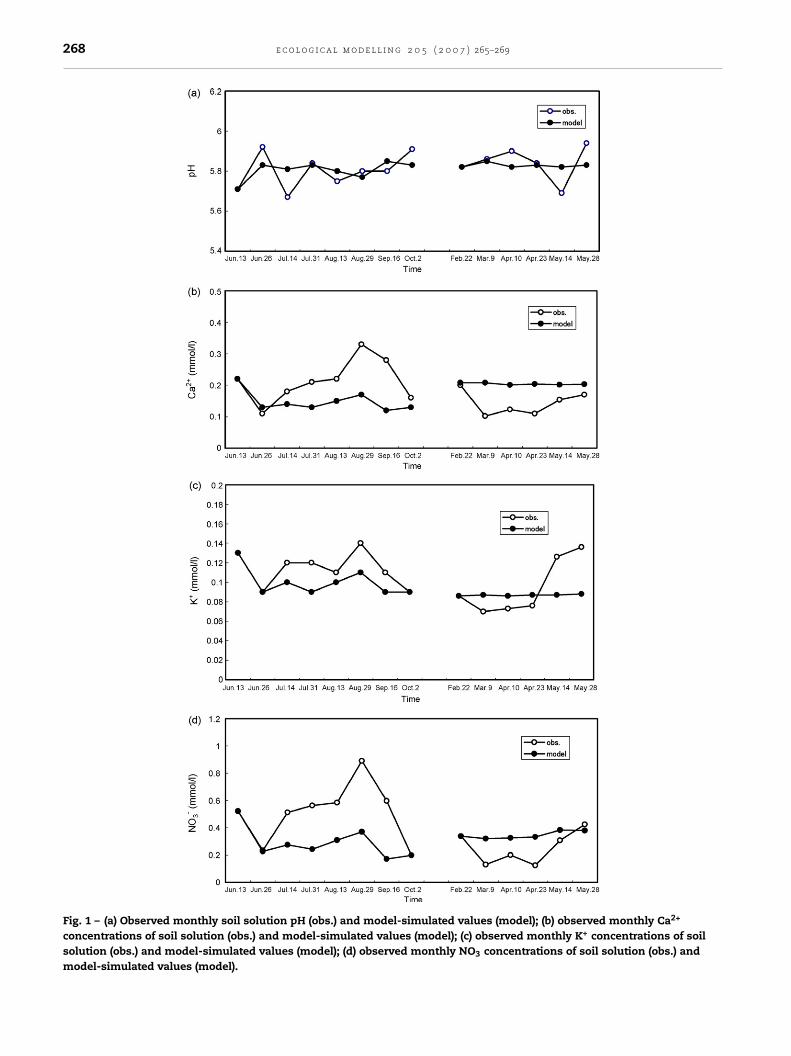
Observed data and values simulated by the model with soildata measured at the application site were compared fortwo periods, June–October and February–May in 1996–1997, toevaluate the SIMPLB model. The observed monthly soil solu-tion data and the monthly amount of rainfall were furnishedby Wakamatsu (unpublished data, 1998). Initial parametersof the model for summer were chosen on the basis of thedata collected in May, and those for winter, were based ondata collected in February. The simulated values for pH andthe three most abundant ions (Ca2+, K+, and NO3
−) showedsmaller variation than that in the observed data (Fig. 1). Allion values predicted by the model tended to be smaller thanthe observed values during June–October, and larger duringFebruary–May. These differences are attributed to the reduc-tion rate having been calculated using the average annuallitterfall values. The higher temperatures in the first period,and the lower temperatures in the second period, comparedwith the yearly average, would cause the reduction rate to belarger and smaller than the average reduction rate, respec-tively, and thus the simulated concentrations of each ion tobe smaller and larger, respectively, than those observed. Com-parison of yearly average values simulated by the model andobserved yearly average values (Table 4) indicates that pre-dicted values are mostly in accordance with observed values
for pH and these three ions; thus, the approximation in whichthe reduction rate of N is applied to other ions is mostly sup-ported. Therefore, the SIMPLB model is valuable for long-termprediction of soil acidification.mulated by the SIMPLB model
February–May Yearly average
rved Model Observed Model
95 0.087 0.104 0.09343 0.204 0.178 0.17754 0.347 0.383 0.3184 5.83 5.82 5.82
268 e c o l o g i c a l m o d e l l i n g 2 0 5 ( 2 0 0 7 ) 265–269
Fig. 1 – (a) Observed monthly soil solution pH (obs.) and model-simulated values (model); (b) observed monthly Ca2+
concentrations of soil solution (obs.) and model-simulated values (model); (c) observed monthly K+ concentrations of soilsolution (obs.) and model-simulated values (model); (d) observed monthly NO3 concentrations of soil solution (obs.) andmodel-simulated values (model).

e c o l o g i c a l m o d e l l i n g 2 0
Fig. 2 – Long-term soil solution pH predicted by the SIMPLBmodel.
Fig. 3 – Long-term soil solution base saturation predictedb
iasbt4saw
A
IRs
r
y the SIMPLB model.
Widespread damage to cedars and concurrent soil acid-fication have been observed in the Kanto plain, which isdjacent to the application site (Takahashi, 1990) and has theame type of Andosol soils. Therefore, the application site mayecome acidified in the future. Values for pH and base satura-ion are predicted by the SIMPLB model to decrease slowly over0 years (Figs. 2 and 3), but not suddenly as in the depositioncenario by Klimont et al. (2001). The SIMPLB model, applied toJapanese cedar forest in this study, will be applied to forestsith other species in the future.
cknowledgements
am deeply grateful to Dr. T. Wakamatsu of the Centralesearch Institute of Electric Power Industry, who provided soilamples and unpublished soil data from the application site.
5 ( 2 0 0 7 ) 265–269 269
e f e r e n c e s
Alewell, C., Manderscheid, B., 1998. Use of objective criteria forthe assessment of biogeochemical ecosystem models. Ecol.Model. 107, 213–224.
Cosby, B.J., Hornberger, G.M., Galloway, J.N., Wright, R.F., 1985.Modelling the effects of acid deposition: assessment of alumped-parameter model of soil water and stream waterchemistry. Water Resour. Res. 21, 51–63.
De Vries, W., Kros, J., van der Salm, C., 1995. Modelling the impactof acid deposition and nutrient cycling in forest soils. Ecol.Model. 79, 231–254.
Gaines, G.L., Thomas, H.C., 1953. Adsorption studies on clayminerals. II. A formulation of the thermodynamics ofexchange adsorption. J. Chem. Phys. 21, 714–718.
Harned, H.S., 1943. The ionization constant of carbonic acid inwater and the solubility of carbon dioxide in water andaqueous salt solutions from 0 to 50◦. J. Am. Chem. Soc. 65,2030–2037.
Hartman, M.D., Baron, J.S., Ojima, D.S., 2007. Application of acoupled ecosystem–chemical equilibrium model,DayCent-Chem, to stream and soil chemistry in a RockyMountain watershed. Ecol. Model. 200, 493–510.
Hem, J.D., 1968. Graphical methods for studies of aqueousaluminum hydroxide, fluoride and sulfate complexes. Geol.Surv. Water Supply Pap. 1827-B, 1–33.
Kawada, H., 1989. Introduction to Forest Soils. Hakuyu-sha,Tokyo, pp. 284, 322, 351, 353 (in Japanese).
Klimont, Z., Cofala, J., Schopp, W., Amann, M., Streets, D.G.,Ichikawa, Y., Fujita, S., 2001. Projections of SO2, NOx and VOCemissions in East Asia up to 2030. Water Air Soil Pollut. 130,193–198.
Reuss, J.O., 1980. Simulations of soil nutrient losses resultingfrom rainfall acidity. Ecol. Model. 11, 15–38.
Shindo, J., Hakamada, T., 1998. Prediction of soil chemistrychanges due to acidic deposition with a dynamic model. Jpn. J.Soil Sci. Plant Nutr. 69, 477–487 (in Japanese).
Sverdrup, H., Alveteg, M., Langan, S., Paces, T., 1995.Biogeochemical modeling of small catchments using PROFILEand SAFE. In: Trudgill, S.T. (Ed.), Solute Modelling inCatchment Systems. John Wiley and Sons, Chichester, pp.75–99.
Takahashi, A., Sato, K., Wakamatsu, T., Fujita, S., 1997. Temporaland spatial variation of throughfall and stemflow fluxes in aJapanese cedar forest at Gunma Prefecture. In: Proceedings ofAnnual Meeting of Environmental Science Society, Kokura, pp.280–281 (in Japanese).
Takahashi, K., 1990. Acid Rain: Effects on Soils and Plants.Environmental Pollution Research Center, Tokyo, pp. 62–71 (inJapanese).
van Grinsven, J.J.M., van Riemsdijk, W.H., 1991. Evaluation ofbatch and column techniques to measure weathering rates insoils. Geoderma 52, 41–57.
Wakamatsu, T., Sato, K., Takahashi, A., 1998. Proton budgets ofsurface soils in a Japanese cedar forest. In: Proceedings of
Annual Meeting of Environmental Science Society, Tsukuba,pp. 116–117 (in Japanese).Wakamatsu, T., Sato, K., Takahashi, A., Shibata, H., 2001. Protonbudget for a Japanese cedar forest ecosystem. Water Air SoilPollut. 130, 721–726.