application of ray theory to propagation low frequency
TRANSCRIPT

L ?1
NASA Contractor Report 178367
.
Application of Ray Theory to Propagation of Low Frequency Noise from Wind Turbines
(NaSA-CR-178367) APPLICATION OF RAY T H E O R Y N88-12349 TO P R O P A G A T I O N OF LOW PREQnENCY N O I S E & O H WX8D TURBINES F i n a l Report, 20 3 U l . 1984 - 30 Sep. 1987 (Texas Univ.) 105 p Avail: Unclas NTIS HC A06/HP A01 CSCL 20A G3/71 0106777
James A. Hawkins
APPLIED RESEARCH LABORATORIES THE UNIVERSITY OF TEXAS AT AUSTIN POST OFFICE BOX 8029, AUSTIN, TEXAS 78713-8029
Contract NASI-I7802
July 1987
- 4 National Aeronautics and Space Ad mini st ration
Langley Research Center Hampton, Virginia 23665-5225

NASA CONTRACTOR REPORT
.
.
NASA CR-178367 ARL-TR-87-40
APPLICATION OF RAY THEORY TO PROPAGATION OF LOW FREQUENCY NOISE FROM WIND TURBINES
20 July 1984 - 31 October 1987 FINAL REPORT UNDER CONTRACT NASl-17802
James A. Hawkins
APPLIED RESEARCH LABORATORIES THE UNIVERSITY OF TEXAS AT AUSTIN
POST -OFFICE BOX 8029, AUSTIN, TEXAS 78713-8029
July 1987
Final Report
Prepared for:
NATIONAL AERONAUTICS AND SPACE ADMINISTRATION LANGLEY RESEARCH CENTER
HAMPTON, VA 23665
National Aeronautics and Space Ad mi n ist rat ion
Langley Research Center Hampton, Virginia 23665-5225

FOREWORD
.
.
..
This report is adapted from the master’s thesis of the same title by
James A. Hawkins. Soon after enrolling in the Department of Physics in 1984,
Mr. Hawkins began work on the wind turbine noise propagation project. The
date of his M.S. degree is December 1987. Professor C. W. Horton, Sr., was the
second reader of the thesis.
The research was carried out at Applied Research Laboratories, The
University of Texas at Austin. Appreciation. is extended to the following per-
sons for their assistance on the project. At Applied Research Laboratories A. J.
Kimbrough carried out computing tasks of all kinds, T. L. Foreman gave counsel
and advice on the use of his program MEDUSA, and E. K. Westwood helped
with the beam displacement calculations. At NASA Langley Research Center
W. L. Willshire, Jr., provided detailed information about the NASA data and
made it possible for Mr. Hawkins to be present at the May-June 1985 tests at
Medicine Bow, Wyoming; J. S. Preisser provided advice and support throughout
the project.
Oral reports of the research have been or are scheduled to be
lJ. A. Hawkins, Jr., and David. T. Blackstock, “Propagation of noise from wind turbines,” Bull. Am. Phy. SOC. 32, 1179 (A) (1987).
2J. A. Hawkins, Jr., and David. T. Blackstock, “Application of ray theory to downwind propagation of low-frequency noise in the atmosphere,” J. Acoust. SOC. Am. 79, S19 (A) (1986).
... 111

given.3 Support for the work came from NASA Langley Research Center under
Contract NAS1-17802. Technical monitors were J. S. Preisser and W. L. Will-
shire, Jr .
David T. BIackstock, Supervisor
~~
3J. A. Hawkins and David. T. Blackstock, “Application of ray theory to propagation of low-frequency noise from wind turbines,” J. Acoust. SOC. Am. 82, S77 (A) (1987).
.
. 1
iv

TABLE OF CONTENTS
LIST OF FIGURES vii
1 INTRODUCTION 1 1.1 Background . . . . . . . . . . . . . . . . . . . . . . . . . . . . . . 1 1.2 Purpose of Work . . . . . . . . . . . . . . . . . . . . . . . . . . . 2 1.3 Possible Approaches . . . . . . . . . . . . . . . . . . . . . . . . . 3 1.4 Atmospheric Acoustics . . . . . . . . . . . . . . . . . . . . . . . . 5 1.5 Scope of Topics and Results . . . . . . . . . . . . . . . . . . . . . 9
2 NOISE PRODUCTION FROM THE WTS-4 WIND TURBINE 11 2.1 Characteristics of the Turbine: Physical Dimensions and Overview
of Operation . . . . . . . . . . . . . . . . . . . . . . . . . . . . . 11 2.2 Atmospheric Conditions . . . . . . . . . . . . . . . . . . . . . . . 14 2.3 Ground Characteristics . . . . . . . . . . . . . . . . . . . . . . . . 14 2.4 General Description of Sound Source and Sound Field . . . . . . . 15
3 RAY THEORY FOR SOUND IN A WIND 20 3.1 General Ray Theory for a Moving Medium . . . . . . . . . . . . . 21 3.2 General Ray Equations for a Moving Medium . . . . . . . . . . . 23 3.3 The Special Case of Downwind Propagation . . . . . . . . . . . . 25 3.4 Numerical Solution: MEDUSA . . . . . . . . . . . . . . . . . . . 25
4 USE OF THE RAY THEORY PROGRAM MEDUSA 33 4.1 Environmental Input Parameters: Model of the Turbine and
Environment . . . . . . . . . . . . . . . . . . . . . . . . . . . . . 33 4.2 Applications of MEDUSA . . . . . . . . . . . . . . . . . . . . . . 37
5 APPLICATIONS TO WILLSHIRE’S SEPTEMBER 1984 EXPERIMENTS 42 5.1 Experimental Data . . . . . . . . . . . . . . . . . . . . . . . . . . 42 5.2 Ray Paths near the Source (0-2 km) . . . . . . . . . . . . . . . . . 44 5.3 Propagation Loss . . . . . . . . . . . . . . . . . . . . . . . . . . . 46
V

6 APPLICATIONS TO EXPERIMENTS CONDUCTED DUR- ING MAY-JUNE 1985 52 6.1 Modification of the Theory To Include Upwind Propagation . . . 54 6.2 Downwind Sound Levels (dB) . . . . . . . . . . . . . . . . . . . . 54 6.3 Least Squares Fit of the Downwind Data . . . . . . . . . . . . . . 57 6.4 Comparison with Ray Theory Predictions . . . . . . . . . . . . . 59 6.5 Upwind Data . . . . . . . . . . . . . . . . . . . . . . . . . . . . . 62
7 SUMMARY AND CONCLUSIONS 68 7.1 Downwind Sound Field . . . . . . . . . . . . . . . . . . . . . . . . 68 7.2 Upwind Sound Field . . . . . . . . . . . . . . . . . . . . . . . . . 69 7.3 Comments . . . . . . . . . . . . . . . . . . . . . . . . . . . . . . . 70 7.4 Further Investigations . . . . . . . . . . . . . . . . . . . . . . . . 70
APPENDIX A Ground Wave Effects 72 A.l The Ground Wave . . . . . . . . . . . . . . . . . . . . . . . . . . 72 A.2 Surface Wave Contributions . . . . . . . . . . . . . . . . . . . . . 73
APPENDIX B Beam Displacement 75 B.l Introduction . . . . . . . . . . . . . . . . . . . . . . . . . . . . . . 75 B.2 The Head Wave and Beam Displacement . . . . . . . . . . . . . . 75
APPENDIX C MEDUSA 79
APPENDIX D The Effect of Caustics on Sound Intensity 83 D.l The Formation of Caustics . . . . . . . . . . . . . . . . . . . . . . 83 D.2 Airy Function . . . . . . . . . . . . . . . . . . . . . . . . . . . . . 85
APPENDIX E MID-FREQUENCY SOUND LEVELS 89
.
REFERENCES 93
vi

LIST OF FIGURES
1.1
1.2
1.3
2.1
2.2
2.3
2.4
2.5
3.1
3.2
Rays in (a) a lapse condition and (b) an inversion (from Ref. 11).
Rays in a windy atmosphere (from Ref. 11). . . . . . . . . . . . Reflection of ray from source near a surface. . . . . . . . . . . .
The WTS-4 wind turbine in Medicine Bow, Wyoming (redrawn
from Ref. 5 ) . . . . . . . . . . . . . . . . . . . . . . . . . . . . . Typical power output, wind direction, and wind velocity (from
Ref. 16). . . . . . . . . . . . . . . . . . . . . . . . . . . . . . . . Time history of the thumping noise (from Ref. 16). . . . . . . . Typical frequency spectrum for the thumping noise. Note the
strong components between 1 Hz and 20 Hz (from Ref. 16). . . Plan view of the overall sound pressure levels for the WTS-4 wind
turbine (from Ref. 16). . . . . . . . . . . . . . . . . . . . . . . .
Schematic diagram showing propagation of a point P located on
a wavefront. The wavefront at time t l is represented by the curve
tl = ~ ( x ) , at a later time t l +At by the curve tl +At = ~ ( x ) . The
associated sound speed normal is cii, the wind velocity vector is
w, and the ray velocity vector is vraY = cii + w. . . . . . . . . . Relationship of an element of ray path length dl to elements of
range dr and height dz. . . . . . . . . . . . . . . . . . . . . . .
7
7
8
12
13
16
17
19
22
27
vii

4.1 Family of rays having launch angles between f 8 " . Increments
are 1" . . . . . . . . . . . . . . . . . . . . . . . . . . . . . . . . 38
Propagation loss for ranges out to 15 k . . . . . . . . . . . . . . . 40
4.3 Location of caustics . . . . . . . . . . . . . . . . . . . . . . . . . 40
4.2
5.1
5.2
Sound level measurements at the WTS-4 site (from Ref . 5) . . . . Family of rays having launch angles between f10" . Launch angle
increment is 1" . . . . . . . . . . . . . . . . . . . . . . . . . . . . 45
Propagation loss at 6 Hz with Willshire's data added . . . . . . . 47
Propagation loss at 8 Hz with Willshire's data added . . . . . . . 47
48
43
5.3
5.4
5.5 Propagation loss at 11 Hz with Willshire's data added . . . . . .
6.1
6.2
6.3
6.4
6.5
6.6
6.7
6.8
6.9
6.10
6.11
6.12
6.13
6.14
6.15
Downwind experiment No . 3. 10 Hz . . . . . . . . . . . . . . . . . Downwind experiment No . 5. 10 Hz . . . . . . . . . . . . . . . . . Downwind experiment No . 6. 10 Hz . . . . . . . . . . . . . . . . . Downwind experiment No . 16. 10 Hz . . . . . . . . . . . . . . . . Least squares fit for data from experiment No . 3. 10 Hz . . . . . .
55
55
55
55
58
58
58
58
60
60
61
61
63
63
63
Least squares fit for data from experiment No . 5. 10 Hz . . . . . . Least squares fit for data from experiment No . 6. 10 Hz . . . . . . Least squares fit for data from experiment No . 16. 10 Hz . . . . . Propagation loss with data from experiment No . 3. 10 Hz . . . . Propagation loss with data from experiment No . 5. 10 Hz . . . . Propagation loss with data from experiment No . 6. 10 Hz . . . . Propagation loss with data from experiment No . 16. 10 Hz . . . . Upwind experiment No . 29. 10 Hz . . . . . . . . . . . . . . . . . . Upwind experiment No . 30. 10 Hz . . . . . . . . . . . . . . . . . .
I
Upwind experiment No . 8. 10 Hz . . . . . . . . . . . . . . . . . .
... Vlll

. 6.16 Upwind experiment No . 18’10 Hz . . . . . . . . . . . . . . . . . . 63
6.17 65
6.18
Fan of upwind rays showing the formation of a shadow zone . . . Propagation loss (8 Hz) in the upwind direction with spherical
spreading curve (lower curve) . . . . . . . . . . . . . . . . . . . . 65
6.19 Formation of caustics along a shadow zone . . . . . . . . . . . . . 67
A.l Comparison of predicted ground wave levels and Willshire’s data . Solid squares are the predicted levels and the empty squares are
the measured levels . . . . . . . . . . . . . . . . . . . . . . . . . 74
B.l Sound field from a head wave . . . . . . . . . . . . . . . . . . . . 76
B.2 77 Beam displacement as a function of the angle of incidence . . . .
c.1
D.l
D.2
D.3
E . 1
E.2 E.3
E.4
Organization of MEDUSA . . . . . . . . . . . . . . . . . . . . . .
Ray tube formed by closely spaced rays . . . . . . . . . . . . . . Plot of the Airy function (from Ref . 10) . . . . . . . . . . . . . . Plot of the Airy function with associated rays near a caustic surface .
Propagation loss at 63 Hz . . . . . . . . . . . . . . . . . . . . . . Propagation loss at 250 Hz . . . . . . . . . . . . . . . . . . . . . Family of rays with source height 120 m . . . . . . . . . . . . . . Family of rays with source height 80 m . . . . . . . . . . . . . . .
80
84
87
88
90
90
92
92
ix

CHAPTER 1
INTRODUCTION
1.1 Background
After the Arab oil embargo in the mid ~ O ’ S , the United States increased
its efforts to develop alternative energy sources. These sources included wind
turbines. Because of advances in technology [l], it had become possible to build
very large and powerful wind turbines. In fact, interest in wind turbine technol-
ogy led to a variety of machine designs, the most practical of which make use of
either a vertical or horizontal axis. A good example of a vertical axis machine
is the Darrieus turbine, which is described in Ref. 1 as an ‘eggbeater standing
on end’. The horizontal axis machines have, as the name indicates, the wind
turbine shaft mounted horizontally. Turbines are further classified as either up-
wind or downwind turbines. The blades of an upwind machine are upwind of
the support tower, whereas the blades of a downwind machine are downwind of
the support tower [2]. The common windmill is a good example of an upwind
machine. A downwind turbine can be thought of as a backward facing windmill.
Good examples of each type of turbine are described in Ref. 2.
.
In the fall of 1979 an unanticipated problem arose during initial testing of
the MOD-1 turbine at Knob Hill, North Carolina, which was the largest downwind
1

turbine at that time [3]. It was discovered that the MOD-1 machine produced an
annoying low frequency thump which was audible to people living within a radius
of several kilometers.
Because of complaints directed at the MOD-1 turbine, interest developed
in the noise produced by wind turbines [3]. The resulting investigations took two
paths: environmental and scientific. The noise levels of the wind turbines were
environmentally unacceptable, and thus would jeopardize community acceptance
of more turbines (some of which were to be even larger than the MOD-1 machine).
Therefore, early investigations were aimed at reducing the noise; in the case of
the MOD-1 machine, the problem was solved by lowering the rotation rate. At
the same time, large downwind turbines have received scientific interest because
they are effective sources of low frequency noise, and in some cases their location
proves ideal for propagation studies. For example, the WTS-4 turbine, which
plays a central role in this investigation, is located in a relatively isolated flat
area (i.e., a flat plane). Noise is produced well below 100 Hz; it is audible up to
about 3 km and can be detected with instrumentation out to a range of 20 km.
1.2 Purpose of Work
Initially our goal in this investigation was to provide a general theoretical
description of the propagation of noise from large wind turbines, in particular,
the thumping noise produced by large downwind-type machines. The following
aspects of the problem were to be investigated.
0 Spherical spreading and directivity of the source
0 Refraction due to wind and temperature gradients
i Ground effects
2

0 Atmospheric absorption
0 Turbulence’
However, in the fall of 1984 W. L. Willshire conducted preliminary ex-
periments to measure the downwind propagation of noise from the WTS-4 wind
turbine at the Department of Energy test site at Medicine Bow, Wyoming [5 ] .
When Willshire’s data became availabile, our goal became more focused. We
wished to develop an accurate, effective theoretical model of downwind propaga-
tion of low frequency noise from wind turbines. Specifically, we wanted to be able
to explain Willshire’s 1984 data. Furthermore, Willshire carried out mor elab-
orate experiments at the WTS-4 site the following year (May-June 1985 . The
model arrived at through investigation of the 1984 data was then to be tested
against the May-June 1985 experiments.
1.3 Possible Approaches
After analyzing the 1984 dat , Willshire initially believed that h had
discovered an instance where the so-called ground wave (see Appendix A) is the
predominant factor in sound propagation. Upon further investigation, he con-
cluded that the predicted sound levels based solely on the contribution of the
ground wave fell far below the measured levels [5]. Following Willshire’s experi-
ments, other investigations were undertaken, the purpose of which was to explain
Willshire’s 1984 data. In this section, we cite three investigations which illustrate
the different approaches taken.
‘To keep the scope of the investigation within acceptable limits, it was early decided not to investigate the role played by turbulence. A good review of turbulence effects can be found in Piercy’s review [4].
3

Analytical investigations of sound propagation in an inhomogeneneous
medium, say the ocean or the atmosphere, are usually based on normal mode
theory, the parabolic approximation, or my theory. Each theory has its strengths
and weaknesses. In normal mode theory the acoustic wave equation is solved
explicitly. A complete solution in normal modes is often prohibitively difficult,
particularly in atmospheric acoustics. Nevertheless, valuable results have been
obtained (see for example Chunchuzov [SI). Zorumski and Willshire [7], using the
normal mode techniques of Chunchuzov, found good agreement between theory
and data at receiver ranges far away from the turbine. But, since the application
of normal mode theory to atmospheric noise propagation problems depends on
being in the farfield [7], it cannot be used to study data near the source.
Although the parabolic approximation is used in ocean acoutics with
good results [SI, its use in atmospheric acoustics is relatively unknown. How-
ever, White [9], using the parabolic approximation, also obtained good agree-
ment between theory and Willshire’s 1984 data at long ranges. Again, however,
predictions for near-source ranges were in question.
Because of the difficulties associated with normal mode theory (for ex-
ample, the results obtained by Zorumski and Willshire are very complicated and
difficult to interpret), ray theory is often employed as an alternative or as a first
approximation to describing the sound field. Ray theory has the advantages of
being easy to use and of providing a simple visualization of the sound field. How-
ever, because it is a high frequency approximation of the wave equation, ray
theory also has limits of applicability. Furthermore, because ray theory ignores
diffraction phenomena (for example, caustics), its application must be carefully
evaluated. We have investigated simple ray theory, ray theory with beam dis-
placement, and ray theory with caustic corrections. Because the problem we are
4

investigating involves very low frequencies and ray theory is generally considered
a high frequency approximation, we expected ray theory to be of limited value.
We found, however, that simple ray theory gives the most useful predictions of
downwind noise levels of the WTS-4 wind turbine data. The success (at least for
downwind propagation) of ray theory is encouraging from a practical standpoint
because it is the simplest and easiest to use of all the competing theories. On the
other hand, the application of ray theory to upwind data obtained in the 1985
tests proved to be nearly fruitless.
‘ 1.4 Atmospheric Acoustics
In this section we remind the reader of some simple concepts concerning
refraction and reflection.2 Our comments are based on Delany’s review of the
history of atmospheric acoustics [ll]. Other good reviews can be found in the
literature [4,12].
Throughout the history of atmospheric acoustics, accurate sound ranging
has continually held the interest of investigators. Consider, for example, the boom
of a cannon firing. If the speed of sound is known and the direction of the sound is
known, then the position of the gun can be determined. An early achievement was
the accurate determination of the speed of sound in air. Newton’s derivation of the
speed of sound together with Laplace’s famous correction is well documented [13].
The speed of sound in air can be written in terms of the ratio of specific heats 7 ,
the ambient pressure P , and the ambient density p,
*Although atmospheric absorption is important, it is negligible a t the frequencies in which we are interested (see, for example, Ref. 10). Hence we shall not discuss it in this section.
. 5

Substitution of the perfect gas law P = RTp, where R is the gas constant and T
is the absolute temperature, in Eq. (1.1) yields the sound speed in terms of the
temperature
c = @ .
Successful sound ranging is complicated by the inhomogeneity of the
atmosphere. Wind and temperature vary throughout with height and range, and
the variation depends on the diurnal cycle. Furthermore, the variations can be
coupled in the sense that variations in the wind can affect the temperature. The
cumulative effect of wind and temperature variation is to bend, or refract, the
sound waves. Thus, the ‘line of sight’ used in sound ranging is in fact not a
straight line.3
As a conceptual device, we can introduce a curve tracing the path of
sound propagation, i.e., a ray (for example, see section 5.13 of Ref. 14). Using
the rule of thumb that rays curve so as to take the sound into a region of lower
sound speed,4 we can understand Fig. 1.1 (taken from Ref. 11). When the tem-
perature decreases with height (normal lapse condition) as in Fig. l.l(a), the rays
bend upward. In Fig. l.l(b) the temperature increases with height (temperature
inversion), and the rays bend toward the ground. Note that when normal lapse
3Although refraction by wind and temperature gradients is well established today, it was not always so. In the 1 8 7 0 ’ ~ ~ Tyndall and Henry carried out a historic debate concerning the propagation of sound in fog. The controversy concerned pecularities in the propagation of sound in a fog. For example, a ship sailing with the wind approaching a signaling station could not hear the station’s foghorn, whereas the station could clearly hear the ship’s bell. Another pecularity was the echo heard when a foghorn was sounded into apparently clear air. Tyndall contended that both pecularities of sound propagation were the result of jloculence in the atmosphere. Although Tyndall never admitted it, Henry proved, by careful experimentation, that simple refraction caused sound sent upwind to go unheard. However, we know today that Henry’s floculence is real and its study comes under the heading of scattering of sound by turbulence.
“Although this is not obvious, it can be derived from Snell’s law cl/cosO1 = c2/cos02, where the subscripts indicate the sound speed and angle of inclination of two points in the atmosphere (see, for example, pp. 401-402 in Ref. 14).
6

000 LSO 200 0 200 LOO m c;ii d -
Figure 1.1 RAYS IN (A) A LAPSE COlr-
DITION AND (B) A N INVERSION (FROM Figure 1.2 RAYS IN A WINDY ATMO-
REF. 11). SPHERE (FROM REF. 11).
conditions prevail a shadow zone forms (the shaded region of Fig. l . l (A) ) . How-
ever, rays penetrate farther into the sound field in an inversion. At twilight on a
quiet evening, the atmosphere can change from a lapse condition to an inversion.
The change is sometimes cited as the reason that highway sounds can be heard
in certain locations at night but not during the day.
A similar situation arises for rays in a windy atmosphere, with an impor-
tant difference: wind produces a field of rays that is asymmetrical (see Fig. 1.2).
The propagation speed in a wind, directly upwind or downwind of the source, can
be written as the sum of the quiescent (no wind) sound speed co and the wind
velocity w , a = c o + w , (1.3)
where w is the contribution of the wind to the propagation speed. The com-
ponent of the wind velocity is added or subtracted, depending on whether the
receiver is downwind or upwind, respectively. If the wind velocity w increases
steadily with height, then the situation shown in Fig. 1.2 can be explained in the
following manner. Simply stated, the upwind propagation speed decreases with
7

Figure 1.3 REFLECTION OF RAY FROM SOURCE NEAR A SURFACE.
height (;.e., the wind opposes the propagation of sound). Consequently the rays
bend upward. Downwind, the propagation speed increases with height (the wind
aids the propagation of sound) and the rays bend downward. In summary, we
see that sound propagating upwind behaves as if a lapse condition existed, while
sound propagating downwind behaves as if an inversion condition existed.
The ray picture of a sound field is simple and a~pea l ing .~ It can give a
good qualitative understanding of how sound propagates. Moreover, by means
explained in Chapter 3, we can use ray theory to predict sound levels.
In Figs. 1.1 and 1.2 we have omitted reflected rays. However, their
contribution to the sound field is particularly important. Delany writes that
Derham [Ill found that newly fallen snow weakened the propagation of sound and
observed that the weakening disappeared when the ground became frozen solid.
It is now known that the ‘weakening’ of sound propagation is due to absorption
5Although ray tracing is done now almost exclusively with computers, ray tracing is not limited to computers. For example, Rudnick [15] presents an analyses of rays in a refracting medium, and gives detailed instructions for use of a compass to draw rays by hand.
8

of sound by the ground. Consider the following expression (see Fig. 1.3),
where po is the sound pressure at unit distance from the source S, p is the sound
pressure at the receiver R, rl and r2 are, respectively, the distances from the
source and the image I [4]. The plane wave reflection coefficient R, is defined as
follows:
where Zl and Z2 are the air impedance and ground impedance, respectively.
Clearly, the weakening of sound by fresh snow in contrast to solid snow observed
by Derham is caused by the smaller impedance of the fresh snow, which has a
smaller reflection coefficient. The point to be made here is that complete and
accurate results of long range propagation studies depend on the accurate speci-
fication of the reflection coefficient.
Note from Eq. (1.5) that when the source and the receiver are both very
near the ground, or when they are a long way from each other, then 1C, + 0,
R, + -1. When Rp = -1 the direct and reflected rays cancel, leaving a shadow
zone. In fact, we have neglected to include a third term in Eq. (1.5). Th' is term
is negligible when ?+b is not small, but it contributes'to the sound field when .IC, is
small. The mechanism by which the contribution occurs is through the so-called
ground wave. The ground wave is discussed in Appendix A. Ground wave effects,
as we have previously mentioned, were studied by Willshire.
1.5 Scope of Topics and Results
The subject of this thesis is propagation, primarily downwind propaga-
tion, of low frequency noise from a downwind turbine. We have found that the
9

data measured by Willshire in 1984 and 1985 can be explained by using simple
ray theory, Although we can include the effects of absorption by the ground,
atmospheric absorption, and temperature variation, their effects have been found
to be minimal compared to refraction by the wind gradient.
In the next chapter we describe the noise characteristics of the WTS-4
wind turbine. This information is gathered from reports by Willshire and others.
A derivation of ray theory for a windy atmosphere and a short description of
the computer program used to solve the ray equations are given in Chapter 3 (a
more complete discussion of the computer program is the subject of Appendix C).
Chapter 4 is about: (1) the input data needed for MEDUSA and (2) the appli-
cations of MEDUSA most pertinent to our investigation. In Chapter 5 the ray
theory predictions are compared with Willshire’s 1984 data. The 1985 data, both
upwind and downwind, are compared to ray theory predictions in Chapter 6. We
summarize the results of our investigation and outline areas for future studies in
Chapter 7. Additional topics covered in appendices include ground wave theory,
beam displacement, caustics, and a short discussion of Willshire’s mid-frequency
measurements.
10

CHAPTER 2
NOISE PRODUCTION FROM THE WTS-4 WIND TURBINE
In Chapter 1 it was stated that the main goal of our investigation is
to provide a method for predicting the downwind propagation of low frequency
noise from large wind turbines. Of particular interest to our investigation are
the data obtained by W. L. Willshire for the WTS-4 turbine at Medicine Bow,
Wyoming, during September 1984 [5], and the follow-up experiments conducted
during May-June 1985. We present in this chapter a brief general description of
the WTS-4 machine, its noise characteristics, and the site. The emphasis is on
the environmental parameters that must be specified and the assumptions that
must be made in order to apply ray theory to the experiment. Much of the
material in this section is drawn from reports by Willshire [5] and Shepherd and
Hubbard [16].
2.1 Characteristics of the Turbine: Physical Dimensions and Overview
of Operation
The WTS-4 turbine, shown in Fig. 2.1, is a twin-blade, horizontal-axis,
downwind machine. Recall that “downwind” here that means the blade is down-
wind of the support tower. The nacelle at the top of the support tower houses
11

Figure 2.1 THE WTS-4 WIND TURBINE IN MEDICINE Bow, WYOMING (REDRAWN FROM
REF. 5 ) .
12

W md speed mhee'
30 r 1 67.5
Wind speed, mph
Relative wind
direction, deg
-36 ' I Time c
- ~~
-.
Figure 2.2 REF. 16).
TYPICAL POWER OUTPUT, WIND DIRECTION, AND WIND VELOCITY (FROM
the electric generator. The blades are attached to the generator by the hub, the
center of which is 80 m above ground level. The blades measure 80 m tip to tip.
The highest point above the ground reached by a blade is 120 m, while the tip of
the blade nearest the ground is 40 m from the ground.
The machine operates at a constant 30 rpm (hence the blade passagk
frequency is 1 Hz) and produces a maximum of 4.2 MW of electrical power. The
cut-on and cut-off wind speeds-the wind speeds between which the turbine is
designed to operate-are 7 m/s and 27 m/s (16 and 60 mph) respectively. The
machine is maintained at a constant rpm in varying wind speeds by means of a
trimming mechanism. Typical data on power output, wind direction, and wind
velocity are shown in Fig. 2.2.
13

2.2 Atmospheric Conditions
Although the atmosphere measures some 500-600 km from the earth’s
surface to the edge of the interplanetary gas, the major weather patterns develop
in the first 10 km [17]. Within the first 10 km, it is only the first few hundred
meters above the ground which directly affect downwind sound propagation along
the ground. We can get an idea of the height above which the atmosphere does
not affect propagation by considering the limiting ray. Rays launched at an-
gles greater than the limiting ray do not contribute to the sound field, but rays
launched at lesser angles can contribute to the field. In Fig. 1.2 for example, of
the seven downwind rays shown, only five contribute to the sound field out to
200 m. The highest point of the limiting ray defines a rough height above which
the atmosphere has minimum effect on sound propagation. In our investigation,
as we shall see (Chap. 4), this height is only a few hundred meters high.
Normally one expects all three important atmospheric conditions-tem-
perature, humidity, and wind velocity-to vary with height in the region of the
atmosphere near the ground (the first few hundred meters near the ground).
Because the turbine operates in windy conditions, however, the atmosphere is
well mixed when noise is radiated. The atmosphere is therefore assumed to have
constant humidity and to be isothermal near the ground. The wind, on the
other hand, does vary with height and it turns out that this variation has a very
important effect on sound propagation.
2.3 Ground Characteristics
The turbine is located within a broad flat basin formed by the Laramie,
Medicine Bow, and Shirley mountain ranges. The vegetation consists mostly of
14

small bushes and clumps of grass. No trees exist in the immediate vicinity of the
turbine site. The dry, slightly sandy soil in the area is easily crumbled by hand.
The effect of the ground on the propagation of sound requires that the
ground impedance be determined. We assume here that the ground can be char-
acterized as a flat plane with a complex impedance. In our investigation the
Delany and Bazley impedance model [18] as formulated by Chessel [19] is used
(see Chapter 4).
2.4 General Description of Sound Source and Sound Field
The noise from downwind turbines is of two types. The first type is aero-
dynamic noise. Although this noise contributes a small amount at the low end of
the acoustic spectrum, the main components are between 800 and 2500 Hz. This
noise is generally thought to be caused by“unsteady airfoil loads . . . and convec-
tion of the turbulent boundary layer past the trailing edge of the airfoil”[20].’
Because the convection past the trailing edge increases with increasing wind ve-
locity, the source of the high frequency sound is considered to be located near the
top (120 m) of the turbine.
The second type of noise is primarily low frequency in character and is
caused by the passage of the turbine blade through the turbulent wake of the
support tower. The entire blade is subject to the impulsive aerodynamic loading
changes as it passes through the wake; thus the sudden change in angle of attack
of the blade produces a thump. Consequently the spectrum is rich in harmonics
of the blade passage frequency (1 Hz). Figure 2.3 shows a representative time
trace for the thumping noise, and Fig. 2.4 shows the low frequency portion of
l I t appears now that the mechanism is more complicated than previously considered (see Ref. 21).
15

time t I - hntanlaneous
Pascals sound pressure. 0
I I I -5 - Approxlmale l ime of blade passage
through lower wake
-6 L I I
Blade I I Blade (I 2 Blade I 1 Blade # 2
I I 1 I I I I I
Figure 2.3 TIME HISTORY OF THE THUMPING NOISE (FROM REF. 16).
the noise spectrum for the WTS-4 machine. The low frequency components, in
particular the region of the spectrum between 1 Hz and 20 Hz, are thought to be
due primarily to the thump.
Because of the nature of the blade (thickest near its root, thinnest at its
tip), the cantilever deflection is greatest at the tip. For simplicity, we assume that
the vibrating surface (the sound source) is concentrated at the tip, in particular,
the region from the tip to one chord width up the blade. We can gain an idea
of how concentrated a source is by considering its compactness. A source is
considered acoustically compact if the wavelengths of the sound produced are
long in comparison with the principal dimension of the source. For compact
sources the product of the wave number with the principal dimension must be
less than one, kl << 1, where k is the wave number and 1 the principal dimension
16

E
Sound pressure
level. dB
4
2 20 40 Bo
Frequency, HE 80 100
Figure 2.4 TYPICAL FREQUENCY SPECTRUM FOR THE THUMPING NOISE. NOTE THE STRONG
COMPONENTS BETWEEN 1 Hz AND 20 Hz (FROM REF. 16).
17

of the source (for example, see Ref. 22, p. 25). Because the tip of the WTS-4
turbine blade undergoes the largest deflection as it passes through the tower wake,
we can assume that a disc with a diameter of 1 = 1.04 m (the tip chord width)
is the source. Consequently, the principal dimension
1 Hz the product kl is 2 x
CO kl= -(1.04) M .02
and at 100 Hz
is taken to be 1.04 m. At
2007r CO
kl = -(1.04) M 2 . Hence, it is seen that for very low frequencies (1 Hz to 20 Hz) the source is
relatively compact. The approximation becomes progressively worse for higher
frequencies. In summary, we assume that the low frequency sound from the
WTS-4 turbine is from a point source, which is located at the blade tip as it
passes through the turbulent wake of the tower.
We comment on one other aspect of the sound field. Since it is considered
to be a small disc approximately 1 m in diameter, the source is expected to exhibit
dipole characteristics. Figure 2.5 shows a plan view of the WTS-4 turbine sound
levels at two ranges, near the source (183 m) and at mid-range (732 m). At
183 m, along a line in the plane of blade rotation, the notch in the sound level
at 90" is characteristice of dipole directivity. The dipole nature of the source is
not of direct importance in our investigation, because our interest is in sound
propagated either straight downwind or upwind.
In summary, the WTS-4 turbine can be thought of as an ideal model of
a low frequency dipole sound source, and its site is a close approximation of a
flat plane. In the next chapter, the theoretical framework needed to study the
propagation of sound from the WTS-4 machine (ray theory for sound in a wind)
is described.

900
1 00
Overall sound pressure level, dB
00 1
Overall sound pressure level, dB
180'
. Figure 2.5 PLAN VIEW OF THE OVERALL SOUND PRESSURE LEVELS FOR THE WTS-4 WIND
TURBINE (FROM REF. 16).
19

CHAPTER 3
RAY THEORY FOR SOUND IN A WIND
Ray theory for sound propagation in a windy atmosphere is developed
in this chapter. First, the development of ray theory for a steady moving medium
yields the general ray tracing equations. Introduced next are restrictions which
specifically adapt these equations to a stratified, unidirectional moving medium,
by which we mean that the medium velocity and sound speed vary only with
height, and the medium is in motion in one direction. Assumptions are then made
which tailor the resulting ray path equations to apply to sound propagation in
the wind at the WTS-4 site. Finally, we briefly discuss the computer solution to
the ray equation.
The idea of a ray path associated with the propagation of a wave is
familiar. The ray path equation places this idea on firm ground, and the solution
of the ray path equation allows the ray paths to be calculated. Moreover, the
sound intensity along the ray path may be calculated and, subsequently, the
propagation loss.
20

3.1 General Ray Theory for a Moving Medium
We want to investigate the effect of a moving medium on the propagation
of sound waves. Sections 3.1 and 3.2 are based on the material in Chap. 8 of the
text by A. D. Pierce (Ref. 10, Chap. 8). The goal here is not to explain in detail
but simply to summarize results necessary for the development of ray theory.
First, we introduce the idea of a point located on a wavefront. A wave-
front may be thought of as a surface of constant phase, which can be expressed at
some time t and position x as t = ~(x). Consider a point P located at x p ( t ) on an
arbitrary wavefront t = ~ ( x ) (see Fig. 3.1). The medium moves with velocity w
without time variation. As time increases P traces a path in space. The velocity
with which the point travels along the path is the vector sum of the wind velocity
vector and the sound speed in the direction normal to the wavefront
where c is the sound speed, ii is the unit normal to the wave, and w is the the
wind velocity. The solution x p ( t ) of Eq. (3.1) defines the ray paths.
Note that in the case of a nonmoving medium we are concerned with
the velocity at which the wavefront moves normal to itself, ii iic, whereas for a
moving medium we are concerned with the magnitude of the velocity of the point
P , i.e., IvraYl = lcii + w I . The fact that the ray velocity has two components, one
in the direction normal to the wavefront and another along the direction of the
wind velocity, sometimes leads to confusion. For example, it is commonly said
that Rayleigh missed the fact that the wave normal is not coincident with the
ray velocity vector (see [ll], pp. 210-212). However, when propagation is in the
direction of the moving medium, the difference in direction between vraY and ii
21

\ \
Figure 3.1 SCHEMATIC DIAGRAM SHOWING PROPAGATION OF A POINT P LOCATED ON A
WAVEFRONT. THE WAVEFRONT A T TIME t i IS REPRESENTED BY THE CURVE t i = T ( X ) , A T A
LATER TIME t l +At BY THE CURVE t1 +At = ~ ( x ) . THE ASSOCIATED SOUND SPEED NORMAL
IS d, THE WIND VELOCITY VECTOR IS W, AND THE RAY VELOCITY VECTOR IS vraY = &+w.
is small.
The solution of Eq. (3.1) proves to be difficult to obtain because it re-
quires knowledge of ii as a function of time t. The difficulty is avoided by the
introduction of the so-called slowness vector V r . The slowness vector is the gra-
dient of the wavefront surface, which is in same direction as ii. The equation for
the slowness vector (see Ref. 10, Eq. (8-1.3)) is
L. cVr n = - R ’
where R = (1 - w + V T ) . If Eq. (3.2) is squared and rearranged, the eikonal
equation,
is obtained. The eikonal equation and the slowness vector are essential to the
22

derivation of the ray equations, the development of which is the subject of the
next section.
3.2 General Ray Equations for a Moving Medium
Two equations are necessary in order to completely specify the ray path
x( t ) (the subscript p is dropped hereafter). The first equation is obtained simply
by subtituting Eq. (3.2) into Eq. (3.1)
d x c2 -- --vr+w . d t s2 (3.4)
The second is obtained by explicitly differentiating the slowness vector
= ($.v)vr .
Substitution of Eq. (3.1) for d x l d t in Eq. (3.5) yields
d d t -vr = [(cii+w) -V]Vr
= C(ii.V)VT+(W.V)VT .
(3.5)
Substituting Eq. (3.2) for ii, we can write Eq. ( 3 . 6 ) as
C2 -vr d = -(Vr. V)Vr+ (w V)Vr . d t R (3.7)
Use of a vector identity for the first term on the right side of Eq. (3.7) leads to
d c2 1 d t R 2
c2 1 0 2
-vr = -- (v (IVr12)) - vr x (V x Vr) + (w * 0) VT
- - -- (v (IVTl’)) + (w V) VT , (3.S)
23

where the fact that the curl of the gradient is zero (V x VT = 0) has been used.
Using the formula for the eikonal Eq. (3.3) and taking the gradient, we can write
Eq. (3.8) as
R - - --vc+ VR + (w . V) VT C
(3.9) 52 = --vc+ V(1- w *VT) + (w-V) VT , C
where the definition R = (1 - w VT) has been used. Use of another vector
identity allows us to write the third term of Eq. (3.9) as
V(w. V) = (VT * V)w + (w .V)VT+VT x (V x w)
+w x (V x VT)
= (VT * V)W + (W * V)VT + VT x (V x W) . (3.10)
Equation (3.9), with the substitution for (w - V)VT from Eq. (3.10), is now
written as
(3.11) d R dt C -vT = --vC - VT X (v X W) - (VT v)W .
Equation (3.11) is the form sought for the time rate of change of the slowness
vector, and is second of the two equations needed for the derivation of the ray
paths. At this point the only restriction placed on the medium is that it moves
steadily, that is, without time variation.
Equations (3.11) and (3.4) are the ray equations or ray tracing equations.
The solution x(t) gives the equation for the ray paths. We introduce restrictions
in the next section which tailor the ray equations for application to a medium
where the wind w and sound speed c vary only with height.
24

3.3 The Special Case of Downwind Propagation
i . 9 5 - v r x ( v x w ) - ( v r ~ v ) w = - - 07 0 7
o g o 0:
We can impose two restrictions which simplify the ray equations Eqs. (3.11)
and (3.4). First, we restrict ourselves to downwind propagation so that the nor-
mal to the wavefront ii has only height and range components. Consequently, the
slowness vector V r can be written
dr dw dz dz
P _--
d r 87, dr dz
v r = - i . + - z ,
where i. and 5 are unit vectors in the direction of range and height, respectively.
Second, we assume that the wind and sound speeds vary only with height so that
they can be written as
w = w(z)i. and c = c(z ) .
Under these restrictions, the second and third terms of Eq. (3.11) can
be combined as
(3.12)
where 9 is the unit vector in the direction normal to both P and 8.
The range components of the ray equations, Eqs. (3.11) and (3.4), ca.n
now be written as
- 0 d d r d t d r
d r c 2 d r d t R Or
-- -
and
+ w 7 -- -- -
(3.13)
(3.14)
25

respectively. Similarly, the height components of the ray equations are
and d z c2Zr dt RZdz ' - - -- -
(3.15)
(3.16)
respectively.
We now eliminate time from the ray equations to obtain a differential
equation for the coordinates, z and r , of the ray. The substitution of &/dz from
Eq. (3.16) into Eq (3.15) yields
R d c d r d w
An element of length along the ray path is defined a dl = Udt , where
(3.17)
u = IVratll = Iw + chl (3.18)
is the magnitude of the ray velocity. Substitution of U-'dl . for dt in Eq. (3.17)
yields Rddc d r d w
(3.19)
Given the relation d / d l = cos0 d l d r (see Fig. 3.2), Eq. (3.19) can be written as
(3.20)
or as
(3.21) 1 d c 1 drdw
dr2 c d z R d r d z
where we have substituted
1 c0s20 = Ji-
26

Figure 3.2 RELATIONSHIP OF AN ELEMENT OF RAY PATH LENGTH dl TO ELEMENTS OF
RANGE dr AND HEIGHT dz.
It can immediately be seen from Eq. (3.13) that the radial component of
VT, dT/& is constant with respect to time. Furthermore, d ~ / d r can be written
as
C cos e = 0- ,
C (3.22)
where Eq. (3.2) has been substituted for VT. Equation (3.22) is Snell’s law for
sound waves in a moving medium. Substitution of Eq. (3.22) in Eq. (3.21) yields
(3.23) 1 dc cos6dw c dz c dz
Given the initial position and slope of a ray, we can locate the ray at
any field point by solving Eq. (3.23). Consequently, Eq. (3.23) may be called
the ray path equation. Note in Eq. (3.23) that the variation of the wind enters
the equation explicitly as the term dw/dz . Variations in the sound speed c (for
27

example, the variation of c with temperature) can be accounted for through the
term dcldz.
Recall that we have invoked two restrictions in obtaining the ray path
equation, Eq. (3.23).' First, we consider sound propagation only directly down-
wind of the source. This presupposes that the wind is blowing, without time
variation, in a single direction. Second, we assume that the wind and the sound
speed vary only with the height above the ground.
3.4 Numerical Solution: MEDUSA
Equation (3.23) is a second order nonlinear differential equation, the solu-
tion of which can be obtained by standard computer implemented numerical tech-
niques. Rather than 'reinvent the wheel' by designing a program to numerically
solve Eq. (3.23), we have chosen to adapt an existing program, MEDUSA [23],
designed by T. L. Foreman of Applied Research Laboratories, The University
of Texas at Austin. MEDUSA uses a third order Runge-Kutta algorithm with
variable step size to numerically solve the ray path equation.
MEDUSA was chosen because it is powerful and reliable (Appendix C).
In fact, MEDUSA has the unique capability to account for a range variable en-
vironment, for example, a sloping ocean bottom and a sound speed which varies
with range; however, we did not have an opportunity to exploit this feature. More
important to our investigation is that MEDUSA has proved easily adaptable for
use in the study of downwind propagation of sound. Nevertheless, MEDUSA was
designed for the study of underwater sound. That is, MEDUSA deals with an
Although we have not previously stated the assumptions underlying the theory outlined in Sec. 3.1, we note here that the basic theory"tacit1y assumes that the amplitude varies only slightly over distances comparable to a wavelength and that the radii of curvature of the wave- front are substantially larger than a wavelength" (see Ref. 10, Chap. 8).
28

environment which varies with depth and range (an ocean, for example) and does
not vary in the azimuthal direction. Consequently, we must keep in mind that
we are restricted to studying sound propagation in the downwind direction.
The adaptation of MEDUSA to our investigation is straightforward.
Nevertheless, MEDUSA was designed for an underwater environment . Con-
sequently, two problems must be resolved. First, we have to create the model
of an ocean which has the environmental properties of the atmosphere. In the
model, ground properties are substituted for ocean bottom properties and atmo-
spheric properties are substituted for ocean properties. Furthermore, the ocean
bottom is made very deep. This assures us that surface reflected rays do not
affect the portion of the sound field in which we are interested. For example, in
our investigation we have placed the ocean bottom at 1000 m, the sound source at
960 m, and the receiver at 999.5 m. Translating these distances to height above
the ground, we see that the ‘surface’ of the atmosphere is 1000 m, the source 40 m
above the ground, and the receiver is 0.5 m above the ground. In Section 4.1 we
discuss in detail the construction of an ocean which models the atmosphere.
The second problem is the difference between the ray path equation for
a non-moving nonhomogeneous static medium, the ocean, and for a moving non-
homogeneous medium, the atmosphere. The problem is resolved by constructing
a sound speed profile that is acceptable to MEDUSA and yet describes the prop-
agation speed variation appropriate for a windy atmosphere. In the following we
show that the choice of an appropriate sound speed profile adapts MEDUSA to
the study of downwind propagation of sound.
The ray equation used with MEDUSA (see Ref. 23, Eq. (11.21)) is
-= d2z [ 1 + ( d ~ ) ~ ] - (1 -- n an dz - --- dr dz n 1 d n ) dr 7 (3.24) dr2 dr
29

where n = c , , ~ / c is the acoustic index of refraction and c,,f is a suitable reference
sound speed. If we assume the total propagation speed in the downwind direc-
tion is given by the sum of the static, iosthermal sound speed co (dcoldz = 0 )
and the component of the magnitude of the wind velocity w in the direction of
propagation, then the total propagation speed is
a = co+wcos6 , (3.25)
and because c,,f is a constant, the index of refraction can be written
1 1 n = - = a ~ + w c o S o ' (3.26)
where w = w(z) only and co is independent of range and height. Therefore,
Eq. (3.24) becomes
d"z dr2 = [1+ ($)2] [ U - g ) ]
= [ l+ ($)2] (-;$) . (3.27)
1 d (co + w COS 6 ) = [ l+ ($)2] (- co + w cos 6 dz
The term d n / d r in Eq. (3.24) is discarded because the sound speed is assumed
not to vary with range. If cos6 N 1, then Eq. (3.27) becomes
(3.2s)
where we have used dcoldz = 0.
Now consider Eq. (3.23), in which c is the isothermal sound speed, c = co.
Therefore dco/dz = 0 and Eq. (3.23) can be written as
e dr2 = + (g)2] (!2)2 (-%!k) (3.29)
30

The square of the magnitude of the ray velocity Eq. (3.25) is written as
= w 2 + 2cow * ii +
= w2 + 2cow cos 0 + (:)2 - Therefore, we can write
1 ($)2 = 2
1 + 2 (E cos e) + (2) = 1 - 2 ( ~ c o s o ) +... .
Furthermore, if we assume w << CO, then
2 ($) 2 1 .
Therefore, Eq. (3.29) becomes
e= dr2 [ ,+ (!32] (-E$k) .
(3.30)
(3.31)
(3.32)
(3.33)
Comparison of Eq. (3.28) and Eq. (3.33) reveals that the two ray equa-
tions are equivalent under the following conditions:
0 w << co
0 cos0 21 1.
The first condition w << co is easily met. At the WTS-4 wind turbine site, the
wind speed is on the order of 10 m/s whereas the static sound speed in air at
20°C is 343 m/s. The second condition, cos0 21 1, occurs when the rays are
nearly parallel to the ground. In fact, it turns out that the most important rays

are those which propagate nearly parallel to the ground and the approximation
cos(0) N 1 is a good one. The predominance of these rays will be demonstrated
in Chapter 4, in which the environmental model and applications of the computer
implemented numerical solution of Eq. (3.5) are discussed.
32

CHAPTER 4
USE OF THE RAY THEORY PROGRAM MEDUSA
The derivation of the ray path equation, Eq. (3.12), is described in Chap-
ter 3. In this chapter we construct a model that adequately describes the WTS-4
turbine and site and describe pertinent applications of the computer program
MEDUSA. To run MEDUSA an input data file must be created that contains
the following data: sound speed profile, sound source location, receiver height,
frequency, atmospheric absorption, and ground impedance. If an analytical ex-
pression for an environmental input parameter is known, it may be incorporated
in MEDUSA as a separate subroutine. After the data file is created, the applica-
tion programs can be run. We have used the application programs to calculate the
following: ray paths, propagation loss, and location of caustics. We now discuss
in greater detail the environmental properties which constitute the input data
and the applications.
4.1 Environmental Input Parameters: Model of the Turbine and En-
vi ro nmen t
MEDUSA requires input about the following properties: sound speed
profile, sound source location, ground impedance, frequency, atmospheric absorp-
33

tion, and receiver height. By fixing these properties, we have effectively modeled
the noise source and surrounding environment. The model is constructed to de-
scribe the propagation of noise at the WTS-4 site at Med-icine Bow, Wyoming
(see Chapter 2).
1. Sound speed profile. Recall that in Section 3.4 the propagation speed
is constructed as the sum of the static sound speed co and the wind velocity 20 (see
Eq. (3.2)). The static sound speed is assumed to be constant (the temperatures
at the date of Willshire's 1984 measurements was not available; at the date of the
1985 experiments the temperature varied between 15"-20" ), i.e. co = 343 m/s,
the sound speed in air at 20°C [14]. The form of 20 remains to be determined.
Because the ground surrounding the WTS-4 machine is very flat, the wind can
be modeled as turbulent flow over a flat plane. The well known solution (for
example, see 3 42 of Ref. 25) for the velocity field in this case has a logarithmic
velocity profile,
where I( is the von Karman coefficient, vf is the friction velocity, zo is the friction
height, and z the height above the ground. The values used here are the following:
I( = 2.5, vf = .64, and zo = 0.1.
2. Sound source character and location. The source of the low frequency
noise is the passage of the turbine blade through the turbulent wake of the support
tower (see Section 2.4). Hence, the source is placed 40 m above the ground.
Although we have noted that the source has dipole characteristics in the plan
view (see Fig. 2.5), we have restricted our investigation to the directly downwind
direction. Consequently, the directivity does not affect the field in which we are
interested, and we treat the source as if it were a compact, omnidirectional source.
3. Ground impedance. Because waves which have undergone multiple
34

reflections are an important part of our investigation, the reflection coefficient
must be specified. The reflection coefficient Rp for an air-ground interface is
given by Eq. (1.5). The impedance of air Zajr is well known (415 in MKS units
for air at 20°C [14]). The impedance of the ground is harder to obtain. We have
chosen to use the empirical formula of Delany and Bazley [18]. After measuring
characteristic impedance for a large number of fibrous absorbent materials, they
constructed a power-law formula for the impedance. The important quantity
is the ratio of the frequency f to the flow resistivity per unit thickness cr. As
formulated by Chessel [19], the Delany-Bazley formula for the impedance 2 is
given by 2 = R + iX, where the resistance R is
and the reactance X is
We have assumed that the flow resistivity for the ground at the WTS-4 site is
cr = lo6 in MKS units. This choice of u agrees with experimental measurements
of the ground impedance. * 4. Frequency. Although the ray paths are independent of frequency,
MEDUSA requires frequency information to compute absorption and the ground
reflection coefficient (see Eqs. (4.2) and (4.3)). The frequency is 8 Hz for the
examples in the next section. Note that we have not accounted for the fact that
the low frequency noise from the WTS-4 wind turbine is impulsive. However,
since linear acoustics is assumed, the components of the pulse can be treated
separately and used to reconstruct the pulse at any receiver range.
'Willshire has measured the ground impedance for frequencies above 25 Hz and found good . agreement between the measurements and the Delany-Bazley model.
35

5 . Absorption. We have decided to ignore air absorption in our investi-
gation because of the very low frequencies involved. However, if it is necessary to
include absorption MEDUSA can accept absorption data in tabular form or an
analytic expression for absorption as a separate subroutine.
6. Receiver height. To compute the propagation loss, MEDUSA uses
information gathered from eigenruys. Eigenrays are the unique rays which pass
between the source and receiver. Hence the receiver height as well as its range
must be specified. The microphones used in Willshire’s experiments were placed
almost on the ground. We used a receiver height of 0.5 m because if 0.0 m (ground
level) is used it would be very difficult for MEDUSA to distinguish between an
incident ray and a ray just reflected from the ground. It becomes increasingly
difficult for MEDUSA to make the distinction as the receiver is placed closer to
the ground. Our choice was to place the receiver near enough to the ground
to study the near-ground sound field but sufficiently far above the ground to
make MEDUSA’S computations easier. Note that in the frequency range we are
considering (2-20 Hz), the difference between 0.0 m and 0.5 m is a very small
fraction of a wavelength.
To summarize, we have assumed the propagation speed is given by the
scalar sum of the static sound speed co and the wind velocity given by Eq. (4.1),
the source is located 40 m above the ground, the ground impedance is given by
Eqs. (4.2) and (4.3), and the receiver height is 0.5 m. These input parameters are
used in the next section to generate examples of MEDUSA application programs.
The examples are then compared with Willshire’s field data in Chapter 5 .
36

4.2 Applications of MEDUSA
After the environmental parameters described in Section 4.1 are in the
input data file, MEDUSA'S applications programs can be executed. The output of
these programs (ray path plots, propagation loss plots, and caustic plots) provide
results of our investigation. Example plots and a description of each application
are described in this section. These examples are described in more detail in the
next chapter; they are included here primarily for illustration.
1. Ray paths. Given a launch angle, MEDUSA can solve the ray equation
Eq. (3.4) for the ray height as a function of range z = z ( T ) . Once the solution
is obtained, MEDUSA can easily plot z ( r ) , i.e., the ray path plot. The ray path
plots are probably the most widely used application of ray theory because they
provide a gross description of the sound field.
Figure 4.1 shows the ray path plot for a family of rays having launch
angles between f8" in 1" increments for the input parameters described in Sec-
tion 4.1. Because of the scale of the figure (meters versus kilometers), the wedge
of rays appears much larger. Note that the rays between f5" or f6" are trapped
near the ground. Rays launched at greater angles do not contribute to the sound
field near the ground within the first 5 km. Because the sound field near the
ground is dominated by the rays launched at such small angles, the assumption
in Chapter 3 that cos0 N 1 is a good one.
2. Propagation loss. Although ray path plots provide a descriptive pic-
ture of the sound field, quantitative sound level predictions can only be made from
propagation loss ( P L ) plots. In fact, with the aid of P L plots we will compare
ray theory predictions to actual sound level data.
In qualitative terms, propagation loss is the decrease in sound level as
37

I - 400 E
0
Figure 4.1
38
2 4 6 a 10 12 DISTANCE (km)
14
FAMILY OF RAYS HAVING LAUNCH ANGLES BETWEEN f 8 O . INCREMENTS ARE lo

one moves away from the source. The quantitative definition is
ct, )
P L = -lolog,o (4.4)
where Io is the intensity of the source and 1 is the intensity at the field point (a
given height above the ground). The ratio 1/10 is called the focusing factor. Fig-
ure 4.2 shows the P L curve for an 8 Hz component with the parameters described
in Section 4.1. The solid curve is the coherent propagation loss, which is found
by summing the received pressure signals, including phase, from each eigenray
and using the sum to obtain the intensity.2 The dotted curve is a reference and
represents the loss due to ordinary spherical spreading in a homogeneous atmo-
sphere.
As previously noted, the central theme of this thesis is the application of
ray theory to study the propagation of low frequency turbine noise. The success
of the application can be only judged by comparing the ray theory predictions to
actual sound field data. The P L curve provides the basis for a direct comparison
between the data and the ray theory predictions. In Chapter 5 we will discuss
the comparison in more detail. The importance of caustics is described in the
remainder of this chapter.
3. Caustics. In the investigation of sound propagation from the WTS-4
wind turbine we have assumed as a first approximation that caustics need not be
accounted for when calculating the P L curve. Figure 4.3 shows the location of ~~
*Although it is not included in Fig. 4.2, an incoherent propagation loss can be calculated by MEDUSA. In the calculation, the phase of each contribution to the field intensity is ignored, and a 1 / 4 is substituted to account for losses attributable to phase differences. We calculated the incoherent P L for this example. It has the same general shape as the coherent P L curve, but because of the factor l / f i the propagation loss is greater. Consequently, the incoherent P L curve is closer to the spherical spreading curve. Incoherent P L is used in cases where phase differences cause complications in the PL curve. In our investigation it was not necessary t.0 calculate incoherent propagation loss.
39

h
E
r L2
v
- I -
w I
J
60 -
70 -
80 -
90
40
50
I " ' I ' . ' l . " I . ' . I ' " I ' . . ( '
i. \\
100 -
1 '
200
150 1 . . . *' '. ..
m . . I
0 2 4 6 8 10 12 RANGE (km)
14
Figure 4.3 LOCATION OF CAUSTICS.
40

caustics for the sound field depicted in Fig. 4.1. Note that few caustics occur near
the ground. Although our neglect of caustics when we compute intensity cannot
be defended quantitatively, it is clear that few caustics occur near the ground,
where our field points are located. We therefore assume that simple ray theory is
valid for the calculations in which we are interested.
After careful selection of input parameters (Section 4.1) which model
the WTS-4 machine and its environs, we have seen that the example applications
(Section 4.2) of MEDUSA provide theoretical predictions for comparison with
Willshire’s experimental results. In the next chapter we examine these applica-
tions in more detail.
41

CHAPTER 5
APPLICATIONS TO WILLSHIRE’S SEPTEMBER 1984
EXPERIMENTS
In this chapter we look more closely at the applications of ray theory
described in Chapter 4 and the data with which the theory is compared. In
particular, the sound level data gathered by W. L. Willshire at the WTS-4 wind
. turbine at Medicine Bow, Wyoming, in September 1984 is compared to the P L
curve predicted using MEDUSA. A detailed description of Willshire’s data is
given in the first section.
5.1 Experimental Data
During September 1984 W. L. Willshire made detailed measurements of
low frequency (2-20 Hz) noise of the WTS-4 wind turbine located at Medicine
Bow, Wyoming.’ In 1985 Willshire gave both an oral report [24] and a written
report [5] that describe the results.
Data were collected downwind of the turbine during a 4 hour period of
a single day. Willshire sampled the sound field at nine different recording sites
‘Mid-frequency (63 Hz, 250 Hz, and 1000 Hz) data are included in Willshire’s results, but the main emphasis of Willshire’s 1985 report is on the low frequency noise. We briefly discuss the mid-frequency results in Appendix E.
42

75
70
65
60
m TI
a cn 55
0 8 Hz Data
-_I- 3 dB/doubling - - - 6 dB/doubling
---. n n r 'h e- . c
L
L
k \ c
53 c
\ \
I I I I l l I I 1 4 5 k O ' ' ' ' I ' 1000 10000 20000
Slant Range, m - -
Figure 5.1 S O U N D LEVEL MEASUREMENTS AT THE WTS-4 SITE (FROM REF. 5 ) .
located 0.3 km to 10 km from the turbine. Each measurement was made sepa-
rately. During the course of the experiment, the wind speed range was 12-15 m/s.
Sound levels in the 2-20 Hz frequency range were measured. The sound levels at
6, 8, and 11 Hz were singled out for presentation in Willshire's report because of
their good signal to noise ratio and "low source variablility." A reproduction of
Willshire's plot of the 8 Hz data is shown in Fig. 5.1 (from Ref. 5).
In Fig. 5.1, the sound pressure level (in decibels) is plotted versus the
logarithm of the slant range. Slant range, which is the line-of-sight distance from
the source to the receiver, was used because the source is elevated (recall that
the source of the thumping noise is assumed to be 40 m above the ground). The
lower (dashed) line is the curve for a signal subject only to spherical spreading,
that is, 6 dB loss of signal strength per doubling of distance. The upper line is the
43

curve for a cylindrically spreading signal. Note that the two data points nearest
the source fall on the spherical spreading curve, while the downrange data points
closely follow the cylindrical spreading curve. In other words, the pattern implies
spherical spreading near the source and cylindrical spreading downrange. This
pattern occurs in all of Willshire’s low frequency data.
At first glance, the high sound levels for the downrange data are some-
what unexpected. Since we are investigating low frequency components, atmo-
spheric absorption is considered negligible. Hence, one might expect the sound
levels to closely follow the spherical spreading curve. However, this expectation
proves to be mistaken, as will be seen when the P L curve based on ray theory
is examined. In Section 5.3, we compare propagation loss predictions based on
ray theory with the data described in this section. Before proceeding, we will
examine the ray plot of Fig. 4.1 more closely.
5.2 Ray Paths near the Source (0-2 km)
Shown in Fig. 5.2 is a closer view of the ray paths plotted in Fig. 4.1. The
sound field is shown up to a height of 200 m and out to a range of 5 km. Notice
that near the source only single ray arrivals are recorded. Since atmospheric
absorption is considered negligible and the rays have not yet hit the ground more
than once, the only contribution to the diminution of the sound level is spherical
spreading of the sound (modified only slightly by refraction). At some distance
downrange (= 2 km), the onset of a confluence of rays can be seen. Thereafter the
sound field on the ground is characterized by multiple ray arrivals. The arrival of
additional rays should cause a significant increase in the sound level.
44

I
-010 0:5 1:0 1:5 2.'0 2:5 3:O 3.3 4.0 4.3 5 RANGE - km
D
Figure 5.2 INCREMENT IS 1'.
FAMILY OF RAYS HAVING LAUNCH ANGLES BETWEEN &loo. LAUNCH ANGLE
45

5.3 Propagation loss
We now turn to the propagation prediction based on ray theory. In
Figs. 5.3-5.5 the ray theory P L curve (see Fig. 4.2) has been reproduced with
Willshire’s 6, 8, and 11 Hz data points, respectively. Recall that the upper
curve is the propagation loss for the windy atmosphere, while the lower curve
represents spherical spreading. We note here that the spherical spreading curve
represents the diminution of sound due solely to increasing slant range R, i.e.,
P L cc -20 log 1/R, where the slant range R is the line-of-sight distance from
the source to the receiver. The loss is computed with slant range; however, it is
plotted versus range along the ground r .
Willshire’s data are added to the P L plots in the following manner.
First, we assume spherical spreading near the source. Consequently, the 300 m
data point is placed on the spherical spreading curve in the P L plot. The remain-
ing data points are plotted relative to spherical spreading from 300 m. That is,
the loss due to spherical spreading from 300 m is subtracted from the actual mea-
surement. The result is the relative level. The relative level is then added to the
MEDUSA calculated spherical spreading curve. Clearly, good general agreement
is obtained between the experimental data and the ray theory P L curve.
The sharp jumps of the ray theory curve are explained as follows. As an
example, consider Figs. 5.3 and 5.4. Inspection shows that the jumps in the P L
curve are associated with the onset of multiple ray arrivals at the receiver. In fact,
MEDUSA computes an eigenray data summary which tells us exactly where the
jumps occur. For example, out to the range of the first jump, just beyond 2.1 km,
only two eigenrays are recorded at each receiver range: one direct eigenray and
one eigenray which reflects from the ground just in front of the receiver. Between
46

W
50 -
60 -
70 -
80 -
90
Figure 5.3 PROPAGATION LOSS AT 6 Hz WITH WILLSHIRE'S DATA ADDED.
1 ' " l " ' I " ' 1 ' " I " ' I ' " I '
40 DOWNWIND, 8 Hz
A, . RAY THEORY
801 ...... .--........ SPHERICAL SPREADING I.........
..... ......*.... --.. -.--.. ..........--...
Figure 5.4 PROPAGATION LOSS AT 8 HZ WITH WILLSHIRE'S DATA ADDED.
47

DOWNWIND, 11 Hz - 1: 50 -
60 -
70 -
80 -
90 " ' I ' ' ' I ' ' ' I ' ' I " ' I ' ' ' I ' ' ' 1 '
Figure 5.5 PROPAGATION LOSS A T 11 HZ WITH WILLSHIRE'S DATA ADDED.
2.1 and 2.3 km four additional eigenrays are found making a total of six eigenrays
at the 2.3 km range. Because we have instructed MEDUSA to search for eigenrays
in 0.2 km steps, we do not know exactly where the additional rays arrive-it is
known only that the additional rays arrive somewhere between 2.1 km and 2.3 km.
Nevertheless, there is a sharp jump in the P L curve at 2.3 km. After 2.3 km,
the number of eigenrays remains constant until about 3.7 km, where another
jump occurs. Because the number of eigenrays between 2.3 km and 3.7 km is
constant, the only contribution to propagation loss is travel distance. Therefore,
the P L curve between these two points drops off with a spherically spreading
slope. Although jumps can be seen at longer distances, the P L curve becomes
more complicated. Jumps and drops occur in a less regular manner.
We have noted that the ray theory P L curve lies considerably above
the spherical spreading curve. In fact, we know from Willshire's data that the
48

spreading is cylindrical. The observed and (ray theory) predicted propagation
loss behavior is consistent with our understanding of sound in a channel [26].
A channel is formed because downwind sound rays that propagate close to and
almost parallel to the ground are trapped near the ground. Furthermore, after
reflection at the ground, they always return to the ground (see Fig. 5.2). Evi-
dently, Willshire’s measurements reveal a sound channel downwind of the WTS-4
machine.
Although ray theory is successfully applied to the problem of propagation
of low freqency noise from the WTS-4 wind turbine, certain minor discrepancies
may be noted. Again consider Fig. 5.3. First, careful inspection of the figure shows
that the spherical spreading curve first falls slightly below the ray theory predicted
curve and then approaches it. Two opposing effects are at work. First, very
near the source, the difference exists because MEDUSA locates eigenray pairs.
Therefore the ray theory curve should be above (on the order of 6 dB) the spherical
spreading curve near the source. In the region between 500-1500 m, however, the
ray theory curve approaches and even falls below the spherical spreading curve.
Recall from Section 5.2 that we assume spherical spreading is dominant near the
source. Since the rays follow curved paths rather than straight lines, one might
expect deviation from 1/r losses. In fact, because of strong refraction of the rays
toward the ground, the ray tube area (see Appendix D) increases more rapidly
than it would in a homogeneous medium. The propagation loss is therefore greater
than that of spherical spreading. However, the effects just described are minor
compared with the changes associated with the onset of multiple ray arrivals at
about 2.0 km.
Second, the two data points at ranges near 1000 m fall considerably
above the spherical spreading curve. Their position may indicate that the channel
49

region begins slightly nearer the source than predicted by ray theory. However,
the location of each jump is expected to vary with temporal changes in the sound
speed profile (both short term fluctuations and longer term variations). Data
taken over a relatively long time (recall that Willshire’s measurements were made
separately over a 4 hour period) would therefore be expected to define an average
curve, not one based on a very specific sound speed profile. (In Chapter 6 we
will compare our ray theory predictions with data taken over a very short time
interval.) Consequently, because of the problems associated with collecting data
in a windy atmosphere, the data should not be expected to exactly fit the ray
theory curve. Another possibility is that the levels at 1000 m might be the result
of diffraction from a caustic (see Appendix D). However, from Fig. 4.3 we see
that the nearest caustics are 1000 m away from the data points. It is unlikely
that caustics at such a distance would have any effect.
By directly comparing the ray theory P L curve with the data, we can
conclude that the basic features of the sound field measured by Wi l l sh i r e
spherical spreading near the source and cylindrical spreading downrange-are to
be expected. In fact, the wind gradients near the ground downwind of the WTS-4
turbine create an atmospheric sound channel in the downwind direction. Sound
channels are a well known phenomenon of underwater acoustics and are char-
acterized by cylindrical spreading [26]. That the downwind atmospheric sound
channel exists is amply supported by Willshire’s data. The data points which
fall on the spherical spreading curve near the source simply show that the sound
channel has yet to be formed.
In conclusion, we see that the exact shape of the P L curve for a par-
ticular time is not available from ray theory. Nevertheless, the general shape
of the P L curve-spherical spreading near the source and cylindrical spreading
50

downrangeaccurately reflects the acoustics of downwind low frequency sound
from the WTS-4 wind turbine. In the next chapter we compare ray theory predic-
tions with data, both upwind and downwind, taken in Willshire’s more elaborate
experiments carried out in May-June 1985.
51

CHAPTER 6
APPLICATIONS TO EXPERIMENTS CONDUCTED DURING
MAY-JUNE 1985
Because of interest generated by Willshire’s first experiment (Septem-
ber 1984), more experiments were conducted during the folIowing spring, in May-
June 1985. Both upwind and downwind measurements were made, as well as a
few measurements at other angles of azimuth. We are concerned here with just
the upwind and downwind data. Although we have not analyzed all of the new
data, an analysis of a representative portion, which we feel illustrates the main
observations, has been completed. The results of the analysis are described in
this chapter.
The data from the 1985 experiment are sound pressure levels for fre-
quencies between 1 and 20 Hz. The levels were obtained with special B&K low
frequency microphones and recorded as digitized data (100 pps sampling rate) us-
ing a 4096-point fast Fourier transform (FFT). Each data run consists of blocks of
data for the frequency components from which which we computed average SPLs.
Only levels with a 3 dB signal-to-noise ratio were included in our investigation.
Recall that we have assumed that the sound is propagating over flat ground.’
‘We note here that there is some concern about the location of the 10,000 m microphone. While the ground is flat out to 6-7 km, thereafter the ground dips some 30 ft and then rises in stages to about 10 ft above ‘level’ ground. The microphone was positioned on the rise.
52

Atmospheric conditions during the 1985 experiments were comparable
to those of the 1984 experiments. The temperature range was typically within a
few degrees of 20°C. Wind speed varied from about 9 m/s to 24 m/s. The wind
direction varied from the directly downwind direction between +32" and -47".
Table 6.1 contains the ranges of measurements for the 1984 and 1985 experiments.
SeDtember 1984
Table 6.1 RANGES FOR THE 1984 AND 1985 EXPERIMENTS.
Mav-June 1985 292 444
1048 1353 2447 2752 3952 4257
10147
350 608 838
1749 2006 2242 4851
10,000 20,000
Before proceeding we point out an important difference between the two
experiments. Recall that the fall 1984 measurements were made with a single
microphone over a 4 hour period, i.e., Willshire made consecutive, not simultane-
ous, measurements as the distance from the turbine was changed. Consequently,
the data give only an average picture of the downwind sound field. In contrast,
the May- June 1985 measurements were made simultaneously; each measurement
site had its own microphone. In the second experiment each data run lasted only
long enough-a few minutes-to obtain a time average of the sound levels. In the
second experiment, therefore, an instantaneous 'snapshot' of the sound field was
obtained.
53

6.1 Modification of the Theory To Include Upwind Propagation
A short discussion of how the data is compared to ray theory is now
given. The downwind data is compared to the theory in exactly the same manner
as described in Chapter 5 . However, to discuss the upwind data we must modify
our expression for the propagation speed. Recall in Section 3.4 that we con-
structed the propagation speed by adding the component of the wind velocity in
the direction of propagation to the static sound speed. For upwind propagation,
we subtract the wind velocity from the static sound speed, i.e.,
Again, we make the approximation cos6 N 1. As we shall see, the propagation
speed profile in this case leads to the formation of a shadow zone. Since ray
theory cannot be used to accurately predict sound levels in a shadow zone (see
Appendix D), one should expect considerable discrepancy between predictions
and data for upwind propagation.
6.2 Downwind Sound Levels (dB)
As seen in Chapter 5 , our ray theory predictions give a good account
of the data recorded in the first experiment, in particular, spherical spreading
near the noise source and cylindrical spreading downrange. Do the downwind
propagation results of the second experiment provide the same good correlation
between data and prediction?
Figures 6.1-6.4 show the measured SPLs at 10 Hz versus the logarithm
of the range for four data runs. Furthermore, a cylindrical spreading, or 3 dB
per doubling of distance, curve (dash-dot-dash curve) and a spherical spreading,
54

75 1 m-
a.
so-
? =- d 90-
4s-
a-
u-
m-
65-
m-
? u- $90-
U-
4-
3.3-
DRUM. lorn
304 I , , , , , . 10' RANGE-=
10'
Figure 6.1 DOWNWIND EXPERIMENT N O . 3, Figure 6.2 DOWNWIND EXPERIMENT NO. 5 , 10 Hz. 10 Hz.
70 - 6.5-
m -
? 55-
$ 50-
45-
40 - I
m-
611-
m-
3 s- 50-
45 - 40-
35 -
Figure 6.3 DOWNWIND EXPERIMENT No. 6, Figure 6.4 DOWNWIND EXPERIMENT
10 Hz. No. 16, 10 Hz.
55

Table 6.2 LIST OF WIND CONDITIONS FOR DOWNWIND EXPERIMENTS.
Figure Data run 6.1 DRUNS
Wind speed (m/s) 15
6.2 6.3 6.4
14 16 18
DRUN5 DRUN6 DRUN16
or 6 dB per doubling of distance, curve (solid curve) are shown for comparison.
The data are plotted in this manner in order to retain the same format used by
Willshire (see Section 5.1). Table 6.2 lists four data runs and the wind speed at
the hub at the time of the measurements.
We comment on the general features of the data in Figs. 6.1-6.4. In all
of the figures, the data points within the first 1000 m exhibit spherical spreading.
The next three data points (near 2000 m) are near the cylindrical spreading curve
which indicates the formation of the sound channel. The 10,000 m data points fall
much nearer the spherical spreading curve. Finally, the 20,000 m data point from
run 6 falls near the cylindrical spreading curve (the measurement at 20,000 m
was difficult to obtain, hence the sparsity of data at that range).
While the data from Willshire’s first experiment consistently exhibit
spherical spreading near the source and cylindrical spreading downrange, no clear
trends exist for the new data. In fact, the data in Figs. 6.1-6.4 are scattered be-
tween the cylindrical and spherical spreading curves.The fluctuation in the sound
levels between spherical and cylindrical spreading seems puzzling.’
’The location of the 10,000 m microphone was atypical in that the ground was undulating, not flat (see footnote p. 52). If, because of the undulations, the microphone was shielded from some of the reflected rays, an unusually low sound pressure level would have been recorded.
56

6.3 Least Squares Fit of the Downwind Data
Perhaps because of the puzzling scatter of the data, Hubbard, Shepherd,
and Willshire [27], in a brief presentation of the measurements for seven of the
downwind data runs, chose to present a least squares fit curve for each run. The
seven curves completely cover the region between the spherical and cylindrical
spreading curves, except for one run, which lies about 3 dB above the cylindrical
spreading curves. In this section we present the least squares fit for the data runs
shown in Figs. 6.1-6.4.
Figures 6.1-6.4 are reproduced in Figs. 6.5-6.8, with the exception that
the individual data points for each run are replaced by a least squares fit (dotted
curve) for that run. The fit was made by assuming that the sound pressures
diminish with range according to a power law, i.e.,
S P L = rn log (range) + b , (6.2)
where S P L is in dB, b is the projected source sound level, and m is the slope of
the curve. Both b and m are determined by the least squares algorithm.
The advantage of using the least squares fit to present the data is that
the wide variation of individual data evident in Figs. 6.1-6.4 is masked. We might
expect the smoothing process to obscure or hide important factors. In any case,
the process clearly reveals that in all four data runs the average propagation loss
falls between the cylindrical and spherical spreading curves. The spread is about
the same as that found by Hubbard et al. [27]. For example, the curve for run 3
implies a near-spherical spreading of the sound while the curve for run 6 seems
to confirm cylindrical spreading. One concludes thai while the average curves do
‘organize the data,’ the new presentation still does not allow us to explain why
the data behave as they do.
57

75 , , 7 5 ,
m-
a-
m-
55-
$ 5 0 -
45 - 40-
35 -
DRL~NX IO m
Figure 6.5 LEAST SQUARES FIT FOR DATA Figure 6.6 LEAST SQUARES FIT FOR DATA
FROM EXPERIMENT NO. 3, 10 HZ. FROM EXPERIMENT N O . 5 , 10 HZ.
Figure 6.7 LEAST SQUARES FIT FOR DATA Figure 6.8 LEAST SQUARES FIT FOR DATA
FROM EXPERIMENT No. 6 , 10 H z . FROM EXPERIMENT N O . 16, 10 HZ.
58

6.4 Comparison with Ray Theory Predictions
It appears, superficially at least, that the data from the second exper-
iment does not support the conclusions based on analysis of the data from the
first experiment. However, the physical argument that a sound channel forms
near the ground because of strong gradients in the wind velocity still has strong
appeal. It is difficult to see why a sound channel would be any less likely on a
short term basis than on a long term basis.
Of particular interest are the midrange (near 2000 m) data points. In Chapter 5 we saw that near 2000 m the propagation loss curve calculated by
MEDUSA has a sharp jump which indicates a confluence of rays. A possible
explanation of the jumps in the data near 2000 m in the second experiment (see
Figs. 6.1-6.4) is that it is due to the confluence. In Figs. 6.9-6.12 we have plotted
the data from the May-June 1985 experiments with the PL curve as produced by
MEDUSA. It is seen that the predicted jump does indeed correlate very well with
the behavior of the data in that region. In fact, except for data run 3, not only
the position but also the magnitude of the observed jump is correctly predicted.
Agreement between prediction and measurement is not as good at the far
downrange points, particularly at 10 km. However, as has already been pointed
out, the environment at the 10 km measurement site was somewhat atypical.
Moreover, the 20 km data point in run 6 does confirm the MEDUSA prediction.
Except for scatter in some of the far downrange data points, the May-
June 1985 experiments also indicate a downwind sound channel. The P L curve
again provides a good prediction of the observed field. In fact, the confirmation is
better in the second experiment because data were taken near 2000 m, the range
at which the first jump is predicted to occur.
59

8 10 12 14 9 0 1 = - I - - I . . I ' ' ' 1 ' ' 1 ' ' ' I ' ' ' I '
0 2 4 6 RANGE - km
Figure 6.9 PROPAGATION LOSS WITH DATA FROM EXPERIMENT NO. 3, 10 HZ.
0 2 4 6 8 10 12 14 9 0 1 - 1 - I * * I ' I ' ' ' 1 ' ' ' ' ' ' I ' ' ' ' '
RANGE - km Figure 6.10 PROPAGATION LOSS WITH DATA FROM EXPERIMENT NO. 5, 10 HZ.
60

90 & 20 0 5 10 15 L
RANGE - km 5
Figure 6.11 PROPAGATION LOSS WITH DATA FROM EXPERIMENT N O . 6, 10 HZ. 40
50
60
70
80
90
Figure 6.12 PROPAGATION LOSS WITH DATA FROM EXPERIMENT NO. 16, 10 HZ.
61

Table 6.3 LIST OF WIND CONDITIONS FOR EXPERIMENTS SHOWN IN FIG. 1.
- Figure Data run Wind speed (m/s) 1 URUN29 12 2 3 4
URUN3O URUN8 URUN18
15 11 15
6.5 Upwind Data
The May- June 1985 experiments included measurements of the upwind
sound levels from the WTS-4 wind turbine. Figures 6.13-6.16 show the upwind
SPLs at 10 Hz versus the logarithm of the slant range for four of the upwind data
runs. Conditions for these experiments are shown in Table 6.3. For comparison,
curves for cylindrical spreading, or 3 dB per doubling of distance (upper curve),
and spherical spreading, or 6 dB per doubling of distance (lower curve), are
also shown. Note that in each figure the left end of the abscissa is 200 m, not
100 m. Table 6.4 is a list of the ranges at which data were collected. For the
experiments shown in Figs. 6.13, 6.14, and 6.16, the measurement nearest the
WTS-4 machine was made at 201 m. This data point is used as the anchor from
which the spherical and cylindrical spreading curves are drawn. For Fig. 6.15 the
nearest measurement was at 400 m; consequently, the spherical and cylindrical
spreading curves begin there. The group of data points from near 650 m to just
under 1150 m are clustered around the spherical spreading curve. The last three
data points (the region between 2450 m to 2950 m) are generally below spherical
spreading. In the data runs shown here no 3660 m measurement was recorded.
In summary the data in Figs. 6.13-6.16 show that in the region of 200-1150 m the
SPLs closely follow the spherical spreading curve. At longer ranges, however, the
levels are somewhat lower.
62

' J I I
Figure 6.13 UPWIND EXPERIMENT NO. 29, 10 Hz. 10 Hz.
Figure 6.14 UPWIND EXPERIMENT N O . 30,
70 - 65-
60-
0 55-
$9-
45 - 40-
35 -
WRUN8,lOHz I 75
70 - URUNlE, loHz
65-
60-
m 0 55-
-
I
$ 5 0 -
45 - 40-
35 - 30- I I I I I I I
1b3 I ' ' '1b4 RANGE - m
Figure 6.15 UPWIND EXPERIMENT No. 8, Figure 6.16 UPWIND EXPERIMENT No. 18, 10 Hz. 10 Hz.
63

Table 6.4 RANGES 1985 UPWIND EXPERIMENTS.
Upwind Ranges,
m 201 400 650 888
1147 2437 2684 2925 3660
How do ray theory predictions compare with the &&a? Because t,,e wind
‘opposes’ the propagation of sound upwind of the WTS-4 machine, a negative
sound speed gradient is formed. Consequently, we expect the formation of a
shadow zone [lo] in which the SPLs are much lower (infinitely lower if no sound
leaks into the shadow zone by diffraction), than the values given by spherical
spreading. In Figs. 6.13, 6.14, and 6.15 the departure from spherical spreading
beyond about 1000 m is evident, and it would be tempting to conclude that ray
theory is confirmed.
However, quantitative calculations show otherwise. Consider the ray
trace diagram for a typical upwind profile shown in Fig. 6.17. The diagram shows
that the shadow zone should begin at a range less than 300 m. More detailed
computations for the upwind data runs show that the shadow zone is predicted to
begin at about 180 m from the source. The upwind P L curve shown in Fig. 6.18
demonstrates the dramatic drop in the sound levels associated with the shadow
zone. It is clear from the data, however, that sound is present in the upwind
region beyond the boundary of the shadow zone.
64

RANGE - lan D
Figure 6.17 FAN OF UPWIND RAYS SHOWING THE FORMATION OF A SHADOW ZONE.
Figure 6.18 SPREADING CURVE (LOWER CURVE).
PROPAGATION LOSS (8 HZ) IN THE UPWIND DIRECTION WITH SPHERICAL
65

On the other hand, some reduction in SPL in addition to that due to
spherical spreading is apparent. For example, if we compare the average of the
four upwind SPLs runs at about 2.8 km with the average of the four downwind
SPLs (interpolated at a range of 2.8 km), we see the downwind SPLs are about
59 dB whereas the upwind SPLs are about 45 dB, Le., the SPL of the upwind
sound is much less than that of the downwind sound at a comparable range. Since
the microphone nearest the source was located at a range of 201 m, Le., beyond
the predicted end of the insonified region it is not possible to judge whether any
significant drop associated with the shadow zone occurred. Nevertheless, one
concludes that while the sharp shadow zone predicted by using ray theory does
not occur, the data confirm the general expectation (based on ray theory) that
the SPL should be much reduced upwind.
It is, in fact, well known that the application of ray theory in a shadow
zone, because of its association with a caustic surface (see Fig. 6.19 and Ap-
pendix D), does not yield accurate sound level predictions, particularly at very
low frequencies. Piercy et al. state that at low frequencies the shadow zone is
poorly formed and that the sound levels in the shadow zone are generally 10-20 dB
higher than the levels at high frequencies (above 400 Hz) [4]. The readiness with
which the low frequency sound penetrates the shadow zone is confirmed by Will-
shire’s measurements.
For the record several features of the P L curve given by MEDUSA for the
upwind case, Fig. 6.18, are interesting. First, because refraction effects near the
ground cause the ray tube area to be smaller than it would be for a homogeneous
medium, and because MEDUSA locates eigenray pairs, the upwind PL curve is
increasingly higher than the spherical spreading curve from 50 m to near 180 m.
Second, the seemingly erratic behavior of the P L curve beyond 180 m has a
66

UPWIND CAUSTICS
150
El I
E i 'I 5ol 0 0 0.2
. - 8
8 8
I 8 8
8 8 E 100:
i I 50 -
. . . 1 - . . 1 - . . 1 - - - 1 . - -
0 0.2 0.4 0.6 0.8 1.0 1.2 1.4 1.6 1.8 2 0 RANGE - km
Figure 6.19 FORMATION OF CAUSTICS ALONG A SHADOW ZONE.
physical explanation. In this region MEDUSA is still locating eigenray pairs;
however, because the second ray of the pair has passed through a caustic, it
has suffered a 7r/2 phase shift. The combination of the two rays in quadrature
therefore produces a drop in SPL. Thereafter, the curve rises as the observation
point nears the pairs; however, a 7r/2 phase shift is introduced because the second
ray of the pair has passed through a caustic. Thereafter, the curve rises as it nears
the caustic; however, before the caustic is reached, a second drop occurs because
MEDUSA can locate only one eigenray (refraction has caused the other to deflect
away before ever reaching the observation point). Finally, as the observation
point gets very close to the caustic, the precipitous drop in ray tube area causes
the P L curve to rise very sharply. Not shown because of scale is the drop t o
infinite propagation loss, which marks the beginning of the shadow zone.
67

CHAPTER 7
SUMMARY AND CONCLUSIONS
In this chapter we provide a brief summary of this thesis and the con-
clusions that are drawn from our investigation. Suggestions for future work are
discussed in Section 7.4.
7.1 Downwind Sound Field
During the fall of 1984, W. L. Willshire made measurements of the low
frequency (1-20 Hz) downwind sound field of the WTS-4 wind turbine at Medicine
Bow, Wyoming. Although the measurements were simple, they revealed a dis-
tinct propagation loss pattern-spherical spreading near the source and cylindri-
cal spreading downrange. Separate investigations based on ground wave theory,
normal mode theory, and the parabolic approximation were undertaken in which
the objective was to provide a theoretical framework for the data.
In this thesis we attempt to use simple ray theory to explain Willshire’s
data. General ray theory for a moving medium is developed and the ray path
equation Eq. (3.12) is obtained. While maintaining the basic elements of the
source and environment of the WTS-4 machine, we introduce restrictions which
simplify the ray path equation and allow its use with the computer program
68

MEDUSA. The results of the applications of MEDUSA, in particular propaga-
tion loss curves, are compared to Willshire’s data. Good agreement is obtained.
Because of the visualization of the sound field provided by ray theory, we have
been able to interpret the downwind sound field as being that of a near-ground
sound channel.
Furthermore, we describe Willshire’s follow-up experiments conducted
during May-June 1985. Both upwind and downwind measurements were made.
In contrast to the September experiments, which yielded a 4 hour time average of
the field, the May-June 1985 experiments provided simultaneous measurements of
the sound field. Again, we compare ray theory predictions to the data. Although
more scatter is seen in the data from the second experiment, the data confirm the
existence of the sound channel. In particular, our investigation correctly predicts
the position and the magnitude of the jump in the sound level associated with
the onset of multiple ray arrivals.
7.2 Upwind Sound Field
The goal of this thesis is to provide a theoretical basis with which to
explain the downwind sound levels as measured by W. L. Willshire. However,
Willshire also made upwind measurements. We have applied our theory, with
modification to account for upwind propagation, to Willshire’s data. We have
found that ray theory cannot accurately be applied to the upwind sound field.
Although Willshire’s measurements show that the upwind sound field has dras-
tically lower sound levels compared to the downwind field, the ray theory results
predict a complete absence of sound beyond a distance of only 200 m, i.e., a
shadow zone. Willshire’s measurements clearly indicate that a shadow zone does
not form.
69

7.3 Comments
Why does ray theory work well for the downwind sound field but not
the upwind field? Because our investigation deals with simple propagation from
a spherical source above a reflecting boundary, the formation of caustics is the
most serious threat to the successful application of ray theory. Although caustics
form downwind, they are too far away to affect the field near the ground. However,
the formation of a caustic surface, i.e., a shadow zone, in the upwind direction
proves fatal for ray theory.
In conclusion, we have found that ray theory, despite the initial uncer-
tainty about its application at such low frequencies, is a good predictor of the
basic features of the downwind sound field. In contrast, ray theory is not a good
predictor of the upwind sound field.
7.4 Further Investigations
The inclusion of caustic corrections with ray theory could provide a sub-
stantial improvement over simple ray theory. We have stated in Appendix D that
we expect caustic corrections to smooth the P L curve in the downwind direction.
In contrast a shadow zone is expected, based on simple ray theory, to form in
the upwind direction. However, it is known that sound penetrates the shadow
zone [4]. An interesting test of the utility of caustic corrections would be the
ability to account for the shadow zone field.
Sound propagation in directions away from the upwind-downwind axis
has not been considered. In directions away from directly downwind, propagation
could be handled by considering the following simple approximation. The net
effect of the wind velocity on sound propagating in the direction perpendicular
70

to the upwind-downwind axis (at f 9 0 " to the axis) is simply to 'carry) the sound
downwind, i.e., no refraction occurs for propagation in the 90" direction (see for
example Ref. 28). At intermediate angles the refraction effects of the wind can
be added through a COSCY term where CY is the angle away from the downwind
direction. Consequently the propagation speed becomes
= co + wcosecosa , (7.1)
where CY takes on values from 0" to 90". The P L curves for a suitable set of
angles between CY = 0" and CY = 90" could be computed separately in the manner
described in this thesis with the the propagation speed given by Eq. (7.1). The
results for each CY could be assembled to give a plan view of the sound field. In
the case of the WTS-4 machine corrections would have to be added to account for
the dipole nature of the source. Furthermore, we have assumed that temperature
has no effect on propagation, but as the effect of the wind velocity descreases to
zero, temperature effects, however small, would have to be incorporated.
71

APPENDIX A
Ground Wave Effects
During his initial analysis of the WTS-4 data from the September 1984
experiment, Willshire’s interest centered on the role played by the so-called ground
wave. In this appendix ground wave theory is summarized. We also reproduce
the evidence that led Willshire to conclude that the ground wave effect was unim-
portant in the downwind sound field. The discussion in this appendix is taken
mainly from Refs. 4 and 29. A detailed development of the following can also be
found in Ref. 19.
A . l The Ground Wave
As noted in Section 1.4, we neglected a term in the expression for the
sound radiated from a source near the ground. Here we include that term:
F +(1 - Rp)(-)e-ikQ 7-2 ,
where F is an amplitude factor (see Eq. (2), Ref. 29). The first term represents
the direct wave, the second term the reflected wave, and the third term what is
72

called the ground wave.' As the angle of incidence (IC, in Fig. 1.3) nears 0, R,
nears -1, and the incident and reflected waves cancel. The ground wave then
becomes the only contribution to the sound field.
A.2 Surface Wave Contributions
The picture is further complicated in the general case where the ground
impedance is complex. When the source and receiver are both above the ground
the complete field may be expressed in words as
P - = direct wave(r-') + reflected wave(r-') PO
+ground wave( T - ' ) + surface wave( r-'12) , ( A 4
where the terms in parentheses indicate the functional dependence on range. Note
that the third term of Eq. (A.l) has split into two terms, each with a distinctly
different dependence on range. At long range and with the source near the ground,
it is clear that the major contribution to the sound field is the surface wave. This
is the component of the sound field with which Willshire was initially interested.
The r-*I2 dependence coincides with the cylindrical spreading behavior observed.
Figure A. 1 shows Willshire's comparison between his field measurements
and the predicted levels based on ground wave theory. From the comparison,
Willshire concluded that the ground wave could not be the primary factor causing
the downwind sound field to follow cylindrical spreading, rather than a spherical
spreading curve.
Although it turned out that the ground wave was not of primary im-
portance in the propagation of downwind noise, the ground wave is of interest in
'The term 'ground wave'. derives from the analogous problem in electromagnetics (in Ref. 4, Piercy et al. point out that the electromagnetic ground wave is the vehicle of transmission for local AM radio stations).
73

I I I I 1 I I I I 1 1000 10000 20000 - s o k 1 ' ' 1 I t ' 300
Slant Range, m
Figure A.l COMPARISON OF PREDICTED GROUND WAVE LEVELS AND WILLSHIRE'S DATA.
SOLID SQUARES ARE THE PREDICTED LEVELS AND THE EMPTY SQUARES ARE THE MEASURED
LEVELS.
outdoor acoustics. In fact, it may play a sensible role in upwind propagation.
74

APPENDIX B
Beam Displacement
B. l Introduction
Beam displacement has been shown to be an important way to extend
the usefulness of ray theory. For example, Tindle and Bold [30] have successfully
studied problems which are usually treated with normal mode theory because
of the frequency limitations of ray theory. With this in mind we investigated
the feasibility of using beam displacement in studying the propagation of low
frequency sound from wind turbines.
B.2 The Head Wave and Beam Displacement
Beam displacement is a phenomenom associated with total internal re-
flection. Recall that the reflection coefficient R for a ray incident on a plane
surface is given by
where Zair and Zground are the impedances of air and ground, respectively, and
$i and $t are the angles measured with respect to the normal to the interface,
75

0
Figure B . l SOUND FIELD FROM A HEAD WAVE.
of the incident and transmitted rays, respectively (in contrast to Ea. 1.5 which
includes the grazing angle). The critical angle is defined as
where c,ir and cgtound are the sound speeds in air and in the ground, respectively.
If the angle of incidence is less than the critical angle, ?+hi < 6, normal reflection
and refraction occur. If qbi = 6, the transmitted wave travels along the air-ground
interface. If qbi > 6, total internal reflection is said to have occurred.
A simple understanding of beam displacement may be gained by con-
sidering Fig. B.l. Note the ray OA whose angle of incidence is $+ = 6. No
transmitted ray occurs in this case. Furthermore, a wave continues along the
interface AB and continually reradiates into the upper medium as it propagates.
The continual reradiation contributes to the wavefront P'P''. This wavefront is
called the head wave or lateral wave. If an observer is located at P ( x , r ) he will
measure a ray OABP which has been displaced an amount AB. A cluster of
76

-11 : I I I I I I I
70 72 74 76 78 80 82 84 I ANGLE OF INCIDENCE
6
Figure B.2 BEAM DISPLACEMENT AS A FUNCTION OF THE ANGLE OF INCIDENCE.
rays near critical incidence will form a beam whose center will be displaced a
similar amount, and hence the term beam displacement. A good review of beam
displacement is found in Ref. 32.
Given the angle of incidence and certain properties of the source and
environment, we can explicitly calculate beam displacement. Using a program
designed by E. K. Westwood [31], we made detailed calculations to determine
the effect of beam displacement in the propagation of sound from the WTS-4
wind turbine. Figure B.2 shows a computer generated plot of beam displacement
versus the angle of incidence for a fan of rays undergoing a single reflection. The
properties supplied to the program are the following: (1) the density of air, 0.001
kg/m3, (2) the compressional wave speed in air, 343 m/s, (3) the shear wave speed
in air (which of course is zero because shear waves do not propagate in air), (4)
the density of dry ground, 1.922 kg/m3, (5) the compressional wave speed for dry
ground, 762 m/s, and (6) the shear wave speed for dry ground, 457 m/s. The
77

values for the ground properties are approximately those' of the ground near the
wind turbine at Medicine Bow, Wyoming. They are not actual measurements
from Medicine Bow, Wyoming. The beam displacement calculations were made
for a frequency of 10 Hz and the propagation velocity profile, Eq. (3.2), described
in Chapters 4 and 5 of this thesis. Figure B.2 indicates that beam displacement
is negligible except for angles of incidence just under 90" (grazing angle less than
lo"). In the downwind direction we deal with very shallow grazing angles. How-
ever, the rays are refracted downward. In fact, the grazing angle for incident rays
at the ground is never less than 10" and increases with range. The results indi-
cate that beam displacement is relatively unimportant in the downwind direction
for low frequency sound. In the upwind direction rays can be incident at angles
less than 10". In this case, beam displacement may play a role. However, the
dominant feature in the upwind direction is the shadow zone.
'These properties were supplied by Dr. K. H. Stokoe, Civil Engineering Department, The University of Texas at Austin.
78

APPENDIX C
MEDUSA
In this appendix, we provide a general overview of MEDUSA. Our de-
scription is a summary of Chapter VI of the technical report by T. L. Foreman [23].
Additionally, we describe a typical MEDUSA run used in our investigation.
The software package MEDUSA is in fact a collection of FORTRAN pro-
grams. Figure C.l (Fig. 9 of Ref. 23) shows the overall organization of MEDUSA.
The boxes contain the names of the separate programs. Input required for each
program is indicated by arrows coming into the boxes and output by arrows leav-
ing the boxes. A short description of the input, the programs, and their output
is as follows.
RAYFAN solves the ray path equation and generates ray history records.
The records may be output in tabular form. RAYFAN requires the sound speed
profile, the source depth, the receiver depth, and bathymetry. The term bathyme-
try refers to the shape of an ocean bottom, a sloping bottom, for example. We
did not use this feature. It could be useful, however, in investigating the role
played by the topology of the WTS-4 site, for example, the atypical environment
of the microphone at 10 km in the May-June 1985 experiment.
ENVPLT plots sound speed profiles and bathymetry. In addition, the
sound speed profile and ocean bottom depth at each range can be plotted together.
.
79

BATHYMETRY SOUND
PROFILES SPEED
RECEIVER DEPTHS
BATHYMETRY PROFILES
SOUND SPEED
i
t T
THSPLT THRPLT RECEIVER SERPENT RANGES
ARRIVAL
PLOT v ANGLE LAUNCH
ANGLE PLOT RAYTREK 1 FREOUENCIES
ATTENUATION CAUSTIC
PATH PLOTS
PLOT O F CAUSTIC
EIGONY LOCATIONS BOTTOM LOSS TABLES
PLPLOT
1
PROPAGATION LOSS PLOTS
Figure C.l ORGANIZATION OF MEDUSA.
80

Five programs use the ray history records as input. RAYTREK generates
the ray plots. CAUSTIC plots the location of caustics. SERPENT locates the
eigenrays from the ray history records generated by RAYFAN. THSPLT and
THRPLT plot the launch angle and the arrival angle, respectively.
In Fig. C.1 we have retained the references to depth in the input. As
noted in Chapter 3, we translated depth to height above the ground. In most
cases the translation required a simple hand calculation. The single exception
is the propagation speed. In our investigation the propagation speed is input to
MEDUSA as a formula contained in a subroutine. In this instance, the translation
of depth to height was included in the subroutine.
After the input file is built, a typical MEDUSA run conducted during
our investigation proceeds in the following manner.
0 Ray plots. To get ray plots we ran RAYFAN for the desired launch angles
and then ran RAYTREK to obtain the plots. It was necessary to modify
the plotting routines so that ‘height’ is plotted instead of depth.
0 Caustic plots. Caustic plots were obtained in much the same way as ray
plots. However, RAYFAN had to be run with a large number of rays in
order to find as many caustics as possible. Again, the plotting routines
were modified to display ‘height’ instead of ‘depth.’
0 P L plots. To obtain P L plots it was necessary to run three programs. SER-
PENT was run to locate eigenrays, then PROPLOS computed propagation
loss, and finally, PLPLOT plotted the output of PROPLOS. It was not nec-
essary to modify the plotting routines of PROPLOS. However, a spherical
spreading curve was added for the purposes of this investigation. We note
here that although MEDUSA does not include caustic corrections in com-
81

82
puting the propagation loss, it does include the 7r/2 phase shift associated
with the passage of a ray through a caustic.

APPENDIX D
The Effect of Caustics on Sound Intensity
In the investigation of sound propagation from the WTS-4 wind turbine
we have, as a first approximation, assumed that caustics need not be accounted
for when calculating the P L curve. As we have seen, ignoring caustics has yielded
good results. However, caustics do occur in the sound field and it is appropriate
that a description of caustics be included in this thesis. Here, we give a qualitative
description of caustics and their effect on the sound field.
D.l The Formation of Caustics
A qualitative picture of what caustics are and how they are formed is
now provided. Consider a portion of a wavefront between two closely spaced rays
associated with the wavefront (see Fig. D.l). The two rays define a ray tube, the
cross-sectional area of which varies as the wave propagates. If the sound in the ray
tube does not leak out, the sound intensity I at any field point must be inversely
proportional to the ray tube area A. In terms of the focusing factor 1/10, where
Io is the source intensity, the proportionality is
83

ADJACENT RAYS 7
Figure D.l RAY TUBE FORMED BY CLOSELY SPACED RAYS.
where A, is the area of the ray tube at the source. If the rays are refracted in
such a way that they cross, the area A goes to zero, the focusing factor goes to
infinity, and the propagation loss becomes undefined. The envelope of crossings
of adjacent rays is called a caustic surface, or simply a caustic.
It is important to keep in mind that a caustic is not an aberrant physical
phenomenon, but simply the focusing of rays (in fact, an ordinary point focus
produced by a lens is a special case in which the caustic is a single point [33]).
On the other hand, it is apparent why caustics are a problem: the intensity of
sound at caustics clearly cannot go to infinity as predicted with simple ray theory.
Ray theory must therefore be modified (or abandoned) near caustics if the sound
intensity is to be calculated there.
Besides preventing (locally) the accurate calculation of propagation loss,
the rapid increase of sound intensity near a caustic violates a basic assumption of
ray theory: the amplitude of the sound wave should not vary drastically over a
wavelength. Thus a region exists near a caustic where ray theory is inapplicable.
However, caustic effects are of local importance only in the sense that away from
84

the caustic, simple ray theory is once again valid.' Consequently, even though
they occur in a sound field, caustics can be ignored, provided the receiver is not
near a caustic.
D.2 Airy Function
However, caustics do form. If caustics form and they cannot be ig-
nored, ray theory can still be salvaged by modifying its sound intensity calculation
scheme. That is, an approximate formula for the sound intensity exists which is
well behaved at the caustic, and which returns to the simple ray theory formula
away from the caustic. The solution is described qualitatively in the remainder
of this section (a rigorous derivation is beyond the scope of this thesis).
As an introduction to the approximate solution, we present a doctored
passage from Ref. 33. Phenomena that occur which cannot be accounted for with
ray theory are called di$raction phenomena, of which caustics are an example. In
Ref. 33 Landau and Lifshitz describe the problem of the diffraction of electromag-
netic waves caused by an opaque object. Nevertheless, the passage applies equally
well to diffraction of acoustic waves, and to emphasize the fact we have changed
a few phrases (italicized words) to make the passage applicable to acoustics.
The problem of the theory of diffraction consists in determining, for
given positions and shapes of the objects (and locations of the sound
sources), the distribution of the sound, that is, the acoustic field over
all space. The exact solution of this problem is possible only through
'Permanent phase change is an exception to this generalization. If a ray is tangent to a caustic, the signal associated with the ray undergoes a phase change [33]. This is a comparatively simple problem and, in fact, the program MEDUSA accounts for the phase change. The primary problem here is the correct calculation of intensity, which MEDUSA cannot provide at or near a caustic.
85

solution of the wave equation with suitable boundary conditions at
the surface of the body, these conditions being determined also by the
acoustical properties of the material. Such a solution usually presents
great mathematical difficulties.
However, there is an approximate method which for many cases is
a satisfactory solution of the problem of the distribution of sound
near the boundary between insonified region and shadow zone. This
method is applicable to cases of small deviation from geometricd
acoustics, i.e., when firstly, the dimensions of all bodies are large
compared with the wavelength . . . ; and secondly when there are only
small deviations of the sound waves from the directions of the rays
given by geometrical acoustics.
In the following paragraphs we comment on the terms insonified region and
shadow zone.
Using Huygen’s principle (the method referred to in the above quota-
tion), Landau and Lifshitz find that the intensity is proportional to the square
of the Airy function. Derivations more familiar to acousticians can be found in
acoustics textbooks [32,10]. The intensity near a caustic is given approximately
by the formula
l o c Ai2(q) ,
where 2k2 u3
.=-y(z) 7
Ai(q) is the Airy function, 77 is a nondimensional function of the radius of cur-
vature R, of the caustic, the wave number E , and the distance from the caustic
y. The explicit formula for the intensity is not our primary concern here. In
86

Figure D.2 P L O T OF THE AIRY FUNCTION (FROM REF. lo) .
fact, the formula varies somewhat depending on the method of derivation (see,
for example, Section 9-4 of Ref. 10). More important is the behavior of the Airy
function. Figure D.2 is a reproduction of a plot of the Airy function Ai(7) taken
from Ref. 10. Note that the Airy function is asymmetrical about 7 = 0 (the
position of the caustic). In the shadow zone (7 > 0 ) the Airy function goes to
zero exponentially, while in the insonified zone, (7 < -1) the Airy function is
oscillatory. The simple ray theory formula for intensity is recovered [34] well in-
side the insonified region. Use of the Airy function avoids the the catastrophe at
the caustic and provides a smooth variation of the intensity from the insonified
region to the shadow zone.
A qualitative understanding of the physics behind the Airy function may
be obtained from consideration of Fig. D.3. In this figure we have redrawn the
Airy function with a caustic surface and two rays which graze the surface (recall
the phase change associated with grazing or passing through the surface). Note
87

Figure D.3 FACE.
PLOT OF THE AIRY FUNCTION WITH ASSOCIATED RAYS NEAR A CAUSTIC SUR-
that the rays intersect near the caustic surface. Depending on the phase, the
sound associated with each ray can add either constructively or destructively.
Consequently, the intensity has an oscillatory behavior near the caustic surface
given by the Airy function.
In summary, our first approximation is to ignore caustics completely (ex-
cept for the phase change) and use simple ray theory to calculate intensity. If,
however, the receiver is near a caustic, the correction described above may be
used to obtain an accurate calculation of the propagation loss.
88

APPENDIX E
MID-FREQUENCY SOUND LEVELS .
In Chapter 5 we noted that Willshire’s 1984 experiment included a few
mid-frequency measurements. Here we present P L curves for two mid-frequency
components and include ray diagrams which demonstrate the effect of raising the
source height.
Figures E.l and E.2 show the propagation loss for 63 and 250 Hz. The
properties supplied to the input data file are the same as those described in
Chapters 4 and 5 . The exception is the source height, which is taken to be
120 m. The source is raised because, as we have stated in Chapter 2, the source
of the high frequency noise is considered to be located near the top of the turbine.
The 1984 measurements made by Willshire at the WTS-4 wind turbine
site show that the sound level drops off spherically for ranges up to 1200 m (in
contrast, the low frequency measurements are significantly above spherical spread-
ing). We see good agreement between ray theory predictions and Willshire’s data.
Note that ray theory predictions again include downrange channeling. However,
the sound channel begins much farther downrange than in the case for a source
located 40 m off the ground. Unfortunately, experimental data are not available
for ranges beyound 1200 m.
89

60 -
70 -
80 -
90-
0 2 4 6 8 10 12 14
RANGE - km Figure E.l PROPAGATION LOSS AT 63 Hz.
250 Hz
60 -
70 -
80 -
0 2 4 6 8 10 12 14
RANGE - km
Figure E.2 PROPAGATION LOSS AT 250 HZ.
90
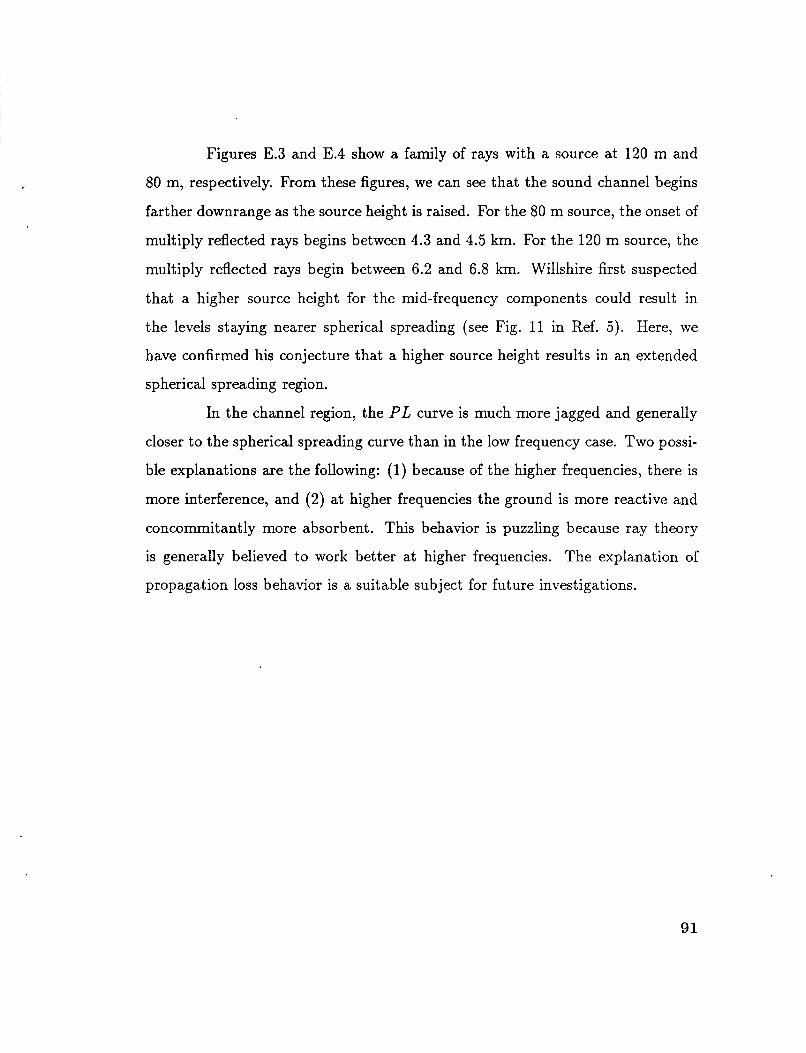
Figures E.3 and E.4 show a family of rays with a source at 120 m and
80 m, respectively. From these figures, we can see that the sound channel begins
farther downrange as the source height is raised. For the 80 m source, the onset of
multiply reflected rays begins between 4.3 and 4.5 km. For the 120 m source, the
multiply reflected rays begin between 6.2 and 6.8 km. Willshire first suspected
that a higher source height for the mid-frequency components could result in
the levels staying nearer spherical spreading (see Fig. 11 in Ref. 5 ) . Here, we
have confirmed his conjecture that a higher source height results in an extended
spherical spreading region.
In the channel region, the P L curve is much more jagged and generally
closer to the spherical spreading curve than in the low frequency case. Two possi-
ble explanations are the following: (1) because of the higher frequencies, there is
more interference, and (2) at higher frequencies the ground is more reactive and
concomitantly more absorbent. This behavior is puzzling because ray theory
is generally believed to work better at higher frequencies. The explanation of
propagation loss behavior is a suitable subject for future investigations.
91

RANGE - km Figure E.3 FAMILY OF RAYS WITH SOURCE HEIGHT 120 M .
RANGE - km Figure E.4 FAMILY OF RAYS WITH SOURCE HEIGHT 80 M.
92

REFERENCES
[l] P. M. Moretti and L. V. Divone, “Modern windmills,” Scientific American 254, 110-118 (1986).
[2] H. H. Hubbard, F. W. Grosveld, and K. P. Shepherd, “Noise characteristics of large wind turbine generators,” Noise Control Engineering Journal 21( l), 2.1-29 (1983).
131 N. D. Kelley, “Acoustic noise production by the DOE/NASA MOD-1 wind turbine,” presented at Wind Turbine Dynamics Conference, Cleveland, Ohio, NASA Conference Publication 2185, 1981.
[4] J. E. Piercy, T. F. Embleton, and L. C. Suthetland, “Review of noise prop- agation in the atmosphere,” J. Acoust. SOC. Am. 61, 1403-1418 (1977).
[5] W. L. Willshire, “Long range downwind propagation of low-frequency sound,” NASA TM 86409, April 1985.
[6] I. P. Chunchuzov, “Review of noise propagation in the atmosphere,” J. Acoust. SOC. A m . 58, 1403-1418 (1985).
[7] W. E. Zorumski and W. L. Willshire, “Propagation of normal acoustic modes in an atmospheric boundary layer,” J. Acoust. SOC. A m . 80, S19 (A) (1986).
[SI F. D. Tappert, “The parabolic approximation method,” Chapter 3 in Wave Propagation and Underwater Acoustics, edited by J. B. Keller and J. S. Papadakis (Springer-Verlag, New York, 1977), 224-287.
[9] M. J. White and K. E. Gilbert, “Application of the parabolic wave equation to atmospheric sound propagation over a locally reacting ground surface,” J. Acoust. SOC. A m . 80, S20(A) (1986).
[lo] A. D. Pierce, Acoustics (McGraw-Hill Book Company Inc., New York, 1981).
[ll] M. E. Delany, “Sound propagation in the atmosphere: a historical review,” Acustica 38, 201-223 (1977).
[12] E. H. Brown and F. F. Hall, Jr., “Advances in atmospheric acoustics,’’ Re- view of Geophysics and Space Physics 16, 47-110 (1978).
93

[13] R. B. Lindsay, Mechanical Radiation (McGraw-Hill Book Co., Inc., New York, 1960).
1141 L. E. Kinsler, A. R. Frey, A. B. Coppens, and J. V. Sanders, Fundamentals of Acoustics (John Wiley & Sons, New York, 1982).
[15] I. Rudnick, “Propagation of sound in air,” Handbook of Noise Control, edited by C. M. Harris, (McGraw-Hill Book Co., New York, 1957), pp. 3-1 to 3-17.
[16] K. P. Shepherd and H. H. Hubbard, “Measurements and observations of noise from a 4.2 megawatt (WTS-4) wind turbine,” NASA Contractor Report 166124 (May 1983).
[17] A. Miller, Meterorology, (Charles E. Merrill Publishing Company, Colum- bus, Ohio, 1976).
[18] M. E. Delaney and E. N. Bazley, “Acoustical properties of fibrous absorbent
[19] C. I. Chessel, “Propagation of noise along an impedance boundary,”
materials,” Appl. Acoust. 3, 105-116 (1970).
J. Acoust. SOC. Am. 62, 825-834 (1977).
[20] D. G. Stephens, K. P. Shepherd, H. H. Hubbard, and F. W. Grosveld, “Guide to the evaluation of human exposure to noise large wind turbines,” NASA TM 83288 (March 1982).
[21] S. A. L. Glegg, “Noise from wind turbines,” Paper 53-6, in the Proceedings of the 12th International Congress of Acoustics, 24-31 July 1986, Volume 111.
[22] J. Lighthill, Waves in Fluids (Cambridge University Press, New York, 1980).
[23] T. L. Foreman, “Ray modeling methods for range dependent ocean environ- ments,” Applied Research Laboratories Technical Report No. 83-41 (ARL- TR-83-41) Applied Research Laboratories, The University of Texas at Austin (1983) (ADA-137202).
[24] W. L. Willshire, Jr., “Long-range downwind propagation of low-frequency noise,” J . Acoust. SOC. Am. 77, Sl(A) (1985).
[25] L. D. Landau, and E. M. Lifshitz, Fluids Mechanics (Pergamon Press, Ox- ford, 1959).
[26] R. J. Urick, Principles of Underwater Sound (McGraw-Hill Book Co., Inc., St. Louis, 1975).
94

[27] H. H. Hubbard, K. E. Shepherd, and W. L. Willshire, “Results of simulta- neous acoustic measurements around a large horizontal axis wind turbine,” J. Acoust. SOC. Am. 80, S28(A) (1986).
[28] K. U. Ingard, “Review on the influence of meteorlogical conditions on sound propagation,” in Proceedings of the Fourth Annual Noise Abatement Sym- posium (publisher unknown, 1955), 11-25.
[29] T. F. Embleton, J. E. Piercy, and N. Olson, “Outdoor sound propagation over ground of finite impedance,” J. Acoust. SOC. Am. 59, 825-834 (1977).
[30] C. T. Tindle and G. E. J. Bold, “Improved ray calculations in shallow water,”
[31] E. K. Westwood and C. T. Tindle, “Shallow Water Time Series Simulation Using Ray Theory,” J. Acoust. SOC. Am. 81, 1752-1761 (1987).
[32] L. M. Brekhovskikh and Yu. Lysanov, Fundamentals of Ocean Acoustics (Springer-Verlag, Berlin, 1982).
[33] L. D. Landau and E. M. Lifshitz, The Classical Theory of Fields (Pergamon Press, Oxford, 1975).
[34] R. Pitre, “On the application of horizontal ray theory to acoustic propagation in the ocean waveguide,” Applied Research Laboratories Technical Report No. 84-1 (ARL-TR-84-1), Applied Research Laboratories, The University of Texas at Austin (1984) (ADA 143 944).
J. Acoust. SOC. Am. 70, 813-819 (1981).
J
95

1. Report No. 2. Government Acceasion No. NASA CR-178367
5. Report Date
6. Performing Organization Code
4. Title and Subtitle
APPLICATION OF RAY THEORY TO PROPAGATION OF LOW- FREQUENCY NOISE FROM WIND TURBINES
3. Recipient’s Catalog No.
8. Performing Organization Report No.
James A. Hawkins 9. Performing Organization Name and Address Applied Research Laboratories The University of Texas at Austin P. 0. Box 8029
in- TX 78721 - 81379 12. Sponsoring Agency Name and Address National Aeronautics and Space Administration Langley Research Center Hampton, VA 23665-5225
ARL-TR-87-40
505-61-11-02 10. Work Unit No.
11. Contract or Grant No.
NAS1-17802 13. Type of Report and Period Covered
Contractor Report 14. Sponsoring Agency Code
16. Abstract
Ray theory has been used to explain data from two experiments, done in 1984 and 1985, on propagation of low frequency sound generated by the WTS-4 wind turbine located in Medicine Bow, Wyoming. Emphasis is on downwind data, but some upwind measurements taken during the 1985 experiment are also considered. In this report, general ray theory for a moving medium is reviewed and the ray equations are obtained; Restrictions are introduced that simplify the equations and allow the use of a ray theory program MEDUSA. The results are then compared to the data. In particular, the XEDUSA computed propagation loss curve is compared to the measurements. Good qualitative agreement is obtained with downwind data from the 1984 experiment. The results indicate that the downwind sound field is that of a near-ground, sound channel. Although more scatter is seen in the 1985 data, agreement between theory and the data is also good. In particular, the position and magnitude of the jump in the sound levels associated with the beginning of the sound channel is correctly predicted. The theoretical explanation of the upwind data is less successful. Ray theory calculations indicate the formation of a shadow zone that, in fact, does not occur. While no sharp shadow zone is apparent in the data, the general expectation (based on ray theory) that the sound levels should be much reduced upwind is confirmed by the data.
19. Security Classif.(of this report)
Unclassified
17. Key Words (Suggested by Authors(s)) Propagation speed gradient Propagation loss Atmospheric acoustics WTS-4 wind turbine Ray equations MEDUSA
20. Security Classif.(of this page) 21. No. of Pages 22. Price Unclassified 105 A06
18. Distribution Statement
Unclassified - Unlimited
Subject Category 71
For sale by the National Technical Information Service, Springfield, Virginia 22161 NASA Langley Form 63 (June 1985)