application of poly-mor foam as insulation for single
TRANSCRIPT

University of Alberta
Department of Civil &
Environmental Engineering
Masonry Chair Report No. 1042011
APPLICATION OF POLY-MOR FOAM
AS INSULATION FOR SINGLE WYTHE
MASONRY WALLS
M. Ross
Y. Korany
A. Lohonyai
November 2011

ii
Copyright © 2011 by Y. Korany. All rights reserved.
No part of this report may be reproduced, in any form or by any means, without prior written
permission.

iii
Table of Contents Acknowledgments................................................................................................................................................................... 1
EXECUTIVE SUMMARY ...................................................................................................................................... 2
1.0 INTRODUCTION ......................................................................................................................................... 4
2.0 METHODOLOGY ......................................................................................................................................... 4 2.1 APPLICATION OF POLY-MOR POLYURETHANE FOAM ..................................................................................... 5 2.2 DETERMINING DENSITY .............................................................................................................................................. 9 2.3 DETERMINING THERMAL CONDUCTIVITY ............................................................................................................. 9 2.4 DETERMINING THERMAL RESISTANCE.................................................................................................................. 11
2.4.1 Thermal Resistance of a Material ..................................................................................................................... 11 2.4.2 Thermal Resistance of an Assembly ............................................................................................................... 11
3.0 RESULTS AND DISCUSSION ................................................................................................................. 17 3.1 DENSITY ...................................................................................................................................................................... 17 3.2 THERMAL CONDUCTIVITY ........................................................................................................................................ 19 3.3 THERMAL RESISTANCE ............................................................................................................................................... 20
3.3.1POLY-MOR Polyurethane Foam Insulation ................................................................................................. 20 3.3.2 Single-Wythe Concrete Masonry ...................................................................................................................... 25
4.0 CONCLUSIONS AND RECOMMENDATIONS ................................................................................... 31
5.0 REFERENCES ................................................................................................................................................. 34
APPENDIX A: UNIT CONVERSIONS ........................................................................................................... 36
APPENDIX B: HAND CALCULATIONS ....................................................................................................... 37

1
Acknowledgments
Funding for this investigation was provided through an Engage Grant from the
Natural Sciences and Engineering Research Council of Canada (NSERC). The authors
wish to thank Mr. Mark Ackerman, a Faculty Services Officer with the Department of
Mechanical Engineering at the University of Alberta, for loaning the thermal conductivity
test set-up used in this investigation. The assistance offered by Mr. Rizaldy Mariano, a
Construction Technician with the Department of Civil and Environmental Engineering at
the University of Alberta, in facilitating the density measurement test is highly
appreciated. The construction of the masonry wallettes and the application of POLY-
MOR insulating foam took place at the I.F. Morrison Structures Laboratory at the
University of Alberta.

2
Executive Summary
Unfinished single-wythe concrete masonry walls are common among warehouse
and industrial buildings because they are relatively inexpensive to construct while
simultaneously providing security and durability due to superior resistance to impact,
fire, weather, insects, and corrosion. However, single-wythe masonry provides low
thermal resistance (R-value) and can be a significant source of heat loss. Masonry walls
meeting certain criteria were exempted from the insulation requirements of the 1997
Model National Energy Code of Canada for Buildings (MNECB). Under the 2011 National
Energy Code of Canada for Buildings (NECB), masonry walls will no longer be exempted.
Further, the insulation requirements have been increased significantly in the new Code.
These new Code requirements, concerns regarding global climate change, and rising
energy prices have given rise to the need for inexpensive and efficient insulation options
for building envelope assemblies, especially single-wythe masonry.
A pilot investigation was conducted involving three different application
procedures and two different material densities applied at three different thicknesses. The
goal was to evaluate the effectiveness of POLY-MOR closed-cell polyurethane foam as an
insulating material and determine the best possible insulation procedure. Seven masonry
wall mock-ups were built at the University of Alberta’s I.F. Morrison Structural
Engineering Laboratory. POLY-MOR then performed fourteen different test applications
of their closed-cell polyurethane foam as an insulating material. High and low-density
foams were used in three different procedures: spray-applied, filled formwork, and core
grouting. For the spray applied and filled formwork procedures, 25mm, 51mm, and 76mm
(1 in, 2 in, and 3 in) thick applications were tested. The actual thickness of application
varied considerably in the spray applied procedure, but was uniform in the filled
formwork procedure.
Tests were performed according to ASTM standards to determine the density and
thermal conductivity of the foam in each of the fourteen specimens. The lightest foam,
weighing approximately 40 kg/m3 (2.50 lb/ft3), was obtained from the low-density filled
formwork procedure. The heaviest foam weighed approximately 104 kg/m3 (6.49 lb/ft3)
and came from the high-density spray applied procedure. The low-density filled
formwork procedure also yielded the most favourable thermal properties, with a thermal
conductivity of just 0.0252 W/m∙K. This corresponds to a thermal resistance of RSI-0.0397
per millimetre (R-5.72 per inch). The high-density foam of the filled formwork procedure
was the next best insulation, with a thermal resistance of RSI-0.0333 per millimetre (R-
4.80 per inch). This was followed closely by the low-density spray applied foam at RSI-
0.0312 per millimetre (R-4.50 per inch).

3
Using the results of the ASTM thermal conductivity tests, two-dimensional heat
flow simulations were carried out using the software THERM. It was found that filling the
cores is a very ineffective method of insulating masonry walls because the webs of the
concrete blocks act as thermal bridges. Using the low-density filled formwork procedure,
minimum thicknesses of 114mm (4½ in) for above ground walls and 83mm (3¼ in) for
below ground walls are necessary for a 200mm block wall to meet the requirements of the
NECB for Edmonton and other regions in Zone 7A.
The low-density filled formwork procedure appears to be the most viable
insulation option. In addition to superior thermal resistance that is comparable with
some of the best insulations available on the market today, the procedure also produces a
uniform thickness and the lightest weight foam. Maximizing the thermal resistance has
the effect of minimizing the amount of useable floor space consumed by insulation. By
producing a uniform thickness, waste is minimized and the quality of workmanship is less
dependent on the experience level of the applicator. Finally, minimizing the weight of the
foam reduces the material costs and the weight of insulation added to the structure. The
only noteworthy drawback appears to be the labour and material costs associated with
the formwork. It is believed that this may be overcome by either leaving the forms in
place or by making the forms modular and easily reused.
Since the foam may require finishing with fire resistant materials, it is possible that
forms made of gypsum wallboard could be left in place after insulating and then painted
by others. If modular formwork is pursued, it would have to be durable and easy to
assemble, disassemble, and transport. A “non-stick” coating to prevent adhesion between
the forms and the insulation would be essential to minimizing costs associated with
reusable formwork. Finally, exterior application of the insulation may be the most
economical method of making single-wythe masonry walls Code compliant. The masonry
on the interior side of the insulation is the best way to utilize its thermal mass.
Additionally, no additional fire protection is necessary because masonry inherently
possesses exceptional fire resistance. The uniform surface produced by the filled
formwork procedure could easily be finished with EIFS (“acrylic stucco”) base and finish
coats.
POLY-MOR closed-cell polyurethane foam appears to possess immense potential
as insulating material, not only for walls, but also for roofs, slabs on ground, and
underground pipes. While it was demonstrated that there are some insulation products
with marginally superior thermal resistance already available on the market, POLY-MOR
polyurethane foam could still be a competitive insulation if other properties of the foam
are also exploited.

4
APPLICATION OF POLY-MOR FOAM AS INSULATION
FOR SINGLE WYTHE MASONRY WALLS
1.0 Introduction
Unfinished single-wythe concrete masonry walls are commonly used in warehouse
and industrial settings to enclose the building. Single-wythe concrete masonry walls are
relatively inexpensive to construct while simultaneously providing security and durability
due to superior resistance to impact, fire, weather, insects, and corrosion. The main
drawback of single-wythe walls is that they provide little thermal resistance. Under the
recently superseded Model National Energy Code of Canada for Buildings (MNECB),
single-wythe masonry walls meeting certain criteria were exempted from being insulated
(NRCC 1997). The new National Energy Code of Canada for Buildings (NECB) has
significantly stricter energy efficiency guidelines for building envelope design and
provides no exemption for masonry walls (NRCC 2011). This, in addition to growing
concerns regarding anthropogenic effects on the environment and increasing energy
prices, has given rise to the need for an inexpensive and efficient option to insulate single-
wythe masonry walls. The purpose of this investigation was to evaluate the effectiveness
of POLY-MOR polyurethane foam as an insulating material and determine the best
procedure for applying the foam.
Three different application methods were investigated using two different foam
densities and three different thicknesses. POLY-MOR foam was applied to unfinished
single-wythe concrete masonry walls. The polyurethane foam was applied by spraying,
formwork filling, or core grouting. Tests were conducted according to ASTM standards to
determine the density and thermal conductivity of the foam in each application. A two-
dimensional heat flow simulation was then used to determine the effective RSI-value of
masonry walls with the different insulation configurations. Although the test specimens
were concrete block walls, the results of the investigation could be relevant for insulating
slabs, roofs, and other wall constructions.
2.0 Methodology
Seven concrete block masonry wall specimens were constructed by journeyman
masons at the University of Alberta’s I.F. Morrison Structural Engineering Laboratory in
Edmonton. The walls were built using standard 200mm normal weight 20MPa concrete
block masonry units and standard 10mm tooled mortar joints. The blocks were laid in a
running bond pattern, three units wide by five units high (1200mm x 1000mm). The cores
of the wall specimens were left un-grouted. Figure 1 shows the seven wall specimens
shortly after construction, prior to the application of any foam.

5
Figure 1 – Seven concrete masonry wall specimens
2.1 Application of POLY-MOR Polyurethane Foam
Professionals from POLY-MOR Canada Inc. insulated the concrete masonry wall
specimens using fourteen variations on the application of closed-cell polyurethane foam.
These variations are summarized below in Table 1.
Table 1 – Schedule of Variations of POLY-MOR Foam Insulation Application
Designation Foam Procedure Thickness
LD-S-1 Low-density Spray applied 25mm (1 in)
LD-S-2 Low-density Spray applied 51mm (2 in)
LD-S-3 Low-density Spray applied 76mm (3 in)
HD-C-1 High-density Filled formwork 25mm (1 in)
HD-C-2 High-density Filled formwork 51mm (2 in)
HD-C-3 High-density Filled formwork 76mm (3 in)
LD-S-1 Low-density Spray applied 25mm (1 in)
LD-S-2 Low-density Spray applied 51mm (2 in)
LD-S-3 Low-density Spray applied 76mm (3 in)
HD-C-1 High-density Filled formwork 25mm (1 in)
HD-C-2 High-density Filled formwork 51mm (2 in)
HD-C-3 High-density Filled formwork 76mm (3 in)
LD-G Low-density Grouting n/a
HD-G High-density Grouting n/a

6
The polyurethane foam was applied using three different application procedures:
spray-applied, filled formwork, and grouting. The spray application was performed using
a nozzle at a distance of approximately one metre (3’-3”) from the face of the wall (Figure
2). Since there is a delay between when the product comes in contact with the wall and
the when the foam fully expands, the applicator must judge when enough material has
been deposited to achieve the desired thickness. Figure 3 shows that the actual thickness
of the spray applied foam varied considerably over the surface of the wall. The low-
density spray-applied foam had a rough, bubbly surface appearance and texture (Figure
4), while the surface of the high-density spray applied foam was smoother in texture and
looked somewhat runny (Figure 5).
Figure 2 – Spray application of POLY-MOR in progress.
The filled formwork procedure was carried out using temporary forms to
accommodate 25mm, 51mm, and 76mm (1 in, 2 in, and 3 in) thicknesses of foam on the
surface of the wall. The forms were built of 19mm (¾ in) particleboard. A plastic sheet
taped to the inside of the form prevented the foam from adhering to the particleboard,
but had to be replaced with each use of the form. Polyurethane foam was then injected
into the formwork using an appropriate attachment at the end of the nozzle (Figure 6).
Clamps placed around the perimeter held the form in place under the pressure of the
expanding foam. The foam hardened very quickly and the formwork was removed within
five minutes of application. The formwork ensured a uniform thickness of application and
created a smooth and even surface appearance. The grouting procedure was similar,
except that foam was injected in the cores of the hollow blocks (Figure 7).

7
Figure 3 – Variation in the actual thickness of low-density (left) and high-density (right)
spray-applied foam.
Figure 4 – Rough, uneven surface appearance of the low-density spray-applied foam

8
Figure 5 – Smooth, uneven surface appearance of the high-density spray-applied foam
Figure 6 – Filled formwork foaming procedure in progress.
Figure 7 – Wall specimen with foam grouted cores.

9
2.2 Determining Density
The density of the foam was calculated in order to investigate the effect of
application procedure on density and the effect of density on thermal conductivity. Three
samples of the polyurethane foam were obtained from each of the fourteen application
procedures. The density of each sample was determined in accordance with ASTM D792-
08, “Standard Test Methods for Density and Specific Gravity (Relative Density) of Plastics
by Displacement.”
To determine the density, a representative sample is first weighed in air (a). The
sample is then submerged in demineralized water at a temperature of 23.0oC (73.4oF). For
plastics that are less dense than water (like polyurethane foam) it is necessary to attach a
metallic sinker. The sinker used in this investigation weighed 2.27 kg (5.0 lb). The fully
submerged sample, along with the sinker and container, are weighed in the water (b).
Finally, the sinker and container are weighed in the water without the sample (w). The
weight of the submerged sample alone is the difference between b and w, and is directly
proportional to the volume of the sample. After correcting for temperature (if required)1,
the specific gravity of the sample is calculated using the following formula:
( ) (1)
The bulk density of the sample can then be calculated by multiplying the specific
gravity by 997.5 kg/m3 (62.27 lb/ft3), which is the density of water at 23oC (73.4oF).
2.3 Determining Thermal Conductivity
The thermal conductivity of the polyurethane foam samples was determined in
accordance with ASTM D5930-09, “Standard Test Method for Thermal Conductivity of
Plastics by Means of a Transient Line-Source Technique”. Figure 8 shows the test
apparatus during calibration.
In Figure 8, the data logger is identified by the letter A, the constant power source
is identified by the letter B, letter C designates the probe inserted into a piece of DOW
STYROFOAMTM. The STYROFOAMTM has a known thermal conductivity of 0.0288
W/m∙K (0.0167 BTU/hr∙ft∙oF), and is used to calibrate the probe (DOW Building Solutions
2006).
To determine the thermal conductivity of the test specimens, a 229mm (9 in)
probe was inserted into the foam of each wall mock-up. To obtain a representative
sample of the conductivity, tests were conducted in four separate locations on each of the
1 If the water temperature differs from 23.0
oC, a correction procedure given in ASTM D792-08 is necessary.

10
Figure 8 – Thermal conductivity test set-up during calibration.
fourteen mock-ups and the results were averaged. The probe was connected to a constant
power source and a data logger. The power released along the length of the probe caused
an increase in temperature, which was then measured by a series of thermocouples along
the length of the probe.
Each test took approximately 15 minutes for the temperature inside the sample to
stabilize, after which the temperature was plotted against the natural logarithm of the
time of the test. The slope of the linear portion of the resulting graph was then used in
the following formula to determine the thermal conductivity of the sample:
(2)
( ) (3)
In Equation (2), is the thermal conductivity of the sample (W/m∙K), Q is the heat
output per unit length (W/m), Slope is the slope of the temperature – log time graph
(measured in K), and C is the probe constant. Slope is calculated from Equation (3), where
and are the temperatures at two different times, and , respectively. The probe
constant C is determined by calibration test of a sample with known thermal
conductivity. In this investigation, the probe was calibrated between each application
method tested, and the calibration value C varied between 0.85 and 0.90.

11
2.4 Determining Thermal Resistance
2.4.1 Thermal Resistance of a Material
The thermal resistance of a material is calculated according to Equation (4) - by
dividing the thickness of the layer ( ) by the thermal conductivity of the material ( ). The
thickness of the layer is measured in the direction of heat flow. For walls, floors, roofs,
and other plate-like elements, the direction of heat flow is generally perpendicular to the
surface.
(4)
2.4.2 Thermal Resistance of an Assembly
Equation (4) is used to determine the thermal resistance of material. However,
within most wall constructions, layers are not made entirely of one material. Examples
include timber frame stud walls and hollow masonry blocks. Layers built of different
materials in parallel may have a significant effect on the overall thermal resistance
because heat will flow more readily through the more conductive material. There are two
approximate methods for estimating heat flow by hand calculations: the Parallel Path
method and the Isothermal Planes method. These methods are described below and real
examples have been provided in Appendix B: Hand Calculations.
The Parallel Path method is the simpler of the two and it assumes that heat flows
strictly in one direction. This assumption is valid if parallel materials have the same
resistance, but results in overestimating the overall thermal resistance when this criterion
is not satisfied. However, the accuracy of the Parallel Path method is often sufficient,
particularly in the case of typical timber frame construction. Mathematically, the parallel
path method is described by Equations (5) to (8):
(5)
∑ (6)
[∑
]
(7)
∑ (8)

12
Where
= total cross-sectional area of the assembly, perpendicular to the flow of heat
= cross-sectional area of the ith parallel path, perpendicular to the flow of heat
= length of the jth element of the ith parallel path, parallel to the flow of heat
= overall thermal resistance of the materials (excludes surface air films)
= overall thermal resistance of the assembly, including the surface air films
= sum of all resistances along the ith parallel path
= thermal resistance of the jth element of the ith parallel path
= thermal conductivity of the jth element of the ith parallel path
The Isothermal Planes method implies that heat will flow preferentially through
elements with lesser resistance and yields a lower-bound estimate of the thermal
resistance (Enermodal Engineering Ltd 1996). The Isothermal Planes method yields
accurate estimates when considering hollow concrete masonry (Van Geem 1985). The
Isothermal Planes method is described mathematically by Equations (9) to (12):
(9)
[∑
]
(10)
∑ (11)
∑ (12)
Where
= total cross-sectional area of the assembly, perpendicular to the flow of heat
= cross-sectional area of the jth parallel path in the ith layer
= length of the ith layer, parallel to the direction of heat flow
= overall thermal resistance of the materials (excludes surface air films)
= overall thermal resistance of the assembly, including the surface air films
= effective thermal resistance of the ith layer
= thermal resistance of the jth parallel path of the ith layer
= thermal conductivity of the jth parallel path of the ith layer
For greater accuracy, it is necessary to use two-dimensional heat flow equations.
Computers are better suited to solving these equations. The hand calculation methods
described above were used to estimate the thermal resistance in order to provide a check
value to ensure that the results of the computer simulations were correct. In this
investigation, the computer program THERM 6.3 was selected to perform the required

13
heat transfer calculations. THERM is freely available to download from
http://windows.lbl.gov/software/therm/therm.html. THERM can provide overall or
partial heat transfer coefficient U-values of an assembly in addition to several possible
visual outputs, which include isotherms, coloured infrared, heat flux vectors, and
constant heat flux contours. Since the program uses the finite element method to
simulate steady-state heat transfer in two dimensions (Finlayson et al. 1998), THERM
meets the requirements of the Model National Energy Code of Canada for Buildings
(MNECB) and NECB for providing an evaluation method that is deemed equivalent to
performing ASTM C 1363 laboratory tests (NRCC 1997, 2011).
Figure 9 depicts the typical geometry of the 190mm concrete masonry units used
to build the test specimens. This was the geometry used in THERM, with the inclusion of
half the head joint on either end. On this type of block, only the flange would be bedded
with mortar, so the head joint would be about 10mm thick by 50mm deep on each flange
(100mm total depth of mortar, with 90mm air gap in between).
Figure 9 – Measured geometry of the blocks used in the test specimens.
Figure 10 depicts the simplified geometry that was used to perform the hand
calculations. The cross-sectional area of the block is essentially unchanged, though the
material has been redistributed slightly to simplify the calculations.
The bed joint was modeled separately, since THERM does not model in three-
dimensions. The flared face shell provides about 46mm to be bedded with mortar;
however, some mortar is typically squeezed out when the block is laid down. The excess
mortar is removed from the exterior, but within the block the mortar may extend several
millimetres. It is assumed herein that the bed joint is 10mm thick by 50mm deep on each
face (100mm total depth of mortar, with 90mm air gap in between). Figure 11 and Figure

14
Figure 10 – Simplified geometry used for hand calculations
12 depict the geometry of the bed joint modeled in THERM for blocks with unfilled and
foam filled cores. In the case of the foam-filled blocks, it is assumed that the area of the
foam is exactly equal to the opening in the block, which is narrower than the dimensions
of the cores in Figure 9 because the webs and face shells are flared 10mm. This
assumption is conservative because the foam can be expected to expand and at least
partially fill the 10mm gap between successive courses, but the extent of this expansion is
unknown and believed unlikely to be 100%. The overall thermal resistance of the wall was
calculated by combining the results of the two analyses using the parallel path method.
Since the difference in thermal resistance offered by the block and the bed joint is small
and the bed joints account for only 5% of the total area, it is adequate to use this
approximation in favour of three-dimensional modeling.
Figure 11 – Bed joint geometry for blocks with unfilled cores

15
Figure 12 – Bed joint geometry for blocks with foam-filled cores.
Part 2 of both MNECB 1997 and NECB 2011 requires that heat flow tests on building
assemblies be carried out setting the temperature of the warm side to 35oC (95oF) and the
temperature of the cool side to 13oC (55.4oF) (NRCC 1997, 2011). These temperatures were
used in the THERM simulations. Also in accordance with Part 2 of the MNECB, the air
films and air cavities were modeled using the effective thermal resistance values provided
in Appendix C of the MNECB (NRCC 1997). Namely, these values are RSI-0.03 and 0.12 (R-
0.17 and 0.68) for the exterior and interior surface films, respectively, and RSI-0.18 (R-1.02)
for non-reflective, unventilated air spaces greater than 40mm (19/16 in) (NRCC 1997). The
same values are also given in ASHRAE (2009).
Since THERM uses thermal conductivity as an input, the air spaces were modeled
as a solid element with an apparent thermal conductivity that would yield an RSI-value of
0.18 for the length of the air space. Air films are included automatically in THERM, but
rather than forcing THERM to model their effective resistances identically to the RSI-
values of 0.03 and 0.12, their convection coefficients were set to 99 999 W/m2∙K,
effectively giving each film an RSI-value of 0.00001 m2∙K/W. By removing the effects of
the air films, the simulations from THERM were in essence providing thermal
characteristics for only the materials, and the overall assembly properties could be
determined by simply adding the RSI-values for the exterior and interior surface films.
The thermal conductivity can vary significantly depending on the overall density
and the aggregates used in the mix. Reported below in Table 2 are thermal conductivity
values published in NRCC (1997), ACI Guide 122 (2002), and ASHRAE (2009).

16
Table 2 – Thermal Conductivity of Concrete and Mortar
(NRCC 1997, ACI-122 2002, ASHRAE 2009)
Material Density (kg/m3)
Thermal Conductivity (W/m∙K)
Source
Mortar
N/A 1.1 NRCC 1997
1920 1.40
ASHRAE 2009 1600 0.97
1280 0.65
1920 1.39
ACI-122 2002
1760 1.16
1600 0.966
1440 0.793
1280 0.644
Concrete, sand & gravel aggregate 2400 2.3 NRCC 1997
Concrete, sand & gravel aggregate (higher quartz and quartzite content results in higher conductivity)
2400 1.4 to 2.9
ASHRAE 2009 2240 1.3 to 2.6
2080 1.0 to 1.9
Concrete, unprotected, sand & gravel aggregate <50% quartz & quartzite
2400 2.83
ACI-122 2002 2240 2.11
2080 1.54
Concrete, unprotected, sand & gravel aggregate >50% quartz & quartzite
2400 3.17
ACI-122 2002 2240 2.38
2080 1.70
Concrete, unprotected, limestone aggregate
2400 1.98
ACI-122 2002
2240 1.69
2080 1.44
1920 1.20
1760 1.01
Though the thermal conductivity of concrete can vary considerably, the thermal
resistance contribution of the concrete is only important in walls with little or no
insulation. For walls with a continuous layer of insulation, the other components typically
offer very little additional thermal resistance, so it is of little value to perform multiple
simulations in order to investigate the effect of the concrete’s thermal conductivity.
Instead, values were chosen based on what the authors have judged to be
representative of typical masonry construction. The thermal conductivity of the mortar
was taken to be 1.1 W/m∙K, which is the value given in Appendix C of the MNECB and is

17
representative of a typical mortar with oven-dry density on the order of 1700 kg/m3 (106
lb/ft3) (NRCC 1997, ACI-122 2002). The concrete used to manufacture the masonry units
was assumed to have an oven-dry density of 2180 kg/m3 (131 lb/ft3) and made with
limestone aggregates. Further, the concrete was assumed to be unprotected from rain,
which is often the case. By linear interpolation, this yields an expected thermal
conductivity of 1.61 W/m∙K.
3.0 Results and Discussion
3.1 Density
Three samples were obtained from each of the fourteen insulated wall specimens
and tested in accordance with ASTM D792-08. The results are presented graphically in
Figure 13, and summarized in Table 3.
Figure 13 – Density versus thickness or application for different foaming procedures
0
10
20
30
40
50
60
70
80
90
100
110
120
0 25 51 76
Den
sity
(k
g/m
3 )
Thickness of Application (mm)
Low Density - SprayApplied
High Density - SprayApplied
Low Density - FilledFormwork
High Density - FilledFormwork
Low Density - Grouted
High Density -Grouted

18
Table 3 – Average Density of Foam by Application
Sample Density (kg/m3)
Density (lb/ft3) COV2 Sample
Density (kg/m3)
Density (lb/ft3) COV2
HD-S-1 100.05 6.25 2.1% LD-S-1 67.39 4.21 3.9%
HD-S-2 107.44 6.71 2.1% LD-S-2 50.90 3.18 6.5%
HD-S-3 104.61 6.53 13.5% LD-S-3 50.24 3.14 6.4%
HD-C-1 67.67 4.22 6.3% LD-C-1 38.79 2.42 4.8%
HD-C-2 67.66 4.22 12.5% LD-C-2 38.99 2.43 2.3%
HD-C-3 82.12 5.13 7.7% LD-C-3 42.45 2.65 2.3%
HD-G 57.11 3.57 7.6% LD-G 53.60 3.35 5.9%
There does not appear to be a strong trend between thickness of application and
the density of the foam. It is readily observed that from 25mm to 51mm, the high-density
spray applied foam increased in density by about 7%. However, the variation in the
density of the 76mm samples was considerable, and the average decreased slightly from
the density at 51mm. The low-density foam exhibited decreasing density with increasing
thickness in the spray applied foam, while the density increased slightly when the filled
formwork procedure was used. It was also noted that the high-density foam was
consistently 1.5 to 2.1 times denser than the low-density foam using either the spray
applied or filled formwork procedures, while the difference was a factor of about 1.07
using the grouting procedure.
Since the thickness appears to have only a small effect on the density of the foam,
it would appear adequate for estimation purposes to assume constant values of density
for the different application procedures. The recommended values are presented in Table
4. However, thicknesses of application significantly greater than those investigated, or
variations in the make-up of the foam and/or procedure of application may warrant
further testing to verify the adequacy of these recommended values.
Typical values of the density of spray applied closed-cell polyurethane foam
insulation currently on the market appear to range from about 32 to 42 kg/m3 (2.0 to 2.6
lb/ft3) (DOW Building Solutions 2011, Polyurethane Foam Systems Inc. 2010). It is readily
seen that most of the applications produced foams that are denser than foam insulations
currently on the market.
2 COV = Coefficient of Variation.

19
Table 4 – Recommended Values of Density for Estimation Purposes
Application Procedure Density (kg/m3) Density (lb/ft3)
Low-density, filled formwork 40 2.50
Low-density, grouting Low-density, spray applied High-density, grouting
56 3.49
High-density, filled formwork 72 4.52
High-density, spray applied 104 6.49
3.2 Thermal Conductivity
The results of the thermal conductivity tests are summarized in Table 5, and
plotted as a function of density in Figure 14:
Table 5 – Average Thermal Conductivity of POLY-MOR Polyurethane Foam
Sample Conductivity
(W/m∙K) Conductivity (BTU/hr∙ft∙oF) COV
HD-C-1 0.0296 0.0171 12.7%
HD-C-2 0.0301 0.0174 13.8%
HD-C-3 0.0304 0.0176 10.9%
LD-C-1 0.0287 0.0166 10.6%
LD-C-2 0.0227 0.0131 7.5%
LD-C-3 0.0242 0.0140 5.6%
HD-S-1 0.0500 0.0289 11.9%
HD-S-2 0.0320 0.0185 13.2%
HD-S-3 0.0383 0.0221 13.6%
LD-S-1 0.0356 0.0206 4.1%
LD-S-2 0.0323 0.0187 6.9%
LD-S-3 0.0282 0.0163 12.2%
LD-G 0.0314 0.0181 11.2%
HD-G 0.0556 0.0322 7.4%
From Figure 14 it is observed that thermal conductivity generally increases with
increasing density, though it appears that the application procedure itself is more
important than the density, evinced by several conductivities of approximately 0.030
W/m∙K (0.017 BTU/hr∙ft∙oF) at densities more or less within the range of 40 to 110 kg/m3
(2.5 to 6.9 lb/ft3). Considering the degree of variance in the data, it seems that it is
appropriate to simply use an average thermal conductivity for each foaming procedure.

20
The recommended design values are presented in Table 6 and were used in the computer
simulations on single-wythe concrete masonry.
Figure 14 – Thermal conductivity as a function of density.
Table 6 – Recommended Values of Thermal Conductivity for Design
Application Procedure
Conductivity (W/m∙K)
Conductivity (BTU/hr∙ft∙oF)
Low-density spray-applied 0.0321 0.0185
High-density spray-applied 0.0401 0.0232
Low-density filled formwork 0.0252 0.0146
High-density filled formwork 0.0300 0.0174
Low-density grouting 0.0314 0.0181
High-density grouting 0.0556 0.0322
3.3 Thermal Resistance
3.3.1POLY-MOR Polyurethane Foam Insulation
The thermal resistance of the POLY-MOR polyurethane foam was calculated based
on the recommended thermal conductivities presented in Table 6. Tentative design
values have been presented in Table 7. For comparison, the thermal resistance of
0.000
0.010
0.020
0.030
0.040
0.050
0.060
0 25 50 75 100 125
Th
erm
al C
on
du
ctiv
ity
(W/m
∙K)
Density (kg/m3)
Low Density - SprayApplied
High Density - SprayApplied
Low Density - FilledFormwork
High Density - FilledFormwork
Low Density - Grouted
High Density - Grouted

21
common insulating materials has been provided in Table 8. It is noteworthy that
CAN/ULC S770 tests to determine the long-term thermal resistance are necessary to
determine appropriate design values for use in Canada. However, the values presented in
Table 7 are expected to be a reasonable approximation to the long-term thermal
resistances that would be obtained from CAN/ULC S770 testing.
Table 7 – Thermal Resistance of POLY-MOR Polyurethane Foam for
Various Application Procedures
Application Procedure
RSI per mm (m2∙K/W/mm)
R per inch (ft2·°F·hr/BTU/in)
Low-density spray-applied 0.031 4.50
High-density spray-applied 0.025 3.60
Low-density filled formwork 0.040 5.72
High-density filled formwork 0.033 4.80
Low-density grouting 0.032 4.60
High-density grouting 0.018 2.59
From Table 7 it is clear that the low-density foam is the more efficient insulating
material and that the filled formwork application yields superior RSI-values. The filled
formwork procedure using low-density foam yields a thermal resistance comparable to
extruded polystyrene with carbon black and some spray applied polyurethane foam
insulations. It is comparable to polyisocyanurate and the best available spray applied
polyurethane foams, but superior to most insulating materials (including ordinary
extruded polystyrene). Using high-density foam in the filled formwork procedure reduces
the thermal efficiency by about 16%, which makes it marginally less efficient than
ordinary extruded polystyrene, but still superior to all types of expanded polystyrene, batt
insulation, and other common insulating materials. The low-density spray-applied foam
and low-density foam grout are slightly less efficient than the high-density foam in the
filled formwork, but are still better than expanded polystyrene. The high-density spray
applied foam is about 20% less efficient than the low-density spray applied foam, making
it comparable to some types of batt insulation. The high-density foam grout yields a
relatively poor thermal resistance that is comparable to perlite loose fill.

22
Table 8 – Thermal Resistance of Various Insulating Materials
Insulation RSI per mm
(m2∙K/W/mm) R per inch
(ft2·°F·hr/BTU/in) Source
Mineral fibre (rock, slag, or glass), low-density
0.024 3.46
NRCC 1997
Mineral fibre (rock, slag, or glass), medium-density
0.026 3.75
Mineral fibre (rock, slag, or glass), high-density
0.028 4.04
Cellular glass 0.021 3.03
Expanded polystyrene (EPS), type 1
0.026 3.75
EPS, type 2 0.028 4.04
EPS, type 3 0.030 4.33
Extruded polystyrene (XPS) 0.035 5.05
Semi-rigid glass fibre sheathing 0.030 4.33
Cellulose loose fill 0.025 3.61
Mineral fibre (rock, slag, or glass) loose fill
0.020 2.88
Perlite loose fill 0.019 2.74
Vermiculite loose fill 0.015 2.16
Spray applied cellulosic fibre 0.024 3.46
Spray applied glass fibre 0.026 3.75
Spray applied polyurethane foam
0.042 6.06
Polyisocyanurate sheathing 0.042 6.06
Polyurethane sheathing 0.042 6.06
Polarfoam PF-7300-0 SOYA (Spray applied polyurethane “soya” foam)
0.0416 6.00 Polurethane Foam Systems Inc. 2010
PlastiSpanTM Type 1 (EPS, type 1)
0.0260 3.75
Plasti-Fab Ltd 2006
PlastiSpanTM HD Type 2 (EPS, type 2)
0.0280 4.04
PlastiSpanTM Type 3 (EPS, type 3)
0.0296 4.27
STYROFOAMTM (XPS) 0.0347 5.00
DOW Building Solutions 2006, n.d.a, n.d.b
STYROFOAMTM (XPS) with carbon black
0.0388 5.60
STYROFOAMTM Brand SPF CA (spray applied polyurethane foam)
0.0360 to 0.0400
5.19 to 5.77

23
THERMAXTM (polyisocyanurate)
0.0416 to 0.0451 6.00 to 6.50
PINKTM FIBERGLAS® batt 3 ½” & 35/8” R-12, 5½” R-19, 6” R-20, 8½” R-28, 9½” R-31, 10½” R-35, 11.8” R-40
0.0226 to 0.0240
3.26 to 3.45
Owens Corning 2009, 2011
PINKTM FIBERGLAS® batt 35/8” R-14, 6” R-22.5, 11” R-40
0.0252 to 0.0268
3.64 to 3.86
PINKTM FIBERGLAS® batt 3½” R-14, 5½” R-22, 6” R-24, 7” R-28
0.0277 4.00
PINKTM FIBERGLAS® batt 5½” R-24
0.0303 4.36
Foamular® XPS 0.0347 5.00
UltraTouchTM Denim Insulation batt
5½” R-19 0.0240 3.45
Bonded Logic Inc. 2011
UltraTouchTM Denim Insulation batt
3½” R-13, 5½” R-21, 8” R-30
0.0258 to 0.0265
3.71 to 3.82
UltraTouchTM Denim Insulation batt
2” R-8 0.0277 4.00
Perlite loose fill, 118 to 176 kg/m3 0.017 to 0.019 2.4 to 2.8
The Schundler Company n.d.
Perlite loose fill, 65.7 to 118 kg/m3
0.019 to 0.023 2.8 to 3.3
Perlite loose fill, 32.1 to 65.7 kg/m3
0.023 to 0.026 3.3 to 3.7
Considering that the filled formwork procedure yields the best thermal efficiency,
in addition to the most uniform thickness and best surface appearance, it is
recommended that this be the application of choice to provide insulation. The low-
density foam is recommended because it minimizes the weight added to the structure
and yields superior results with the least material. Additionally, by providing the best
thermal resistance, insulating by this method will consume the least amount of useable
floor area. To improve the viability of the filled formwork foam insulation procedure, it is

24
recommended that an associated modular formwork system be developed. The formwork
would have to be easily removed and reused, as taping a plastic sheet to the inside wastes
both time and materials. A coating of polytetrafluoroethylene or other “non-stick”
material on the form may prevent the adhesion of the foam. Alternatively, a form made of
gypsum wallboard could be developed that would be left in place and then painted, thus
serving the dual purpose of formwork and interior finish.
The low-density spray-applied foam may also be a viable insulation option. It is
believed that better uniformity than was observed in the mock-ups could be achieved
with more experience in the procedure. Further, while the procedure produces lower
thermal resistance and variable thickness, the lack of formwork could make spray
application more economical, particularly if neither of the above proposed formwork
options prove to be feasible.
The high-density spray applied foam does not appear to be a viable insulation
option because there are batt insulation products that are readily available with superior
thermal resistance. Considering that batts are much less expensive to purchase and install
than foam insulation currently on the market, high-density spray applied POLY-MOR
foam is not likely to be a competitive alternative. However, it is conceivable that the high-
density foam may be desirable in some applications. Being of greater density, it has
greater strength and durability, which may make the high-density foam suitable in
situations where the insulation can be expected to experience heavy wear or accidental
impact.
Further research would be required, but it is likely that the foam could improve
certain structural characteristics of the building envelope assemblies. Possible areas to
investigate are the increase in racking strength in stud framing, contribution to the
flexural and compressive resistance of structural insulated panels, and contribution to
blast resistance. In addition to thermal resistance, the foam will provide the benefit of
reduced sound transmission and air infiltration. Closed-cell foams are typically resistant
to air, water, and vapour diffusion. Further research would be necessary, but if these
properties are adequate, the foam could possibly serve four different functions:
insulation, air barrier, weather barrier, and vapour barrier. Such an application could
eliminate several materials and many hours of labour during construction.
Because the foam resists vapour diffusion, care should be taken when applying this
product to existing structures, as this could create a situation where moisture gets
trapped between two vapour barriers. A notable problem is that wood rot may be
accelerated if moisture is trapped against the framing. Also, consideration must be given
to the fire resistance, flame spread, and smoke generation characteristics of the foam.

25
Polyurethane is a combustible material that could release carcinogenic and noxious
chemicals in a fire. It is likely that additives to the foam will be necessary to meet
National and Provincial Building Code requirements related to the fire characteristics of
insulation materials. Further, fire related requirements are more stringent if the foam is
to be left exposed on the interior. Formwork that is made of gypsum and left in place after
insulating may be a simple solution. It is also possible that foam imbibed or coated with
an intumescent could meet fire resistance requirements.
3.3.2 Single-Wythe Concrete Masonry
The thermal resistance of the concrete masonry units without insulation was
calculated to be RSI-0.191 m2∙K/W (R-1.08 hr∙ft2∙oF/BTU) by the Parallel Path method and
RSI-0.183 m2∙K/W (R-1.04 hr∙ft2∙oF/BTU) by the Isothermal Planes method. The typical
range for similar concrete blocks, as reported by Van Geem (1985) is RSI-0.17 to RSI-0.20
(R-0.97 to R-1.14), so it appears that the thermal conductivities chosen to represent typical
construction are valid. The thermal resistance obtained from THERM was RSI-0.185. As
expected, the value calculated using THERM is less than that predicted by the Parallel
Path method, and greater than (but nearly equal to) the estimate provided by the
Isothermal Planes method.
Table 9 – Thermal Resistance of Single-Wythe Concrete Masonry Walls
Description Thermal
Resistance (m2∙K/W)
Thermal Resistance
(ft2·°F·hr/BTU)
No insulation 0.185 1.05
Cores filled with high-density foam 0.325 1.84
Cores filled with low-density foam 0.338 1.92
25mm (1 in) spray-applied high-density foam 0.820 4.66
51mm (2 in) spray-applied high-density foam 1.454 8.26
76mm (3 in) spray-applied high-density foam 2.088 11.85
25mm (1 in) spray-applied low-density foam 0.979 5.56
51mm (2 in) spray-applied low-density foam 1.771 10.06
76mm (3 in) spray-applied low-density foam 2.564 14.56
25mm (1 in) filled formwork applied high-density foam 1.032 5.89
51mm (2 in) filled formwork applied high-density foam 1.878 10.66
76mm (3 in) filled formwork applied high-density foam 2.723 15.46
25mm (1 in) filled formwork applied low-density foam 1.194 6.78
51mm (2 in) filled formwork applied low-density foam 2.202 12.50
76mm (3 in) filled formwork applied low-density foam 3.209 18.22

26
Note that the values given in Error! Reference source not found. are for the
materials alone and do not include the effective resistances furnished by the surface air
films. This can be accounted for by adding RSI-0.15 (R-0.85) to include the interior and
exterior surface films for a vertical wall above ground. The exterior air film is non-existent
for walls below ground, so RSI-0.12 (R-0.68) should be added instead.
The NECB prescribes maximum overall thermal transmittances (U-values)3 for the
various elements of the building envelope based on the number of annual heating degree-
days expected at the building’s location. Edmonton is in Zone 7A, so the maximum
thermal transmittance is 0.284 W/m2∙K for walls below ground and 0.210 W/m2∙K for
walls above ground. Equivalently, these maximum transmittance values can be expressed
as minimum resistance values of RSI-3.521 and RSI-4.762 (R-20.0 and R-27.0) respectively.
From Table 9 it is apparent that thicker (> 4 in) applications of the foam and/or larger
size units are required in order to satisfy the requirements of the NECB for walls above or
below ground. It is also readily seen that insulating the cores provides limited benefit.
Relative to a wall with no insulation, the improvement in thermal efficiency is about 80%
when the cores are filled with foam. However, 25mm (1 in) of low-density foam using the
filled formwork procedure uses less insulation material than grouting the cores, yet
improves thermal efficiency by over 500% relative to the wall with no insulation. It is
clear that thermal bridging inhibits the effectiveness of core insulation severely. A
selection of the results from the THERM simulations is presented in Figure 15 to Figure 21.
Figure 15 - Isotherms (left) and coloured infrared (right) of block with low-density foam filled cores. U = 3.0292 W/m2∙K.
3 The thermal transmittance is the reciprocal of the thermal resistance. U = 1/R.

27
Figure 16 - Isotherms (left) and coloured infrared (right) of the bed joint with low-density foam filled cores. U = 1.6781 W/m2∙K.
Figure 17 - Isotherms (left) and coloured infrared (right) of concrete block with no insulation. U = 5.4929 W/m2∙K.
28
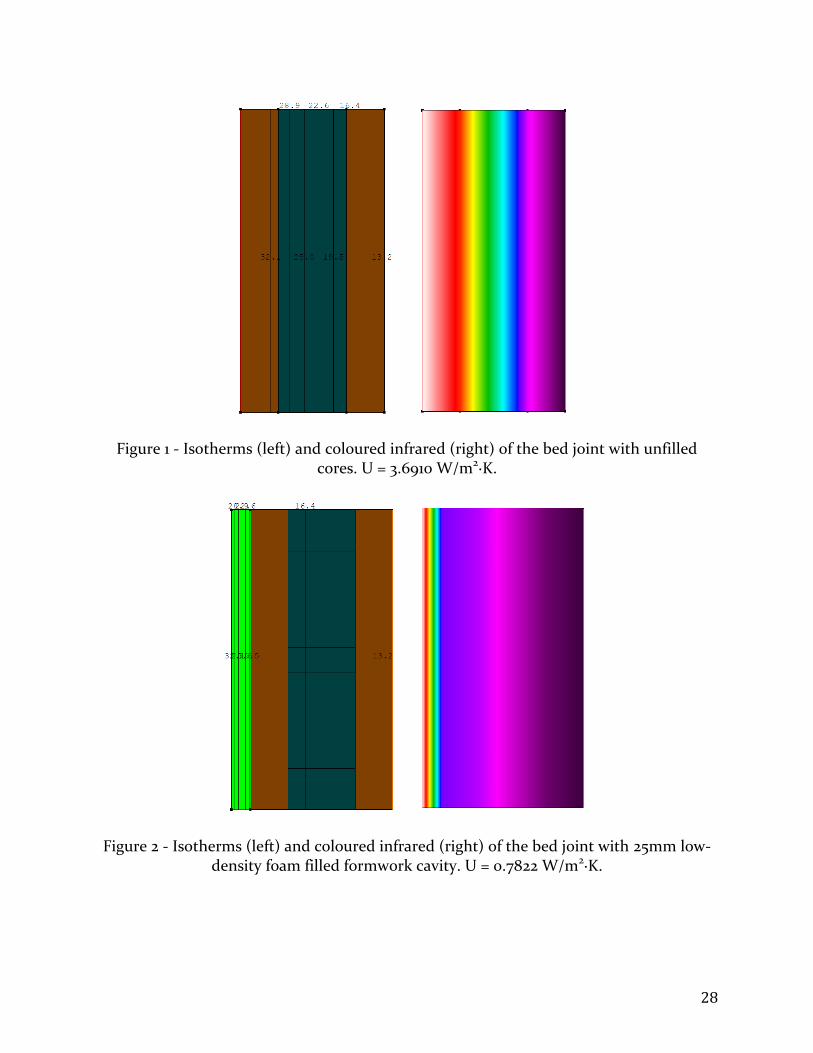
Figure 1 - Isotherms (left) and coloured infrared (right) of the bed joint with unfilled cores. U = 3.6910 W/m2∙K.
Figure 2 - Isotherms (left) and coloured infrared (right) of the bed joint with 25mm low-density foam filled formwork cavity. U = 0.7822 W/m2∙K.

29
Figure 20 - Isotherms (left) and coloured infrared (right) of concrete block with 25mm high-density foam filled formwork cavity. U = 0.9729 W/m2∙K.
Figure 21 - Isotherms (left) and coloured infrared (right) of concrete block with 50mm low-density foam filled formwork cavity. U = 0.4551 W/m2∙K.

30
The visual results of Figures 15 to 21 illustrate that heat flows preferentially through
materials with lower thermal resistance, and that a continuous layer of insulation is much
more effective than a discontinuous one. It is readily observed that nearly all of the
temperature change occurs in the continuous insulation layer (i.e. there is a high
temperature gradient in the insulation layer). Without a continuous layer of insulation
there is a more gradual temperature change across the entire thickness of the wall.
Table 10 presents recommended minimum thicknesses of application to make
single-wythe 190mm concrete masonry walls in Edmonton compliant with the NECB. A
plan view of a typical assembly is provided in Figure 22.
Figure 22 – Foam-insulated single-wythe concrete masonry
Table 10 – Insulation Configurations using POLY-MOR Polyurethane Foam to meet the
Requirements of the NECB 2011 for Single-Wythe Masonry Walls in Edmonton
Substrate Insulating Procedure
Recommended Minimum Thickness
Overall Thermal Resistance
(mm) (in) m2∙K/W hr∙ft2∙oF/BTU
Above-ground wall
Low-density foam filled formwork
114 4½ 4.87 27.7
High-density foam filled formwork
133 5¼ 4.78 27.1
Low-density spray applied foam
152 6 5.09 28.9
Below-ground wall
Low-density foam filled formwork
83 3¼ 3.58 20.3
High-density foam filled formwork
102 4 3.69 20.9
Low-density spray applied foam
127 5 4.27 24.2

31
The minimum thicknesses provided in Table 10 are based on the assumption that
the filled formwork procedure can produce thicknesses in 6.35mm (¼ in) increments,
while only 25.4mm (1 in) increments are possible with the spray application. The overall
thermal resistances given are based on the corresponding insulating procedure and
minimum recommended thickness. The thermal resistance furnished by the masonry wall
and surface air films have been included. No other materials have been included, though
it is likely that a waterproofing membrane of some kind would be present on walls below
ground, and it may be necessary to finish the interior of walls with gypsum wallboard.
Applying the foam on the exterior of single-wythe masonry walls may be the most
economical method of making these walls Code compliant. The masonry would provide
thermal mass on the interior and protect the insulation from fire, while the exterior
insulation may serve as an air and weather barrier. The uniform surface produced by the
filled formwork procedure could easily be finished with EIFS (“acrylic stucco”) base and
finish coats.
4.0 Conclusions and Recommendations
Single-wythe concrete masonry walls constructed at the University of Alberta were
used as substrates for fourteen different test procedures for the application of POLY-MOR
closed-cell polyurethane foam. The goal of the investigation was to determine the best
application procedure for use as an insulation material. ASTM tests were conducted to
ascertain the density and thermal conductivity of the foam in each of the fourteen wall
mock-ups. Two-dimensional heat flow analysis software was used to simulate the
insulated walls and determine the effective thermal resistance in each case. Based on the
results of the investigation, the following comments, recommendations, and conclusions
can be drawn:
1. The requirements of the NECB 2011 are much more stringent than those of the
MNECB 1997. This will result in significant increases to the amount of
insulation used in construction.
2. Due to a significant degree of thermal bridging across the webs, insulating the
cores of concrete masonry furnishes minimal benefit. It is not possible to meet
the requirements of NECB 2011 for above- or below-grade walls in any region in
Canada using the grouting procedure alone.
3. The filled formwork procedure appears to be the superior application of the
foam. It results in a uniform surface and provides better thermal resistance
than the other application procedures investigated. The filled formwork
procedure using low-density foam appears to be the most viable option.

32
4. The material and labour costs associated with the formwork could be a
drawback associated with the filled formwork application procedure. It is
believed that formwork that is either permanently left in place (see also Item 11)
or easily reused could be solutions.
a. To minimize costs with reusable formwork:
i. The forms should be durable enough to be reused many times.
ii. The forms should be modular in nature so that they are relatively
easy to disassemble, transport, and reassemble for use on various
jobs.
iii. The forms should be easily removed after the foam has hardened.
iv. The forms should require minimal (if any) surface preparation
work to prevent adhesion between the foam and the formwork. A
polytetrafluoroethylene or other “non-stick” coating of the
surface of the forms may suffice.
5. The filled formwork procedure using high-density foam is inferior to the low-
density foam as an insulating material, but may still be an option where the
insulation could be subjected to heavy wear.
6. If formwork costs cannot be reduced to a sufficiently low level, or if speed of
completion is of vital importance, low-density spray applied foam may also be a
viable option. However, a number of problems have been identified which will
hinder the competitiveness of this option.
a. The quality of workmanship and the amount of wasted material
depends more heavily on the experience of the applicator.
b. Even with an experienced applicator, more material waste is expected
with the spray applied foam than with the filled formwork procedure.
c. The thermal resistance furnished by the procedure is inferior to the
value reported for some rigid and spray applied foams already on the
market.
7. Further investigations may be justified to capitalize on other properties of the
foam. Quantifying the following should help make the product more
marketable:
a. Degree of noise reduction provided.
b. Increase in racking strength of stud framed walls.
c. Increase in flexural and compressive strength in structural insulated
panels.
d. Ability to absorb impact and blast energy.
e. Adequacy as an air, weather, and/or vapour barrier.

33
8. Exterior application of the insulation may be the most economical method of
making single-wythe masonry walls compliant with the NECB.
9. Considering that the exterior application of insulation is not always possible,
investigation into improving the fire resistance of the foam may be warranted.
Possibilities that could be explored include:
a. Forms that can be left in place and are built of fire resistant materials
like gypsum wallboard. These forms could be painted after insulating.
The permanent formwork approach increases the cost of insulating, but
it also reduces the cost of finishing.
b. Foam imbibed with an intumescent prior to application.
c. Foam coated with an intumescent after curing.
While it was demonstrated that there are some insulation products with
comparable thermal resistance already available on the market, POLY-MOR polyurethane
foam could still be a competitive insulation if other properties of the foam are also
exploited. Though further investigation is recommended, including verification that the
material meets all National and Provincial Building Code requirements for insulation
materials, it appears that POLY-MOR closed-cell polyurethane foam possesses significant
potential as an insulating material, not only for walls, but also for roofs, slabs on ground,
and underground pipes.

34
5.0 References
American Concrete Institute Committee 122 (ACI-122). 2002. Guide to Thermal
Properties of Concrete and Masonry Systems. ACI, Farmington Hills, MI.
American Society of Heating, Refrigerating and Air-Conditioning Engineers
(ASHRAE). 2009. ASHRAE Handbook of Fundamentals, SI Edition. ASHRAE, Atlanta, GA.
ASTM International. 2008. ASTM D792: Standard test methods for density and
specific gravity (relative density) of plastics by displacement. ASTM International, West
Conshohocken, PA.
ASTM International. 2009. ASTM D5930: Standard test method for thermal
conductivity of plastics by means of a transient line-source technique. ASTM
International, West Conshohocken, PA.
Bonded Logic Inc. 2011. UltraTouchTM Denim Insulation specifications [online].
Available from http://www.bondedlogic.com/pdf/denim-insulation/denim-
specifications.pdf [cited 2 October 2011].
Canadian Standards Association. 2004. CAN/CSA-A165.1: Concrete block masonry
units. Canadian Standards Association, Mississauga, ON.
DOW Building Solutions. 2006. Long term thermal resistance (LTTR) values in
accordance with CAN/ULC S770 [online]. Available from
http://www.gvsa.on.ca/news/apr2006/LTTR%20Dow%20Commercial%20XPS.pdf [cited 2
October 2011]
DOW Building Solutions. n.d.a. STYROFOAMTM brand SPF CA insulation [online].
Available from http://msdssearch.dow.com/PublishedLiteratureDOWCOM/dh_0817/
0901b80380817813.pdf?filepath=styrofoam/pdfs/noreg/178-01120.pdf&fromPage=GetDoc
[cited 2 October 2011].
DOW Building Solutions. n.d.b. THERMAXTM sheathing [online]. Available from
http://building.dow.com/na/en/products/insulation/thermaxsheathing.htm [cited 2
October 2011]
Enermodal Engineering Limited. 1996. Building insulation system thermal anomalies. ASHRAE Research Project 785-RP. ASHRAE, Atlanta, GA.
Finlayson, E., Mitchell, R., Arasteh, D., Huizenga, C., Curcija, D. 1998. THERM 2.0:
Program Description – A PC Program for Analyzing the Two-Dimensional Heat Transfer
through Building Products. University of California, Berkeley, CA.

35
National Research Council Canada (NRCC). 1997. Model National Energy Code of
Canada for Buildings. NRCC, Ottawa, ON.
National Research Council Canada (NRCC). 2011. National Energy Code of Canada
for Buildings. NRCC, Ottawa, ON.
Owens Corning. 2009. Foamular® 400/600/1000 high-density extruded polystyrene
rigid insulation product data sheet. Owens Corning, Scarborough, ON.
Owens Corning. 2011. EcoTouchTM PINKTM FIBERGLAS® thermal batt insulation
product data sheet. Owens Corning, Scarborough, ON.
Plasti-Fab Ltd. 2006. Insulation systems for residential and commercial
construction. Plasti-Fab Ltd., Calgary, AB.
Polyurethane Foam Systems Inc. 2010. Polarfoam PF-7300-0 SOYA technical data
[online]. Available from http://www.thermosealinsulation.ca/Tech%20Data%20PF-7300-
0%20SOYA.pdf [cited 2 October 2011].
Schundler Company, The. n.d. Basic perlite information and data [online].
Available from http://www.schundler.com/techperl.htm [cited 2 October 2011].
Van Geem, M.G. 1985. Thermal transmittance of concrete block walls with core
insulation. ASHRAE Transactions 91 (2).

36
Appendix A: Unit Conversions
The following table provides unit conversion factors for various quantities
presented in this report.
Table 11 – Unit Conversions
Quantity in SI Units Multiply by = US Customary Units
Density kg/m3 0.06243 lb/ft3
Length mm 0.03937 in
Thermal Conductivity W/m∙K 0.5779 BTU/hr∙ft∙oF
Thermal Resistance m2∙K/W (RSI-value) 5.678 hr∙ft2∙oF/BTU (R-value)
Thermal Transmittance (U-value)
W/m2∙K 0.1761 BTU/hr∙ft2∙oF

37
Appendix B: Hand Calculations
A sample calculation using the parallel flow path method is provided in Example 1
below.
Example 1: 190mm concrete masonry with no insulation.
Path 1: 50mm mortar, 90mm air space, 50mm mortar
Rmortar:
(
)( )
Rair:
R1: Rmortar + Rair + Rmortar =
A1 ( )( ) ( )( )
Path 2: 38mm face shell, 114mm air space, 38mm face shell
Rconcrete:
(
)( )
Rair:
R2: Rconcrete + Rair + Rconcrete =
A2: ( )( ( )( ))
Path 3: 190mm concrete (face shell + web + face shell).
R3: Rconcrete = R3 =
(
)( )
A3: ( )(( )( ))
Total area:
AT: 5900 + 56 430 + 17 670 = 80 000mm2
Overall Resistance of the materials:
RT: [
( )( )
( )( )
( )( )]
Overall Resistance of the wall (including surface air films):

38
RU:
The U-value of the assembly is the reciprocal of RU, or 2.93 W/m2K in this example.
Example 2 is a sample calculation illustrating how the results of two analyses were
combined using the Parallel Path method to approximate the overall thermal resistance
of the entire wall.
Example 2: 190mm concrete masonry unit and 10mm bed joint with no insulation.
(
)
(( )( ) ( )( ))
A sample calculation using the method of isothermal planes is provided below.
Example 3: 190mm concrete masonry with no insulation.
Layer 1: 38mm
Path1 of Layer 1: 38mm mortar
R1,1:
( )( )
A1,1: 5900mm2
Path 2 of Layer 1: 38mm concrete (face shell)
R1,2:
( )( )
A1,2: 74 100mm2
Resistance of Layer 1:
R1: (
( )( )
( )( ))
Layer 2: 12mm
Path1 of Layer 2: 12mm mortar

39
R2,1:
( )( )
A2,1: 5900mm2
Path 2 of Layer 2: 12mm concrete (webs)
R2,2:
( )( )
A2,2: 17 670mm2
Path 3 of Layer 2: 12mm out of 114mm core air space
R2,2:
( )( )
A2,2: 56 430mm2
Resistance of Layer 2:
R2: (
( )( )
( )( )
( )( ))
Layer 3: 90mm
Path 1 of Layer 3: 90mm mortar joint air space
R3,1:
A3,1: 5900mm2
Path 2 of Layer 3: 90mm concrete (webs)
R3,2:
( )( )
A3,2: 17 670mm2
Path 3 of Layer 3: 90mm out of 114mm core air space
R3,3:
( )( )
A3,3: 56 430mm2
Resistance of Layer 3:
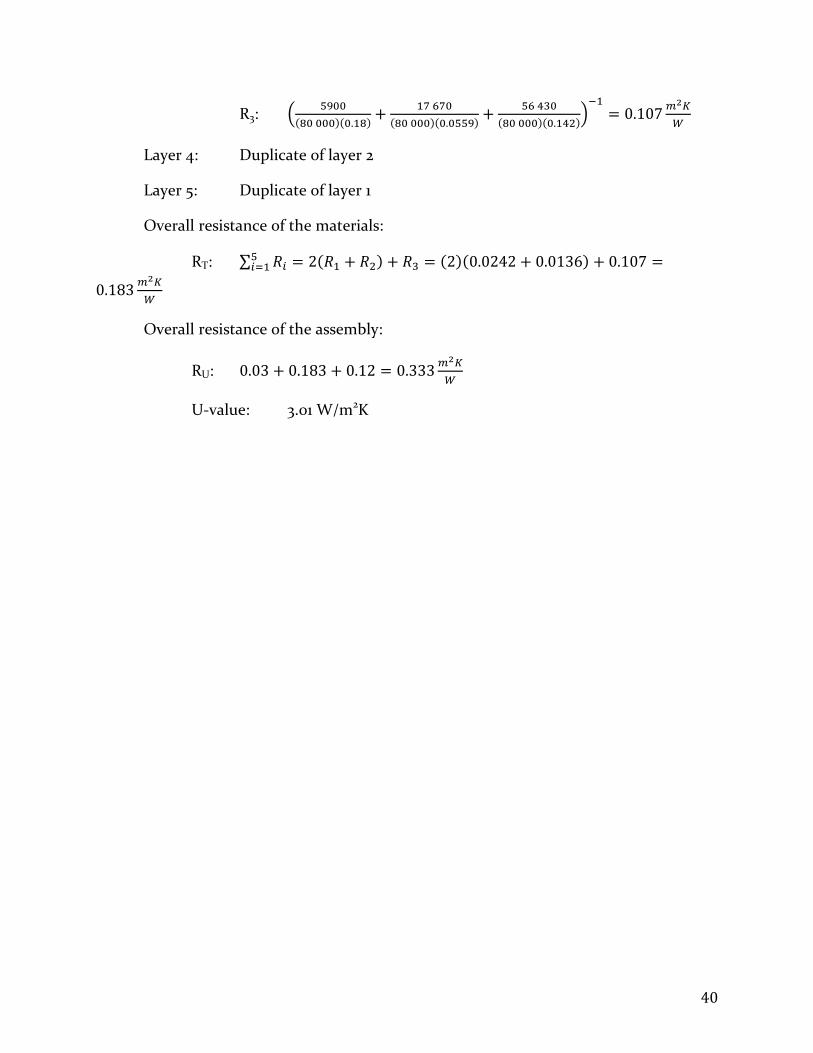
40
R3: (
( )( )
( )( )
( )( ))
Layer 4: Duplicate of layer 2
Layer 5: Duplicate of layer 1
Overall resistance of the materials:
RT: ∑ ( ) ( )( )
Overall resistance of the assembly:
RU:
U-value: 3.01 W/m2K