application of oil debris monitoring for wind turbine ... turbine gearboxes are bearing spall and...
TRANSCRIPT

Annual Conference of the Prognostics and Health Management Society, 2010
1
Application of Oil Debris Monitoring For Wind Turbine Gearbox Prognostics and Health Management
Richard Dupuis
GasTOPS, Ottawa, Ontario, Canada, K1J 9J3 [email protected]
ABSTRACT Experience has shown that premature gearbox failures are a leading maintenance cost driver that can easily lower the profit margin from a wind turbine operation. Prognostics and Health Management (PHM) techniques offer the potential of effectively managing gearbox health problems by detecting early damage, tracking the severity of damage, estimating the time to reach pre-defined damage limits, and providing key information for proactive maintenance decisions. Experience has revealed that major damage modes of wind turbine gearboxes are bearing spall and gear teeth pitting, both of which release metallic debris particles in the oil lubrication system. Oil debris monitoring is thus well suited to provide an early indication and quantification of internal damage to bearings and gears of a wind turbine gearbox.
This paper reviews the application of oil debris monitoring as an effective PHM solution for wind turbine gearboxes. The paper describes the principle of operation of the oil debris monitoring technology and the principle of application for effective PHM of wind turbine gearboxes. The paper explains the common surface fatigue damage mode of bearing and gear rolling elements and the characteristics of the destructive debris that result from this damage mode. The paper outlines a simple means of deriving accumulated debris count damage limits based upon basic gearbox component geometry and the use of moving averages for estimating rates of debris generation as a simple yet effective damage data-driven propagation model. Finally, the application of oil debris monitoring as an effective PHM technology for wind turbine gearboxes is illustrated by presenting actual data obtained from seeded fault bearing and gear tests and fielded gearbox applications. * This is an open-access article distributed under the terms of the Creative Commons Attribution 3.0 United States License, which permits unrestricted use, distribution, and reproduction in any medium, provided the original author and source are credited.
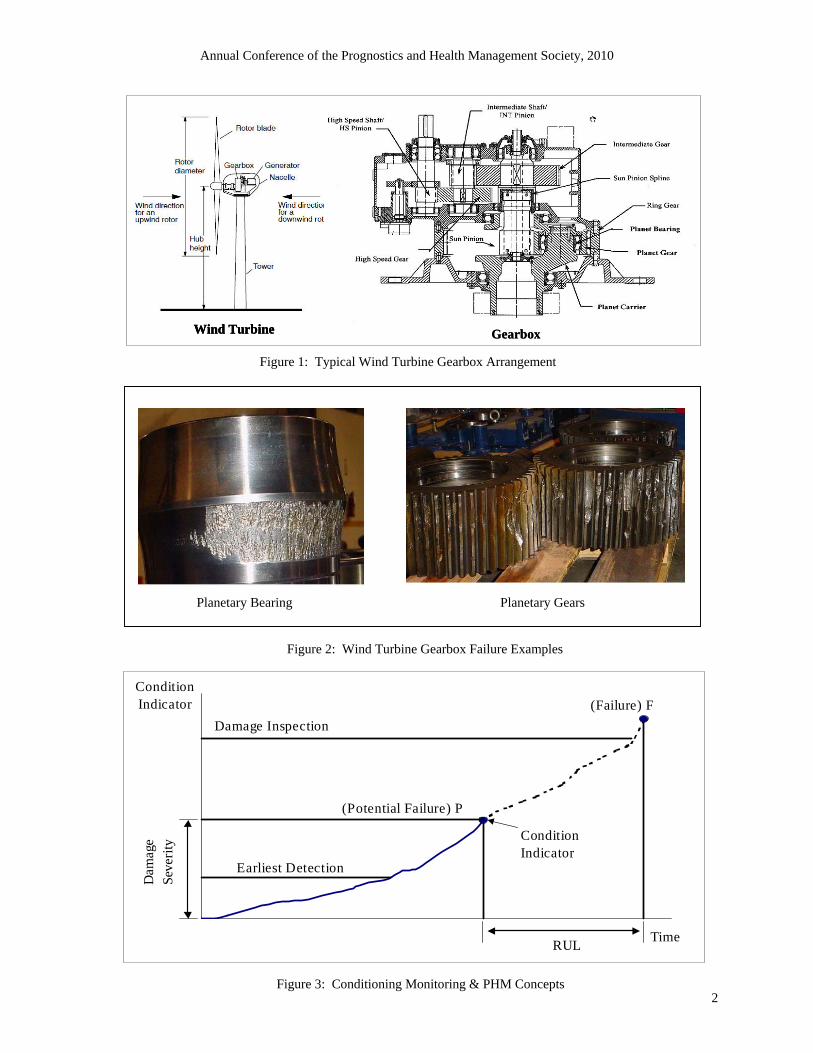
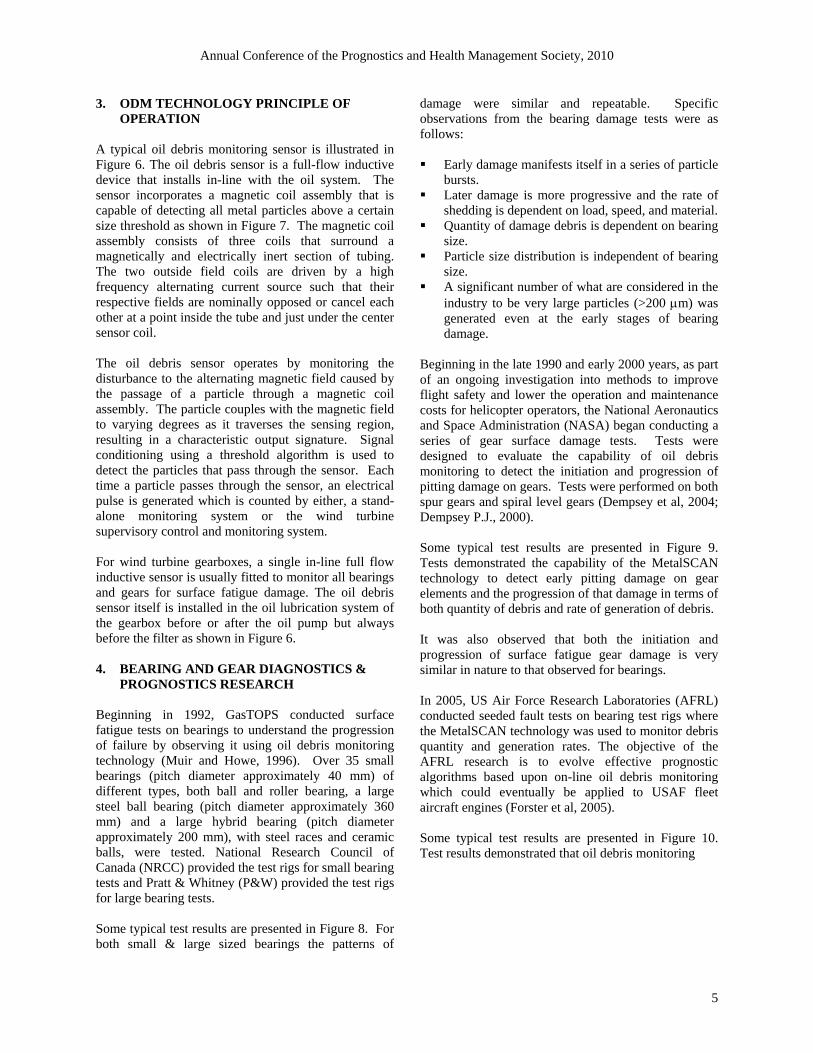
1. INTRODUCTION The wind industry has experienced problems with the reliability of gearboxes (Windpower 2005 Nov). The arrangement of a typical wind turbine gearbox is illustrated in Figure 1. This is a commonly used gearbox which has 3 stages of gearing – a high speed stage, an intermediate stage, and a planetary stage. All three stages have been plagued with problems to various degrees. An example of catastrophic failure on a planetary stage is illustrated in Figure 2 where both bearings and planetary gears were damaged. Larger and newer gearboxes recently introduced with multiple planetary stages have also been known to be problematic.
Recent wind industry experience continues to highlight the gearbox as one of the most problematic critical components. Mean time between failures of gearboxes is estimated to be approximately 10 years (Wind Today, 2008 Q1) and gearbox failures are common after 4 to 7 years (Wind Today, 2006 Q3). Some operators report failures still earlier such as after 2 years of operation. Furthermore, the rapid pace of ongoing technology development to produce bigger wind turbines in a short period of time has also contributed to some design and production problems that are often revealed in operational wind turbines (Windpower, 2009 Jul).
The wind industry is dealing with the gearbox reliability problem in essentially three major ways. First, some organizations are conducting root cause investigations of gearbox problems. Second, other organizations continue to modify the design of gearboxes and system interfaces in an attempt to better cope with loads imposed on wind turbine drivetrains. Third, operators and owners are now seeking solutions such as Condition Monitoring (CM) to manage the gearbox problem.
Annual Conference of the Prognostics and Health Management Society, 2010
2
Wind Turbine GearboxWind TurbineWind Turbine Gearbox
Figure 1: Typical Wind Turbine Gearbox Arrangement
0
100
200
300
400
500
600
700
800
900
1000
17-May-10 22-May-10 27-May-10 01-Jun-10 06-Jun-10 11-Jun-10 16-Jun-10 21-Jun-10Time
ConditionIndicator
RUL
Damage Inspection
Dam
age
Seve
rity
(Potential Failure) P
(Failure) F
Earliest Detection
Condition Indicator
Figure 3: Conditioning Monitoring & PHM Concepts
Figure 2: Wind Turbine Gearbox Failure Examples
Planetary Bearing Planetary Gears

Annual Conference of the Prognostics and Health Management Society, 2010
3
Condition Monitoring (CM) is a prerequisite for PHM. This is illustrated in Figure 3 whereby the condition of the equipment is monitored as a function of time to try and detect evidence of damage in advance of the failure of the equipment. Point P represents the detection of a potential failure condition and point F represents the point at which functional failure occurs. For condition monitoring to be technically feasible, the Condition Indicator (CI) used must be sensitive enough to detect potential failure events sufficiently in advance in order to provide adequate time for an operator to proactively plan maintenance inspections and repairs. The Condition Indicator must also be able to quantify the degree of damage severity as the damage progresses towards failure in order for a damage propagation model to be capable of providing an estimate of Remaining Useful life (RUL). CM and PHM can be used to effectively limit the damage and avoid failure of the equipment. These techniques can mitigate the risk of profit loss from gearbox problems by maximizing power generation revenue and minimizing the cost of maintenance. Failure events are avoided by containing the damage and reducing the repair time and costs significantly. Business interruption is minimized by scheduling repair and support services on-site before shutdown and minimizing lost revenues and also associated penalties. Oil debris monitoring (ODM) has been proven to be a viable condition monitoring technique for the early detection and the tracking of damage of bearing and gear elements in wind turbine gearboxes. In this paper, the potential of ODM to support a PHM methodology for wind turbine gearboxes will be discussed. 2. BEARING AND GEAR FAILURES MODES The majority of the wind turbine gearbox problems that cause outages are due to bearing spall and/or gear pitting. From (Windpower 2005 Nov) and the experience of many in the wind energy industry, approximately 80% of the gearbox problems can be attributed to the bearings which then lead to secondary damage on the gearing. When a bearing or gear are properly designed, manufactured, installed, and maintained, the phenomenon limiting useful life is surface fatigue. This type of surface fatigue is a cyclic dependent phenomenon resulting from repeated stresses under bearing rolling contact or gear meshing contact conditions and is considered ‘high cycle’ fatigue. Thus, the design objective of a modern bearing and gear component is to maintain the contact stresses below the fatigue limit of the materials.
In reality, a number of factors can contribute to creating stress concentrations that exceed the allowable working limit of the material such as: excessive loads, misalignment, material flaws, manufacturing defects, mishandling, wrong type of oil, contaminants in the oil, high oil temperatures, corrosion, etc. All such situations eventually result in localized damage to the bearing or gear and, regardless of the high stress initiation mechanism, the nature of the damage manifests itself initially as a surface spall or pit. Bearing spall then progresses along the width of the race due to stress concentrations on the edge of the spall until it reaches a certain limit where the spalled area conforms to the roller as shown in Figure 4. Afterwards, the spalling continues mostly along the circumference of the race. With respect to bearing stresses and deflections, the relative conformities of rolling elements to their contacting raceways is important. Loads acting between rolling elements and raceways in rolling element bearings develop only small areas of contact between the mating members. Consequently, although the elemental loading may only be moderate, stresses induced on the surfaces of the rolling elements and raceways are usually large. Since the effective area over which load is supported rapidly increases with depth below the rolling surface of the bearing, the high compressive stress occurring at the surface does not permeate the entire bearing element. Although bulk failure of rolling members is generally not a significant factor in rolling element bearing design, destruction of the rolling surfaces to some limited depth is a significant concern. In general, the depth of spall damage on bearing races is very shallow and the damage severity is essentially a function of surface area. Once spalling or pitting is initiated, the effects of stress fatigue result in the progression of spalling of the bearing or pitting of the gears towards eventual catastrophic failure if these elements remain in operation too long, as shown in Figure 2. Figure 5 presents a wear debris characterization chart (Wigglelinkhuizen et al, 2007) to illustrate the progress of metallic wear debris particle release from benign wear to catastrophic failure. Such a chart summarizes wear debris observations from all the different wear modes that can range from polishing, rubbing, sliding, skidding, abrasion, adhesion, grinding, scoring, pitting, spalling, etc. As mentioned in numerous references (Toms and Toms, 2008; Kitaljevich and Veldhuizen, 2000; SAE, 2005; Wright and Neale, 1987; Kuhnell, 2004; Kotzalas and Harris, 2001; Harris, 1991; Dempsey et al, 2004), the predominant failure mode for rolling element bearings and gears is spalling or

Annual Conference of the Prognostics and Health Management Society, 2010
4
macropitting. This type of deterioration process produces increasing levels of large types of debris particles with a typical size range from 100 microns to 1000 microns or greater.
Rotating machines such as wind turbine gearboxes which contain rolling element bearings and gears made from hard steel tend to produce this kind of large wear debris that eventually leads to gearbox failure.
S p all P rop agation
S p all D ep th
S p all P rop agation
S p all D ep th
Figure 4: Bearing Spall Progression (SKF; Harris, 1991)
Bearing Spall & Gear Pitting Particle Size Range of ConcernBearing Spall & Gear Pitting Particle Size Range of ConcernBearing Spall & Gear Pitting Particle Size Range of ConcernBearing Spall & Gear Pitting Particle Size Range of Concern
Figure 5: Wear Debris Characterization Chart (Wigglelinkhuizen et al, 2007)
ODM
Pump
Filter
Wind TurbineGearbox
ODM
MS 3000
ODM
Pump
Filter
Wind TurbineGearbox
ODM
ODM
Pump
Filter
Wind TurbineGearbox
ODM
MS 3000
Figure 6: Oil Debris Monitoring (ODM) Sensor
Figure 7: ODM Principle of Operation
Annual Conference of the Prognostics and Health Management Society, 2010
5
3. ODM TECHNOLOGY PRINCIPLE OF OPERATION
A typical oil debris monitoring sensor is illustrated in Figure 6. The oil debris sensor is a full-flow inductive device that installs in-line with the oil system. The sensor incorporates a magnetic coil assembly that is capable of detecting all metal particles above a certain size threshold as shown in Figure 7. The magnetic coil assembly consists of three coils that surround a magnetically and electrically inert section of tubing. The two outside field coils are driven by a high frequency alternating current source such that their respective fields are nominally opposed or cancel each other at a point inside the tube and just under the center sensor coil. The oil debris sensor operates by monitoring the disturbance to the alternating magnetic field caused by the passage of a particle through a magnetic coil assembly. The particle couples with the magnetic field to varying degrees as it traverses the sensing region, resulting in a characteristic output signature. Signal conditioning using a threshold algorithm is used to detect the particles that pass through the sensor. Each time a particle passes through the sensor, an electrical pulse is generated which is counted by either, a stand-alone monitoring system or the wind turbine supervisory control and monitoring system. For wind turbine gearboxes, a single in-line full flow inductive sensor is usually fitted to monitor all bearings and gears for surface fatigue damage. The oil debris sensor itself is installed in the oil lubrication system of the gearbox before or after the oil pump but always before the filter as shown in Figure 6. 4. BEARING AND GEAR DIAGNOSTICS &
PROGNOSTICS RESEARCH Beginning in 1992, GasTOPS conducted surface fatigue tests on bearings to understand the progression of failure by observing it using oil debris monitoring technology (Muir and Howe, 1996). Over 35 small bearings (pitch diameter approximately 40 mm) of different types, both ball and roller bearing, a large steel ball bearing (pitch diameter approximately 360 mm) and a large hybrid bearing (pitch diameter approximately 200 mm), with steel races and ceramic balls, were tested. National Research Council of Canada (NRCC) provided the test rigs for small bearing tests and Pratt & Whitney (P&W) provided the test rigs for large bearing tests. Some typical test results are presented in Figure 8. For both small & large sized bearings the patterns of
damage were similar and repeatable. Specific observations from the bearing damage tests were as follows: Early damage manifests itself in a series of particle
bursts. Later damage is more progressive and the rate of
shedding is dependent on load, speed, and material. Quantity of damage debris is dependent on bearing
size. Particle size distribution is independent of bearing
size. A significant number of what are considered in the
industry to be very large particles (>200 µm) was generated even at the early stages of bearing damage.
Beginning in the late 1990 and early 2000 years, as part of an ongoing investigation into methods to improve flight safety and lower the operation and maintenance costs for helicopter operators, the National Aeronautics and Space Administration (NASA) began conducting a series of gear surface damage tests. Tests were designed to evaluate the capability of oil debris monitoring to detect the initiation and progression of pitting damage on gears. Tests were performed on both spur gears and spiral level gears (Dempsey et al, 2004; Dempsey P.J., 2000). Some typical test results are presented in Figure 9. Tests demonstrated the capability of the MetalSCAN technology to detect early pitting damage on gear elements and the progression of that damage in terms of both quantity of debris and rate of generation of debris. It was also observed that both the initiation and progression of surface fatigue gear damage is very similar in nature to that observed for bearings. In 2005, US Air Force Research Laboratories (AFRL) conducted seeded fault tests on bearing test rigs where the MetalSCAN technology was used to monitor debris quantity and generation rates. The objective of the AFRL research is to evolve effective prognostic algorithms based upon on-line oil debris monitoring which could eventually be applied to USAF fleet aircraft engines (Forster et al, 2005). Some typical test results are presented in Figure 10. Test results demonstrated that oil debris monitoring

Annual Conference of the Prognostics and Health Management Society, 2010
6
•Seeded fault test data from bearing rig monitored by oil debris monitoring
98 99 100 1010
500
1000
1500
2000
2500
3000
3500
Elapsed Time [%]
Num
ber o
f Par
ticle
s> 135 um
> 289 um
> 230 um> 215 um
> 195 um
> 169 um
> 500 um
Small-scale bearing test (D=40 mm)
•Seeded fault test data from bearing rig monitored by oil debris monitoring
98 99 100 1010
500
1000
1500
2000
2500
3000
3500
Elapsed Time [%]
Num
ber o
f Par
ticle
s> 135 um
> 289 um
> 230 um> 215 um
> 195 um
> 169 um
> 500 um
Small-scale bearing test (D=40 mm)
•Seeded fault test data from bearing rig monitored by oil debris monitoring
98 99 100 1010
500
1000
1500
2000
2500
3000
3500
Elapsed Time [%]
Num
ber o
f Par
ticle
s> 135 um
> 289 um
> 230 um> 215 um
> 195 um
> 169 um
> 500 um
Small-scale bearing test (D=40 mm)
Figure 8: ODM Results for Bearing Spall Investigations (Muir and Howe, 1996)
Increasing damage on gear tooth
• Seeded fault test data monitored by oil debris monitoring
Experiment 2
Increasing damage on gear tooth
• Seeded fault test data monitored by oil debris monitoring Increasing damage on gear tooth
• Seeded fault test data monitored by oil debris monitoring
Experiment 2
Figure 9: ODM Results for Gear Pitting Investigations (Dempsey et al, 2004; Dempsey P.J., 2000)

Annual Conference of the Prognostics and Health Management Society, 2010
7
•Seeded fault test data monitored by oil debris monitoring
0
20
40
60
80
100
120
140
160
180
0.0 10.0 20.0 30.0 40.0 50.0Cycles (Millions)
Mas
s Lo
ss(m
g)
250 ksi
250 ksi278 ksi
•Seeded fault test data monitored by oil debris monitoring
0
20
40
60
80
100
120
140
160
180
0.0 10.0 20.0 30.0 40.0 50.0Cycles (Millions)
Mas
s Lo
ss(m
g)
•Seeded fault test data monitored by oil debris monitoring
0
20
40
60
80
100
120
140
160
180
0.0 10.0 20.0 30.0 40.0 50.0Cycles (Millions)
Mas
s Lo
ss(m
g)
0
20
40
60
80
100
120
140
160
180
0.0 10.0 20.0 30.0 40.0 50.0Cycles (Millions)
Mas
s Lo
ss(m
g)
250 ksi
250 ksi278 ksi
Figure 10: ODM Results for Bearing Prognostics Investigations (Forster et al, 2005)
Spall Detection Spall SizeEstimation
SpallPropagation
Model
DetermineRemainingUseful Life
(RUL)
SpallDetected Spall Size
SpallPropagation
Rate
RULDistributionOil Debris
Vibration Signal
Future OperatingConditions Failure Threshold
Spall Detection Spall SizeEstimation
SpallPropagation
Model
DetermineRemainingUseful Life
(RUL)
SpallDetected Spall Size
SpallPropagation
Rate
RULDistributionOil Debris
Vibration Signal
Future OperatingConditions Failure Threshold
Spall Detection Spall SizeEstimation
SpallPropagation
Model
DetermineRemainingUseful Life
(RUL)
SpallDetected Spall Size
SpallPropagation
Rate
RULDistributionOil Debris
Vibration Signal
Future OperatingConditions Failure Threshold
Spall Detection Spall SizeEstimation
SpallPropagation
Model
DetermineRemainingUseful Life
(RUL)
SpallDetected Spall Size
SpallPropagation
Rate
RULDistributionOil Debris
Vibration Signal
Future OperatingConditions Failure Threshold
Figure 11: Bearing PHM Results using ODM Diagnostic Data (Bolander et al, 2009)

Annual Conference of the Prognostics and Health Management Society, 2010
8
technology can provide prognostic information on bearing damage in terms of critical mass loss and critical failure rate associated with bearing damage. More specifically, bearing damage progression is repeatable under the same loads and stress affects the failure rate such that reducing bearing loads will slow the progression of failure. More recently in 2009, results from a Defense Advanced Research Projects Agency (DARPA) engine system prognostics project were presented on a physics based RUL prediction method for aircraft engine bearing prognostics using oil debris monitoring diagnostics data to provide an estimate of spall size as damage progressed (Bolander et al, 2009). The RUL prediction method was calibrated using data from subscale seeded fault bearing tests and validated on a full scale bearing test rig. Some typical test results are presented in Figure 11. Test results demonstrated that oil debris monitoring technology provides sufficiently accurate estimates of spall size as a function of particle counts to update the RUL spall damage estimation algorithm.
5. WIND TURBINE GEARBOX PHM ODM
PRINCIPLE OF APPLICATION From individual bearing and gear component tests, it was shown that oil debris monitoring is effective at detecting early damage and the progression of damage in bearings and gears, at quantifying damage severity by means of accumulated metallic debris particle counts, and determining that damage progression rate is affected by speed and load. In order to apply a single ODM sensor for PHM of an entire Wind Turbine (WT) gearbox, a number of key considerations are summarized as follows: A multi-stage wind turbine gearbox will have
many bearings and gears. During operation, wind turbine gearbox loads are
highly variable given that the input wind speeds are variable (i.e. power varies as the cube of wind speed).
Wind turbine gearbox bearing geometry and loads will vary from component to component.
Some wind turbine gearbox ODM applications will be retrofits that may already be damaged to some extent but the severity of damage is not known.
Wind turbine gearbox components can be inspected to identify possible bearing and/or gear damage.
Some wind turbine gearbox bearing and gear
components can be repaired in situ whereas other components cannot. The following subsections will summarize a simple ODM PHM concept for wind turbine gearboxes to cope with these challenges. An overview of the key elements of the ODM PHM concept is presented in Figure 12.
5.1 Selection of WT Gearbox Measure of Damage Although the multi-stage gearbox has many bearings and gears as shown in the typical gearbox representation of Figure 1, some bearing and gear components may have historically a low failure rate and may be considered less of a failure risk. In Section 3, it was mentioned that approximately 80% of the gearbox problems can be attributed to the bearings which then lead to secondary damage on the gearing. Although all stages of gearing have been plagued with bearing problems, it is noteworthy that feedback from field experience suggests that high speed shaft bearings and planet gear bearings are especially problematic. The former can be repaired in situ whereas the latter cannot. This suggests that damaged high speed shaft bearings should be replaced when possible and damaged planet gear bearings should be run to some damage limit that maximizes revenue generation and minimizes maintenance repair costs. Hence, gearbox damage inspection limits will be set on the basis of bearing damage. These same limits will also provide valid inspection points for gearing, since surface fatigue phenomena for bearings and gears progress in a similar manner (Dempsey et al, 2004; Dempsey P.J., 2000). 5.2 Definition of WT Gearbox Damage Inspection
Limits From the previous discussion, an upper or maximum 100% bearing damage inspection limit can be defined for a planet gear bearing to limit the angle of spall on the bearing race to some value that will maximize revenue generation and minimize repair costs. The concept of an angle of spall as a measure of damage severity level is derived later in Section 6. Since high speed bearings, having geometry smaller than planet bearings, may become damaged, this suggests that one or more lower damage inspection limits should be defined to trigger inspections of the gearbox at opportune times to identify which component is damaged and verify damage progression. Damage inspection limits can be defined as shown in Figure 13 in terms of percentages relative to the 100%

Annual Conference of the Prognostics and Health Management Society, 2010
GearboxDamageDetection
DamageSeverity
Estimation
DamagePropagation
Model
DamageRUL Estimation
ODMCumulative
Counts
DamageEarliest
Detection
DamageCount
Estimation
DamagePropagation
Rate
Days toDamage Limit
RULODM
Figure 12: WT Gearbox ODM Diagnostics & Prognostics Concept
0
100
60
30
10
Time
Cou
nts %
Typical Damage Inspection Limits
0
100
60
30
10
Time
Cou
nts %
0
100
60
30
10
Time
Cou
nts %
Typical Damage Inspection Limits
Figure 13: WT Gearbox Typical Damage Inspection Limits
0
100
200
300
400
500
600
700
800
900
1000
17-May-10 22-May-10 27-May-10 01-Jun-10 06-Jun-10 11-Jun-10 16-Jun-10 Time
ODM Counts
Moving Average Short Term
Moving Average Long Term
RUL to Limit
Damage Inspection Limit
ODM Counts
Dam
age
Sev
erit y
Figure 14: WT Gearbox Simple RUL Algorithm Concept

Annual Conference of the Prognostics and Health Management Society, 2010
10
planet gear bearing upper limit. These damage inspection limits will also be adequate to limit damage to other parallel stage bearings associated with the intermediate and low speed shafts, since their bearing dimensions are usually in a size range between the larger planet gear bearings and the smaller high speed shaft bearings. A lower or minimum gearbox damage inspection limit is required to initially identify a damaged component and also limit possible damage on existing gearboxes retrofitted with an ODM sensor.
5.3 Definition of WT Gearbox Damage Propagation
Model An ODM PHM damage propagation model should be defined based on the data available to estimate a gearbox damage propagation rate. Since the ODM can provide a measure of component damage progression as a function of time by means of accumulated counts, the rate of debris count generation is readily available to estimate the rate of damage progression. In situations, where only ODM data are available to the model, then the use of moving averages to generate a count rate propagation model is a simple and easily adjusted means of predicting a likely rate of damage progression. Since the operation of a wind turbine is highly variable with a wide range of loads being applied to the gearbox including conditions when the turbine may even be shut down for some period of time, this suggests that the estimated damage rate of progression be based on at least two moving averages for count rate – one derived over a short period of time and another derived over a long period of time. The advantage of a short term moving average is to respond to a count rate of change soon enough while the advantage of a long term moving average is to maintain an average count rate under variable conditions of wind turbine operation. The estimated damage propagation count rate is then set as a weighted average of the short and long term moving averages. This data driven propagation model concept is illustrated in Figure 14. The moving average equations are summarized as follows: MAS = [Cn+Cn-1+…+Cn-(S-1)] / S MAL = [Cn+Cn-1+…+Cn-(L-1)] / L MAW = (k) MAS + (1-k) MAL Where: MAS = short term moving average MAL = long term moving average MAW = weighted moving average C = daily accumulated counts n = current day
S = number of days for short term averaging L = number of days for long term averaging k = weighting factor between 0 and 1
5.4 Estimation of RUL to Damage Inspection
Limits The output of an ODM PHM application will be an estimate of the time to reach various pre-defined damage inspection limits and provide operators the opportunity to plan the gearbox inspections on a scheduled or convenient opportunistic maintenance basis to identify and confirm damage. The RUL estimation algorithm should not be initialized until a minimum debris count level has been reached to ensure that an average count rate propagation estimate is useful and can be made on sufficient historical data. Since a wind turbine gearbox has many bearing and gear components, it is not unlikely that damage can occur on one or more components. The use of several pre-defined gearbox damage inspection limits with estimates of RUL to reach them to identify or confirm damage, as shown in Figure 14, can improve the effectiveness of an existing operation and maintenance program for wind turbine gearboxes. This becomes especially attractive when a wind farm contains many wind turbines and each wind turbine is providing lots of data to be monitored on a continuous basis. When operating a wind turbine, an operator is continually trying to answer two key questions: Can I operate the wind turbine? If so, for how much longer?
6. ODM DERIVATION OF BEARING DAMAGE
INSPECTION LIMITS A suitable parameter for indicating severity of bearing damage is the total accumulated particle counts detected by the oil debris monitoring sensor, since a correlation can be defined between the accumulated particles counts detected by the sensor and the spall size on a damaged rolling element bearing as shown in Figure 15. If we imagine unfolding the spall, it’s essentially a rectangular area of damage with some average thickness for the missing material where the width of the spall is proportional to bearing roller width and the length of the spall is a function of the bearing mean diameter and the angle of spall. From available wind turbine gearbox damage data, analysis has determined that the ferrous debris particles counted as a bearing spalls are proportional to bearing geometry as follows:

Annual Conference of the Prognostics and Health Management Society, 2010
11
C = K A D w Where: C = Cumulative particle counts detected by the oil debris sensor K = Overall calibration constant dependent on the type of rolling element bearing & oil debris sensor used A = Spall angle along bearing race D = Bearing mean diameter (average of the inner and outer diameters of the bearing) w = Rolling element width Thus, the maximum severity of damage can be defined in terms of an equivalent maximum angle of spall as a function of basic bearing geometry.
7. APPLICATION OF ODM & PHM TO IN-
SERVICE WT GEARBOXES In the last five years, oil debris monitoring devices, such as the one shown in Figure 6, have been fitted to various wind turbine gearboxes in the 660 kW to 3 MW power range. To illustrate the application of the PHM concept described in Section 5, available ODM results from four wind turbine gearbox cases will be processed further to estimate RUL to the first pre-defined damage inspection limit which is set at 10% of the maximum pre-defined damage inspection limit for these gearboxes. Two of the cases are ODM applications on new gearboxes and two are ODM applications on existing gearboxes that have been in operation for several years. ODM and RUL results are presented in Figures 16 to 19. Each set of results presents the following: ODM cumulative counts as a function of time
relative to the damage inspection limit 1 (DIL1). Estimated RUL in days as a function of time to
reach the damage inspection limit 1 (DIL1). This is calculated as ODM cumulative counts remaining to reach DIL1 divided by the weighted moving average MAW defined in Section 5.3.
Actual RUL in days as a function of time to reach the damage inspection limit 1 (DIL1). In hindsight, this is calculated as the number of days remaining to actually reach DIL1.
The damage inspection limit 1 differs in Figures 18 and 19 from the one in Figures 16 and 17 due to the ODM sensor bore size. In Figures 16 and 17, a smaller bore sensor is used with a lower particle size detection threshold and, the lower the detection threshold the more debris particles are detected for a given amount of actual damage, and vice versa for Figures 18 and 19.
The simple RUL algorithm defined for these applications is based on averaging the results of two moving averages – a short term 7 day or weekly moving average and a long term 30 day or monthly moving average (i.e. setting k=0.5, S=7, L=30 in the equations in Section 5.3). The RUL estimates only begin to get calculated when the ODM cumulative counts reach approximately 20% of DIL1 – approximately 3100 counts in Figures 16 and 17 and 750 counts in Figures 18 and 19. This takes into consideration that build/assembly and/or wear-in debris may initially be present and this prevents it from influencing the RUL estimate in a non-meaningful way to some extent. Over time this debris is removed from the system by the filter or it settles out in the sump or possibly other gearbox locations. From experience with fielded wind turbine gearboxes, this amount of debris will vary; nevertheless, an estimate of 20% of DIL1 is often observed on average. In Figures 16 and 17, damage inspections revealed that the wind turbine gearboxes high speed shaft bearings had surface fatigue spalling damage. In Figure 16 this failure mode progressed more quickly to DIL1 - 3.5 months from mid October 2008 to the end of January 2009; whereas, in Figure 17 this failure mode progressed more slowly to DIL1 – 16.5 months from mid October 2008 to end of February 2010 (Note that period from mid October 2008 to mid October 2009 when debris counts increased from 0 to 3400 is not shown). In situ repairs on both of these wind turbine gearboxes were performed shortly after inspection. In Figures 18 and 19, damage inspections revealed that the wind turbine gearboxes’ planet gears, ring gear, and sun gear had surface fatigue pitting/spalling damage. These gearboxes had been in operation for several years and had been retrofitted with ODM systems, since the operator had begun to experience gearbox failures and needed to proactively manage the problem from that point on. In Figure 18, this failure mode progressed more quickly to DIL1 - 3 months from beginning of June 2009 to end of August 2009; whereas, in Figure 19 this failure mode progressed more slowly to DIL1 – 8.5 months from beginning of June 2009 to mid February 2010. In both cases, the gearboxes had to be replaced to avoid further damage in the planetary stage. In all of the cases presented in Figures 16 to 19, RUL algorithms based on simple moving averages using only ODM data do provide reasonable estimates of RUL to a pre-defined damage inspection limit. This has made it possible for operators to proactively plan their gearbox maintenance activities.

Annual Conference of the Prognostics and Health Management Society, 2010
12
Figure 15: Derivation of Bearing Spall Damage Limit
Figure 16: WT Gearbox Case 1 ODM & RUL Results
ODM Cumulative Counts & RUL to Damage Inspection Count Limit 1
0
2000
4000
6000
8000
10000
12000
14000
16000
18000
14-Oct-09 03-Nov-09 23-Nov-09 13-Dec-09 02-Jan-10 22-Jan-10 11-Feb-10 03-Mar-10
Date
OD
M C
umul
ativ
e C
ount
s.
0
20
40
60
80
100
120
140
160
180
200
RU
L D
ays
to L
imit
Cumulative Counts Damage Inspection Limit RUL Estimated RUL Actual
ODM Counts
RUL Actual
Damage Inspection Count Limit 1
RUL Estimated
Figure 17: WT Gearbox Case 2 ODM & RUL Results
ODM Cumulative Counts & RUL to Damage Inspection Count Limit 1
0
5000
10000
15000
20000
25000
11-Oct-08 31-Oct-08 20-Nov-08 10-Dec-08 30-Dec-08 19-Jan-09 08-Feb-09 28-Feb-09
Date
OD
M C
umul
ativ
e C
ount
s.
0
20
40
60
80
100
120
140
160
180
200
RU
L D
ays t
o L
imit
Cumulative Counts Damage Inspection Limit RUL Estimated RUL Actual
ODM Counts
RUL Actual
Damage Inspection Count Limit 1
RUL Estimated
Angle ofDamage
where:C = Cumulative particle counts detected by ODM sensor K = ODM Sensor Calibration Constant (counts/degree-mm2)A = Angle of spall damage (degrees)D = Planet bearing mean diameter (mm)w = Planet bearing rolling element width (mm)
CDAMAGE LIMIT = K A D w
Angle ofDamage
where:C = Cumulative particle counts detected by ODM sensor K = ODM Sensor Calibration Constant (counts/degree-mm2)A = Angle of spall damage (degrees)D = Planet bearing mean diameter (mm)w = Planet bearing rolling element width (mm)
CDAMAGE LIMIT = K A D w
Angle ofDamageAngle ofDamage
where:C = Cumulative particle counts detected by ODM sensor K = ODM Sensor Calibration Constant (counts/degree-mm2)A = Angle of spall damage (degrees)D = Planet bearing mean diameter (mm)w = Planet bearing rolling element width (mm)
CDAMAGE LIMIT = K A D w
where:C = Cumulative particle counts detected by ODM sensor K = ODM Sensor Calibration Constant (counts/degree-mm2)A = Angle of spall damage (degrees)D = Planet bearing mean diameter (mm)w = Planet bearing rolling element width (mm)
CDAMAGE LIMIT = K A D w
where:C = Cumulative particle counts detected by ODM sensor K = ODM Sensor Calibration Constant (counts/degree-mm2)A = Angle of spall damage (degrees)D = Planet bearing mean diameter (mm)w = Planet bearing rolling element width (mm)
CDAMAGE LIMIT = K A D w

Annual Conference of the Prognostics and Health Management Society, 2010
13
It should be noted that analysis of ODM wind turbine gearbox data for RUL estimation has only been possible recently given the availability of data. In Figures 16 to 19, the RUL algorithms based on simple moving averages can likely be improved by additional analysis of data to define appropriate probability distributions on past data. In addition, improvements are possible by including operational data such as generated power and rotor speeds when they become available as inputs to enhance the RUL algorithm, since it is known that load can significantly affect the damage progression rate of surface fatigue on bearings and gears. The wind energy industry is still growing rapidly
with more focus on ongoing development of new technology and not necessarily on the integration of all useful data for condition monitoring, prognostics and health management.
ODM Cumulative Counts & RUL to Damage Inpection Count Limit 1
0
500
1000
1500
2000
2500
3000
3500
4000
4500
5000
27-May-09 16-Jun-09 06-Jul-09 26-Jul-09 15-Aug-09 04-Sep-09 24-Sep-09 14-Oct-09
Date
OD
M C
umul
ativ
e C
ount
s.
0
20
40
60
80
100
120
140
160
180
200
RU
L D
ays
to L
imit
Cumulative Counts Damage Inspection Limit RUL Estimated RUL Actual
RUL Estimated
RUL Actual
ODM Counts
Damage Inspection Count Limit 1
Figure 18: WT Gearbox Case 3 ODM & RUL Results
ODM Cumulative Counts & RUL to Damage Inspection Count Limit 1
0
2000
4000
6000
8000
10000
12000
17-May-09 06-Jul-09 25-Aug-09 14-Oct-09 03-Dec-09 22-Jan-10 13-Mar-10 02-May-10
Date
OD
M C
umul
ativ
e C
ount
s
0
20
40
60
80
100
120
140
160
180
200
RU
L D
ays t
o L
imit
Cumulative Counts Damage Inspection Limit RUL Estimated RUL Actual
RUL Actual
ODM Counts
RUL Estimated
Damage Inspection Count Limit 1
Figure 19: WT Gearbox Case 4 ODM & RUL Results

Annual Conference of the Prognostics and Health Management Society, 2010
14
8. CONCLUSION Although a multi-stage wind turbine gearbox has many bearings and gears, it is still possible to monitor its health using a single oil debris monitoring sensor and estimate remaining useful life to pre-defined damage inspection limits for confirmation of damage at opportune times or in accordance with existing scheduled maintenance intervals. With oil debris monitoring, accumulated particle counts provide a good measure of damage severity for setting reliable pre-defined wind turbine gearbox damage inspection limits. Large wear debris greater than 200 um have provided sufficient early indications of bearing spall and gear pitting surface fatigue and quantification of the severity of damage progression to avoid failure. Oil debris particle count rates can vary with the speed and load of the wind turbine as well as due to other effects that can dislodge debris in bursts from time to time. Nevertheless, the rate of generation of particle counts can be used and processed to estimate remaining useful life to pre-defined damage inspection limits with reasonable accuracy. At this time, it is premature to introduce more complex gearbox damage propagation models until sufficient gearbox degradation and/or failure rate data are available and other useful data sources such as operational, maintenance, and other condition monitoring data can be integrated with ODM data.
REFERENCES Bolander et al, 2009. “Physics-based Remaining Useful
Life Prediction for Aircraft Engine Bearing Prognosis” Bolander N., Qiu H., Eklund N., Hindle E., Rosenfeld T. Annual Conference of PHM Society 2009
Dempsey P.J., 2000. “A Comparison of Vibration and
Oil Debris Gear Damage Detection Methods Applied to Pitting Damage” Dempsey P.J.NASA/TM-2000-210371
Dempsey et al, 2004. “Investigation of Gear and
Bearing Fatigue Damage Using Debris Particle Distributions” Dempsey P.J., Lewicki D.G., Decker H.J. NASA/TM-2004-212883
Forster et al, 2005. “Assessing the Potential of a
Commercial Oil Debris Sensor as a Prognostic Device for Gas Turbine Engine Bearings”Forster N.H., Thompson K., Toms A.M., Horning S. AFRL presentation at ISHM conference, August 2005, Cincinnati, OH
Harris, 1991. “Rolling Bearing Analysis 3rd edition” Harris T.A. John Wiley & Sons Inc, 1991. Kitaljevich and Veldhuizen, 2000. “Advanced Oil
Debris Montitoring for Pipeline Mechanical Drive Gas Turbines” Kitaljevich D. and Veldhuizen G.J. International Gas Turbine & Aerospace Conference, ASME 2000-GT-347, May 2000.
Kotzalas and Harris, 2001. “Fatigue Failure
Progression in Ball Bearings” Kotzalas M.N. and Harris T.A. ASME, Apr 2001.
Kuhnell, 2004. “Wear in Rolling Element Bearings and
Gears – How Age and Contamination Affect Them” Kuhnell B.T. Machinery Lubrication Magazine, Sep 2004.
Muir and Howe, 1996. “In-Line Oil Debris Monitor
(ODM) for the Advanced Tactical Fighter Engine”, Muir D., Howe B. SAE Paper 961308, 1996
SAE, 2005. “SAE” Aerospace Information Report -
Guide to Engine Lubrication System Monitoring” SAE AIR 1828 Rev. B, June 2005.
SKF. “Bearing Failures and their Causes” SKF Product Information 401 Toms and Toms, 2008. “Machinery Oil Analysis –
Methods, Automation & Benefits” Toms, Larry A. and Allison M. Toms 3rd Edition, STLE, Park Ridge, IL 2008, ISBN: 978-0-9817512-0-7
Wigglelinkhuizen et al, 2007. “Condition Monitoring
for Offshore Wind Farms (CONMOW)” Wigglelinkhuizen E.J., Rademakers L.W.M.M., Verbruggen T.W., Watson S.J., Xiang J., Giebel G., Norton E.J., Tipluica M.C., Christensen A.J., Becker E. ECN Doc #ECN-E-07-044/CORR0701, June 2007
Windpower 2005 Nov. “The Role of Bearings in
Gearbox Failure”, Windpower Monthly, November 2005

Annual Conference of the Prognostics and Health Management Society, 2010
15
Windpower, 2009 Jul. “A Shared Anniversary and Shared Ideals”, Andrew Garrard of Garrard Hassan Wind Power Monthly, 25th Anniversary Special, July 2009
Wind Today, 2006 Q3. “Operation, Maintenance, and
Safety”, (Impact on Costs, Reliability, and Feedback) Wind Today Third Quarter 2006
Wind Today, 2008 Q1. “Long-Term Operating Costs
Post-Warranty”, (Asset Management Can Control Expenses) Wind Today First Quarter 2008
Wright and Neale, 1987. “Wear-debris Analysis as an
Integral Component of Machinery Condition Monitoring” Wright G.J. and Neale M.J., Journal of the South African Institute of Mining and Metallurgy, Aug 1987.
Richard Dupuis is an Applications Engineering Specialist with GasTOPS and is presently responsible for applications engineering of the company’s products and services. He received his Bachelor of Science degree in Mathematics and Physics from Bishop’s University in 1975 and Bachelor of Applied Science degree in Mathematics and Mechanical Engineering from Queen’s University in 1979. He began his engineering career at Pratt & Whitney Canada working as a gas turbine engine dynamics analyst to predict engine component vibration response and conduct full-scale engine vibration tests. He joined GasTOPS in 1982 and has been involved in various projects in the controls, simulation and condition monitoring fields in the last 30 years. He has performed analysis, design, simulation, and tests of control and condition monitoring systems for aircraft, marine, and industrial drivetrain systems. He has made extensive use of dynamic analysis and modelling/simulation as a tool for both system design and troubleshooting. As the company began to develop condition monitoring products, he was also responsible for the management of product development, manufacturing, and customer support over several years.