application of nfo-go composite for the removal of acid
TRANSCRIPT
* Corresponding author.
1944-3994/1944-3986 © 2020 Desalination Publications. All rights reserved.
Desalination and Water Treatment www.deswater.com
doi:10.5004/dwt.2020.24884
174 (2020) 400–413January
Application of NFO-GO composite for the removal of Acid blue 25 toxic dye from aqueous solution
Taznur Ahmeda,*, Abdul Matin Alib, Susmita Sen Guptab
aDepartment of Chemistry, Science College, Kokrajhar, Pin: 783370, Assam, India, Tel. +91 9435125909; email: [email protected] bDepartment of Chemistry, B N College, Dhubri, Pin: 783327, Assam, India, Tel. +91 7002739569; email: [email protected] (A.M. Ali), Tel. +91 7086853035; [email protected] (S.S. Gupta)
Received 7 February 2019; Accepted 10 September 2019
a b s t r a c tIn this work, a facile one-step solvothermal approach to the synthesis of the NiFe2O4-graphene oxide composite was studied. The material was characterized by the X-ray diffraction, transmis-sion electron microscopy, Brunauer–Emmett–Teller surface area, zeta potential, and thermogravi-metric analysis measurement. The prepared material used for the adsorption of Acid blue 25 under various experimental conditions. The initial rapid adsorption of dye species attained an equilib-rium within 240 min. The interaction much more close to second-order kinetics with a rate constant 1.41 × 10⁻³ g mg–1 min–1. The Langmuir monolayer capacity of the interaction was 104.16 mg g–1. The interaction was endothermic with ∆H 64.319 kJ mol–1 accompanied by a rise in entropy and a decrease in Gibb’s free energy. Moreover, the activation energy (4.87 kJ mol–1) indicated the adsorption process might be physically controlled.
Keywords: Graphene oxide; Nanocomposite; Adsorption; Langmuir isotherm; Kinetics; Acid blue
1. Introduction
Water is the most precious and indispensable natu-ral resource on earth. Rapid industrialization and various human activities have been responsible for continuously contaminating water by adding different biodegradable and non-biodegradable, persistent, hazardous and toxic pollut-ants. Water is particularly vulnerable to contamination from the discharge of wastewaters by various industries. These toxic substances as contaminants enter into the food chain have intensified threatening deteriorations towards human health and living organism. Some of the pollutants such as dyes and pigments release to the water sources by textile, dye-ing, printing ink, leather, and other related industries. Among the known pollutants are dyes of various classes that not only affecting aesthetics merits but also reducing light penetration and photosynthesis in addition to carcinogenic effects. Azo
dye even in small amounts causes damage to aquatic biota or humans by mutagenic and it is also carcinogenic.
Among the different available treatment, adsorption tech nology draws much attention towards research due to its merits of effectiveness, efficiency, and economy [1]. Adsorption is a surface phenomenon, which arises due to interactions between the individual atoms, ions or mole-cules of an adsorbate and those present in the adsorbents surfaces. The process involves an array of phenomena that can alter the distribution of pollutants among the constituent phases and interfaces of the subsurface system, and convey the separation of a substance from one phase accompanied by its accumulation at the surface of another [2]. Various conventional and non-conventional adsorbents are used to remove different water pollutants. A few of them are zeo-lites [3], clay and clay minerals [4,5], inorganic oxides [6], etc. However, all these adsorbents have some disadvantages

401T. Ahmed et al. / Desalination and Water Treatment 174 (2020) 400–413
either in adsorption capacities or inconvenience in the sep-aration of the materials after loaded with the pollutants. Therefore, efforts are still needed to get the new promising adsorbent.
During the last few years, one form of carbon, namely, Graphene and its derivatives have acquired great inter-est as an adsorbent to treat wastewater. Graphene (GN), a two-dimensional material (2D), composed of a layer of carbon atoms packed into a honey network, long-range π-conjugation in graphene yields remarkable and unique properties, more important here is its theoretical surface area (2,630 m2 g–1) [7]. All these properties support graphene (GN) as an ideal building block in nano-composites. The high surface area of graphene improves interfacial contact with the other components. Furthermore, the large surface area of GN prevents the aggregation of secondary compo-nents, so that some unique properties in the nanoscale can be preserved [8]. The graphene and its metal oxide com-posites have been explored as adsorbents for the removal of pollutants [9,10]. Along with graphene, graphene oxide (GO) (a derivative of GN) has received great interest for the researcher as [11,12] because of its well organized sp2- hybridized carbon nanostructures and well spread higher specific negatively charged surface area that can be easily prepared from natural graphite by chemical oxidation- exfoliation-reduction procedure [13]. During the chemical oxidation process a huge number of oxygen-containing functional groups associated with the GO [14,15]. This modification on the surface structure made this substrate very ideal to anchor many inorganic nanoparticles for the increment of widespread [16,17].
Ferrite of the type MFe2O4 (M = Zn, Co, Mn, Ni, etc.) is magnetic materials with cubic spinel structure that are used in wide technological applications in the past decade [18,19]. NiFe2O4 is one of the most important spinel ferrites with an inverse spinel structure showing ferrimagnetism that originates from the magnetic moment of the anti-par-allel spin of between Fe3+ ion at the tetrahedral site and Ni2+ ion at the octahedral site [20]. NiFe2O4 is an interesting mag-netic material due to its chemical stability and mechanical hardness. Thus combining the advantage of graphene oxide composites (GOC) with magnetic NFOs particles to fabri-cate promising noble adsorbents opens a new possibility for the achievements of desirable absorptivity. Additionally, NFO-GO also shows the advantage of low toxicity, low cost, and eco-friendliness.
GO with varying oxygen-containing groups shows enor-mous adsorption property. Several researchers had reported the application of GO and graphene nano-sheet compos-ite in the adsorption field. Guo et al. [21] investigated the adsorption capacity of GO/polyethylenimine hydrogel for the adsorption of Rhodamine B (RhB) from aqueous solu-tion with the adsorption capacity of 114.41 mg g–1 and the process followed the pseudo-second-order kinetics. Wang et al. [22] studied the adsorption of fuchsine from the water on graphene-based magnetic nanocomposite yielded the Langmuir monolayer adsorption capacity of 49.46 mg g–1 followed pseudo-second-order kinetic. Tiwari et al. [23] had reported the adsorption capacity of 6.17 and 9.18 mg g–1 for Methylene blue and RhB respectively on the reduced GO-based hydrogels and the process preferably followed
the Freundlich isotherm. Wang et al. [24] had reported the adsorption capacity of 90, 66, 22, and 67 mg g–1 for phenol, catechol, resorcinol, and hydroquinone respectively on graphene aerogels mesoporous silica framework at 25°C with the contact time of 24 h.
However, few researchers were reported to work with graphene-based nanomaterials as an adsorbent for pollutant removal., Lu et al. [25] reviewed a good number of published works where the synthesis and use of various GO-based nanomaterial for the removal of pollutants from the aque-ous environment were incorporated. Wang et al. [22] used Fe3O4-GO nanocomposite as an adsorbent for the removal of fuchsine from aqueous solution. The use of GO/ZnO com-posite as a reusable adsorbent for pollutant management was also reported [26]. The synthesis and adsorptive use of super-paramagnetic GO-Fe3O4 hybrid composite were reported by Xie et al. [27].
Taking these advantages, the present work tried to under-stand the absorption mechanism for typical organic dye Acid blue 25 (AB 25) pollutant on the NiFe2O4-graphene oxide composite (NFO-GOC).
2. Materials and methods
2.1. Materials
Graphite powder, H2SO4, H3PO4, ethylene glycol (EG), Fe(NO3)3·9H2O, Ni(NO3)2·6H2O, NaOH, EtOH, were procured from Mark Chemical Laboratory Reagent Co. Ltd., (Worli, Mumbai) and used without further purification. The AB 25 (Molecular formula: C20H13N2NaO5S, CI Classifi-cation number: 62055) was also procured from Mark Chemical Laboratory Reagent Co. Ltd., (Worli, Mumbai). The structure of AB 25 is given in Fig. 1.
All chemicals used in this study were of commercially available analytical grade.
2.2. Synthesis of adsorbent
2.2.1. Preparation of GO
GO was synthesized by modified Hummers and Offe-man process [28,29] in which 1.5 g graphite flakes and 9.0 g KMnO4 were successfully added into a mixture of concen-trated H2SO4 and concentrated H3PO4 of ratio 9:1 by volume under continuous stirring. The mixture stirred for 12 h at 323 K. Finally, the mixture was cooled and poured slowly under vigorous stirring into the ice with 30% of H2O2, then the mixture was repeatedly washed with 30% HCl and ethanol and then dried it at 353 K.
2.2.2. Preparation of NiFe2O4
Nickel ferrite (NFO) was synthesized by following the procedure [30] where 2 mmol of Ni(NO3)2·6H2O and 4 mmol of Fe(NO3)3·9H2O were dissolved in 50 mL of EG. Separately 16 mmol of NaOH was dissolved in another 50 mL of EG. The solution of NaOH added to the solution of metal nitrate while stirring at room temperature causing an immediate color change. The mixture was stirred for 4 h. After then, a mixture of water and EG (1:10) was added in two equal por-tions while temperature raises during 1–1.5 h to 473–483 K.

T. Ahmed et al. / Desalination and Water Treatment 174 (2020) 400–413402
Finally, the temperature kept constant for further 1 h. The mixture cooled at room temperature and the precipitate separated and washed several times with methanol. It was then dried and calcined at 823 K. The dark brown powdered obtained as NiFe2O4.
2.2.3. In situ preparation of NFO-GOC
The prepared GO (0.9 g) was exfoliated by ultrasonication in 80 mL of EG for more than 3 h. 1.72 g of Fe(NO3)3·9H2O, 0.95 g of Ni(NO3)2·6H2O and1.5 g of NaOH then dissolved in GO-EG solution at ambient temperature. After stirring for about 30 min, the solution was transferred into 100 mL Teflon-lined stainless-steel autoclave and kept at 473 K for about 6 h followed by cooling at ambient temperature naturally. The black precipitate centrifuged, washed several times by EtOH and finally dried at 333 K in a vacuum oven.
2.3. Adsorption of dye
The adsorption of dye in aqueous solution on the pre-pared NFO-GOC was performed in a batch experiment. In the typical process, the adsorbent of the fixed amount was added into 50 mL of dye solution of desired initial concen-tration and allowed to shake in a thermostated water bath shaker (Superior Scientific Industries, Timber Market, Ambala, Haryana, India, ISO 9001:2008) for a pre-fixed time. At the pre-determined time interval, the solution separated from the mixture by centrifugation. The concentration of dye in the supernatant solutions was measured by a visible spectrom-eter (Elico Limited SL 177, Hyderabad, Andhra Pradesh).
The amount of dye adsorbed per unit mass of adsorbent (q) and the extent of adsorption (%) was calculated by using the mass balanced equation:
qC C Vm
e=−( )0 (1)
Extent of adsorption %( ) = −( )
×
C CC
e0
0
100 (2)
where q was (mg g–1) the amount of adsorbate adsorbed per gram of the adsorbent. C0 (mg L–1) and Ce (mg L–1) was the initial and equilibrium concentration of dye. V was the vol-ume of the solution taken during an experiment in L and m was mass of the adsorbent in g. The adsorption was studied under various experimental conditions of initial dye concen-trations, adsorbent load, interaction time, pH and solution temperature. The different experimental variables are listed in Table 1. The reusability investigation of the adsorbent for its adsorption capacity was carried out after the desorption of loaded adsorbents.
2.4. Characterization of adsorbent
The powdered X-ray diffraction (XRD) measurement was recorded using Bruker AXS (Germany) X-ray powder diffractometer Model D8 by focusing on monochromatized Cu Kα radiation of wavelength 0.15418 nm with a step size of 0.02° (2θ). The specific surface areas, pore diameter and pore volume of NFO-GO composite were determined by Brunauer–Emmett–Teller (BET) N2 gas methods using auto-mated gas sorption analyzer (Quantachrome® ASiQwin™ Instrument, NOVA-1000 Version 3.70, ANTON PAAR INDIA PVT. LTD., Gurgaon, Haryana, India). The high-res-olution transmission electron microgram (HRTEM) image and energy dispersive X-ray (EDX) were obtained by using a JEOL JEM-2100 instrument for the morphological surface (JEOL Ltd., Akishima, Tokyo, Japan). The zeta potential was measured (Zeta sizer, Malvern) to know the nature of charges at the surface. The thermogravimetric analysis (TGA) was carried out to study the thermal stability.
Fig. 1. Structure of AB 25.
Table 1Experimental conditions for adsorption study
Sl. No. Parameter for adsorption process Experimental set-up
1 Influence of time Adsorbent 0.1 g L–1, dye concentration 10 mg L–1, pH 6.5, temperature 303 K, time 10–240 min
2 Influence of dye concentration Adsorbent 0.1 g L–1, pH 6.5, time 240 min, temperature 303 K, dye concentration 10–30 mg L–1
3 Influence of adsorbent load Dye concentration 10 mg L–1, pH 6.5, temperature 303 K, time 240 min, adsorbent 0.02–0.18 g L–1
4 Influence of pH Adsorbent 0.1 g L–1, dye concentration 10 mg L–1, temperature 303 K, time 240 min, pH 2.0–11.0
5 Influence of temperature Adsorbent 0.1 g L–1, dye concentration 10 mg L–1, time 240 min, pH 6.5, temperature 303–333 K

403T. Ahmed et al. / Desalination and Water Treatment 174 (2020) 400–413
3. Results and discussion
3.1. Adsorbent characterization
3.1.1. XRD analysis
The XRD pattern of NiFe2O4 and NFO-GOC and GO are shown in Fig. 2. All the detectable peaks were indexed and the data found similar to that for the standard data for the inverse spinel structure of NiFe2O4 (JCPDS 86-2267) [31]. The NFO-GOC showed a broad peak at a 2θ value of 25.1° corresponding to the interplanar spacing of 0.36 nm. The interplanar spacing (dhkl-value) for the peak located at 30.4°, 35.7°, 39.1°, 43.4°, 53.9°, and 57.4° are 0.29, 0.25, 0.23, 0.20, 0.17 and 0.16 nm corresponding to the planes (220), (311), (222), (400), (422), and (511). The crystals sizes of the NFO-GO composite calculated by using Scherrer equation’s (Dp = 0.94λ/(β1/2Cosθ), where λ is the wavelength for the of Cu Kα radiation, θ is the diffraction angle, β1/2 is full width at half maximum [32] from X-ray line broadening reflec-tion as 11.48, 5.72, 6.99, 7.02, and 12.84 nm, respectively. The average crystal size is 8.74 nm.
3.1.2. High-resolution transmission electron microgram
The HRTEM analysis of the NFO-GO composite (Fig. 3) indicated that the NFO particle was incorporated within the GO sheets. The particle of various sizes (6.99, 11.4, and 12.8 nm, etc.) were well distributed throughout the GO sheet, which were of a good agreement to that of the particle size calculated from the XRD experiment. The spacing within the lattice fringes in the HRTEM images were 0.17, 0.20, 0.23, 0.25, 0.29, and 0.34 nm which can be assigned to the plane (422), (400), (222), (311), (220) and the spacing of the GO (002) plane. The interplanar spacing (dhkl-value) and the ring pat-tern are consistent with the XRD data.
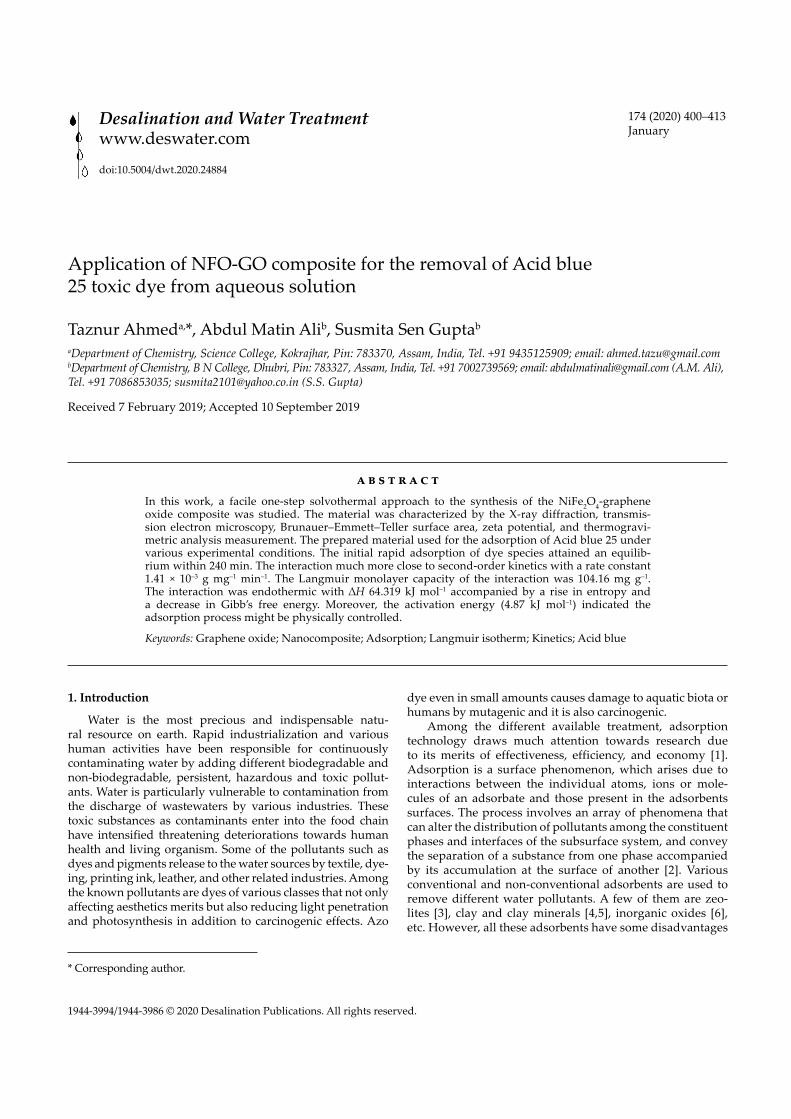
3.1.3. EDX analysis
EDX analysis (Fig. 4) confirms the presence of nickel, iron, oxygen, and carbon elements in this nanocomposite.
3.1.4. Surface area determination
The surface area of the adsorbent NFO-GO was determined by BET analysis. The BET analysis for the microstructural parameter of NFO-GO composite was characterized using N2 adsorption–desorption isotherm (Fig. 5). The isotherm exhibited wider hysteresis loop at high relative pressure indicate type I according to International Union of Pure and Applied Chemistry classification, the feature of the isotherm revealed that the NFO-GO composite present high adsorp-tion performance with narrow slit pores.
The pore size distribution (Fig. 5, inset) showed that the pore size exhibited a very narrow distribution. The compos-ite (NFO-GO) possessed well-developed BET specific surface areas 88.027 m2 g–1 whereas the specific surface area of GO as reported was 31.4 m2 g–1 [33], the total pore volume of 0.131 cc g–1 and average pore diameter of 3.48 nm calculated from the corresponding nitrogen isotherm.
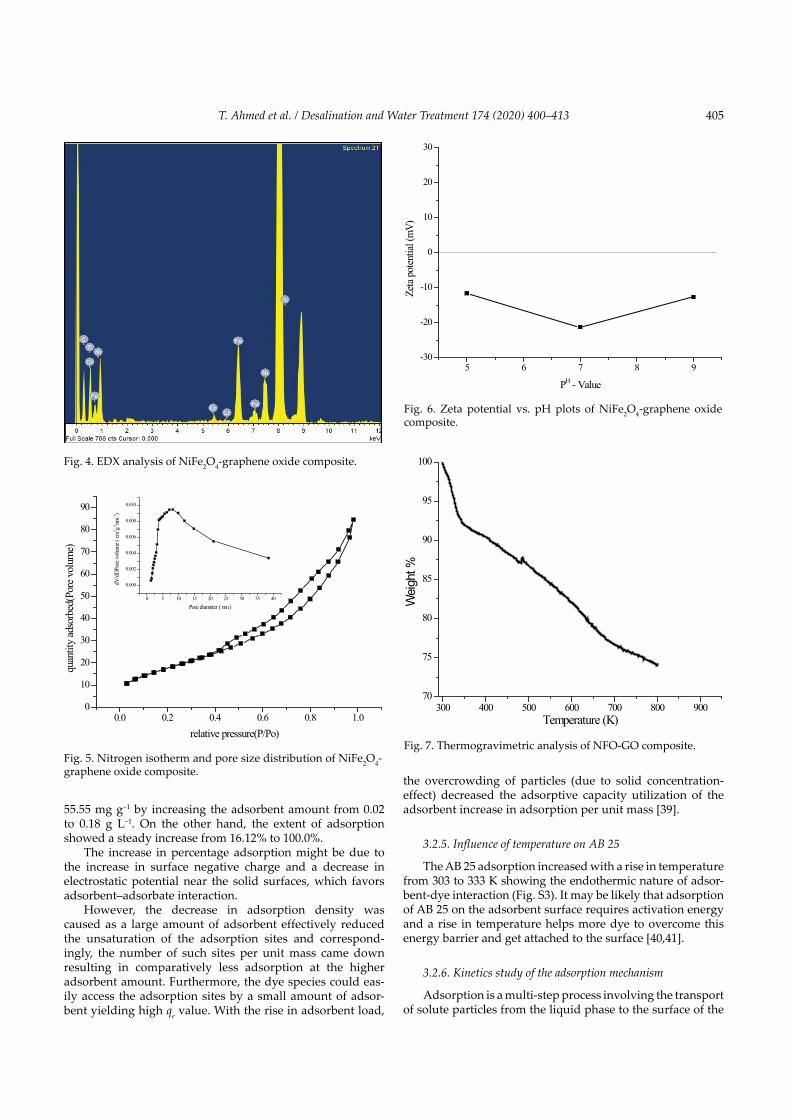
3.1.5. Zeta potential analysis
The measurement of zeta potential showed that the NFO-GO composite did not possess the zero point charge within the pH range (~5.0 to 9.0) used in the study, indicat-ing the negative surface charge of the adsorbent. The zeta potential values to the pH value are depicted in Fig. 6.
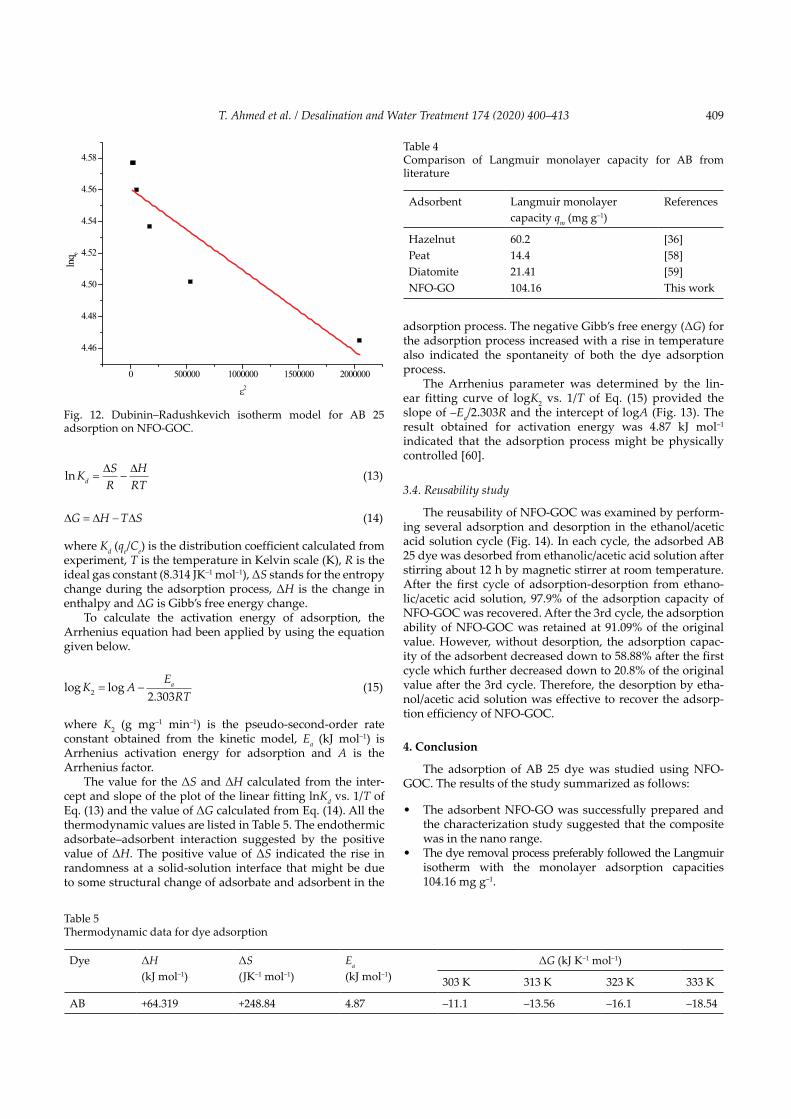
3.1.6. Thermogravimetric analysis
TGA of NFO-GOC showed that a weight loss of ~10% occurred up to 373 K this might be due to loss of water vapors. In the temperature range 373 to 800 K, weight loss of about 23% was observed, which might be due to the oxidation of car-bon [34]. The approximate weights of nearly 67% found after oxidation, which related to the weight of NFO-GO. The weight percentages of NFO-GO to temperature plotted in Fig. 7.
3.2. Adsorption study
3.2.1. Influence of time
The influenced of time for adsorption of AB 25 by the NFO-GO and NFO was performed at room temperature (303 K) and depicted in Fig. 8a. This adsorption parameter was investigated for three different experimental sets up and the results obtained with the error bars are explained in Fig. 8b.
In the case of NFO, the maximum qe value found to be 2.381 mg g–1 (240 min). The adsorption process attained an equilibrium within 240 min. The maximum adsorption occurred during the onset of the adsorption and then slowed down by attaining an equilibrium within 240 min. The max-imum adsorption at initial periods might be due to the more number of available active sites present in the adsorbent, which facilitated the dye molecule to attach the adsorbent effi-ciently. With the passes of time, the number of available active sites declined and the process attained equilibrium [35,36].
3.2.2. Influence of pH on AB 25
The pH of the solution is one of the important parameters of any adsorption process. Adsorption of AB 25 preferred at
0 10 20 30 40 50 60 70 80
GO 002
(c) GO
(b) NFO-GOC
(a) NFO
2θ
rGO
002
533
62044
0
511
422
400
222
311
220 Offs
et Y
val
ues
Fig. 2. XRD plots of (a) NiFe2O4 composite, (b) NiFe2O4-graphene oxide composite, and (c) graphene oxide.

T. Ahmed et al. / Desalination and Water Treatment 174 (2020) 400–413404
lower pH [37]. At this stage, more H+ ions were available in the solution, which might be attracted by the partial nega-tively charge of the adsorbate and developed the perma-nent positive site at the adsorbate molecule. Hence, it was observed that the dye molecule more easily attracted by the negative surface (suggested by Zeta potential measurement) of the adsorbent. However, at higher pH, the partial positive site of adsorbate molecule attacked by the OH– ion in the solution, which diminishing the positive character and hence decreased its affinity towards adsorbent sites, yielding lower adsorption (Fig. 9).
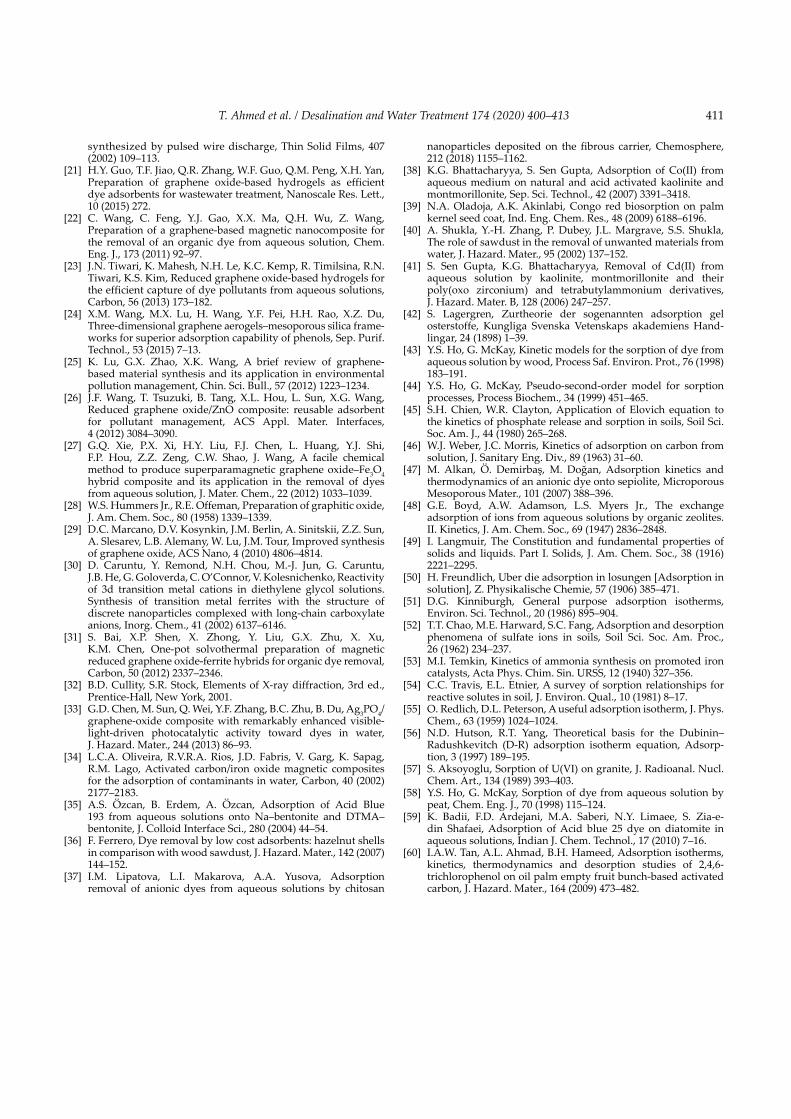
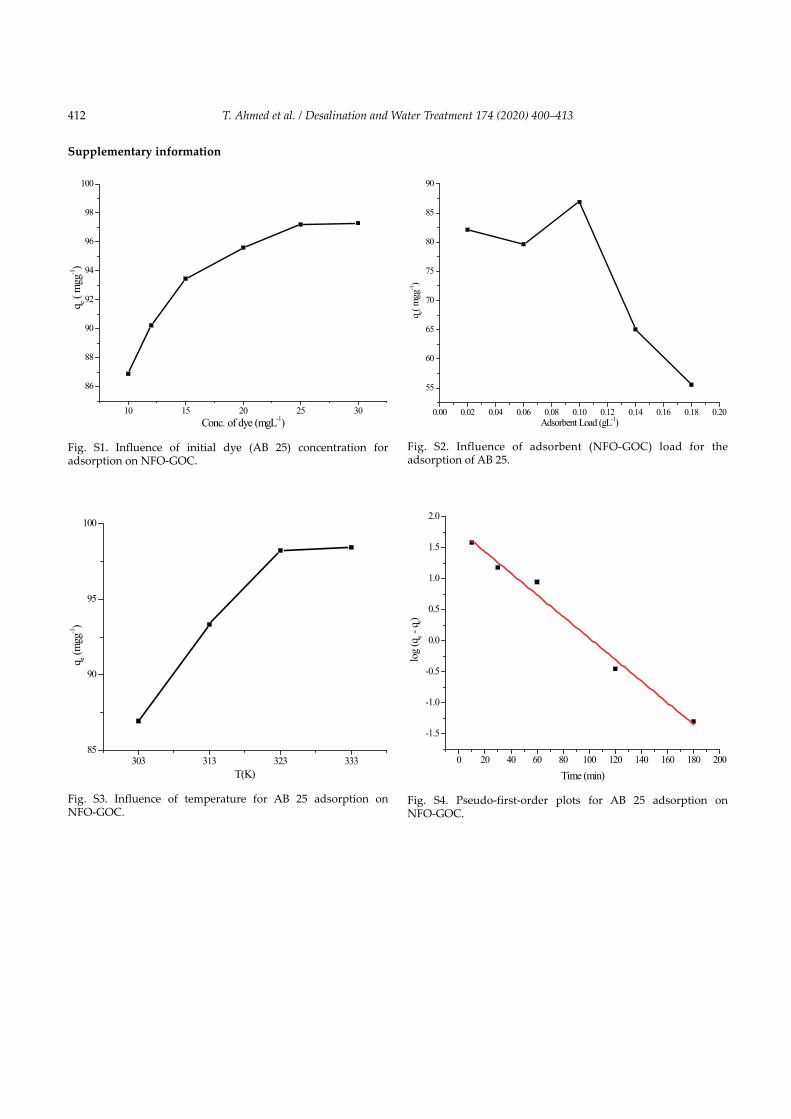
3.2.3. Influence of initial AB 25 concentration
The adsorption of AB 25 per unit mass of adsorbent increased from 86.89 to 97.30 mg g–1 by increasing the dye
concentration from 10 to 30 mg L–1 (Fig. S1). By increasing the dye concentration, the higher driving force provided to overcome the mass transfer resistance of dye between the aqueous phase and the solid phase, resulting in more collision between the dye molecule and solid phase of the adsorbent. At high dye concentration, the unit mass of the adsorbents exposed to a larger number of dye species and progressively higher numbers of dyes taken up with the gradual filling up of the appropriate binding sites. This increased the qe although the net adsorption comes down [38].
3.2.4. Influence of adsorbent load
Fig. S2 represents the influence of variation of adsorbent load on the removal of AB 25. The amount of dye adsorbed per unit mass of the adsorbent (qe) decreased from 82.12 to
Fig. 3. HRTEM images of NiFe2O4-graphene oxide composite (a) NiFe2O4 particle on GO sheet, (b,c) particle size distribution, (d,e) different plane of crystal, and (f) diffraction image of NiFe2O4-graphene oxide composite.
405T. Ahmed et al. / Desalination and Water Treatment 174 (2020) 400–413
55.55 mg g–1 by increasing the adsorbent amount from 0.02 to 0.18 g L–1. On the other hand, the extent of adsorption showed a steady increase from 16.12% to 100.0%.
The increase in percentage adsorption might be due to the increase in surface negative charge and a decrease in electrostatic potential near the solid surfaces, which favors adsorbent–adsorbate interaction.
However, the decrease in adsorption density was caused as a large amount of adsorbent effectively reduced the unsaturation of the adsorption sites and correspond-ingly, the number of such sites per unit mass came down resulting in comparatively less adsorption at the higher adsorbent amount. Furthermore, the dye species could eas-ily access the adsorption sites by a small amount of adsor-bent yielding high qe value. With the rise in adsorbent load,
the overcrowding of particles (due to solid concentration- effect) decreased the adsorptive capacity utilization of the adsorbent increase in adsorption per unit mass [39].
3.2.5. Influence of temperature on AB 25
The AB 25 adsorption increased with a rise in temperature from 303 to 333 K showing the endothermic nature of adsor-bent-dye interaction (Fig. S3). It may be likely that adsorption of AB 25 on the adsorbent surface requires activation energy and a rise in temperature helps more dye to overcome this energy barrier and get attached to the surface [40,41].
3.2.6. Kinetics study of the adsorption mechanism
Adsorption is a multi-step process involving the transport of solute particles from the liquid phase to the surface of the
Fig. 4. EDX analysis of NiFe2O4-graphene oxide composite.
5 6 7 8 9-30
-20
-10
0
10
20
30
Zeta
poten
tial (
mV)
PH - Value
Fig. 6. Zeta potential vs. pH plots of NiFe2O4-graphene oxide composite.
300 400 500 600 700 800 90070
75
80
85
90
95
100
Wei
ght %
Temperature (K)
Fig. 7. Thermogravimetric analysis of NFO-GO composite.
0.0 0.2 0.4 0.6 0.8 1.00
10
20
30
40
50
60
70
80
90
0 5 10 15 20 25 30 35 40
0.000
0.002
0.004
0.006
0.008
0.010
quan
tity
adso
rbed
(Por
e vol
ume)
relative pressure(P/Po)
dV/d
DPor
e vol
ume (
cm3 g-1
nm-1)
Pore diameter ( nm )
Fig. 5. Nitrogen isotherm and pore size distribution of NiFe2O4-graphene oxide composite.

T. Ahmed et al. / Desalination and Water Treatment 174 (2020) 400–413406
solid phase of adsorbent followed by diffusion into the inte-rior of the pore that might be a slow process. This idea led to study the kinetics of dye adsorption, by applying the experi-mental data to various kinetic models, namely, Lagergren pseudo-first-order, second-order, Elovich, intra-particle dif-fusion, and liquid film diffusion kinetic model.
3.2.6.1. Pseudo-first and second-order kinetics
To understand the kinetics and adsorption mechanism, the pseudo-first-order and pseudo-second-order model were applied by Eqs. (3) and (4) respectively to the adsorption of dye on the NFO-GO composite [42–44]. The equations for the models are:
log log.
q q qK t
e t e−( ) = − 1
2 303 (3)
tq K q
tqt e e
= +1
22 (4)
where qe and qt are dye absorbed (mg g–1) at equilibrium and at any time t (min) in the adsorption process, respectively. K1 (min–1) and K2 (g mg–1 min–1) were the rate constant for the pseudo-first-order and pseudo-second-order model, respectively. The linear fitting curve of log(qe – qt) vs. t and t/qt vs. t representing pseudo-first-order (Fig. S4) and pseudo- second-order (Fig. 10) kinetics model, respectively.
It was observed that the calculated qe value (qe,cal.) obtained from the first-order kinetics model did not agree with the experimental data (qe,exp.) having a deviation of 30.61%. However, the deviation in the case of the second- order model was comparatively less (–3.86%), indicating the proximity of the experimental value to that of a theoretical one. The small deviations obtained in the case might be due to some exper-imental error. However, the adsorption process was much
more akin to the second-order kinetics. The information obtained from the pseudo-second-order model at various temperatures in Table 2.
3.2.6.2. Elovich equation
The Elovich equation [45] was related to the adsorption process by assuming that (i) solid surface is energetically heterogeneous and (ii) neither desorption nor interaction between the adsorbed species could substantially affect the kinetics of adsorption at low surface coverage. The equation can be expressed as:
q tt =
( ) +
1 1β
αββ
ln ln (5)
The parameter α could be considered as the initial rate at t = 0 (dqt/dt = α) and β was the Elovich constant. The lin-earity of the qt vs. lnt plots (Eq. (5)) shows good agreement for accurate measurement of the kinetics parameter of the Elovich equation. The suggested values from the plots for the correlation coefficient, the constant α (adsorption co- efficient) and β (desorption coefficient) were R = 0.946 (low), 9.52 mg g–1 min–1 and 8.4 × 10⁻² g mg–1, respectively.
3.2.6.3. Intra-particle diffusion
In the case of porous adsorbent, the diffusion of adsor-bates molecules or ions into the pores of adsorbent cannot deny. Thus, it was also taken into account to find out the suitable kinetic model for the adsorption process. The intra- particle diffusion model was simplified by Weber and Morris [46,47] as expressed by:
q k t Ct i= +0 5. (6)
(a)
0 50 100 150 200 2500
10
20
30
40
50
60
70
80
90
100 NFO NFO-GOC
q e (m
gg-1)
Time (min)
(b)
Fig. 8. (a) Influence of time (min) for the adsorption of AB 25 on NFO and NFO-GOC and (b) influence of time (min) for the adsorption of AB 25 on NFO-GOC with error bars.

407T. Ahmed et al. / Desalination and Water Treatment 174 (2020) 400–413
where ki (mg g–1 min0.5) was the rate parameter for intra-particle diffusions. The data obtained were ki (2.75 mg g–1 min0.5) the rate parameter at stage i, constant C could be calculated from the linearity of the plots qt vs. t0.5 (Eq. (6)) and interpreted as boundary layer effect. The high values of intercept (50.73 mg g–1) suggested that the intra-particle diffusion might not play any significant role in the overall dye adsorption process.
3.2.6.4. Liquid film diffusion
The liquid film mass transfer rate equation was repre-sented [48] by Eq. (7):
− −
=ln 1
K tt
ed (7)
where Kd (min–1) is the rate parameter for liquid film diffu-sions. The linear fitting plots of Eq. (7) (Fig. S5) revealed that the liquid film diffusion process followed partially in the adsorption with intercept + 0.36 and liquid film diffusion constant 0.04 min–1, indicating that the liquid film diffu-sion might play some roles in the overall dye adsorption mechanism.
3.2.7. Adsorption isotherm
Adsorption allows the accumulation of chemical species into the solid phase of the adsorbent and interfaces between them. The empirical isotherm models provide information about the experimental finding. The different isotherm mod-els applied to describe an adsorption process are Langmuir/Freundlich, Temkin, and Dubinin–Radushkevich (D-R) iso-therm model.
3.2.7.1. Langmuir and Freundlich isotherm
The adsorption isotherm for the adsorption of dye on NFO-GO composite at room temperature investigated for Langmuir [49] and Freundlich [50] isotherm. The linear form of Langmuir [51] and Freundlich [52] equation expressed by Eqs. (8) and (9), respectively.
2 4 6 8 10 12
40
50
60
70
80
90
100
q e(m
gg-1)
pH
Fig. 9. Influence of pH for adsorption of AB 25 on NFO-GOC.
0 30 60 90 120 150 180 210 240 270
0.0
0.5
1.0
1.5
2.0
2.5
3.0
t/qt (
min
gmg-1
)
Time (min)
At 303 K At 313 K At 323 K At 333 K
Fig. 10. Pseudo-second-order plots for AB 25 adsorption on NFO-GOC.
Table 2Kinetic parameters for the AB adsorption
Pseudo-first-order kinetics
C0 (mgL–1) K1 (min–1) qe,cal. (mg g–1) qe,exp. (mg g–1) Deviation (%) R
10 3.98 × 10⁻² 60.29 86.89 30.61% –0.983
Pseudo-second-order kinetics
C0 (mgL–1) Temperature (K) K2 (g mg–1 min–1) qe,cal. (mg g–1) qe,exp. (mg g–1) Deviation (%) R10 303 1.41 × 10⁻³ 90.25 86.89 –3.86% +0.999
313 1.52 × 10⁻³ 95.88 93.21 –2.86%323 1.58 × 10⁻³ 99.8 97.23 –2.64%333 1.69 × 10⁻³ 100.6 98.19 –2.45%

T. Ahmed et al. / Desalination and Water Treatment 174 (2020) 400–413408
Cq
Cq bq
e
e
e
m m
= +1 (8)
log loglog
q kCne f
e( ) = +( )
(9)
where Ce (mg L–1) is the equilibrium concentration of the dye solution, qe (mg g–1) is equilibrium adsorption capacity, qm (mg g–1) is the Langmuir theoretical saturation adsorp-tion capacity and b is Langmuir constant. In the Freundlich equation, the kf (mg1–1/n L1/n g–1) is the binding energy constant reflecting the affinity of adsorbent to dye molecule and n is the Freundlich constant.
The linear fitting curves (i) Ce/qe vs. Ce and (ii) logqe vs. logCe of dye adsorption for the Langmuir and Freundlich iso-therm model were plotted. The isotherm values along with the correlation coefficients listed in Table 3. The experimen-tal value fitted better with the Langmuir isotherm model (Fig. 11) then the Freundlich isotherm model (Fig. S6). The Langmuir adsorption monolayer capacity calculated was 104.16 mg g–1 for AB 25.
3.2.7.2. Temkin isotherm study
Temkin assumes that due to adsorbent–adsorbate inter-action the heat of adsorption of all molecules decreases linearly with coverage. The adsorption process could be characterized by uniform binding energy up to maximum binding energy [53]. Temkin Isotherm could be applied in the adsorption process as described in the linear form [54] by Eq. (10).
q RTb
A CeT
T e= +( )2 303. log log (10)
where RT/bT = B (J mol–1) is the Temkin constant corresponds to sorption, AT (g–1) was the equilibrium binding constant corresponding to maximum binding energy, R (JK–1 mol–1) is the gas constant and T is the temperature of the solution in Kelvin (K).
The information obtained from the linear fitting qe vs. logCe curve for Temkin isotherm showed correlation co-efficient value, R = 0.949 that appreciated the monolayer adsorption of AB 25 on NFO-GO.
3.2.7.3. D-R isotherm model
The D-R isotherm [55] equation with its numerous mod-ifications plays an important role in the adsorption process characteristics of porous adsorbent with a wide range of pore size and shape [56]. The linear form of the D-R isotherm equation and the energy equation for desorption are depicted in Eqs. (11) [57] and (12), respectively.
ln lnq q Ke s= − drε2 (11)
E K= ( )−20 5
dr
. (12)
where qs (mg g–1) is the D-R theoretical saturation capacity, Kdr (mol2/J2) is D-R isotherm constant related to free energy, ε is the Polanyi potential, defined as ε = RTln(1 + 1/Ce) and E (kJ mol–1) is the energy per molecule of the adsorbate for removing a molecule from its location at the sorption site to infinity.
The values of the parameter (Table 3) from the linear fitting lnqe vs. ε2 curve (Fig. 12) for D-R isotherm are qs = 95.63 mg g–1 and E = 3.12 kJ mol–1. This suggested the physical adsorption of AB 25 on the adsorbent.
The comparison of Langmuir monolayer capacity of var-ious adsorbent for the adsorption of AB 25 listed in Table 4.
3.3. Thermodynamic study
The thermodynamics parameter ΔH, ΔS, ΔG for the adsorption process of dye on the adsorbent were computed by the equation.
Table 3The correlation coefficient for the adsorption isotherm of Acid blue 25 adsorption
Langmuir isothermb qm (mg g–1) R0.12 104.16 0.999
Freundlich isothermn kf (mg1–1/n L1/n g–1) R11.79 70.79 0.952
Temkin isotherm
AT (g–1) B (J mol–1) R1,151.97 9.437 0.949
Dubinin–Raduschkevich Isotherm
qs (mgg–1) E (kJ mol–1) R95.63 3.12 0.875
10 15 20 25 30
0.10
0.15
0.20
0.25
0.30
C e/qe(g
L-1)
Ce(mgg-1)
Fig. 11. Langmuir isotherm model for AB 25 adsorption on NFO-GOC.
409T. Ahmed et al. / Desalination and Water Treatment 174 (2020) 400–413
lnK SR
HRTd = −
∆ ∆ (13)
∆ ∆ ∆G H T S= − (14)
where Kd (qe/Ce) is the distribution coefficient calculated from experiment, T is the temperature in Kelvin scale (K), R is the ideal gas constant (8.314 JK–1 mol–1), ΔS stands for the entropy change during the adsorption process, ΔH is the change in enthalpy and ΔG is Gibb’s free energy change.
To calculate the activation energy of adsorption, the Arrhenius equation had been applied by using the equation given below.
log log.
K AERTa
2 2 303= − (15)
where K2 (g mg–1 min–1) is the pseudo-second-order rate constant obtained from the kinetic model, Ea (kJ mol–1) is Arrhenius activation energy for adsorption and A is the Arrhenius factor.
The value for the ΔS and ΔH calculated from the inter-cept and slope of the plot of the linear fitting lnKd vs. 1/T of Eq. (13) and the value of ΔG calculated from Eq. (14). All the thermodynamic values are listed in Table 5. The endothermic adsorbate–adsorbent interaction suggested by the positive value of ΔH. The positive value of ΔS indicated the rise in randomness at a solid-solution interface that might be due to some structural change of adsorbate and adsorbent in the
adsorption process. The negative Gibb’s free energy (ΔG) for the adsorption process increased with a rise in temperature also indicated the spontaneity of both the dye adsorption process.
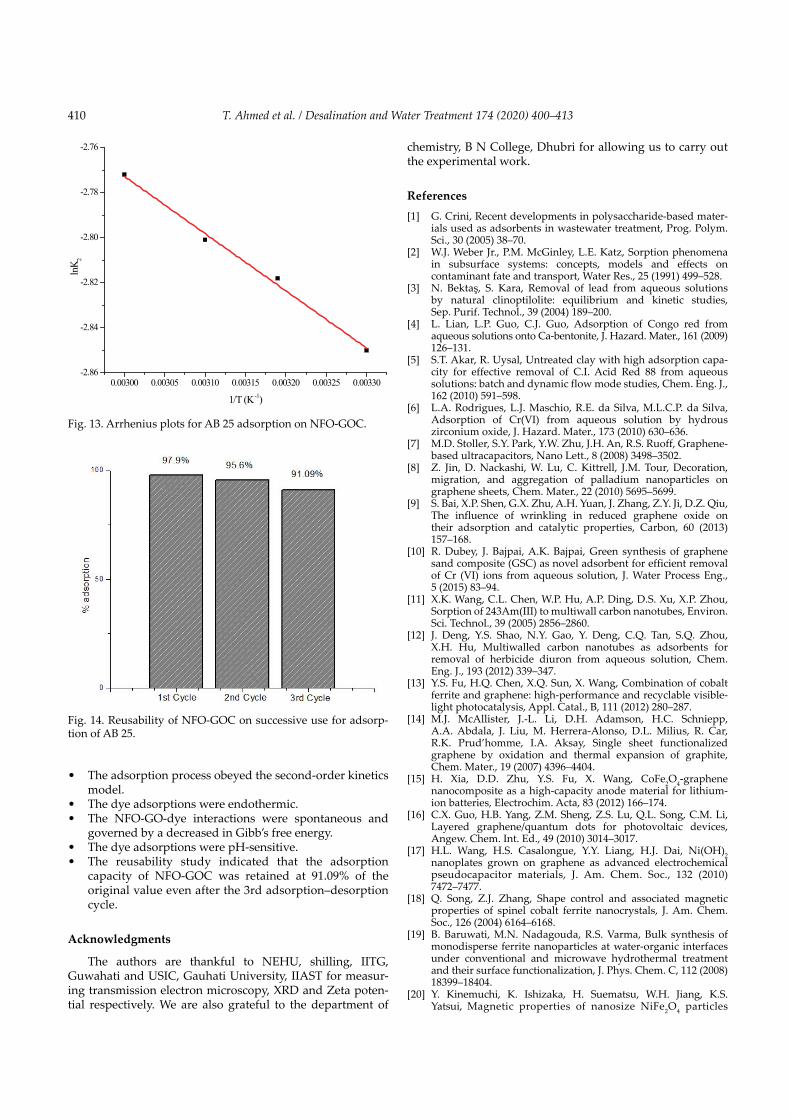
The Arrhenius parameter was determined by the lin-ear fitting curve of logK2 vs. 1/T of Eq. (15) provided the slope of –Ea/2.303R and the intercept of logA (Fig. 13). The result obtained for activation energy was 4.87 kJ mol–1
indicated that the adsorption process might be physically controlled [60].
3.4. Reusability study
The reusability of NFO-GOC was examined by perform-ing several adsorption and desorption in the ethanol/acetic acid solution cycle (Fig. 14). In each cycle, the adsorbed AB 25 dye was desorbed from ethanolic/acetic acid solution after stirring about 12 h by magnetic stirrer at room temperature. After the first cycle of adsorption-desorption from ethano-lic/acetic acid solution, 97.9% of the adsorption capacity of NFO-GOC was recovered. After the 3rd cycle, the adsorption ability of NFO-GOC was retained at 91.09% of the original value. However, without desorption, the adsorption capac-ity of the adsorbent decreased down to 58.88% after the first cycle which further decreased down to 20.8% of the original value after the 3rd cycle. Therefore, the desorption by etha-nol/acetic acid solution was effective to recover the adsorp-tion efficiency of NFO-GOC.
4. Conclusion
The adsorption of AB 25 dye was studied using NFO-GOC. The results of the study summarized as follows:
• The adsorbent NFO-GO was successfully prepared and the characterization study suggested that the composite was in the nano range.
• The dye removal process preferably followed the Langmuir isotherm with the monolayer adsorption capacities 104.16 mg g–1.
0 500000 1000000 1500000 2000000
4.46
4.48
4.50
4.52
4.54
4.56
4.58
lnq e
ε2
Fig. 12. Dubinin–Radushkevich isotherm model for AB 25 adsorption on NFO-GOC.
Table 4Comparison of Langmuir monolayer capacity for AB from literature
Adsorbent Langmuir monolayer capacity qm (mg g–1)
References
Hazelnut 60.2 [36]Peat 14.4 [58]Diatomite 21.41 [59]NFO-GO 104.16 This work
Table 5Thermodynamic data for dye adsorption
Dye ΔH (kJ mol–1)
ΔS (JK–1 mol–1)
Ea (kJ mol–1)
ΔG (kJ K–1 mol–1)
303 K 313 K 323 K 333 K
AB +64.319 +248.84 4.87 –11.1 –13.56 –16.1 –18.54
T. Ahmed et al. / Desalination and Water Treatment 174 (2020) 400–413410
• The adsorption process obeyed the second-order kinetics model.
• The dye adsorptions were endothermic.• The NFO-GO-dye interactions were spontaneous and
governed by a decreased in Gibb’s free energy.• The dye adsorptions were pH-sensitive.• The reusability study indicated that the adsorption
capacity of NFO-GOC was retained at 91.09% of the original value even after the 3rd adsorption–desorption cycle.
Acknowledgments
The authors are thankful to NEHU, shilling, IITG, Guwahati and USIC, Gauhati University, IIAST for measur-ing transmission electron microscopy, XRD and Zeta poten-tial respectively. We are also grateful to the department of
chemistry, B N College, Dhubri for allowing us to carry out the experimental work.
References[1] G. Crini, Recent developments in polysaccharide-based mater-
ials used as adsorbents in wastewater treatment, Prog. Polym. Sci., 30 (2005) 38–70.
[2] W.J. Weber Jr., P.M. McGinley, L.E. Katz, Sorption phenomena in subsurface systems: concepts, models and effects on contaminant fate and transport, Water Res., 25 (1991) 499–528.
[3] N. Bektaş, S. Kara, Removal of lead from aqueous solutions by natural clinoptilolite: equilibrium and kinetic studies, Sep. Purif. Technol., 39 (2004) 189–200.
[4] L. Lian, L.P. Guo, C.J. Guo, Adsorption of Congo red from aqueous solutions onto Ca-bentonite, J. Hazard. Mater., 161 (2009) 126–131.
[5] S.T. Akar, R. Uysal, Untreated clay with high adsorption capa-city for effective removal of C.I. Acid Red 88 from aqueous solutions: batch and dynamic flow mode studies, Chem. Eng. J., 162 (2010) 591–598.
[6] L.A. Rodrigues, L.J. Maschio, R.E. da Silva, M.L.C.P. da Silva, Adsorption of Cr(VI) from aqueous solution by hydrous zirconium oxide, J. Hazard. Mater., 173 (2010) 630–636.
[7] M.D. Stoller, S.Y. Park, Y.W. Zhu, J.H. An, R.S. Ruoff, Graphene-based ultracapacitors, Nano Lett., 8 (2008) 3498–3502.
[8] Z. Jin, D. Nackashi, W. Lu, C. Kittrell, J.M. Tour, Decoration, migration, and aggregation of palladium nanoparticles on graphene sheets, Chem. Mater., 22 (2010) 5695–5699.
[9] S. Bai, X.P. Shen, G.X. Zhu, A.H. Yuan, J. Zhang, Z.Y. Ji, D.Z. Qiu, The influence of wrinkling in reduced graphene oxide on their adsorption and catalytic properties, Carbon, 60 (2013) 157–168.
[10] R. Dubey, J. Bajpai, A.K. Bajpai, Green synthesis of graphene sand composite (GSC) as novel adsorbent for efficient removal of Cr (VI) ions from aqueous solution, J. Water Process Eng., 5 (2015) 83–94.
[11] X.K. Wang, C.L. Chen, W.P. Hu, A.P. Ding, D.S. Xu, X.P. Zhou, Sorption of 243Am(III) to multiwall carbon nanotubes, Environ. Sci. Technol., 39 (2005) 2856–2860.
[12] J. Deng, Y.S. Shao, N.Y. Gao, Y. Deng, C.Q. Tan, S.Q. Zhou, X.H. Hu, Multiwalled carbon nanotubes as adsorbents for removal of herbicide diuron from aqueous solution, Chem. Eng. J., 193 (2012) 339–347.
[13] Y.S. Fu, H.Q. Chen, X.Q. Sun, X. Wang, Combination of cobalt ferrite and graphene: high-performance and recyclable visible-light photocatalysis, Appl. Catal., B, 111 (2012) 280–287.
[14] M.J. McAllister, J.-L. Li, D.H. Adamson, H.C. Schniepp, A.A. Abdala, J. Liu, M. Herrera-Alonso, D.L. Milius, R. Car, R.K. Prud’homme, I.A. Aksay, Single sheet functionalized graphene by oxidation and thermal expansion of graphite, Chem. Mater., 19 (2007) 4396–4404.
[15] H. Xia, D.D. Zhu, Y.S. Fu, X. Wang, CoFe2O4-graphene nanocomposite as a high-capacity anode material for lithium-ion batteries, Electrochim. Acta, 83 (2012) 166–174.
[16] C.X. Guo, H.B. Yang, Z.M. Sheng, Z.S. Lu, Q.L. Song, C.M. Li, Layered graphene/quantum dots for photovoltaic devices, Angew. Chem. Int. Ed., 49 (2010) 3014–3017.
[17] H.L. Wang, H.S. Casalongue, Y.Y. Liang, H.J. Dai, Ni(OH)2 nanoplates grown on graphene as advanced electrochemical pseudocapacitor materials, J. Am. Chem. Soc., 132 (2010) 7472–7477.
[18] Q. Song, Z.J. Zhang, Shape control and associated magnetic properties of spinel cobalt ferrite nanocrystals, J. Am. Chem. Soc., 126 (2004) 6164–6168.
[19] B. Baruwati, M.N. Nadagouda, R.S. Varma, Bulk synthesis of monodisperse ferrite nanoparticles at water-organic interfaces under conventional and microwave hydrothermal treatment and their surface functionalization, J. Phys. Chem. C, 112 (2008) 18399–18404.
[20] Y. Kinemuchi, K. Ishizaka, H. Suematsu, W.H. Jiang, K.S. Yatsui, Magnetic properties of nanosize NiFe2O4 particles
0.00300 0.00305 0.00310 0.00315 0.00320 0.00325 0.00330-2.86
-2.84
-2.82
-2.80
-2.78
-2.76
lnK 2
1/T (K -1)
Fig. 13. Arrhenius plots for AB 25 adsorption on NFO-GOC.
Fig. 14. Reusability of NFO-GOC on successive use for adsorp-tion of AB 25.
411T. Ahmed et al. / Desalination and Water Treatment 174 (2020) 400–413
syn thesized by pulsed wire discharge, Thin Solid Films, 407 (2002) 109–113.
[21] H.Y. Guo, T.F. Jiao, Q.R. Zhang, W.F. Guo, Q.M. Peng, X.H. Yan, Preparation of graphene oxide-based hydrogels as efficient dye adsorbents for wastewater treatment, Nanoscale Res. Lett., 10 (2015) 272.
[22] C. Wang, C. Feng, Y.J. Gao, X.X. Ma, Q.H. Wu, Z. Wang, Preparation of a graphene-based magnetic nanocomposite for the removal of an organic dye from aqueous solution, Chem. Eng. J., 173 (2011) 92–97.
[23] J.N. Tiwari, K. Mahesh, N.H. Le, K.C. Kemp, R. Timilsina, R.N. Tiwari, K.S. Kim, Reduced graphene oxide-based hydrogels for the efficient capture of dye pollutants from aqueous solutions, Carbon, 56 (2013) 173–182.
[24] X.M. Wang, M.X. Lu, H. Wang, Y.F. Pei, H.H. Rao, X.Z. Du, Three-dimensional graphene aerogels–mesoporous silica frame-works for superior adsorption capability of phenols, Sep. Purif. Technol., 53 (2015) 7–13.
[25] K. Lu, G.X. Zhao, X.K. Wang, A brief review of graphene-based material synthesis and its application in environmental pollution management, Chin. Sci. Bull., 57 (2012) 1223–1234.
[26] J.F. Wang, T. Tsuzuki, B. Tang, X.L. Hou, L. Sun, X.G. Wang, Reduced graphene oxide/ZnO composite: reusable adsorbent for pollutant management, ACS Appl. Mater. Interfaces, 4 (2012) 3084–3090.
[27] G.Q. Xie, P.X. Xi, H.Y. Liu, F.J. Chen, L. Huang, Y.J. Shi, F.P. Hou, Z.Z. Zeng, C.W. Shao, J. Wang, A facile chemical method to produce superparamagnetic graphene oxide–Fe3O4 hybrid composite and its application in the removal of dyes from aqueous solution, J. Mater. Chem., 22 (2012) 1033–1039.
[28] W.S. Hummers Jr., R.E. Offeman, Preparation of graphitic oxide, J. Am. Chem. Soc., 80 (1958) 1339–1339.
[29] D.C. Marcano, D.V. Kosynkin, J.M. Berlin, A. Sinitskii, Z.Z. Sun, A. Slesarev, L.B. Alemany, W. Lu, J.M. Tour, Improved synthesis of graphene oxide, ACS Nano, 4 (2010) 4806–4814.
[30] D. Caruntu, Y. Remond, N.H. Chou, M.-J. Jun, G. Caruntu, J.B. He, G. Goloverda, C. O’Connor, V. Kolesnichenko, Reactivity of 3d transition metal cations in diethylene glycol solutions. Synthesis of transition metal ferrites with the structure of discrete nanoparticles complexed with long-chain carboxylate anions, Inorg. Chem., 41 (2002) 6137–6146.
[31] S. Bai, X.P. Shen, X. Zhong, Y. Liu, G.X. Zhu, X. Xu, K.M. Chen, One-pot solvothermal preparation of magnetic reduced graphene oxide-ferrite hybrids for organic dye removal, Carbon, 50 (2012) 2337–2346.
[32] B.D. Cullity, S.R. Stock, Elements of X-ray diffraction, 3rd ed., Prentice-Hall, New York, 2001.
[33] G.D. Chen, M. Sun, Q. Wei, Y.F. Zhang, B.C. Zhu, B. Du, Ag3PO4/graphene-oxide composite with remarkably enhanced visible-light-driven photocatalytic activity toward dyes in water, J. Hazard. Mater., 244 (2013) 86–93.
[34] L.C.A. Oliveira, R.V.R.A. Rios, J.D. Fabris, V. Garg, K. Sapag, R.M. Lago, Activated carbon/iron oxide magnetic composites for the adsorption of contaminants in water, Carbon, 40 (2002) 2177–2183.
[35] A.S. Özcan, B. Erdem, A. Özcan, Adsorption of Acid Blue 193 from aqueous solutions onto Na–bentonite and DTMA–bentonite, J. Colloid Interface Sci., 280 (2004) 44–54.
[36] F. Ferrero, Dye removal by low cost adsorbents: hazelnut shells in comparison with wood sawdust, J. Hazard. Mater., 142 (2007) 144–152.
[37] I.M. Lipatova, L.I. Makarova, A.A. Yusova, Adsorption removal of anionic dyes from aqueous solutions by chitosan
nano particles deposited on the fibrous carrier, Chemosphere, 212 (2018) 1155–1162.
[38] K.G. Bhattacharyya, S. Sen Gupta, Adsorption of Co(II) from aqueous medium on natural and acid activated kaolinite and montmorillonite, Sep. Sci. Technol., 42 (2007) 3391–3418.
[39] N.A. Oladoja, A.K. Akinlabi, Congo red biosorption on palm kernel seed coat, Ind. Eng. Chem. Res., 48 (2009) 6188–6196.
[40] A. Shukla, Y.-H. Zhang, P. Dubey, J.L. Margrave, S.S. Shukla, The role of sawdust in the removal of unwanted materials from water, J. Hazard. Mater., 95 (2002) 137–152.
[41] S. Sen Gupta, K.G. Bhattacharyya, Removal of Cd(II) from aqueous solution by kaolinite, montmorillonite and their poly(oxo zirconium) and tetrabutylammonium derivatives, J. Hazard. Mater. B, 128 (2006) 247–257.
[42] S. Lagergren, Zurtheorie der sogenannten adsorption gel osterstoffe, Kungliga Svenska Vetenskaps akademiens Hand-lingar, 24 (1898) 1–39.
[43] Y.S. Ho, G. McKay, Kinetic models for the sorption of dye from aqueous solution by wood, Process Saf. Environ. Prot., 76 (1998) 183–191.
[44] Y.S. Ho, G. McKay, Pseudo-second-order model for sorption processes, Process Biochem., 34 (1999) 451–465.
[45] S.H. Chien, W.R. Clayton, Application of Elovich equation to the kinetics of phosphate release and sorption in soils, Soil Sci. Soc. Am. J., 44 (1980) 265–268.
[46] W.J. Weber, J.C. Morris, Kinetics of adsorption on carbon from solution, J. Sanitary Eng. Div., 89 (1963) 31–60.
[47] M. Alkan, Ö. Demirbaş, M. Doğan, Adsorption kinetics and thermodynamics of an anionic dye onto sepiolite, Microporous Mesoporous Mater., 101 (2007) 388–396.
[48] G.E. Boyd, A.W. Adamson, L.S. Myers Jr., The exchange adsorption of ions from aqueous solutions by organic zeolites. II. Kinetics, J. Am. Chem. Soc., 69 (1947) 2836–2848.
[49] I. Langmuir, The Constitution and fundamental properties of solids and liquids. Part I. Solids, J. Am. Chem. Soc., 38 (1916) 2221–2295.
[50] H. Freundlich, Uber die adsorption in losungen [Adsorption in solution], Z. Physikalische Chemie, 57 (1906) 385–471.
[51] D.G. Kinniburgh, General purpose adsorption isotherms, Environ. Sci. Technol., 20 (1986) 895–904.
[52] T.T. Chao, M.E. Harward, S.C. Fang, Adsorption and desorption phenomena of sulfate ions in soils, Soil Sci. Soc. Am. Proc., 26 (1962) 234–237.
[53] M.I. Temkin, Kinetics of ammonia synthesis on promoted iron catalysts, Acta Phys. Chim. Sin. URSS, 12 (1940) 327–356.
[54] C.C. Travis, E.L. Etnier, A survey of sorption relationships for reactive solutes in soil, J. Environ. Qual., 10 (1981) 8–17.
[55] O. Redlich, D.L. Peterson, A useful adsorption isotherm, J. Phys. Chem., 63 (1959) 1024–1024.
[56] N.D. Hutson, R.T. Yang, Theoretical basis for the Dubinin–Radushkevitch (D-R) adsorption isotherm equation, Adsorp-tion, 3 (1997) 189–195.
[57] S. Aksoyoglu, Sorption of U(VI) on granite, J. Radioanal. Nucl. Chem. Art., 134 (1989) 393–403.
[58] Y.S. Ho, G. McKay, Sorption of dye from aqueous solution by peat, Chem. Eng. J., 70 (1998) 115–124.
[59] K. Badii, F.D. Ardejani, M.A. Saberi, N.Y. Limaee, S. Zia-e-din Shafaei, Adsorption of Acid blue 25 dye on diatomite in aqueous solutions, Indian J. Chem. Technol., 17 (2010) 7–16.
[60] I.A.W. Tan, A.L. Ahmad, B.H. Hameed, Adsorption isotherms, kinetics, thermodynamics and desorption studies of 2,4,6- trichlorophenol on oil palm empty fruit bunch-based activated carbon, J. Hazard. Mater., 164 (2009) 473–482.
T. Ahmed et al. / Desalination and Water Treatment 174 (2020) 400–413412
Supplementary information
10 15 20 25 30
86
88
90
92
94
96
98
100
q e ( m
gg-1)
Conc. of dye (mgL-1)
Fig. S1. Influence of initial dye (AB 25) concentration for adsorption on NFO-GOC.
303 313 323 33385
90
95
100
q e (m
gg-1)
T(K)
Fig. S3. Influence of temperature for AB 25 adsorption on NFO-GOC.
0.00 0.02 0.04 0.06 0.08 0.10 0.12 0.14 0.16 0.18 0.20
55
60
65
70
75
80
85
90
q e( m
gg-1)
Adsorbent Load (gL-1)
Fig. S2. Influence of adsorbent (NFO-GOC) load for the adsorption of AB 25.
0 20 40 60 80 100 120 140 160 180 200
-1.5
-1.0
-0.5
0.0
0.5
1.0
1.5
2.0
log
(qe -
qt)
Time (min)
Fig. S4. Pseudo-first-order plots for AB 25 adsorption on NFO-GOC.

413T. Ahmed et al. / Desalination and Water Treatment 174 (2020) 400–413
0 20 40 60 80 100 120 140 160 180 2000
1
2
3
4
5
6
7
8
-ln(1
-qt/q
e)
Time (min)
Fig. S5. A liquid film diffusion model for AB 25 adsorption on NFO-GOC.
1.0 1.1 1.2 1.3 1.4 1.51.93
1.94
1.95
1.96
1.97
1.98
1.99
log(Ce)
log(
q e)Fig. S6. Freundlich isotherm model for AB 25 adsorption on NFO-GOC.