application of material flow cost accounting (mfca) …
TRANSCRIPT

i
APPLICATION OF MATERIAL FLOW COST
ACCOUNTING (MFCA) IN MICROALGAE
MANUFACTURING COMPANY IN MALAYSIA
MAGESWARAN MURUGIYA
FACULTY OF ENGINEERING
UNIVERSITY OF MALAYA
KUALA LUMPUR
2018
Univers
ity of
Mala
ya

ii
APPLICATION OF MATERIAL FLOW COST
ACCOUNTING (MFCA) IN MICROALGAE
MANUFACTURING COMPANY IN MALAYSIA
MAGESWARAN MURUGIYA
RESEARCH PROJECT SUBMITTED TO THE FACULTY
OF ENGINEERING UNIVERSITY OF MALAYA, IN
PARTIAL FULFILMENT OF THE REQUIREMENTS FOR
THE DEGREE OF MASTERS OF ENGINEERING
(SAFETY, HEALTH AND ENVIRONMENT)
FACULTY OF ENGINEERING
UNIVERSITY OF MALAYA
KUALA LUMPUR
2018
Univers
ity of
Mala
ya

ii
ABSTRACT
Malaysian government showed special interest in manufacturing greener product and
raising awareness regarding the environmental pollution due to industrialization.
Frameworks from standards such as Life Cycle Assessment (LCA), Environmental
Management Accounting (EMA) and a series of ISO14000 to reduce the environmental
impact due to manufacturing. Material Flow Cost Accounting (MFCA), ISO 14051 is
one of the principal tools used under EMA that focuses on establishing monetary unit on
the waste generated in the processes involved in the manufacturing company. MFCA
allows the company to track wastes and reducing it in each key process in the
manufacturing company but there are few challenges that faced by Malaysian SMEs in
implementing MFCA. The selected company for the study is a microalgae
manufacturing company, ABC Sdn.Bhd. in Malaysia. The total material, energy, system
and waste management costs were drawn out by constructing the material flow and the
costs associated with it. Based on the specific objects of the study, all the costs relevant
to MFCA is collected from the company and represented in the material flow matrix and
calculated to identify the costs associated with the non-product output from the
manufacturing process. Percentage of material input into products and material losses
were taken into consideration in allocating system and energy costs in the single
manufacturing line. For allocation of energy there were aspects taken into consideration;
the running time of the machine and the efficiency of the machine in the production line.
Result shows that 89.49% of the total cost allocated for the material while other costs
about 10.50%. The costs allocated for the product accounted for 82.13% while cost of
material losses in this process in general takes another 17.87%. As a result, the company
realized that there is a room for improvement for reduction of material losses in the
company. It was also found that the highest material lost was in the energy lost which is
Univers
ity of
Mala
ya

iii
about 40.52% compared to assumed by the company which is more or less about 10%.
It was clearly seen that the company is losing more than 17% of their investment in the
production that rather could be used for the improvement in efficiency of the machines
and energy. The company also recommended to apply MFCA in all line of production to
evaluate the total costs associated in the overall material losses thus it can be reduced.
Univers
ity of
Mala
ya

iv
ABSTRAK
Kerajaan Malaysia menunjukkan minat khusus dalam menghasilkan produk yang lebih
mesra alam dan mewujudkan kesedaran mengenai pencemaran alam sekitar akibat
perindustrian. Rangka kerja dari piawaian seperti Penilaian Kitar Hidup (LCA),
Perakaunan Pengurusan Alam Sekitar (EMA) dan satu siri ISO14000 untuk
mengurangkan kesan alam sekitar akibat pembuatan. Perakaunan Kos Aliran Bahan
(MFCA), ISO 14051 merupakan salah satu alat utama yang digunakan di bawah EMA
yang memberi tumpuan kepada penubuhan unit monetari pada sisa yang dihasilkan
dalam proses yang terlibat dalam syarikat perkilangan. MFCA membenarkan syarikat
mengesan sisa dan mengurangkannya dalam setiap proses utama di syarikat pembuatan
tetapi terdapat beberapa cabaran yang dihadapi oleh PKS Malaysia dalam melaksanakan
MFCA. Syarikat terpilih untuk kajian ini ialah syarikat pembuatan mikroalgae, ABC
Sdn.Bhd. di Malaysia. Jumlah bahan, tenaga, sistem dan kos pengurusan sisa telah
diambil dengan membina aliran bahan dan kos yang berkaitan dengannya. Berdasarkan
objektif kajian ini, semua kos yang berkaitan dengan MFCA dikumpulkan dari syarikat
dan diwakili dalam matriks aliran bahan dan dikira untuk mengenal pasti kos yang
berkaitan dengan output bukan produk dari proses pembuatan. Peratusan input bahan ke
dalam produk dan kerugian bahan telah diambil kira dalam memperuntukkan sistem dan
kos tenaga dalam talian pembuatan tunggal. Bagi peruntukan tenaga, ada aspek yang
dipertimbangkan; masa operasi mesin dan kecekapan mesin dalam barisan pengeluaran.
Keputusan menunjukkan bahawa 89.49% daripada jumlah kos yang diperuntukkan
adalah untuk bahan tersebut manakala kos lain 10.50%. Kos yang diperuntukkan untuk
produk tersebut menyumbang 82.13% sementara kos kehilangan bahan dalam proses ini
secara amnya mengambil 17.87% lagi. Akibatnya, syarikat menyedari bahawa ada
ruang untuk penambahbaikan untuk mengurangkan kerugian bahan dalam syarikat. Ia
Univers
ity of
Mala
ya

v
juga mendapati bahawa bahan yang paling tinggi yang hilang adalah kehilangan tenaga
yang kira-kira 40.52% berbanding dengan yang di anggap oleh syarikat yang lebih
kurang 10%. Jelas sekali, syarikat itu kehilangan lebih daripada 17% daripada pelaburan
mereka dalam pengeluaran yang sebaliknya boleh digunakan untuk peningkatan
kecekapan mesin dan tenaga. Syarikat itu juga disarankan untuk menggunakan MFCA
dalam semua bidang pengeluaran untuk menilai jumlah kos yang berkaitan dengan
kerugian keseluruhan bahan itu sehingga dapat dikurangkan.
Univers
ity of
Mala
ya

vi
ACKNOWLEDGEMENT
I would first like to thank my thesis advisor Professor Dr. Nik Meriam binti
NikSulaiman of the Chemical Engineering Department at Faculty of Engineering. The
door to Prof. Nik Meriam office was always open whenever I ran into a trouble spot or
had a question about my research or writing. She consistently allowed this paper to be
my own work, but steered me in the right the direction whenever he thought I needed it.
I would also like to thank the experts who were involved in the validation study
for this research project which involves a microalgae manufacturing company,
Mr.Nazrin and Mr.Irfan as well as expert in Material Flow Cost Accounting (MFCA),
Professor Katsuhiko Kokubu and Professor Kimitaka Nishitani from Kobe University
who gave input on this study during the MFCA Conference 2.0 held in Malaya
University. Without their passionate participation and input, the validation study could
not have been successfully conducted.
I would also like to acknowledge Ms. Rubini Devi, my batch mate who was my
point of reference for this study and I am gratefully indebted to her for her very valuable
help and guidance on this thesis. Lastly to my family members and fiancé,
Ms.Davamalar who helped supports me throughout the completion of my study. Univers
ity of
Mala
ya

vii
TABLE OF CONTENT
ABSTRACT .................................................................................................................. ii
ABSTRAK ................................................................................................................... iv
ACKNOWLEDGEMENT ............................................................................................ vi
TABLE OF CONTENT .............................................................................................. vii
LIST OF FIGURES ....................................................................................................... x
LIST OF TABLES ....................................................................................................... xi
LIST OF SYMBOLS AND ABBREVIATIONS ........................................................ xii
CHAPTER 1: INTRODUCTION .................................................................................. 1
1.1 Background of Study ....................................................................................... 1
1.2 Problem Statement .......................................................................................... 3
1.3 Objectives ........................................................................................................ 5
1.3.1 Specific Objectives .................................................................................. 5
1.4 Scope of the study ........................................................................................... 5
1.5 Significance of Study ...................................................................................... 6
1.6 Outline of the study ......................................................................................... 6
CHAPTER 2: LITERATURE REVIEW ...................................................................... 7
2.1 Background of Material Flow Cost Accounting (MFCA) .............................. 7
2.2 Concept of Material Flow Cost Accounting (MFCA) .................................... 8
2.3 Material Flow Cost Accounting (MFCA) Facilitator ................................... 10
2.4 Material Flow Cost Accounting (MFCA) Challenges ................................. 11
2.5 Microalgae Cultivation ................................................................................. 13
2.5.1 Methods of Cultivation ......................................................................... 13
2.5.2 Cultivation of Haematococcus pluvialis ................................................ 15
2.5.3 Challenges in Microalgae Cultivation ................................................... 18
Univers
ity of
Mala
ya

viii
CHAPTER 3: METHODOLOGY ............................................................................... 19
3.1 Literature Research ...................................................................................... 21
3.2 Finding for the Company .............................................................................. 21
3.3 Obtaining Production Data ............................................................................ 21
3.4 MFCA Implementation Steps ....................................................................... 22
3.4.1 Engaging Management and Determining Roles and Responsibilities.... 22
3.4.2 Scope and Boundary of the Process and Establishing a Material Flow
Model ....................................................................................................... 22
3.4.3 Cost Allocation ...................................................................................... 22
3.4.4 Interpreting and Communicating MFCA Results .................................. 23
3.4.5 Improving Production Practices and Reducing Material Loss through
MFCA Results ..................................................................................................... 23
CHAPTER 4: RESULTS AND DISCUSSION ........................................................... 24
4.1 Selection of Manufacturing Company .......................................................... 24
4.2 Identification of Cost Centre. ....................................................................... 24
4.2.1 Preparation ............................................................................................. 25
4.2.2 Water treatment ...................................................................................... 25
4.2.3 Inoculation ............................................................................................. 26
4.2.4 Adjustment ............................................................................................. 26
4.2.5 Harvesting .............................................................................................. 27
4.3 Cost Calculation and Allocation .................................................................. 28
4.3.1 Calculation of Material Costs ................................................................ 28
4.3.2 Calculation and Allocation of Energy Costs, System Costs and Waste
Management Cost. ............................................................................................... 32
4.3.3 Calculation and Allocation of Energy Costs, System Costs and Waste
Management Costs to Products and Material Losses in each QC. ...................... 33
4.3.4 Integrated Presentation and Analysis of Cost Data ............................... 38
Univers
ity of
Mala
ya

ix
CHAPTER 5 :CONCLUSION AND RECOMMENDATION .................................. 45
5.1 Conclusion .................................................................................................... 45
5.2 Recommendations ........................................................................................ 46
REFERENCES ............................................................................................................ 48
APPENDIX A ............................................................................................................. 53
Univers
ity of
Mala
ya

x
LIST OF FIGURES
Figure 2.1: MFCA chart (Source:Palásek, 2009) .............................................................. 8
Figure 2.2 : Typical Flowchart of Haematococcus pluvialis in Production of Astaxanthin
......................................................................................................................................... 17
Figure 4.1: Material Flow in RS of ABC Sdn.Bhd. ........................................................ 28
Univers
ity of
Mala
ya

xi
LIST OF TABLES
Figure 3.1: Flow Chart of Research Project .................................................................... 20
Table 4.1: Material Costs for Constructed Flow Model Process ..................................... 29
Table 4.2: Energy costs, system costs and waste management costs in each QC. .......... 32
Table 4.3: Summary of Material Cost Distribution Percentage ...................................... 34
Table 4.4: Percentage of Energy Allocation for each QC ............................................... 38
Table 4.5: Material Flow Cost Matrix in ABC Sdn. Bhd ................................................ 39
Table 4.6: Summary of Total Percentage Costs of Materials, Energy, System and Waste
Management .................................................................................................................... 44
Univers
ity of
Mala
ya

xii
LIST OF SYMBOLS AND ABBREVIATIONS
LCA : Life Cycle Assessment
EMA : Environmental Management Accounting
MFCA : Material Flow Cost Accounting
QC : Quantity Centre
EMS : Environmental Management System
ISO : International Standard Organization
MOF : Ministry of Finance
DOE : Department of Environment
JIS : Japan Industrial Standard
TPM : Total Productive Maintenance
TQM : Total Quality Management
CO2 : Carbon Dioxide
PBR : Photobioreactor
OPR : Open Pond Raceways
RS : Red Stage
GS : Green Stage
MC : Mother Culture
R&D : Research and Development
RM : Ringgit Malaysia
LED : Light Emitting Diode
Univers
ity of
Mala
ya

1
CHAPTER 1: INTRODUCTION
1.1 Background of Study
The amount of waste generated in Malaysia keeps increasing and has become a
major problem since it is associated with many other industries which lead to poor
economic growth (Sakawi, 2017). The volume of the waste generated is depending on
the economic growth of specific area and its nature of business from 0.45 to 1.44
kilogram per capita per day (Hassan et al., 1998). Waste in previous has not become a
major issue, as the population increases and development in industrial sector, it plays a
major role in determining the business of the country as well as the business.
Ever since the waste has become major issue to be overcome, Malaysia has
promoted green technology which encourages industries to minimize the waste
generation and using the alternative source of energy for production. According to
Ministry of Energy, Green Technology and Water Malaysia, the goal has been set in
three phases till the year 2021 and beyond involving key sectors of energy, buildings,
water and waste as well as transportations (National Green Technology Policy, 2009).
In recent years, many steps or policies has been practiced to overcome the
acceleration of waste generation from the industries. Various methods and guideline
was handled to reduce the volume of waste produced such as ISO 14000 Series of
Standards, life cycle assessments (LCA), environmental managements systems (EMS)
and et cetera (Let, Weng, & Wahid, 2010). Yet, most of these guidelines are a tool to
measure qualitatively not quantitatively which often neglected by the manufacturers.
Univers
ity of
Mala
ya

2
Wastes from industries which includes the used or unused items, discarded due
to off spec products, materials generated from manufacturing processes and even
documentations from the administration departments to be a main contributor for waste
generation in Malaysia (Mohd Nasir Hassan et al., 2005).
Besides bigger manufacturing plant, small and medium enterprises (SMEs) are
also contributing to the waste generation from industry. According to Key Statistics on
SMEs., 2011, there was a total of 645,136 SMEs operating their businesses in Malaysia,
representing 97.3% of total business establishments. These large numbers of
entrepreneurs under SME have very limited access to all the guidelines and knowledge
in EMS thus they are unable to implement it in their nature of business (Weerasiri, S., &
Zhengang, 2011).
Most SME facing challenges in implementing environmental tool to monitor the
waste accumulated from the production thus contributing to industrial pollution. There
is a major constrain faced by SMEs ate lack of financing, productivity, access to
technology and skilled workers (Wan, 2003). According to (Hoq, 2009), there are main
key challenges faced by SMEs; low financial access, manpower constrains, less room
for implementing high-tech machineries, lack of information and global competitions
which made SMEs unable to perform any environmental correction in the
manufacturing line.
Univers
ity of
Mala
ya

3
In order to overcome the issues, simple management tools were introduced and
educated to the top management of SMEs (Musa & Chinniah, 2016). Yet, many SME
owners do not pay attention on the issue related to environment and the waste generated
from the manufacturing process unless required by their ventures. Material Cost Flow
Accounting (MFCA) is one of the environmental management tools besides EMS and
LCA which would able to describe the wastes generated from the manufacturing process
quantitatively. The main motive of implementing MFCA would be to enhance the
productivity of business by reducing the cost of waste generated by the company
(Mishelle & Hari Lall, 2015).
1.2 Problem Statement
As Malaysia is now growing towards a developed nation, many industrial
revolutions have taken place to contribute economic growth. Ministry of
Finance in 2014 stated that manufacturing industry contributes to Malaysian
economy after service-based industry (MOF, 2014). But, manufacturing
industries corresponds to volume of waste generated from the process which
potentially can affect the environment if not handled properly (Yusup, Wan
Mahmood, Salleh, & Ab Rahman, 2015). Many companies and stakeholders are
interested to improvise the manufacturing not only to reduce environmental
effect yet to increase the turnover of the company. Many models have been
proposed such as eco-friendly indicators and modeled decision framework which
enable the manufacturers to have alternatives such as projects, technologies or
systems (Sarkis, 2003),
Univers
ity of
Mala
ya

4
Department of Environment under Malaysian government has taken
many steps to introduce cleaner energy to enhance the productivity of
manufacturing and to reduce environmental impacts due to the business. But,
major drawback of implementing cleaner production and other related
environmental tools in the manufacturing industry is the lack of knowledge,
expert in the related field and level of acceptance among Malaysians (Ghazilla et
al., 2015). Life Cycle Assessments (LCA) is one of many methods used to
evaluate the environmental impact from the manufacturing process but it does
not predict absolute or precise value (ISO, 2006).
In this research study, the proposed method was MFCA to be used
instead of other methods which used to measure the costs of the production in
both physical and financial (Nakajima, 2006) and able to trace the area of
improvement for ach specific steps in the manufacturing line. In the chosen
company (microalgae cultivation) there are many ways where the energy and
materials were used in large amount and not all of them contribute to the
finished product. By implementing MFCA, the company would be able to
establish an indicator for process improvement.
Univers
ity of
Mala
ya

5
1.3 Objectives
The research study was aim to introduce and implement MFCA in a
chosen industry as a key to identify and evaluate costs associated with the
processes involve and the waste generated from the line of production. By the
end of the project, the company would be able to trace the highest cost involve
on the wastes and improve the line of the production to reduce the costs invested.
1.3.1 Specific Objectives
1. To calculate costs associated with the constructed material flow of the
selected SME company.
2. To suggest and recommend improvement on the line of production from the
output of MFCA.
1.4 Scope of the study
This research study was carried in a microalgae cultivation facility in
Kuala Lumpur which is the only facility in Malaysia to cultivate such species of
microalgae to be processed into supplements and feedstock. The facility uses
strain from abroad to cultivate microalgae in smaller scale to larger volume
which involves various stages of growth. The study was taken place in a final
stage of cultivation which involves the suffocation of microalgae to produce
lipid for further processing. The implementation of MFCA took place in 3
phases; preparation, data collection and calculation. The flow of materials,
generation of products and waste were monitored from May 2017 to October
2017. Only one stage of the production was selected due to time constrain.
Univers
ity of
Mala
ya

6
1.5 Significance of Study
This study is very essential for the company since the cost flow matrix
will be showing the costs invested in each defined quantity center and the
products and wastes associated in that particular quantity center. From the
identified wastes in the process, the company will be able to compare the output
from the process which contribute to be in the part of the product and wastes,
which will reflect the amount of profit made from the single line of production.
These data is then can be used to minimize the waste generation in each
stages by improving the method, replacing new machineries and other steps to
reduce the costs associated with the material losses. In longer term, the company
also will be able to reduce the material losses and eventually increase the profit
to the company. The participating company would be also able to share benefits
from implementing MFCA to other stakeholders so it can be implemented in
other companies as well.
1.6 Outline of the study
This research report consists of 5 main chapters which are;
a) Chapter 1: Introduction
b) Chapter 2: Literature Review
c) Chapter 3: Methodology
d) Chapter 4: Results and Discussions
e) Chapter 5: Conclusion and Recommendation
Univers
ity of
Mala
ya

7
CHAPTER 2: LITERATURE REVIEW
2.1 Background of Material Flow Cost Accounting (MFCA)
Material flow cost accounting (MFCA) has been introduced and practiced in
Japan since 2000 with the aim to enhance the rate of productivity with was originated
from Germany (Strobel, M., Redmann, 2000). MCFA focuses on the reduction of the
waste which lead to environmental impact and simultaneously reduction of cost
associate to the waste generation from the industry (Michiyasu Nakajima, Kimura, &
Wagner, 2015). The endorsement from Japan is then expanded upon publication of
international standard (ISO14051) in September 2011 and its adaptation on Japan
Industrial Standard, JIS Q14051 in March 2012 (ISO, 2011).
Besides all the environmental tool, MFCA is the one of (Schmidt et al., 2015)
that has been used for managing the production flow of the manufacturing processes.
The main advantage of implementing MFCA is due to its availability of the data on both
quantity of material used and the cost associated in each stage in a constructed material
flow. The data can be clearly seen and traced in each sub process in the manufacturing
line (Quick Refrence To Material Flow Cost Accounting (ISO 14051).
MFCA provides accurate values of materials costs, energy costs and even waste
management’s costs attached to each line of manufacturing and the applicability is much
wider and easier compared to other management tool available. Application of MFCA
can be done in all kind of manufacturing line either single batch or continuous batch of
production (ISO 2011).
Univers
ity of
Mala
ya

8
The results obtained from the implementation of MCFA enable the management
to look through the material and cost losses from the waste generation in the
manufacturing process. This would immediately create awareness among the
organization to work on the losses and plan for the suitable way to reduce the waste
generated, as well as the cost associate with it (Kokubu, K., Tachikawa, H., 2013).
2.2 Concept of Material Flow Cost Accounting (MFCA)
Main component of the MFCA is to make a compressed tabulation data of data
involving both input and output of the materials in a production line. The flow chart is
defined with specific quantity centre where the input of each clearly defined. The inputs
such(raw materials, energy, water, and other inputs) and outputs (primary products /
byproducts, wastes, wastewaters, emissions) are determined within a quantity centre,
and later is integrated to obtain the costs associated to it.
Figure 2.1: MFCA chart (Source:Palásek, 2009)
Univers
ity of
Mala
ya

9
Product in each quantity centre is refers to any end product that resulted from the
process of manufacturing and used as profitable and source of income for the company.
In terms of the MFCA, the term material loss is not only seen in the narrow sense, but it
refers to any and all invested materials, energy, and other economic resources, which
were not transformed into products and leave unused as wastes.
MFCA focuses on the flow of material and the costs associated with the
production line. Besides just providing the physical unit of quantity on each product in
the production line it also provides the corresponding monetary unit of each material.
The cost of material involve in each quantity centre in the manufacturing line is to be
monitored in both physical and monetary unit thus accumulating the total costs in each
production line and total waste generated in each line. Flow of material is drawn in each
quantity centre and the data were obtained directly from the company in order to
identify the input and output of the materials (Hyršlová, Vágner, & Palásek, 2011).
Besides material flow, all energy flow in the respective quantity centre also
monitored by implementing MFCA. At the same time, the system cost also taken into
consideration. A system cost in the production line often involves all costs that used to
handle the materials into the line within the company. Each input for the company will
be defined as carrier of system costs whether as a raw materials, work involves to
handle the material, product and wastes generated in each line. System costs associated
to the output of the where there are used in the sub flow and stock of the material.
Wastes which leaves the quantity centre allocated as waste management cost (Hyršlová
et al., 2011). Implementation if MFCA in the data obtained from the company is allow
the management to look for any corrective measures to be taken in two ways; increasing
Univers
ity of
Mala
ya

10
efficiency of a material and reducing the waste generated which shall contribute to
economic growth of a company.
2.3 Material Flow Cost Accounting (MFCA) Facilitator
Sulong, Sulaiman, & Alwi, 2015 states that there are some factors required to
facilitate the implementation of MFCA in the company that involves support from
management to provide technical support and availability, access to data and continuous
commitment from them. These factors would definitely give positive impact to the
company from applying MFCA in each production line in the company.
Availability of technical support is the important facilitator to ensure the
application of MFCA and used as an accounting pool since the wastes generated not
only considered as negative product but it has the value or monetary unit associated with
it (Jasch, C., 2009). This allows the costs involved in waste generation are more clearly
to be seen and accounted compared to traditional cost accounting. These features enable
the more accurate report to be produced in the end of MCFA implementation.
The availability of data is another important facilitator as Strobel and Redmann,
C., 2002discovered that companies with data required for the study will enable MFCA
implementation to be more accurate and easy to be traced. Companies with availability
of data will shorten the period for the calculation of data in MFCA so that the company
will be able to draw the corrective measure for reduction of waste generated in the
company.
Univers
ity of
Mala
ya

11
Next, the complicated and critical facilitator for implementation of MFCA is the
commitment from top management to allocate time, money and resources for the study.
Environmental Management Accounting (EMA) emphasized that senior management
commitment is important so that the decision making on the corrective action shall be
taken immediately to enhance the productivity of the company. Besides financial
support from top management for the EMA study is also requires participation from
various departments to ensure that implementation of corrective action can be efficient.
Lack of support from the management, the outcome from EMA will not be considered
important for the management. Without top management commitment, EMA projects,
and hence MFCA projects, are likely to encounter substantial challenges and obstacles
(Lee et al., 2005)
Compatibility of MFCA to the existing management facilities can be the final
facilitator for the implementation as it can make the procedure to be done smoothly. M.
Nakajima, 2004 found that if the company has the existing system to monitor the quality
would complement the implementation of MFCA. Existing system can be such as Total
Productive Maintenance (TPM) and Total Quality Management (TQM). These systems
if the company adapted to can make sure that the company will not face any difficulties
implementing MFCA in their production line.
2.4 Material Flow Cost Accounting (MFCA) Challenges
There are some challenges faced by company to implement MFCA as stated in
ISO 14051. These challenges are from all side of manufacturing line from top
management as well as production team in a company which limits the use and practice
of MFCA in various manufacturing company. These mainly relate to perception
Univers
ity of
Mala
ya

12
challenges (Kokubu and Kitada, 2010; Nakajima, 2004), team cooperation (Lee et al.,
2005), performance appraisal (Burritt, 2004, 2005) and technical knowledge and
training (Burritt, 2004, 2005).
First of all, the perception challenges from the manufacturing field which
misinterpret the main aim of the MFCA, which unable for them to distinguish between
commercial accounting with MFCA. The clash on the perception also evolves on the
main aim revolving the economic objective; which the manufacturing is to seek profit
clashes with objective of MFCA. This is mainly due to clash of objectives from the
corner of economics by the top management and environmental by the engineers
(Wagner, M., Schaltegger, S., Wehrmeyer, 2001).
Lack of team cooperation is another barrier for implementation of MFCA
especially manufacturing company involving multitier departments from general worker
top management personnel. Generally, costs related to environment are available in the
specific department only; same goes to other production costs such as systems, materials
design and accounting. Since the availability of data is restricted in specific departments,
the collection of these data from various departments requires intensive cooperation
from the entire department in the company. Without support and commitment from all
departments, the implementation of MFCA may be difficult to effectively measure the
efficiency in the material flow (Lee et al., 2005).
Univers
ity of
Mala
ya

13
Next challenge faced by MFCA implementation is the performance appraisals of
both the individual and departments involved in EMA generally excluded environmental
impacts. MFCA involves workers from various department and units from
environmental department which including the engineers, top management and also
from the production line of the company and clear line on the roles and responsibility
must be made so that the implementation of MFCA will be effective (Jasch, 2009).
Improper establishment of clear line may cause difficulties in implementing and
applying MFCA in the production line.
More challenges faced in term of lack of technology and training for the workers
on the application and importance of MFCA. This challenge is critical to calculation of
MFCA as it may involve inaccuracy in identifying the costs involved in the
manufacturing line. This is mainly because of different definitions and scope of
environmental costs and also a perception that environmental costs are not important
(Burritt, 2005).
2.5 Microalgae Cultivation
2.5.1 Methods of Cultivation
Algae can be grouped into two different categories; microalgae and macro algae
which are unicellular and autotrophs. Algae has green pigments which utilizes carbon
dioxide (CO2), sunlight and water to perform photosynthesis (Kröger M, 2012). As the
product of photosynthesis, the lipid will be accumulated in the body of algae which can
be converted to valuable products such as fuel and energy source (Saharan et al., 2013).
Univers
ity of
Mala
ya

14
Biomass obtained from microalgae contains high number of lipids (~25%), proteins
(~70%) and carbohydrates (~5%) and this may vary according to their species and
environmental factor determining its growth (Becker, 2007).
The most used system in the researches to grow microalgae are open ponds
(OPR) cultivation, photo-bioreactors (PBR) using transparent vessels, bags and pond
system and hybrid systems currently used in research (pilot and laboratory) scale and
industrial scale (Jankowska, Sahu, & Oleskowicz-popiel, 2017). Open pond system
practiced in an open area with installed ponds supplied with nutrients to support growth.
The buildup, installation and maintenance to be cheaper compared to other methods
(Kröger M, 2012). Yet, this method has higher failure rate due to its open condition
which may exposed to contaminants, vaporization and lack of control of parameter.
According to (Borowitzka MA, 1994) the biomass concentration produced from this
method is relatively low which approximately 10–25 g dry matter of algae biomass per
day per m2.
Method of cultivation using PBR is the most effective known as it is the closed
system and easy to be controlled. Most of the company uses this method because it can
produce more biomass compared to open system since the steps of cultivation can be
optimized to prevent contamination with other species (Schenk P.M et al., 2008). Even
the cost of operation and maintenance is higher, the mass of biomass produced were
comparatively higher which is about 20 and 100 g dry per day per m2
(Mirόn AS, et al.,
1999). Recently, the combination of OPR and PBR is being implemented and known as
a hybrid system.
Univers
ity of
Mala
ya

15
2.5.2 Cultivation of Haematococcus pluvialis
Haematococcus pluvialis is a eukaryotic freshwater microalgae which changes
its physical characteristics under different environmental condition. The stages of
cultivation differs from green juvenile phase to red phase which happen due to stress
(lack of basic need) causes accumulation of astaxanthin (Boussiba, 2000). Astaxanthin
is known as most powerful antioxidant found naturally to enhance the health of human
due to its usage as in cosmetics and supplements (Martin Koller, Alexander Muhr,
2014).
Cultivation of these microalgae mainly uses water as its medium of growth is
divided into two parts; green juvenile stage which undergoes frequent cell division,
propagate and produces chlorophyll, red stage when there is no cell division, only
accumulation of lipids which later processed to extract astaxanthin (S. Boussiba, A.
Vonshak, Z. Cohen, 1991). During green stage (GS),complete need for the growth such
as moderate light intensity, pH and temperature is supplied to increase the number of
cells and later in red stage (RS) the cell inhibits growth and triggered to accumulate
astaxanthin as a result of nutrient starvation (Markou & Kazakis, 2013).
Before the cultivation process started, the culture will be kept under a perfect
condition in smaller volume known as Mother Culture (MC), later transferred into a
PBR bags where the environmental and nutritional condition can be controlled and can
achieve the required growth volume. In this stage, the culture is constantly mixed to
avoid settling of the sediment at the bottom of the bag at the same time to encourage
gaseous exchange in the bags. This is achieved by applying turbulent flow with the help
of mechanical pump (Liam Brennan & Philip Owende, 2010).
Univers
ity of
Mala
ya

16
Later for the red stage (RS), open pond system is opted in order to offset the
high construction and operation cost in GS. The pond is design about 0.3m depth and
installed a propeller to enhance the gases exchange. The algae will left suffocate without
nutrient which accumulates red substance called astaxanthin will be harvested and
processed (Liam Brennan & Philip Owende, 2010).
Upon completion of RS, in order to recover the product as seen in Figure 2.1
either in solid biomass or oleoresin (lipid content) , the culture will need to undergo a
process to reduce the water content either flocculation and settling, centrifugation,
filtration or air flotation depending on the size and density of the cell (Brentner,
Eckelman, & Zimmerman, 2011).
Univers
ity of
Mala
ya

17
Figure 2.2: Typical Flowchart of Haematococcus pluvialis in Production of Astaxanthin
VACCUUM PACKED
Univers
ity of
Mala
ya

18
2.5.3 Challenges in Microalgae Cultivation
Use of PBR bags or tubular model can be challenging as the pressure increases
as the volume of the cultivation increases. Even closed PBR is the best method of
cultivation (Eldridge & Aditya M. Kunjapur*, 2010), yet the initial cost of installation is
major drawback of this method compared to open pond system (Elrayies, 2018). Besides
that, most of the production facilities to cultivate microalgae harvests only the biomass
which contributing about 1% of the total culture, remaining 99% is waste been treated
or recycled where both are expensive procedure (Zhang et al., 2014). On the other hand,
the energy required to cultivate microalgae indoor using PBR are relatively high about
15 times higher compared to open pond system as reported in 2010 (Jorquera, Kiperstok,
Emerson, Marcelo, & Maria, 2010). Some of the discarded water from the PBR without
proper treatment may cause eutrophication causes the water or lake system interrupted
by residual of chemicals used in the media preparation (Usher et al., 2014). Some of the
open pond cultivation causes the release of methane gas can be potential to greenhouse
effect.
Univers
ity of
Mala
ya

19
CHAPTER 3: METHODOLOGY
Methodology for this research study was adapted from ISO 14051 Environmental
management: the general framework of material flow cost accounting (MFCA). The
implementation of MFCA in the selected company were done in three phases;
preparation, data collection and calculation. The selected company’s manufacturing line
was monitored for 6 months (May – October 2017). The study was carried in the stages
as below:
1. Literature Research
2. Finding Company for Research
3. Obtaining Production Data
4. MFCA Implementation
Figure 3.1 will illustrating the flow chart of the methodology in this research project.
Univers
ity of
Mala
ya

20
Figure 3.1: Flow Chart of Research Project
Literature research
Finding Company for
Research
Obtaining Production
Data
MFCA
Implementation
Engaging Management &
Determining Roles &
Responsibilities
Cost Allocation Scope and Boundary of the
Process and Establishing a
Material Flow Model
Interpreting and
Communicating MFCA
Results
Enhancing Production Practices
& Reducing Material Losses
through MFCA Results
Objective 1
Objective 2
Pre-leminary stage
Univers
ity of
Mala
ya
21
3.1 Literature Research
MFCA is a new method that was introduced in late 90s and in Malaysia the
knowledge just been implemented in 2015, resulted in lack of references in Malaysian
manufacturing sector. Most of the reading material and findings were taken from ISO
14051 and some industries which implemented this in Japan (lens manufacturing
company) and Germany as guidance. Very few paper which were available in Malaysia
also used in this study.
3.2 Finding for the Company
Choosing a suitable company has been challenging as the chosen manufacturing
company should be disclosing production data for the calculation of MFCA. The
companies currently aimed for the research are such as semiconductor, food
manufacturing and microalgae manufacturing companies. A letter requesting for
companies’ approval to conduct the research will be sent to each potential company one
by one until a company agrees.
3.3 Obtaining Production Data
A chosen company’s single manufacturing line (RS) has been chosen and the
total production data were monitored and collected for the 6 months. This data includes
volume used in the cultivation and cost of input materials, output materials and any
wastage in the middle of processes.
Univers
ity of
Mala
ya

22
3.4 MFCA Implementation Steps
3.4.1 Engaging Management and Determining Roles and Responsibilities
To ensure MFCA is implemented successfully, the management should give full
support so that the research project would have the freedom in assessing single
manufacturing line. At the end of the project, a strong support and participation of all
level of management is recommended to implement MFCA in various steps in the
process.
3.4.2 Scope and Boundary of the Process and Establishing a Material Flow Model
Restriction on MFCA need to identify and understands clearly the scale of
MFCA activity based on collected material flow data. For this research project, only
single line in the manufacturing process has been chosen due to limitation of time and
sufficient to cover the objective of the study. Upon identification of boundaries are
established, the data can be collected as specified to the requirement of MFCA.
3.4.3 Cost Allocation
MFCA divides costs into the following categories:
• Material cost: cost for a substance that enters and/or leaves a quantity center
• Energy cost: cost for electricity, fuel, steam, heat, and compressed air
• System cost: Cost of labor, cost of depreciation and maintenance, and cost of
transport
• Waste management cost: cost of handling waste generated in a quantity center
Univers
ity of
Mala
ya
23
3.4.4 Interpreting and Communicating MFCA Results
Implementation of MFCA enables the company to identify the costs associated
to the material loss besides providing abundant of details throughout the manufacturing
line. These information which comprises materials costs, energy costs, system costs and
waste management cost for the process as well as corresponding wastes generated from
the production line. By identifying the costs associated with generated waste, the
management would be able spot the highest waste generation in the production line can
be monitored and modified in order to contribute more on the profit for the company
rather than been an economical waste. These details of all the costs contributing to
product and waste will be represented in details in flow cost matrix on each identified
quantity center.
3.4.5 Improving Production Practices and Reducing Material Loss through
MFCA Results
From the analysis of data done via implementing MFCA in the single line of the
production, the information shall be disclose with the management and the organization
may review the data associated with the costs of material loss. The organization which
comprises the highest authority with production manager may take a look on the factors
contributing to material loss and identify room for improvements to reduce wastes. The
improvements shall be taken into consideration both from environmental and financial
aspects by improving the efficiency of the machines, modifying production practices,
substitution of raw materials and intensive R&D to enhance the productivity of the
microalgae.
Univers
ity of
Mala
ya

24
CHAPTER 4: RESULTS AND DISCUSSION
4.1 Selection of Manufacturing Company
The company used for this study is situated as Puchong, Selangor. It is a well-
known company for the manufacturing of microalgae and the only facility to grow
microalgae in Malaysia. The company is the pioneer in the microalgae manufacturing
and specialized in research and development (R&D), consultation as well
commercialization of products derived from microalgae. These products are later been
processed into cosmetic and feedstock manufacturing as well as in pharmaceutical
business. The company is just started to be concern on the environmental effect due to
their practices and giving attention on the manufacturing environmental-friendly
products. As observed in the study, the company is now keen on the recycling on raw
materials such as PBR bags and waste water treatment to be reused in the plant. As
requested, in this study the identity of the company is not disclosed and hence will be
identified as ABC Sdn. Bhd.
4.2 Identification of Cost Centre.
The flow of material used in this study is based on the red stage (RS) known as
final stage of cultivation of microalgae before it sent for the further process to extract
the biomass. The RS is where the microalgae will be undergoing starvation of nutrient
and will produce red pigmentation (lipid) which later extracted as Astaxanthin. There
were total of five Quantity Centre (QC) chosen for the study in RS which involves;
preparation, water treatment, inoculation, adjustment and lastly harvesting.
Univers
ity of
Mala
ya

25
In the flow of process, the wastes are only generated in QC5: Harvesting which
sum up into 16.43% of total material flow in the RS. Water is used as main medium for
cultivation of microalgae and the company chooses PBR bags to avoid contamination
and evaporation on the microalgae. RS was placed on the second floor of the
manufacturing plant; enable the company to harvest sunlight for the stressing of the
algae which also a factor to accumulate more astaxanthin in the cells. The PBR bags
were arranged in the rack supplied with aeration and ventilation opted for the stage is
exhaust fan and cooling pad. In this stage, microalgae were also supplied with artificial
lighting which functions during night time to enhance the accumulation of astaxanthin
in the cell. The workers will take samples randomly about 10 to 15ml from each bag and
sent for quality check to ensure the cells are in good conditions. In addition, the staffs
also required to check all other parameters in this stage which involving the record of
temperature and light intensity.
4.2.1 Preparation
At this stage, the PBR bags are filled with water and supplied with aeration as
the first step in the process. The bags will be arranged in the racks and get prepared with
the aeration system for the next step. Usually this process is the most time consuming as
it involves more labor works and mostly are manual.
4.2.2 Water treatment
Even the water used from local water supply, the company adapted for systemic
water treatment function from the main source to the one used in the premises. The
water will undergo series of filtration and ozone treatment, the company performed
Univers
ity of
Mala
ya
26
chlorination and dechlorination at this stage to make sure the water used as medium for
the cultivation of microalgae is free from any contaminants.
4.2.3 Inoculation
At this stage which after 2 days of preparation, the inoculum is received from
green stage (GS). The cells are now fully grown and meet the specifications after check
by the quality department and ready to be cultivated at RS. There will be no more cell
division at this stage, the cells will be stressed and suffocated without nutrient and
unfavorable environmental conditions such as temperature and higher light intensity.
About 600ml of sludge (concentrated liquid with cells) will be channeled to each bag
via a drainage system and then will be sealed using another material. This process will
be done in batch or continuous system depending on the volume of the culture
transferred from GS.
4.2.4 Adjustment
After few days in RS, the culture will be chosen to be sent for quality check and
the parameters are checked thoroughly. These include the appearance of the cells, the
cell weight, size and most importantly the pH of the culture. Upon receive of report
from the QA department, the adjustment of the pH shall be made by adding chemicals
into the culture and again the culture is checked to ensure to adjustment is effective.
This quantity center is the lowest material costs used.
Univers
ity of
Mala
ya

27
4.2.5 Harvesting
At this stage, the aeration will be stopped to enable the cells to settle down at the
bottom of the PBR bags. The cells is now been accumulated with astaxanthin and ready
to be sent to further processing to extract the oleoresin and later processed into a powder.
This is the only quantity centre to face a major material loss which about 16.43%. The
end product which is the sludge will be approximately about 600ml will be collected
and passed for bioprocessing involve centrifugation, cracking and freeze-drying. The RS
completes here with total material recovered about 83.57%
Univers
ity of
Mala
ya

28
4.3 Cost Calculation and Allocation
4.3.1 Calculation of Material Costs
Figure 4.0.1: Material Flow in RS of ABC Sdn.Bhd.
PREPARATION WATER
TREATMENT
INOCULATION
ADJUSTMENT
HARVESTING
Mat. A
Mat. B
Mat. C
Mat. D
Mat. E
Mat. F
Mat. G
Mat. H Mat. I
Mat. J
Mat. A
Mat. B
Mat. C
Mat. D
Mat. E
Keys
QC - Quantity Centre
Mat. - Material
Material flow towards the product
Material loss
Product Mat. F
Mat. G
Mat. H
Mat. I
Mat. J
Univers
ity of
Mala
ya

29
Table 4.1: Material Costs for Constructed Flow Model Process
Period: May – October 2017
Composition of product and
material losses QC 1 QC 2
Preparation Water Treatment
Products Price per bag (RM) Total number of bags Costs (RM) Price per bag Total number of bags Costs (RM)
Material A 0.15 56640 8496.00 0.15 56640 8496.00
Material B 0.17 56640 9628.80 0.17 56640 9628.80
Material C 1.15 56640 65136.00 1.15 56640 65136.00
Material D 0.2 56640 11328.00 0.2 56640 11328.00
Material E 3.25 56640 184080.00 3.25 56640 184080.00
Material F - 56640 - 0.1 56640 5664.00
Material G - 56640 - 0.08 56640 4531.20
Material H - 56640 - 0.02 56640 1132.80
Material I - 56640 - - 56640 -
Material J - 56640 - - 56640 -
278668.80
289996.80
Material Losses
Price per bag (RM) Total number of bags Costs (RM) Price per bag Total number of bags Costs (RM)
Material A - 56640 - - 56640 -
Material B - 56640 - - 56640 -
Material C - 56640 - - 56640 -
Material D - 56640 - - 56640 -
Material E - 56640 - - 56640 -
Material F - 56640 - - 56640 -
Material G - 56640 - - 56640 -
Material H - 56640 - - 56640 -
Material I - 56640 - - 56640 -
Material J - 56640 - - 56640 -
- -
-
Univers
ity of
Mala
ya

30
Table 4.1, continued: Material Costs for Constructed Flow Model Process
Period: May – October 2017
Composition of product and material
losses QC 3 QC 4
Inoculation Adjustment
Products Price per bag (RM) Total number of bags Costs (RM) Price per bag Total number of bags Costs (RM)
Material A 0.15 56640 8496 0.15 56640 8496
Material B 0.17 56640 9628.8 0.17 56640 9628.8
Material C 1.15 56640 65136 1.15 56640 65136
Material D 0.2 56640 11328 0.2 56640 11328
Material E 3.25 56640 184080 3.25 56640 184080
Material F 0.1 56640 5664 0.1 56640 5664
Material G 0.08 56640 4531.2 0.08 56640 4531.2
Material H 0.02 56640 1132.8 0.02 56640 1132.8
Material I 19.75 56640 1118640.00 19.75 56640 1118640
Material J - 56640 - 0.1 56640 5664.00
1408636.80
1414300.80
Material Losses
Price per bag (RM) Total number of bags Costs (RM) Price per bag Total number of bags Costs (RM)
Material A - 56640 - - 56640 -
Material B - 56640 - - 56640 -
Material C - 56640 - - 56640 -
Material D - 56640 - - 56640 -
Material E - 56640 - - 56640 -
Material F - 56640 - - 56640 -
Material G - 56640 - - 56640 -
Material H - 56640 - - 56640 -
Material I - 56640 - - 56640 -
Material J - 56640 - - 56640 -
Univers
ity of
Mala
ya

31
Table 4.1, continued: Material Costs for Constructed Flow Model Process
Period: May – October 2017
Composition of product and material
losses QC 5 TOTAL COST
Harvesting
Products Price per bag (RM) Total number of bags Costs (RM) 1414300.80
Material A 0.15 56640 8496 8496.00
Material B 0.17 56640 9628.8 9628.80
Material C 1.15 56640 65136 65136.00
Material D 0.2 56640 11328 11328.00
Material E 3.25 56640 184080 184080.00
Material F 0.1 56640 5664 5664.00
Material G 0.08 56640 4531.2 4531.20
Material H 0.02 56640 1132.8 1132.80
Material I 19.75 56640 1118640 1118640.00
Material J 0.1 56640 5664 5664.00
1414300.80
Material Losses
Price per bag Total number of bags Costs 278102.40
Material A 0.15 56640 8496 8496.00
Material B 0.16 56640 9062.4 9062.40
Material C 1.15 56640 65136 65136.00
Material D 0.2 56640 11328 11328.00
Material E 3.25 56640 184080 184080.00
Material F - 56640 - -
Material G - 56640 - -
Material H - 56640 - -
Material I - 56640 - -
Material J - 56640 - -
278102.40 1692403.20 Univers
ity of
Mala
ya

32
The total material cost has been calculated in terms of per bag as the unit used
for the material A to B were differs from one another, for example material A was in the
form of solid (grams) and the following material B was in the liquid form. The costs
associated in the production also calculated in term of PBR bags of culture
accommodate in the manufacturing plant, thus MFCA for this industry calculated as
followed by the company.
During the study period which was from May 2017 to October 2017, the plant
had produced total of 56640 bags of culture which corresponds to total manufacturing
costs of RM 1, 692 403.20 and the wastes generated throughout the process is about
16% mainly on the material loss which not becoming the part of the finished product.
4.3.2 Calculation and Allocation of Energy Costs, System Costs and Waste
Management Cost.
Total costs for energy, system and waste management was obtained directly
from the company and later for each quantity center was calculated according to the cost
data. Table 4.2 shows the allocation of energy costs, system costs and waste
management costs leaving from each quantity center.
Table 4.2: Energy costs, system costs and waste management costs in each QC.
Type of Cost QC1 QC2 QC3 QC4 QC5 Total Cost
Energy Cost (RM) 1059.84 1059.84 1059.84 136569.6 2119.56 141868.68
System Cost (RM) 3000 1800 1800 45000 3600 55200
Waste Management Cost
(RM) 0 0 0 0 1680 1680
Univers
ity of
Mala
ya

33
4.3.3 Calculation and Allocation of Energy Costs, System Costs and Waste
Management Costs to Products and Material Losses in each QC.
4.3.3.1 Calculation and Allocation of System Costs and Waste Management Costs
to Product and Materials Losses in each QC.
In this research study, it is decided to take consideration on the material losses to
be used to determine the system and waste management costs in each QC. Thus, the
percentage of products and material losses in each QC as stated in table 4.1.
In the whole manufacturing process in RS, none of the QC contributed to
material losses up to QC4 where the inputs are utilized completely which is 100.00% in
the cultivation of microalgae. QC5, the harvesting processes contributes to the only
material loss in the process which is about 16.43% from the total input and
corresponding to the product is about 83.57%.
Table 4.3 shows the summary of material distribution percentage for calculation
of system cost. The percentages are calculated based on the Table 4.1.
Univers
ity of
Mala
ya

34
Table 4.3: Summary of Material Cost Distribution Percentage
Period: May – October 2017
Type of cost QC 1
(RM)
QC 2
(RM)
QC 3
(RM)
QC 4
(RM)
QC 5
(RM)
Product 278668.80
(100.00%)
289996.80
(100.00%)
1408636.80
(100.00%)
1414300.80
(100.00%)
1136198.40
(83.57%)
Material Losses 0
(0.00%)
0
(0.00%)
0
(0.00%)
0
(0.00%)
278102.40
(16.43%)
Total 278668.80
(100.00%)
289996.80
(100.00%)
1408636.80
(100.00%)
1414300.80
(100.00%)
1414300.80
(100.00%)
4.3.3.2 Allocation Criteria for Energy Use
Quantification of energy for each QC can be obtained by considering the
efficiency of machines and wastage from the company. The additional data from
machinery were obtained directly from ABC Sdn. Bhd and then were used to calculate
the energy inefficiency and wastage in the manufacturing process in RS. The
inefficiency in the process were measured in 2 aspects; the operation time and machine
inefficiency as the third aspect material inefficiency was neglected since the
manufacturing process in based on continuous cultivation from previous stage. Energy
efficiency for each QC was shown below:
Univers
ity of
Mala
ya

35
For quantity center 1 (Preparation):
(a) 3% of the running time of the energy was wasted to start up, maintenance and
calibration hence only 97% of the energy is used for the production. The premise
uses electrical machines which need to undergone some calibration and
inspection so that the culture is supplied with sufficient amount for the process.
(b) Almost all the machines used in the premises can work efficiently up to 95% and
the remaining energy is wasted due to inefficiency of the machine itself.
For quantity center 2 (Treatment)
(a) Total of 97% of the energy is used for the manufacturing process which
become the part of product, balance 3% was used in on off basis for the
setup and calibration to prevent any failure during operation
(b) At this stage, some of the machinery is inefficient by 5% which resulting in
the usage of the 95% for the manufacturing process. This is pure on the
machine inefficiency compared to calculate and expected value for the
production.
Univers
ity of
Mala
ya

36
For quantity center 3 (Inoculation);
(a) At this point, equipment such as funnel, measuring cylinder and beakers
were used to transfer the culture from GS into the PBR bags. This equipment
needed some time to be sterilized which is about 3% of the energy is used up
for this. About 97% of the energy is used as a part of the process.
(b) Usage of semi-automated equipment causes the reading of the volume are
inaccurate causes some of the residual are left in the equipment and thrown.
This lead to about %5 inefficiency of the equipment used.
For quantity center 4 and 5 (Adjustment and Harvesting);
(a) Artificial lighting and exhaust fan were used to maintain the desired
temperature and light intensity but it was just used 12 hours in daily basis.
The operation (switching on and off) and maintenance of this equipment
used up about 6% of the total operating time thus resulting in only 94% used
for the manufacturing purposes.
(b) These are the longest duration where the culture been exposed to extreme
temperature and light intensity. Initially the company was using fluorescent
lamp to provide higher light intensity and recently it changed to LED
lighting. Company also uses exhaust fan to maintain the temperature which
was placed in a bigger gap from the rack of PBR bags. However, in both
stages the equipment shows only 82% efficient due to energy lost in the form
Univers
ity of
Mala
ya
37
of heat, temperature lost to environment and light source is not fully
penetrated into the PBR bags.
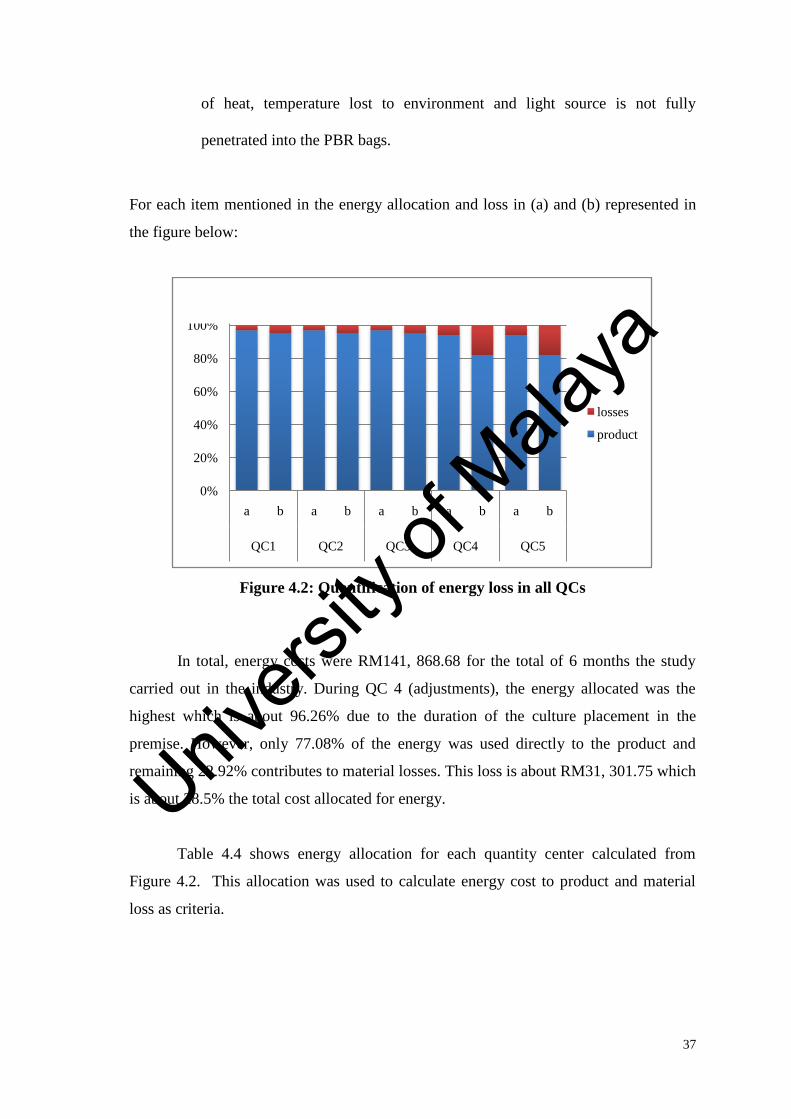
For each item mentioned in the energy allocation and loss in (a) and (b) represented in
the figure below:
Figure 4.2: Quantification of energy loss in all QCs
In total, energy costs were RM141, 868.68 for the total of 6 months the study
carried out in the industry. During QC 4 (adjustments), the energy allocated was the
highest which is about 96.26% due to the duration of the culture placement in the
premise. However, only 77.08% of the energy was used directly to the product and
remaining 22.92% contributes to material losses. This loss is about RM31, 301.75 which
is about 28.5% the total cost allocated for energy.
Table 4.4 shows energy allocation for each quantity center calculated from
Figure 4.2. This allocation was used to calculate energy cost to product and material
loss as criteria.
0%
20%
40%
60%
80%
100%
120%
a b a b a b a b a b
QC1 QC2 QC3 QC4 QC5
losses
product
Univers
ity of
Mala
ya

38
Table 4.4: Percentage of Energy Allocation for each QC
Quantity
Center
Energy Allocation for
Product
Energy Allocation for
Material Losses
QC 1 92.15% 7.85%
QC 2 92.15% 7.85%
QC 3 92.15% 7.85%
QC 4 77.08% 22.92%
QC 5 77.08% 22.92%
4.3.4 Integrated Presentation and Analysis of Cost Data
All the cost associated in the manufacturing process was presented in the Table
4.5 comprising material, energy, system and waste management cost. The data was
derived as in the material cost in Table 4.1 at each quantity center.
Material costs were calculated from the material flow in the process, energy
costs is calculated based on the allocation of criterion that established as machinery
setup, calibration, maintenance and its inefficiency which contributed to waste of energy.
System costs were applicable from the company and later corresponding losses is
calculated based on the percentage of material losses and allocation to a product. As for
waste management, there is no contribution to product as the total costs were taken to be
a part of material losses.
Univers
ity of
Mala
ya

39
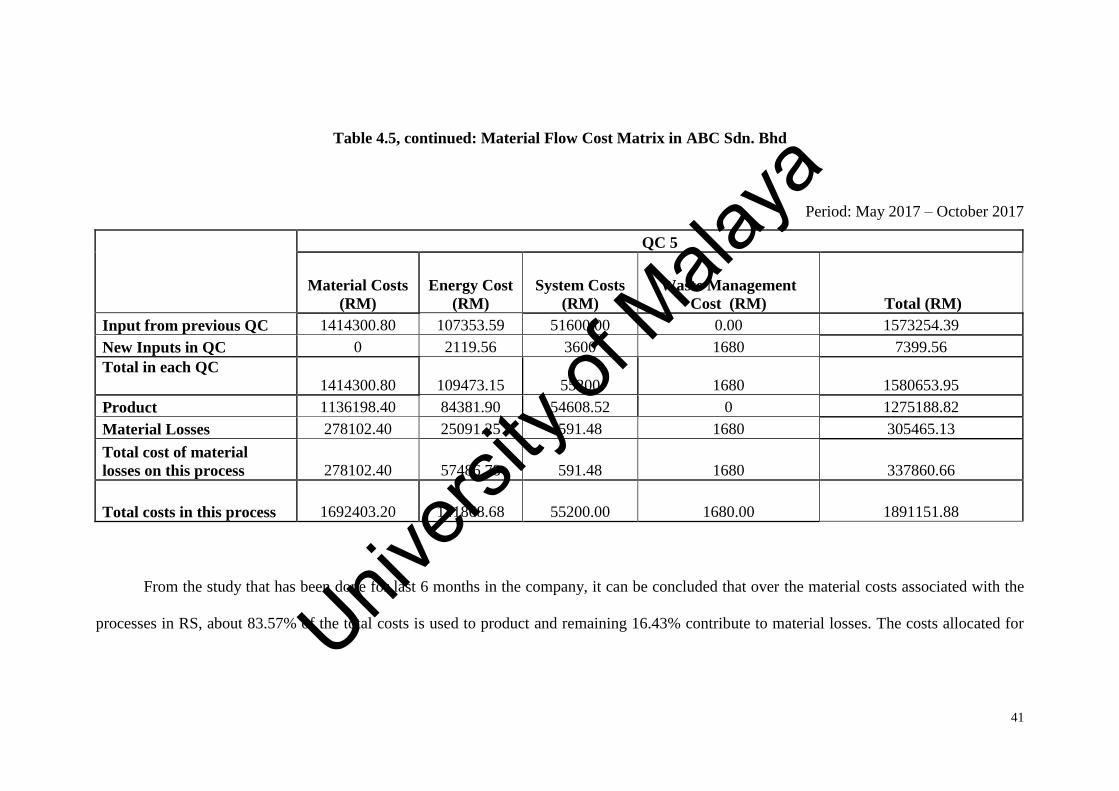
Table 4.5: Material Flow Cost Matrix in ABC Sdn. Bhd
Period: May 2017 – October 2017
QC 1 QC 2
Material Costs
(RM)
Energy
Cost
(RM)
System
Costs (RM)
Waste
Management
Cost (RM)
Material
Costs (RM)
Energy
Cost
(RM)
System
Costs
(RM)
Waste
Management
Cost (RM)
Total
(RM)
Input from
previous QC
278668.8 976.64 3000 0 282645.44
New Inputs in
QC 278668.8 1059.84 3000 0 11328 1059.84 1800 0 14187.84
Total in each QC 278668.8 1059.84 3000 0 289996.8 2036.48 4800 0 296833.28
Product 278668.8 976.64 3000 0 289996.8 1876.62 4800 0 296673.42
Material Losses 0 83.2 0 0 0 159.86 0 0 159.86
Total cost of
material losses
on this process
0 243.06 0 0 243.06
Total costs in
this process
289996.8 2119.68 4800 0 296993.14
Univers
ity of
Mala
ya

40
Table 4.5, continued: Material Flow Cost Matrix in ABC Sdn. Bhd
Period: May 2017 – October 2017
QC 3 QC 4
Material
Costs
(RM)
Energy
Cost
(RM)
System
Costs
(RM)
Waste
Management
Cost (RM)
Total
(RM)
Material
Costs
(RM)
Energy
Cost
(RM)
System
Costs
(RM)
Waste
Management
Cost (RM) Total (RM)
Input from
previous QC 289996.8 1876.62 4800.00 0 296673.42 1408636.8 2705.95 6600.00 0 1417942.75
New Inputs in QC 1118640 1059.84 1800 0 1121499.84 5664 136569.6 45000 0 187233.6
Total in each QC 1408636.8 2936.46 6600 0 1418173.26 1414300.8 139275.55 51600 0 1605176.35
Product 1408636.8 2705.95 6600 0 1417942.75 1414300.8 107353.59 51600 0 1573254.39
Material Losses 0 230.51 0 0 230.51 0 31921.96 0 0 31921.96
Total cost of
material losses on
this process 0 473.57 0 0 473.57 0 32395.53 0 0 32395.53
Total costs in this
process 1408636.8 3179.52 6600 0 1418403.77 1414300.8 139749.12 51600 0 1637098.31
Univ
ersity
of M
alaya
41
Table 4.5, continued: Material Flow Cost Matrix in ABC Sdn. Bhd
Period: May 2017 – October 2017
QC 5
Material Costs
(RM)
Energy Cost
(RM)
System Costs
(RM)
Waste Management
Cost (RM) Total (RM)
Input from previous QC 1414300.80 107353.59 51600.00 0.00 1573254.39
New Inputs in QC 0 2119.56 3600 1680 7399.56
Total in each QC
1414300.80 109473.15 55200 1680 1580653.95
Product 1136198.40 84381.90 54608.52 0 1275188.82
Material Losses 278102.40 25091.25 591.48 1680 305465.13
Total cost of material
losses on this process 278102.40 57486.78 591.48 1680 337860.66
Total costs in this process 1692403.20 141868.68 55200.00 1680.00 1891151.88
From the study that has been done for last 6 months in the company, it can be concluded that over the material costs associated with the
processes in RS, about 83.57% of the total costs is used to product and remaining 16.43% contribute to material losses. The costs allocated for Univers
ity of
Mala
ya

42
products accounted for 82.13% of the total costs which material losses in this process takes another 17.87%. From this study, it can be concluded
that material losses is more than expected and yield rate from RS which is about 82% was not measured in details before.
Univers
ity of
Mala
ya

43
In the production line of cultivation, the final product is totally dependent from
the RS that has been used to apply MFCA for this study. The company is dependent on
the output from this stage to extract the high value product which is astaxanthin. As
considered by the company, material B and PBR bags (material C) is the main wastes
from the processes.
Besides, by calculating all the material costs, energy costs, system costs and
waste management costs in the quantity centers of RS it can be clearly seen that there is
a material wastes which provides the room for improvement to ensure the business is
sustainable and reduced in wastes.
From the study done, the main findings were on the losses in both material and
energy is not as assumed by the company which is lesser than 10%. The company
intention was to provide a process which has reduced in waste and environmental
friendly business. By applying MFCA in one of the production line, it resulted in
17.87% of the total costs is extremely higher than expected and this was revealed so that
material improvement can be done. These losses were overlooked by the company
before, but through this study it can be clearly seen that the production line can be
improved.
Univers
ity of
Mala
ya
44
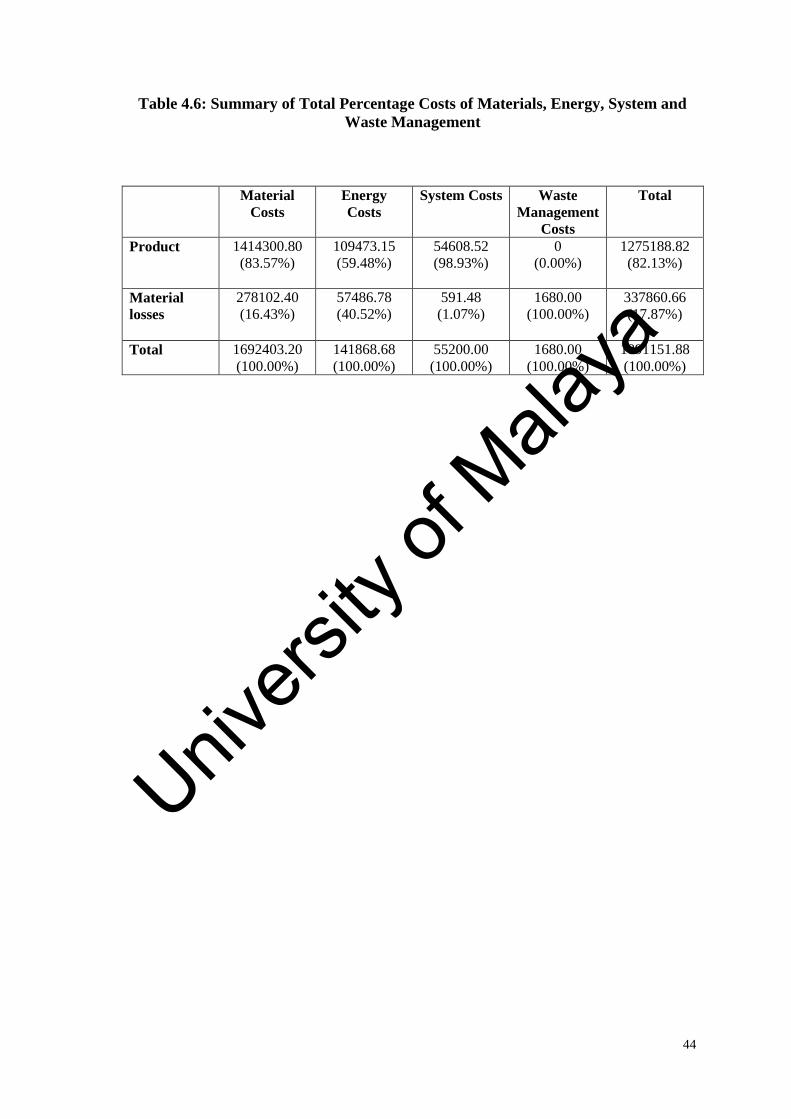
Table 4.6: Summary of Total Percentage Costs of Materials, Energy, System and
Waste Management
Material
Costs
Energy
Costs
System Costs Waste
Management
Costs
Total
Product 1414300.80
(83.57%)
109473.15
(59.48%)
54608.52
(98.93%)
0
(0.00%)
1275188.82
(82.13%)
Material
losses
278102.40
(16.43%)
57486.78
(40.52%)
591.48
(1.07%)
1680.00
(100.00%)
337860.66
(17.87%)
Total 1692403.20
(100.00%)
141868.68
(100.00%)
55200.00
(100.00%)
1680.00
(100.00%)
1891151.88
(100.00%)
Univers
ity of
Mala
ya

45
CHAPTER 5: CONCLUSION AND RECOMMENDATION
5.1 Conclusion
The microalgae manufacturing industry is the one of the future industry which
has many potential in producing both high value products and renewable fuel, which
supposed to be environmental friendly. From this study, by applying MFCA into in the
manufacturing processes, it can be clearly seen that wastes accumulated from processes
makes it not 100% efficient.
Many industries are not aware on the costs contributed by the wastes generated
from the company’s processes in manufacturing. This was the tradition of the business
of people, who just concentrate on the outcome, and the wastes generated were
indicated only in the term of volume and not the costs associated with it. From this
study, ABC Sdn.Bhd. has applied MFCA in one of the process indicates the losses and
improvement method can be drawn from the conclusion in regards with the objective of
the study with the following information:
1. All the costs associated with the process in RS were calculated and illustrated in
the table of flow cost involving material, energy, system and waste management
cost. From the calculation, the company’s material flow costs are accounted to
17.87% on the material losses. The highest material loss was from the energy
costs which due to operation procedures and machine inefficiency.
2. Based on the calculation by applying MFCA, few recommendations were
suggested to the company for improvement in the overall process to enhance the
efficiency of the material flow. The suggestions are then discussed in section 5.2.
Univers
ity of
Mala
ya

46
From the study, it can be seen clearly that the company is losing significant
amount of money to the energy lost which can be invested into the machine to
improvise the machineries used in the process.
5.2 Recommendations
Based on the MFCA application, it can be clearly seen QC4 (Adjustments) has
highest costs allocation and eventually contributing to highest material loss in term of
energy. Most of the recommendation for the company is based on the costs associated
with the material loss from the manufacturing processes. The possible recommendations
are as below:
1. The company may consider using fully automated system rather than depending
on human work in transferring culture from GS to RS. In this process, the energy
has been wasted since the premises has full run on the exhaust fan before the
premise is fully occupied with the culture.
2. The company also can consider using lower transparency bag, which can allow
the LED light to penetrate directly into the culture in QC4 to make the stressing
period of the cells can be shorten. By implementing this, the company may
reduce the power supplied via LED and these may be replaced with centralized
lighting system rather than by rack/bags.
3. The water used in the GS and RS can be recycled and reused back in the process
for cultivating the microalgae. This can be done by installing water purification
internally which can reduce the dependability on the water source.
Univers
ity of
Mala
ya

47
4. The company also installed membrane filter and aeration tube to provide
agitation for the culture and filter the atmospheric air to be supplied to the
culture, it is contributing to waste in QC 5 after harvesting, and this can be
reduced by using centralized air purification system within the premise. Even the
installation cost maybe high, it can definitely reduce the risk of contamination.
5. The company may consider adapting to continuous and automated process which
can reduce the material lost in term of raw materials, energy, system and waste
management cost, thus can enhance the efficiency of the manufacturing process.
Even some of the material are recycled for more than one time use, the incurred
cost are difficult to be recovered. The company may also consider implementing
MFCA in all the manufacturing line so that all material losses can be traced and
brought to management’s attention. This would definitely contribute to the increase
in profitability of the company by reducing the wastes generated in each line.
Univers
ity of
Mala
ya

48
REFERENCES
Becker, E. (2007). Micro-algae as a source of protein. Biotechnol Adv, 25(207), 10.
Borowitzka MA. (1994). Algal biotechnology products and processes-matching science
and economics. J Appl Phycol, 4(3), 267–79.
Boussiba. (2000). Carotenogenesis in the green alga Haematococcus pluvialis: cellular
physiology and stress response.
Brentner, L. B., Eckelman, M. J., & Zimmerman, J. B. (2011). Combinatorial Life
Cycle Assessment to Inform Process Design of Industrial Production of Algal
Biodiesel. Environmental Science & Technology, 45(16), 7060–7067.
Burritt, R. (2005). Environmental management accounting: roadblocks on the way to the
green and pleasant land. Business Strategy and the Environment, 13(1), 13–32.
Eldridge, R. B., & Aditya M. Kunjapur*. (2010). Photobioreactor Design for
Commercial Biofuel Production from Microalgae. Industrial & Engineering
Chemistry Research, 49(8), 3516–3526.
Elrayies, G. M. (2018). Microalgae: Prospects for greener future buildings. Renewable
and Sustainable Energy Reviews, 81(August 2016), 1175–1191.
https://doi.org/10.1016/j.rser.2017.08.032
Ghazilla, R. A. R., Sakundarini, N., Abdul-Rashid, S. H., Ayub, N. S., Olugu, E. U., &
Musa, S. N. (2015). Drivers and barriers analysis for green manufacturing practices
in Malaysian smes: A preliminary findings. Procedia CIRP, 26, 658–663.
https://doi.org/10.1016/j.procir.2015.02.085
Hassan, M.Nasir, Z. Z. and R. A. R. (1998). Managing costs of urban pollution in
Malaysia: The case of solid wastes. Netherland Geographical Studies: Looking at
maps in the dark. Direction for Geographical Research in Land Management and
Sustainable Development in Urban and Rural Environment of the.
Hoq, M. Z., Ha, N. C., & Said, S. M. (2009). SMEs in the Malaysian Economy.
International Journal of Marketing Studies, Vol.1(2), 3–17.
https://doi.org/10.2139/ssrn.1851426
Hyršlová, J., Vágner, M., & Palásek, J. (2011). Material Flow Cost Accounting
( MFCA ) – Tool For The Optimization Of Corporate Production Processes, 9(1),
5–18. https://doi.org/10.3846/bme.2011.01
Univers
ity of
Mala
ya

49
ISO. Environmental Management - Life Cycle Assessment - Principles and Framework
(2006).
Jankowska, E., Sahu, A. K., & Oleskowicz-popiel, P. (2017). Biogas from microalgae :
Review on microalgae â€TM
s cultivation , harvesting and pretreatment for
anaerobic digestion. Renewable and Sustainable Energy Reviews, 75(November
2016), 692–709. https://doi.org/10.1016/j.rser.2016.11.045
Jasch, C. (2009). Principles and Procedures. In Environmental and Material Flow Cost
Accounting. Springer, The Netherlands.
Jorquera, O., Kiperstok, A., Emerson, L. G., Marcelo, A. S., & Maria, E. (2010).
Comparative energy life-cycle analyses of microalgal biomass production in open
ponds and photobioreactors. Bioresource Technology, 101(4), 1406–1413.
https://doi.org/10.1016/J.BIORTECH.2009.09.038
Key Statistics on SMEs. (2011). SME Corporation Malaysia.
Kokubu, K., Tachikawa, H. (2013). Material flow cost accounting: significance and
practical approach. In K. M. Kauffman, J., Lee (Ed.), Handbook of Sustainable
Engineering (pp. 351–359). Dordrecht, Netherlands: Springer.
Kröger M, M.-L. F. (2012). Review on possible algal-biofuel production processes.
Biofuels, 3(3), 333–49.
Lee, B.W., Jung, S.T., Kim, J. (2005). Environmental accounting guidelines and
corporate cases in Korea: implications for developing countries. In S. Rikhardsson,
P.M., Bennett, M., Bouma, J., Schaltegger (Ed.), Implementing Environmental
Management Accounting: Status and Challenges (pp. 239–255). The Netherlands:
Springer.
Let, C. C., Weng, C. K., & Wahid, M. B. (2010). Material Flow Cost Accounting
( MFCA ): A Brief Introduction, 60(May), 28–37.
Liam Brennan, & Philip Owende. (2010). Biofuels from microalgae—A review of
technologies for production, processing, and extractions of biofuels and co-
products. Renewable and Sustainable Energy Reviews, 14(2), 557–577.
https://doi.org/10.1016/J.RSER.2009.10.009
Markou, G., & Kazakis, N. (2013). Microalgae for high-value compounds and biofuels
production: a review with focus on cultivation under stress conditions. Biotechnol.
Adv., 31(8), 1532–1542.
Univers
ity of
Mala
ya

50
Martin Koller, Alexander Muhr, G. B. (2014). Microalgae as versatile cellular factories
for valued products. Algal Research, 6, 52–63.
https://doi.org/10.1016/J.ALGAL.2014.09.002
Mirόn AS, Gόmez Ac, Camacho FG, Grima EM, C. Y. (1999). Comparative evaluation
of compact photobioreactors for large-scale monoculture of microalgae marine
bioprocess engineering. Proceedings of an international symposium organized
under auspices of the working party on applied biocatalysis of the european fed, 35,
249–270.
Mishelle, D., & Hari Lall, G. (2015). The effectiveness of using material flow cost
accounting (MFCA) to identify non-product output costs. Environmental
Economics, 6(2).
MOF. (2014). Malaysia Economic Report 2014/2015.
Mohd Nasir Hassan, Rafia Afroz, Ahmad Fariz Mohamed, M. A. (2005). Economic
Instruments for Managing Industrial Waste in Malaysia, 6, 87–106.
Musa, H., & Chinniah, M. (2016). Malaysian SMEs Development : Future and
Challenges on Going. Procedia - Social and Behavioral Sciences, 224(August
2015), 254–262. https://doi.org/10.1016/j.sbspro.2016.05.457
Nakajima, M. (2004). On the differences between material flow cost accounting and
traditional cost accounting - in reply to the questions and misunderstandings on
material flow cost accounting.
Nakajima, M. (2006). The New Management Accounting Field Established by Material
Flow Cost Accounting, 8, 1–22.
Nakajima, M., Kimura, A., & Wagner, B. (2015). Introduction of material fl ow cost
accounting ( MFCA ) to the supply chain : a questionnaire study on the challenges
of constructing a low-carbon supply chain to promote resource ef fi ciency. Journal
of Cleaner Production, 108, 1302–1309.
https://doi.org/10.1016/j.jclepro.2014.10.044
Palásek, J. (2009). Využití Material Flow Cost Accounting v podniku. Prague: VŠCHT
Prague.
Quick Refrence To Material Flow Cost Accounting (ISO 14051). (n.d.).
S. Boussiba, A. Vonshak, Z. Cohen, A. R. (1991). Culturing Cells for Production of
Astaxanthin; Collecting the Cells Grown Cultivating under Conditions Suitable for
Induction and Accumulation of Astaxanthin in Cells.
Univers
ity of
Mala
ya

51
Saharan BS, Sharma D, Sahu R, Sahin O, W. A. (2013). Towards algal biofuel
production: a concept of green bioenergy development. Innov Rom Food
Biotechnol, 12, 1–21.
Sakawi, Z. (2017). Municipal solid waste management in Malaysia : Solution for
sustainable waste management. Journal of Applied Sciences in Environmental
Sanitation, 6(July).
Sarkis, J. (2003). A strategic decision framework for green supply chain management.
Journal of Cleaner Production, 11, 397–409.
Schenk PM, Thomas-Hall SR, Stephens E, Marx UC, Mussgnug JH, P. C. (2008).
Second generation biofuels: high efficiency microalgae for biodiesel production.
Bioenergy Res, 1(1), 20–43.
Schmidt, A., Götze, U. and Sygulla, R. (2015). Extending the scope of Material Flow
Cost Accounting – methodical refinements and use case. Journal of Cleaner
Production, Part B, 1320-1332.
Strobel, M., Redmann, C., 2002. (2002). Flow cost accounting, an accounting approach
based on actual flows of materials. In T. Bennett, M., Bouma, J.J., Wolters (Ed.),
Environmental Management Accounting: Informational and Institutional
Developments. (pp. 67–82). Dordrecht, The Netherlands: Kluwer Academic
Publishers.
Strobel, M., Redmann, C. (2000). Flow Cost Accounting. Augsburg, Germany.: Institut
für Management und Umwelt.
Sulong, F., Sulaiman, M., & Alwi, M. (2015). Material Flow Cost Accounting
( MFCA ) enablers and barriers : the case of a Malaysian small and medium-sized
enterprise ( SME ). Journal of Cleaner Production, 108, 1365–1374.
https://doi.org/10.1016/j.jclepro.2014.08.038
Usher, P. K., Ross, A. B., Camargo-Valero, M. A., Tomlin, A. S., & Gale, W. F. (2014).
An overview of the potential environmental impacts of large-scale microalgae
cultivation. Biofuels, 5(3), 331–349.
https://doi.org/10.1080/17597269.2014.913925
Wagner, M., Schaltegger, S., Wehrmeyer, W. (2001). The relationship between
environmental and economic performance of firms: what does theory propose and
what does empirical evidence tell us? Greener Manag. Int., (34), 95–108.
Wan. (2003). The Development of E-Financing: Implications for SMEs. In Bulletin on
Asia-Pacific Perspective 2003/2004. United Nations.
Univers
ity of
Mala
ya

52
Weerasiri, S., & Zhengang, Z. (2011). titudes and awareness towards environmental
management and its impact on environmental management practices (EMPs) of
SMEs in Sri Lanka. Journal of Social & Development Sciences, 3(1), 16–23.
Yusup, M. Z., Wan Mahmood, W. H., Salleh, M. R., & Ab Rahman, M. N. (2015). The
implementation of cleaner production practices from Malaysian manufacturers’
perspectives. Journal of Cleaner Production, 108, 659–672.
https://doi.org/10.1016/j.jclepro.2015.07.102
Zhang, W., Wang, J., Wang, J., & Liu, T. (2014). Bioresource Technology Attached
cultivation of Haematococcus pluvialis for astaxanthin production. Bioresource
Technology, 158, 329–335. https://doi.org/10.1016/j.biortech.2014.02.044
Univers
ity of
Mala
ya
53
APPENDIX A
Univers
ity of
Mala
ya