application of lon-selective electrodes in the beet sugar
TRANSCRIPT

Application of lon-Selective Electrodes in the Beet Sugar Industry
THOMAS IIENsCHElD KARL SlHOF~ROCK l
AiD PAuL BERGER2
Received for publication May 17 1971
Introduction Attempts to determine specific ions potentiometrically have
been reported nearly half a century ago Lacking technology hOwever prevented development of suitable electrodes with the exception of the pH electrode until about 1960 Since that time a large variety of ion-selective electrodes have been developed and introduced on the market with varying claims of success
The objective of this report dues not include theoretical conshysideration which is reported elsewhere (410) but shall be limitshyed to the practical applications of some ion-selective electrodes in the laboratory and in process control An excellent treatise on ion-selective electrodes has been prepared by the Department of Commerce (2) to which the reader is referred
Some applications of ion-selective electrodes in the sugarbeet industry have been previously reported by McCaslin et al (7) and Schoenrock (12)
General Some ions of common interest in the sugarbeet industry are
sodium potassium calcium magnesium chloride sulfate and nitrate Present methods for these ions are time consuming or give poor precision due to vague endpoint determinations resultshying from the highly colored solutions The use of ion-selective electrodes not only decreases analysis time but is more precise and usually as accurate as existing methods presently beipg used
Since all the solutions dealt with in the sugar industry are complex ion-selective electrodes have limited application for measuring the concentration of ions directly from electrode reshysponse by comparison to a calihration curve These electrodes respond not only to the ion for which they were specifically deshysigned but also to other ions in solu tion to a varying degree The observed potential is related to ionic activity rather than to concentration For simple or standard solutions which are very dilute the concentration and ionic activity are nearly synshy
1 Project Leader The Amalgamated Sugar Compan y Twin Fall s Id aho and Manager of Operating Research Th e Amalgamated Sugar Company Ogden Utah
2 Formerly with The Amalgamateu Sugar Compan y Twin Falls Id aho now with Amstar Corporation (American Sugar Company) New York City N Y
3 Numbers in parentheses refer to literature cited
VOL 16 No6 JULY 1971 483
onymous but differ significantly as the solutions become increasshyingly complex Therefore any changes in ionic strength beshytween standard solutions and samples would result in errors The applications described here for laboratory use involve either a potentiometric or a precipitation titration depending upon the analysis with the exception of the nitrate and potassium determinations The electrode response is therefore not dependshyent upon the initial FlIF deeloped by the electrode when placed in solution but to the change in electrode potential at the endshypoint There are some inherent errors in the endpoint detershymination in precipitation titrations using ion-selective electrodes which are described by Carr (1) and Schultz (13)
Laboratory Methods and Materials Determination of ChlO1ides
The recent paper of Hozumi and Akimoto (6) describes a method for the micro-determination of chloride in organic comshypounds after oxygen-flask combustion The absorption liquid diluted with acetone to give a 90 organic medium is titrated with standard silver nitrate The endpoint is detected by means of a sodium sensitive electrode which is 150 times more sensishytive to silver than to sodium
The method developed in this laboratory relates closely to the method of llozumi and Akimoto It involves however the macro-determination of chloride in an aqueous medium with the endpoint of the precipitation titration being detected by either a sudium a glass or a platinum electrode
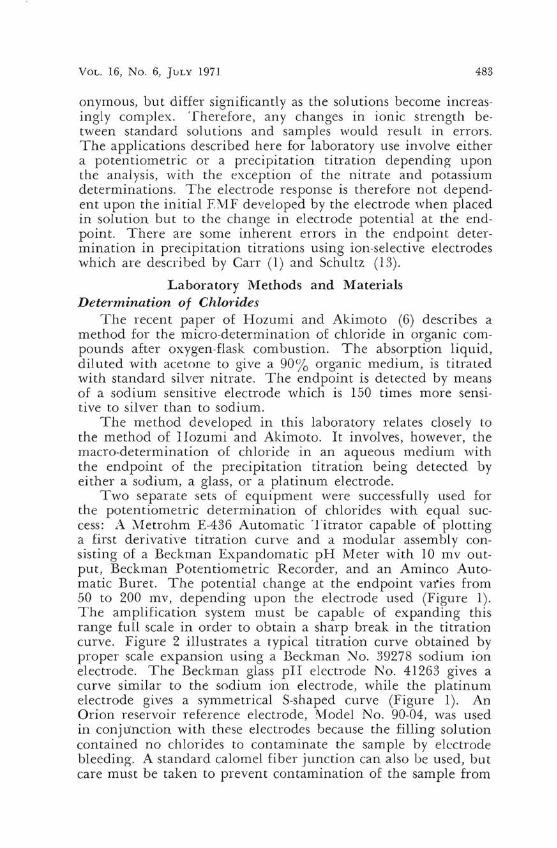
Two separate sets of equipment were successfully used for the potentiometric determination of chlorides with equal sucshycess A Metrohm E-436 Automatic Titrator capable of plotting a first derivatiYe titration curve and a modular assembly conshysisting of a Beckman Expandomatic pH Meter with 10 mv outshyput Beckman Potentiometric Recorder and an Aminco Autoshymatic Buret The potential change at the endpoint varies from 50 to 200 mv depending upon the electrode used (Figure 1) The amplification system must be capable of expanding this range full scale in order to obtain a sharp break in the titration curve Figure 2 illustrates a typical titration curve obtained by proper scale expansion using a Beckman )Jo 39278 sodium ion electrode The Beckman glass pI electrode lo 41263 gives a curve similar to the sodium ion electrode while the platinum electrode gives a symmetrical S-shaped curve (Figure 1) An Orion reservoir reference electrode lIodel No 90-04 as used in conjunction with these electrodes because the filling solution contained no chlorides to contaminate the sample by electrode bleeding A standard calomel fiber junction can also be used but care must be taken to prevent contamination of the sample from
484 JOURNAL OF THE A S S B T
the electrode filling solution as well as plugging of the fiber junction
250 250
- 200 -200 E E
150 -150 o
100
50
0L---~5~--~1~0--~175--~2~0~-- 5 10 15 20 Volume of Titrant (mls) Volume of Titrant (mls)
(0) SODIUM ION ELECTRODE (b) GLASS pH ELECTRODE
o
250
200 gt E
-= 150 e c
100 o ltl
50
oL-----~5-----7IO~--~15~--~2~0
Volume of Titrant (mls)
(C) PLATINUM ELECTRODE
Figure I-Potentiometric titration curves of Cl with Ag~03 using various electrodes in combination with an Orion reference electrode
This method is subject to the same interferences as those encountered in other methods for the determination of chloride by precipitation with silver nitrate Although the sodium and glass electrodes show maximum response at pH 76 the sample must be made slightly acidic (approximately pH 5--6) to eliminshyate possible interferences These electrodes are also sensitive to the hydrogen ion which will mask the response to silver ion at the endpoint if the solution is strongly acidic
Reagents A silver nitrate solution standardized potentioshymetrically with dry reagent grade sodium chloride The conshycentration of the silver nitrate solution is dependent upon the
VOL 16 ~o 6 JULY 1971 485
sample requirements Concentrations from 10 to O05N have been used and work well The potential change in the area of the endpoint is n ot as abrupt with the more dilu te solutions however
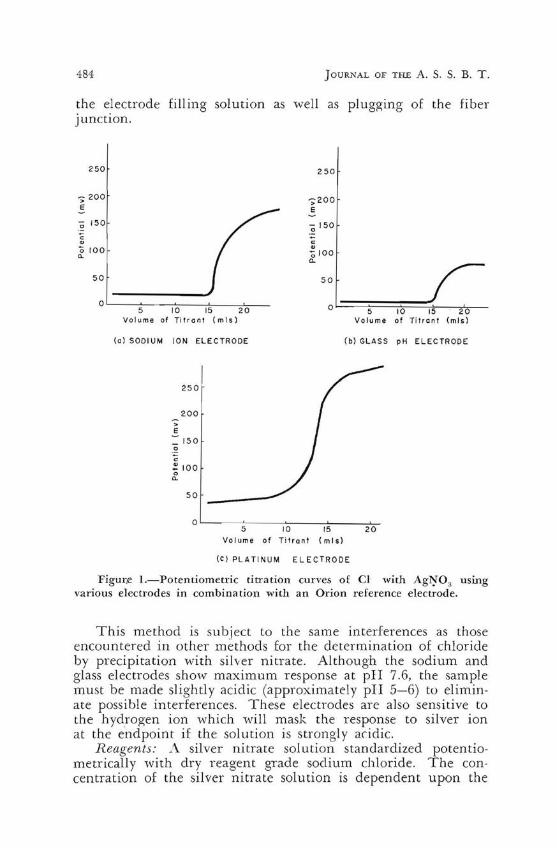
Procedure Transfer a sample aliquot into a 250 ml beaker adjust the pH so the sample is slightly acidic and add sufficient water to allow the tips 6pound the electrodes to be adequatel y imshymersed Place the beaker on a mag-mix and immerse the elecshytrodes in the solution jllow to stir for a few minutes to conshydition the electrodes Zero the recorder pen at 10-2070 on the recorder chan with the electrodes in the solution and ac tuated A slight but steady drift in baseline is observed during the titrashytion either up or down scale due to sample dilution and elecshytrode conditioning If the electrodes are allowed to condi tion for several minutes before beginning the titra tion the drift is stabilized Samples which contain little or no sodium ions have a tendency to drift during the titration resulting in a poor break in the titration curve This can readily be overcome by add ing a few crystals of sodium nitrate before beginning the titration Titrate with standard silver nitrate to the first break in the titration curve IVith proper scale expansion an L shaped curve wil1 be obtained with either sodium ion or glass electrodes The exact endpoint is determined by extending both legs of the curve until they intersect The point of intersection is taken as the endpoint (Figure 2) If the platinum electrode is used the endpoint must he taken at the point of inflection
60
j ~ 40 0
0 ~
Q
20 ----------- shy o I 2 3 4 5 6 7 8 9 10 I I 12
Volume of Titranf (mls)
Figure 2-Potentiometric titration of chloride with silver nitrate using a sodium ion electrode
The precision obtained with the potentiometric method in standard sodi um chloride solutions is comparable to the Mohr titrat ion method (Table 1) The accuracy is slightly better if
486 JOURNAL Of THE A S S B T
the first derivative of the potential curve is used for the endshypoint determination rather than the first break in the titration curve Both methods correlate better than 999 lt0 with the theoshyretical chloride concentration with a high degree of confidence In highly colored solutions where the endpoint in the Mohr method is difficult to determine the potentiometric method shows a much higher precision (Table 2) and the average differshyence between methods becomes quite pronounced
Table l-Statistical comparison of methods to theoretical chloride concentration
Theoretical Sodium Glass Cl- Mohr electrode electrode
2 2
Avg of ten sa mples ( mg) 4158 4159 4182 4153 4115 4140 Difference fro m theoretical ( ) 002 057 -012 -103 -043 Standard devia tion 021 028 026 054 026 Correlation 9993 9999 9997 9997 9998 Confidence limit Greater than 99
Two methods were used for tbe determination of endpoint in the potentiometric method Column I the endpoint was taken at th e first break in the curve Column 2 a t the point of inflection found by taking the fir st derivati ve of the titration curve
Table 2-Comparison of the Potentiometric method of the Mohr titration method in highly colored solutions
Potentiomeu-ic method Mohr method
Avg of sa mples (mls) 663 679 Standard deviation 0041 0118 Differen ce between methods laquo(~) 241
The potentiometric titration of chlorides works well for molasses raw juice CSF and other highly colored solutions enshycountered in the beet sugar industry
Determination of Sulfate The determination of sulfate has long been carried out gravishy
metrically by recovery of the sulfate as barium sulfafe This method is both tedious and time consuming and can result in errors due to incomplete precipitation coprecipitation or reshyduction of the sulfate to sulfide by carbon and high temperashytures during ignition A recent method developed by Ross and Frank (11) for sulfate uses a lead selective electrode and lead perchlorate as a titrant In order to decrease the solubility of the lead sulfate the titration is carried out in 50 dioxane A number of cations and anions interfere with this method howshyever
The following method essentially involves a precipitation titration of sulfate with barium chloride in an aqueous medium The excess barium at the equivalence point is detected by means of a divalent cation electrode sensitized for barium
187 VOL 16 ~o 6 JULY 1971
This particular electrode is sensItIve to a number of divalent cations to which it shows a greater selectivity than to barium The relative selectivity of some of the ions is listed below
Zn++ Fe++ 35 Ca++ iVI g++ 10 Cu++ = 31 8a++ 094 Ni++ l35 Sn++ 054
The effect of these ions is of no great consequence as long as they are not present in excessive quantities which would mask the electrode response to barium The endpoint is determined by an increase in electrode response resulting from excess barium in solution after the equivalence point is reached The divalent cation electrode also is sensitive to the hydrogen ion and should therefore not be used in strongly acidic solutions The greatest response is at a pH above 70 but to eliminate interferences in the precipitation method it should be run in a slightly acidic solution To increase the sensitivity of the method the electrode filling solutions have been conditioned for barium This proshycedure greatly increases the electrode selectivity for barium
As with all precipitation titrations there are errors due to ionic strength and chemical activity (113) as well as dependence upon the solubility product of the precipitate formed For microshydeterminations of sulfate the solubility product of barium sulshyfate is too large and the electrode sensitivity too low to give reJiable results Macro-determinations work well with good preshyClSlOn
Equipment The same potentiometric set-ups employed for the chloride detennination were used for sulfate except for the electrodes An Orion divalent cation electrode No 92-90 conshyditioned for barium was used in conjunction with a fiber juncshytion standard calomel electrode
Conditioning of the Divalent Cation Electrode Dissolve the ion exchanger in 100 mls of chloroform Shake with two 60 ml portions of OlM barium chloride Vash twice with 100 mls water Remove the chloroform and traces of water by heating until the temperature of the exchanger reaches 115 ~ C Cool and use to charge the electrode Replace the internal reference solution supplied by Orion with a lO-zAf solution of barium chloride
Reagents A lON barium chloride solution is standardized with reagent grade magnesium sulfate
Procedure A sample containing 5-50miVI of sulfate is placed in a 250 ml beaker the solution made slightly acidic and sufshyficient water is added to just cover the tip of the electrodes The recorder is adjusted as in the chloride procedure Titrate with standard barium chloride to the inflection point The endshypoint is taken a t the first break in the curve and read directly
188 JOURNAL or THE A S S B T
from the chart The titration curve is nearly identical to the chloride titration curve in Figure 2 Use of this method was very hel plul in determining regeneration profiles and resin cashypacities from ion exchange effluents
Determination of Calcium and Magnesium Several procedures described in the literature have been sucshy
cessfully applied to sugarbeet liquors These include the detershyminalion of calcium and magnesium by the method of vant Riet and Wynn (14) and by the potentiometric titrations described by Orion Research Inc (8)
The method of van t Riet and Wynn was preferred since it required no special electrodes and gave the best results when used in complex solutions which were impossible by convenshytional methods The sample is first titrated for calcium with Na4-EGTA in the presence of sodium citrate then for magnesium vith Na-EDTA The titration is monitored hy means of an expanded scale pH meter using a standard glass and calomel electrode Each endpoint corresponds to a sharp change in pH (Figure 3) The optimum pH range for the titration is from 80-86 The citrate is added to complex the magnesium preshyenting it from interfering with the calcium determination and also to keep it from precipitating out of solution as the hydroxide
100
Magne Sium Endpoint
8 0 --~~~---C5~~~~O-- ~~oc5-shy
Vo lume of Titrant ( mls)
Figure 3-Complexomctric titration curve of calcium wih Na l-EGTA and magnesium with N a-EDTA using pH electrodes
The method taken from Orion Research Inc uses Ta2-FDTA as a titrant and employs two ion-selective electrodes one selecshytive for calcium and the other a divalent cation electrode Calshycium endpoint is first determined by means of a calcium sensishy
VOL 16 No6 JUlY 1971 middot189
tive electrode in combination with a standard calomel electrode The calcium electrode is then replaced by a divalent cation elecshytrode and the titration continued slightly beyond the second inshyflection (Figure 4) The endpoint of the titration curve is at the point of maximum slope or center point of the segment of greatest sLope The titrations are carried out at pH 11 and the magnesium determined by difference
gt E
c
a
Chan~e Elellrodes ond
Calcium and Magnesium Endpoint
5 0 5 Volume of Titrant (mls)
Figure 4-Complexometric titration curve of calcium and magnesium with Na-EDTA using two specific ion electlOdes
Determination of Nitrate The nitrate ion can be readily determined by the method of
McCaslin Franklin and Dillon The nitrate concentration is measured directly as electrode response using a nitrate sensitive electrode by comparison to a standard calibration curve The proper precautions must be taken to eliminate interfering ions and to correct for variations in ionic strength between the samshyples and standards Careful and repeated standardization of the equipment is essential This method is much less time conshysuming and shomiddotws a greater accuracy than the phenoldisulfonic acid method
Determination of Potassium The development of a new electrode by Frant and Ross (4)
holds promise for the determination of potassium The electrode is much more sensitive to potassium than sodium and has been used to determine potassium directly in solution rather than by difference This method uses a standard curve for calibration so precautions similar to those described in the nitrate method must be taken to insurc reliable results
Factory Applications For the past kw years various ion-selective electrodes have
been employed in process streams to determine their usefulness
490 JOURNAL OF THE A S S B T
as continuous on-stream monitors The Beckman To 39047 monovalent cation electrode and the Orion divalent cation elecshytrode )To 92-32 have been used to indicate cell exhaustion and cell regeneration in the Quentin process (12) In addition a divalent cation electrode has been used to monitor limesalts in second carbonation (12) In all applications these electrodes work very well However since complex solutions are involved and the electrodes measure ionic activity rather than concentrashytion careful consideration must be given to the design of a flow-through system when incorporated in process control upon installation Fluctuation in flow brix and tern perature can cause changes in the electrode response
Monitoring Ion Exchange Effluents A munovalent cation electrode was used to monitor cell exshy
haustion in the Quentin process (Figure 5) The electrode and pH meter were calibrated so that untreated syrup gave a 90 readin g on the chart As the syrup was placed on the cell the response dropped to a very low point showing a high percentage of exchange at first (point A) As the cell exhausts the percent exchange decreases until the processed syrup approaches the conshycentration of unprocessed syrup (point B) In the case of cell channeling (point C) the curve takes a different appearance Low exchange profiles over a long time period indicate incomshyplete removal of monovalent cations during the exhaustion steps
middot _______________________ _ l(IErcs _Slr~p_ _____ _260
No(mal eye I
200
10 20 30 40 Tithe (Hours)
Figure 5-Cell exhaustion and channeling profile from Quentin process -monovalent cation electrode
Two divalent cation electrodes were employed on the regenshyeration cycle of the ion exchange system Figure 6 is an actual recording showing the response of each electrode and the cut-off point One electrode was used to monitor the cell effluent going to the sewer (6A) during the initial stages of regeneration and
VOL 16 -Jo 6 JULY 1971 491
indicates the point at which the regenerant could be recovered in a useful concentration to be reused in the next regeneration cycle A second divalent cation electrode (6B) monitors the epoundshyfluent being recycled to the used regenerant tank during the reshygeneration and cell rinse As the excess regenerant is removed from the cell the electrode response drops and the water is reshyturned to the rinse recovery system
90
80
70
60
E
I shy- 50 ---shy
------ - ~--~
4 0 ~
30 0
ii=i -_ 20
10 20 30 4 0 50 Time (Minutes)
Figure 6-Regeneration profile Quentin process using a divalent cashytion and a reference electrode to monitor separate regenerant streams
Limesalts in Second Carbonation Juice The divalent cation electrode gives nearly a linear millivolt
output with respect to limesalts except at very low concentrashytions (Figure 7) It is therefore very useful for the determinashy
-
~
4 ~oi----~--oo~~~--O~~~~~~~o---lmes CO IIIOIOIl (Gra Coo 011 00 RDS)
Figure 7-Divalent cation electrode response vs limesalts concentrashytions
J OURNAL OF THE A S S B T
40
30
20
(Numera ls Ind rca te L imeso l l s Concentro lionshyGroflS CoO on 100 RDS)
I N N
o
~0 ~
0 5 20 30 40 Ti me (Mi nu tes )
Figure 8-Detoelmination of second carbonation entipoint with divalent ca tion elecllode
tion of minimum limesalts in second carbonation as shown in Figure 8 In this ca rbonation profil e the Iimesalts decrease to a minimum value as CO~ is added and then rapidly increases again as the sample is over-carbonated
divalent cation electrode and a standard calomel reference electrode were used as a monitor of second carbonation juice giving a continuous record showing flu ctuations in limesalts In conjunction a glass and a standard calomel electrode were also employed to determine the relationship of pH with these limeshysalts fluctuations Figure 9 th rough 11 are actual recordings of limesalts measuremrnts determined with a divalent cation elecshytrode Figure 9 shows that electrole response with respect to actual labcratory analysis Periods of high Iimesalts occur which are not observed by the laboratory analysis (Figure 10) and are of sufficient duration to ca use serious scaling problems Figure 11 shows the reJ ation of pH to limesal ts The simple alkalinity
30
E
~ 20
0
(Num ot oh ndicote Hourly Limesols Analyslsshy
Grams CoO on 100 RDS)
o
Time ( Hou rs)
Figure 9-Fluctuatjons in limesalts indicated by the divalent cation electrode with the corresponding hourly laboratory results
VOL 16 No6 J1LY 1971 493
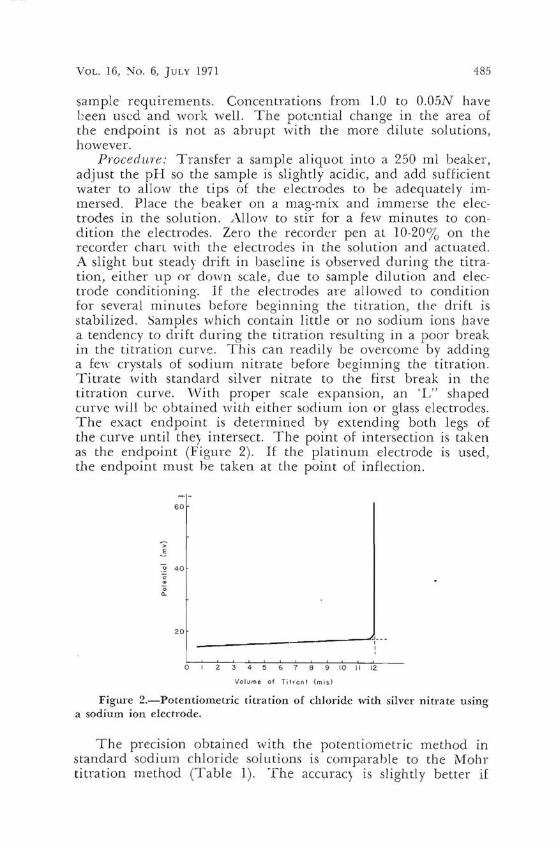
titrations normally used to follow the limesalts concentration may pick up these fluctuations but do not indicate the cause or means of correcting the problem A record showing both limeshysalts and pH could indicate whether there was over or under carbonation or changes in soda ash addition The problem could properly be corrected eliminating long periods of operation at high limesalts Ievels and maintaining a more uniform level of operation
30 lmesolls Analysisshy
10
(Numerals Ifldicole Hourly
Grams CoO on 100 RDS)
3 Time (Hours)
Figure lO-Period of hlgh lim2saltpound detected by divalent cation electrode but completely missed by hourly laboratory analysis
40
30
~ 20
10
3 Time (Hours)
Figure ll-Limesalts profile showing colTesponding pH changes
Summary Ion-selective electrodes have been used successfully in proshy
cess control as well as in devising new analytical procedures for the laboratory In the Quentin process control of the cell exshyhaustion cell channeling resin fouling etc can be determined with the monovalent cation electrode This allows termination of the exhaustion cycle at the correct moment During the reshy
494 J OURNAL or THE A S S B T
generation cycle monitoring regeneration effluents allows better control and utilization of regenerants
Limesalts can he more effectively controlled by use of the divalent cation electrode A continuous monitor of limesalts may permit second carbonation control by measurement of the actual concentration rather than pH In conjunction with pH a good insight into the cause of certain changes in limesalts can be determined and more quickly corrected
In process control these electrodes encounter complex solushytions Electrode response is dependent upon ionic activity and therefore to the ionic strength of the solution Drastic changes in brix will result in changes in electrode response Other facshytors such as flow rate pH gas entrainment and temperature all affect the electrode response and must be regulated in order to maintain reliable results Although the membrane type elecshytrode is capable of operating at 50degC it is recommended that the temperature of 25deg plusmn 5deg be maintained with as little fluctuashytion as possible Entrained air must be removed Good houseshykeeping is essential at all times and an occasional standardizashytion of the instrument and replacement of ion exchanger and membranes in the electrode must be carried out to insure good response and changes due to aging
Ion-selective electrodes have been found to be especially useshyful for potentiometric titrations They are now routinely used for the determination of Cl- Ca++ Mg++ and 50=4
The application of specific enzyme electrodes shmvs real promshyise in the biological and biochemical fields The employment of enzymes and biological materials in membrane electrodes has resulted in the development of a number of new sensors for analysis of such species as blood glucose and lactate (15) amygdashylin (9) and urea (5) At present an electrode specific for lactic acid is being developed in this laboratory and appears to be promising Some engineering problems are yet to be overcome before routine use can be made
Literature Cited
(1) CARR P V 1971 Intrinsic endpoint errors in preOlpItation titrashytions with ion selective electrodes Anal Chern 43 (3) 425middot430
(2) DEPARTMENT or COMMERCE 1969 Ion selective electrodes National Bureau of Standards Special Publication 314
(3) FRANT 1 S and J W Ross JR 1970 Potassium ion specific elecshytrode with high selectivity for potassium over sodium Science 167 (3920) 987-988
(4) FRANT M S et ai January 1969 Ion-selective electrodes-a new technology for chemical measurement Am Lab 11
(5) GUILBAULT G G and J G MONTALVO 1970 J Am Chern Soc 92 2533
VOL 16 No6 JULY 1971 495
(6) HOZUMI K and N AKIMOTO 1970 Argentometric microdeterminashytion of halogens using sod ium-sensit ive glass electrode in nonshyaqueous m edi um Analytical Chemistry 42 (12) 1312-17
(7) MCCASllN B D IV T FRANKLIN and M A DILLON 1970 Rapid determination of nitrate nitrogn in sugarbeets with specific ion electrodes J Am Soc Sugar Beet Techno 16 (I) 64-70
(8) ORION RESEARCH INCORPORATED Instruction manual divalent cation electrode Model 92-32 Instruction manual calcium ion electrode Model 92-20 II Blackstone Street Cambridge Mass 02139
(9) RECHNITZ G A 1971 Enzyme electrode for amygdalin Anal Chem 43 (2) 283
(10) RECHNITZ G A 1967 Ion-Sel ective Electrodes C amp E News 45 (24) 146
(ll) Ross J W JR ane IVe S FRANT 1969 Potentiometric titrations of sulfate usi ng an ion-selecti ve lead electrode Ana Chem 41 (7) 967-969
(12) SCHOENROCK K W R 1968 Paper presented at 15th ASSBT Meeting Phoenix Arizona
(13) SCHULTZ F A 1971 Titration errors and curve shapes in potentioshymetric titrations employing ion-selective indicator electrodes Anal Chem 43 (1) 502-508
(14) VANT RIET B and J E WYNN 1969 Potentiometric determinat ions of calcium magnesium and complex ing agents in water and biological fluids Anal Chern 11 (I) 158-162
(15) WILLIAMS D L A R DOIC JR and A KaRaS 1970 Electroshychemica l enzymatic analysis of blood glucose and lactate Anal Chern 42 (I) 118-120
VOL 16 No6 JULY 1971 483
onymous but differ significantly as the solutions become increasshyingly complex Therefore any changes in ionic strength beshytween standard solutions and samples would result in errors The applications described here for laboratory use involve either a potentiometric or a precipitation titration depending upon the analysis with the exception of the nitrate and potassium determinations The electrode response is therefore not dependshyent upon the initial FlIF deeloped by the electrode when placed in solution but to the change in electrode potential at the endshypoint There are some inherent errors in the endpoint detershymination in precipitation titrations using ion-selective electrodes which are described by Carr (1) and Schultz (13)
Laboratory Methods and Materials Determination of ChlO1ides
The recent paper of Hozumi and Akimoto (6) describes a method for the micro-determination of chloride in organic comshypounds after oxygen-flask combustion The absorption liquid diluted with acetone to give a 90 organic medium is titrated with standard silver nitrate The endpoint is detected by means of a sodium sensitive electrode which is 150 times more sensishytive to silver than to sodium
The method developed in this laboratory relates closely to the method of llozumi and Akimoto It involves however the macro-determination of chloride in an aqueous medium with the endpoint of the precipitation titration being detected by either a sudium a glass or a platinum electrode
Two separate sets of equipment were successfully used for the potentiometric determination of chlorides with equal sucshycess A Metrohm E-436 Automatic Titrator capable of plotting a first derivatiYe titration curve and a modular assembly conshysisting of a Beckman Expandomatic pH Meter with 10 mv outshyput Beckman Potentiometric Recorder and an Aminco Autoshymatic Buret The potential change at the endpoint varies from 50 to 200 mv depending upon the electrode used (Figure 1) The amplification system must be capable of expanding this range full scale in order to obtain a sharp break in the titration curve Figure 2 illustrates a typical titration curve obtained by proper scale expansion using a Beckman )Jo 39278 sodium ion electrode The Beckman glass pI electrode lo 41263 gives a curve similar to the sodium ion electrode while the platinum electrode gives a symmetrical S-shaped curve (Figure 1) An Orion reservoir reference electrode lIodel No 90-04 as used in conjunction with these electrodes because the filling solution contained no chlorides to contaminate the sample by electrode bleeding A standard calomel fiber junction can also be used but care must be taken to prevent contamination of the sample from
484 JOURNAL OF THE A S S B T
the electrode filling solution as well as plugging of the fiber junction
250 250
- 200 -200 E E
150 -150 o
100
50
0L---~5~--~1~0--~175--~2~0~-- 5 10 15 20 Volume of Titrant (mls) Volume of Titrant (mls)
(0) SODIUM ION ELECTRODE (b) GLASS pH ELECTRODE
o
250
200 gt E
-= 150 e c
100 o ltl
50
oL-----~5-----7IO~--~15~--~2~0
Volume of Titrant (mls)
(C) PLATINUM ELECTRODE
Figure I-Potentiometric titration curves of Cl with Ag~03 using various electrodes in combination with an Orion reference electrode
This method is subject to the same interferences as those encountered in other methods for the determination of chloride by precipitation with silver nitrate Although the sodium and glass electrodes show maximum response at pH 76 the sample must be made slightly acidic (approximately pH 5--6) to eliminshyate possible interferences These electrodes are also sensitive to the hydrogen ion which will mask the response to silver ion at the endpoint if the solution is strongly acidic
Reagents A silver nitrate solution standardized potentioshymetrically with dry reagent grade sodium chloride The conshycentration of the silver nitrate solution is dependent upon the
VOL 16 ~o 6 JULY 1971 485
sample requirements Concentrations from 10 to O05N have been used and work well The potential change in the area of the endpoint is n ot as abrupt with the more dilu te solutions however
Procedure Transfer a sample aliquot into a 250 ml beaker adjust the pH so the sample is slightly acidic and add sufficient water to allow the tips 6pound the electrodes to be adequatel y imshymersed Place the beaker on a mag-mix and immerse the elecshytrodes in the solution jllow to stir for a few minutes to conshydition the electrodes Zero the recorder pen at 10-2070 on the recorder chan with the electrodes in the solution and ac tuated A slight but steady drift in baseline is observed during the titrashytion either up or down scale due to sample dilution and elecshytrode conditioning If the electrodes are allowed to condi tion for several minutes before beginning the titra tion the drift is stabilized Samples which contain little or no sodium ions have a tendency to drift during the titration resulting in a poor break in the titration curve This can readily be overcome by add ing a few crystals of sodium nitrate before beginning the titration Titrate with standard silver nitrate to the first break in the titration curve IVith proper scale expansion an L shaped curve wil1 be obtained with either sodium ion or glass electrodes The exact endpoint is determined by extending both legs of the curve until they intersect The point of intersection is taken as the endpoint (Figure 2) If the platinum electrode is used the endpoint must he taken at the point of inflection
60
j ~ 40 0
0 ~
Q
20 ----------- shy o I 2 3 4 5 6 7 8 9 10 I I 12
Volume of Titranf (mls)
Figure 2-Potentiometric titration of chloride with silver nitrate using a sodium ion electrode
The precision obtained with the potentiometric method in standard sodi um chloride solutions is comparable to the Mohr titrat ion method (Table 1) The accuracy is slightly better if
486 JOURNAL Of THE A S S B T
the first derivative of the potential curve is used for the endshypoint determination rather than the first break in the titration curve Both methods correlate better than 999 lt0 with the theoshyretical chloride concentration with a high degree of confidence In highly colored solutions where the endpoint in the Mohr method is difficult to determine the potentiometric method shows a much higher precision (Table 2) and the average differshyence between methods becomes quite pronounced
Table l-Statistical comparison of methods to theoretical chloride concentration
Theoretical Sodium Glass Cl- Mohr electrode electrode
2 2
Avg of ten sa mples ( mg) 4158 4159 4182 4153 4115 4140 Difference fro m theoretical ( ) 002 057 -012 -103 -043 Standard devia tion 021 028 026 054 026 Correlation 9993 9999 9997 9997 9998 Confidence limit Greater than 99
Two methods were used for tbe determination of endpoint in the potentiometric method Column I the endpoint was taken at th e first break in the curve Column 2 a t the point of inflection found by taking the fir st derivati ve of the titration curve
Table 2-Comparison of the Potentiometric method of the Mohr titration method in highly colored solutions
Potentiomeu-ic method Mohr method
Avg of sa mples (mls) 663 679 Standard deviation 0041 0118 Differen ce between methods laquo(~) 241
The potentiometric titration of chlorides works well for molasses raw juice CSF and other highly colored solutions enshycountered in the beet sugar industry
Determination of Sulfate The determination of sulfate has long been carried out gravishy
metrically by recovery of the sulfate as barium sulfafe This method is both tedious and time consuming and can result in errors due to incomplete precipitation coprecipitation or reshyduction of the sulfate to sulfide by carbon and high temperashytures during ignition A recent method developed by Ross and Frank (11) for sulfate uses a lead selective electrode and lead perchlorate as a titrant In order to decrease the solubility of the lead sulfate the titration is carried out in 50 dioxane A number of cations and anions interfere with this method howshyever
The following method essentially involves a precipitation titration of sulfate with barium chloride in an aqueous medium The excess barium at the equivalence point is detected by means of a divalent cation electrode sensitized for barium
187 VOL 16 ~o 6 JULY 1971
This particular electrode is sensItIve to a number of divalent cations to which it shows a greater selectivity than to barium The relative selectivity of some of the ions is listed below
Zn++ Fe++ 35 Ca++ iVI g++ 10 Cu++ = 31 8a++ 094 Ni++ l35 Sn++ 054
The effect of these ions is of no great consequence as long as they are not present in excessive quantities which would mask the electrode response to barium The endpoint is determined by an increase in electrode response resulting from excess barium in solution after the equivalence point is reached The divalent cation electrode also is sensitive to the hydrogen ion and should therefore not be used in strongly acidic solutions The greatest response is at a pH above 70 but to eliminate interferences in the precipitation method it should be run in a slightly acidic solution To increase the sensitivity of the method the electrode filling solutions have been conditioned for barium This proshycedure greatly increases the electrode selectivity for barium
As with all precipitation titrations there are errors due to ionic strength and chemical activity (113) as well as dependence upon the solubility product of the precipitate formed For microshydeterminations of sulfate the solubility product of barium sulshyfate is too large and the electrode sensitivity too low to give reJiable results Macro-determinations work well with good preshyClSlOn
Equipment The same potentiometric set-ups employed for the chloride detennination were used for sulfate except for the electrodes An Orion divalent cation electrode No 92-90 conshyditioned for barium was used in conjunction with a fiber juncshytion standard calomel electrode
Conditioning of the Divalent Cation Electrode Dissolve the ion exchanger in 100 mls of chloroform Shake with two 60 ml portions of OlM barium chloride Vash twice with 100 mls water Remove the chloroform and traces of water by heating until the temperature of the exchanger reaches 115 ~ C Cool and use to charge the electrode Replace the internal reference solution supplied by Orion with a lO-zAf solution of barium chloride
Reagents A lON barium chloride solution is standardized with reagent grade magnesium sulfate
Procedure A sample containing 5-50miVI of sulfate is placed in a 250 ml beaker the solution made slightly acidic and sufshyficient water is added to just cover the tip of the electrodes The recorder is adjusted as in the chloride procedure Titrate with standard barium chloride to the inflection point The endshypoint is taken a t the first break in the curve and read directly
188 JOURNAL or THE A S S B T
from the chart The titration curve is nearly identical to the chloride titration curve in Figure 2 Use of this method was very hel plul in determining regeneration profiles and resin cashypacities from ion exchange effluents
Determination of Calcium and Magnesium Several procedures described in the literature have been sucshy
cessfully applied to sugarbeet liquors These include the detershyminalion of calcium and magnesium by the method of vant Riet and Wynn (14) and by the potentiometric titrations described by Orion Research Inc (8)
The method of van t Riet and Wynn was preferred since it required no special electrodes and gave the best results when used in complex solutions which were impossible by convenshytional methods The sample is first titrated for calcium with Na4-EGTA in the presence of sodium citrate then for magnesium vith Na-EDTA The titration is monitored hy means of an expanded scale pH meter using a standard glass and calomel electrode Each endpoint corresponds to a sharp change in pH (Figure 3) The optimum pH range for the titration is from 80-86 The citrate is added to complex the magnesium preshyenting it from interfering with the calcium determination and also to keep it from precipitating out of solution as the hydroxide
100
Magne Sium Endpoint
8 0 --~~~---C5~~~~O-- ~~oc5-shy
Vo lume of Titrant ( mls)
Figure 3-Complexomctric titration curve of calcium wih Na l-EGTA and magnesium with N a-EDTA using pH electrodes
The method taken from Orion Research Inc uses Ta2-FDTA as a titrant and employs two ion-selective electrodes one selecshytive for calcium and the other a divalent cation electrode Calshycium endpoint is first determined by means of a calcium sensishy
VOL 16 No6 JUlY 1971 middot189
tive electrode in combination with a standard calomel electrode The calcium electrode is then replaced by a divalent cation elecshytrode and the titration continued slightly beyond the second inshyflection (Figure 4) The endpoint of the titration curve is at the point of maximum slope or center point of the segment of greatest sLope The titrations are carried out at pH 11 and the magnesium determined by difference
gt E
c
a
Chan~e Elellrodes ond
Calcium and Magnesium Endpoint
5 0 5 Volume of Titrant (mls)
Figure 4-Complexometric titration curve of calcium and magnesium with Na-EDTA using two specific ion electlOdes
Determination of Nitrate The nitrate ion can be readily determined by the method of
McCaslin Franklin and Dillon The nitrate concentration is measured directly as electrode response using a nitrate sensitive electrode by comparison to a standard calibration curve The proper precautions must be taken to eliminate interfering ions and to correct for variations in ionic strength between the samshyples and standards Careful and repeated standardization of the equipment is essential This method is much less time conshysuming and shomiddotws a greater accuracy than the phenoldisulfonic acid method
Determination of Potassium The development of a new electrode by Frant and Ross (4)
holds promise for the determination of potassium The electrode is much more sensitive to potassium than sodium and has been used to determine potassium directly in solution rather than by difference This method uses a standard curve for calibration so precautions similar to those described in the nitrate method must be taken to insurc reliable results
Factory Applications For the past kw years various ion-selective electrodes have
been employed in process streams to determine their usefulness
490 JOURNAL OF THE A S S B T
as continuous on-stream monitors The Beckman To 39047 monovalent cation electrode and the Orion divalent cation elecshytrode )To 92-32 have been used to indicate cell exhaustion and cell regeneration in the Quentin process (12) In addition a divalent cation electrode has been used to monitor limesalts in second carbonation (12) In all applications these electrodes work very well However since complex solutions are involved and the electrodes measure ionic activity rather than concentrashytion careful consideration must be given to the design of a flow-through system when incorporated in process control upon installation Fluctuation in flow brix and tern perature can cause changes in the electrode response
Monitoring Ion Exchange Effluents A munovalent cation electrode was used to monitor cell exshy
haustion in the Quentin process (Figure 5) The electrode and pH meter were calibrated so that untreated syrup gave a 90 readin g on the chart As the syrup was placed on the cell the response dropped to a very low point showing a high percentage of exchange at first (point A) As the cell exhausts the percent exchange decreases until the processed syrup approaches the conshycentration of unprocessed syrup (point B) In the case of cell channeling (point C) the curve takes a different appearance Low exchange profiles over a long time period indicate incomshyplete removal of monovalent cations during the exhaustion steps
middot _______________________ _ l(IErcs _Slr~p_ _____ _260
No(mal eye I
200
10 20 30 40 Tithe (Hours)
Figure 5-Cell exhaustion and channeling profile from Quentin process -monovalent cation electrode
Two divalent cation electrodes were employed on the regenshyeration cycle of the ion exchange system Figure 6 is an actual recording showing the response of each electrode and the cut-off point One electrode was used to monitor the cell effluent going to the sewer (6A) during the initial stages of regeneration and
VOL 16 -Jo 6 JULY 1971 491
indicates the point at which the regenerant could be recovered in a useful concentration to be reused in the next regeneration cycle A second divalent cation electrode (6B) monitors the epoundshyfluent being recycled to the used regenerant tank during the reshygeneration and cell rinse As the excess regenerant is removed from the cell the electrode response drops and the water is reshyturned to the rinse recovery system
90
80
70
60
E
I shy- 50 ---shy
------ - ~--~
4 0 ~
30 0
ii=i -_ 20
10 20 30 4 0 50 Time (Minutes)
Figure 6-Regeneration profile Quentin process using a divalent cashytion and a reference electrode to monitor separate regenerant streams
Limesalts in Second Carbonation Juice The divalent cation electrode gives nearly a linear millivolt
output with respect to limesalts except at very low concentrashytions (Figure 7) It is therefore very useful for the determinashy
-
~
4 ~oi----~--oo~~~--O~~~~~~~o---lmes CO IIIOIOIl (Gra Coo 011 00 RDS)
Figure 7-Divalent cation electrode response vs limesalts concentrashytions
J OURNAL OF THE A S S B T
40
30
20
(Numera ls Ind rca te L imeso l l s Concentro lionshyGroflS CoO on 100 RDS)
I N N
o
~0 ~
0 5 20 30 40 Ti me (Mi nu tes )
Figure 8-Detoelmination of second carbonation entipoint with divalent ca tion elecllode
tion of minimum limesalts in second carbonation as shown in Figure 8 In this ca rbonation profil e the Iimesalts decrease to a minimum value as CO~ is added and then rapidly increases again as the sample is over-carbonated
divalent cation electrode and a standard calomel reference electrode were used as a monitor of second carbonation juice giving a continuous record showing flu ctuations in limesalts In conjunction a glass and a standard calomel electrode were also employed to determine the relationship of pH with these limeshysalts fluctuations Figure 9 th rough 11 are actual recordings of limesalts measuremrnts determined with a divalent cation elecshytrode Figure 9 shows that electrole response with respect to actual labcratory analysis Periods of high Iimesalts occur which are not observed by the laboratory analysis (Figure 10) and are of sufficient duration to ca use serious scaling problems Figure 11 shows the reJ ation of pH to limesal ts The simple alkalinity
30
E
~ 20
0
(Num ot oh ndicote Hourly Limesols Analyslsshy
Grams CoO on 100 RDS)
o
Time ( Hou rs)
Figure 9-Fluctuatjons in limesalts indicated by the divalent cation electrode with the corresponding hourly laboratory results
VOL 16 No6 J1LY 1971 493
titrations normally used to follow the limesalts concentration may pick up these fluctuations but do not indicate the cause or means of correcting the problem A record showing both limeshysalts and pH could indicate whether there was over or under carbonation or changes in soda ash addition The problem could properly be corrected eliminating long periods of operation at high limesalts Ievels and maintaining a more uniform level of operation
30 lmesolls Analysisshy
10
(Numerals Ifldicole Hourly
Grams CoO on 100 RDS)
3 Time (Hours)
Figure lO-Period of hlgh lim2saltpound detected by divalent cation electrode but completely missed by hourly laboratory analysis
40
30
~ 20
10
3 Time (Hours)
Figure ll-Limesalts profile showing colTesponding pH changes
Summary Ion-selective electrodes have been used successfully in proshy
cess control as well as in devising new analytical procedures for the laboratory In the Quentin process control of the cell exshyhaustion cell channeling resin fouling etc can be determined with the monovalent cation electrode This allows termination of the exhaustion cycle at the correct moment During the reshy
494 J OURNAL or THE A S S B T
generation cycle monitoring regeneration effluents allows better control and utilization of regenerants
Limesalts can he more effectively controlled by use of the divalent cation electrode A continuous monitor of limesalts may permit second carbonation control by measurement of the actual concentration rather than pH In conjunction with pH a good insight into the cause of certain changes in limesalts can be determined and more quickly corrected
In process control these electrodes encounter complex solushytions Electrode response is dependent upon ionic activity and therefore to the ionic strength of the solution Drastic changes in brix will result in changes in electrode response Other facshytors such as flow rate pH gas entrainment and temperature all affect the electrode response and must be regulated in order to maintain reliable results Although the membrane type elecshytrode is capable of operating at 50degC it is recommended that the temperature of 25deg plusmn 5deg be maintained with as little fluctuashytion as possible Entrained air must be removed Good houseshykeeping is essential at all times and an occasional standardizashytion of the instrument and replacement of ion exchanger and membranes in the electrode must be carried out to insure good response and changes due to aging
Ion-selective electrodes have been found to be especially useshyful for potentiometric titrations They are now routinely used for the determination of Cl- Ca++ Mg++ and 50=4
The application of specific enzyme electrodes shmvs real promshyise in the biological and biochemical fields The employment of enzymes and biological materials in membrane electrodes has resulted in the development of a number of new sensors for analysis of such species as blood glucose and lactate (15) amygdashylin (9) and urea (5) At present an electrode specific for lactic acid is being developed in this laboratory and appears to be promising Some engineering problems are yet to be overcome before routine use can be made
Literature Cited
(1) CARR P V 1971 Intrinsic endpoint errors in preOlpItation titrashytions with ion selective electrodes Anal Chern 43 (3) 425middot430
(2) DEPARTMENT or COMMERCE 1969 Ion selective electrodes National Bureau of Standards Special Publication 314
(3) FRANT 1 S and J W Ross JR 1970 Potassium ion specific elecshytrode with high selectivity for potassium over sodium Science 167 (3920) 987-988
(4) FRANT M S et ai January 1969 Ion-selective electrodes-a new technology for chemical measurement Am Lab 11
(5) GUILBAULT G G and J G MONTALVO 1970 J Am Chern Soc 92 2533
VOL 16 No6 JULY 1971 495
(6) HOZUMI K and N AKIMOTO 1970 Argentometric microdeterminashytion of halogens using sod ium-sensit ive glass electrode in nonshyaqueous m edi um Analytical Chemistry 42 (12) 1312-17
(7) MCCASllN B D IV T FRANKLIN and M A DILLON 1970 Rapid determination of nitrate nitrogn in sugarbeets with specific ion electrodes J Am Soc Sugar Beet Techno 16 (I) 64-70
(8) ORION RESEARCH INCORPORATED Instruction manual divalent cation electrode Model 92-32 Instruction manual calcium ion electrode Model 92-20 II Blackstone Street Cambridge Mass 02139
(9) RECHNITZ G A 1971 Enzyme electrode for amygdalin Anal Chem 43 (2) 283
(10) RECHNITZ G A 1967 Ion-Sel ective Electrodes C amp E News 45 (24) 146
(ll) Ross J W JR ane IVe S FRANT 1969 Potentiometric titrations of sulfate usi ng an ion-selecti ve lead electrode Ana Chem 41 (7) 967-969
(12) SCHOENROCK K W R 1968 Paper presented at 15th ASSBT Meeting Phoenix Arizona
(13) SCHULTZ F A 1971 Titration errors and curve shapes in potentioshymetric titrations employing ion-selective indicator electrodes Anal Chem 43 (1) 502-508
(14) VANT RIET B and J E WYNN 1969 Potentiometric determinat ions of calcium magnesium and complex ing agents in water and biological fluids Anal Chern 11 (I) 158-162
(15) WILLIAMS D L A R DOIC JR and A KaRaS 1970 Electroshychemica l enzymatic analysis of blood glucose and lactate Anal Chern 42 (I) 118-120
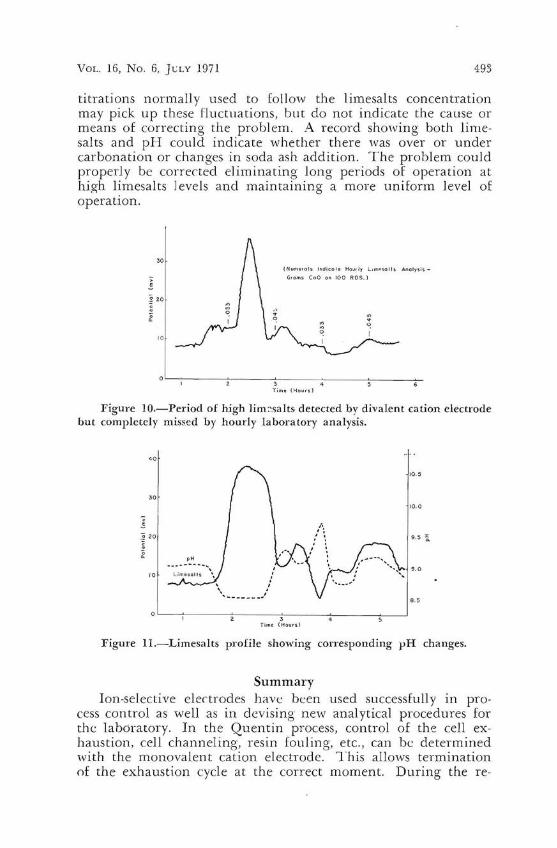