application of infrared thermography to the analysis of welding
TRANSCRIPT

H.9.1
Application of Infrared Thermography to the Analysis of Welding processes
by Janan Al-Karawi, Jürgen Schmidt
Institute of Fluid Dynamics and Thermodynamics, Otto-von-Guericke University, Universitätsplatz, 2, D-39106 Magdeburg, Germany Tel. +49-3916712713, fax +49-3916712762 e-mail: [email protected]
Abstract
Infrared thermography is applied to measure the temperature distribution at the surface of metal sheets during the welding. The knowledge of the temperature field is the basis for the understanding of heat effects on welding, the evaluation of the quality and the analysis of weld defects. The measured temperature distribution can be compared with the results of numerical simulations. Thus the infrared thermography is a powerful method for the parameter identification as well as for the validation of numerical models for the simulation of welding processes. The results for three welding techniques, narrow-gap arc welding in vertical position, laser beam welding and high power welding with rotary arc are presented and discussed. 1. Introduction
The evaluation of the quality and the analysis of the physical behavior of welds usually requires the knowledge of the transient temperature field during the welding process. For a given material, the temperature distribution determines the microstructure in the heat affected zone as well as residual stresses and distortions of the welding construction. For steels for example, the time for the cooling from 800 °C to 500 °C, the so-called t8/5-time, has a crucial influence on the structure. Therefore, the temperature field is fundamental for the understanding and analyzing of heat effects on welding and weld defects /1/. Beside the measurement of the temperature field, the numerical simulation gains increasingly significance /2-4/.
Important for the accurate prediction of the temperature field is the modeling of the energy input and a realistic description of the heat transfer, especially in the fusion zone. For the validation of the developed simulation program, the application of the infrared thermography represents a powerful method. The numerical results can be compared with the experimentally obtained surface temperature distribution for defined test cases. Of particular importance is the knowledge of the weld pool geometry as well as the position of selected isotherms. This paper presents the results of the application of infrared thermography on three different welding techniques: - narrow gap arc welding - laser beam welding - high power welding with rotary arc. Good results could be obtained also for the capacitor discharge stud welding /5/. 2. Measurement system and experimental set-up
Two different infrared systems were used to measure the surface temperature of the probe. The first one is the AGEMA Thermovision 900 with a CMT detector sensitive in the 8 – 12 µm wavelength range and cooled by liquid nitrogen. The
http://dx.doi.org/10.21611/qirt.2004.077

H.9.2
measurable temperature range is between – 30 and 2000 °C with an announced thermal sensitivity of 0.08 K at 30 °C. It is connected to a controller reaching a frame rate of 30 Hz and processing thermograms in 272 x 136 pixels at a frame rate of 15 Hz. The camera is equipped with a standard 20° optical setup and also with a 5° optic, which, coupled with an additive lens, is able to reach a distance of about 0.2 mm between two pixels at a distance of 0.6 m from the object. The second IR-system is the FLIR ThermaCAM SC 3000 with a Quantum Well Infrared Photodetector (QWIP), Stirling cooled to 70 K and a resolution of 320 x 240 pixels. The spectral range is 8-9 µm. It works with an image frequency of 50 Hz in full resolution and with 750 Hz in a resolution of 340 x 25 pixel. The thermal sensitivity is 0.02 K at 30 °C. The IR-camera is equipped with a standard 20° optical setup.
The thermographic measurements were made only under well-defined welding conditions, which assure working without spatters. To avoid fine welding spatters upon the IR-optical system during the experiment, a simple air blowing setup was used additionally in front of the protected lens. 3. Calibration and deter-mination of the emissivity The preparation and reali-zation of experiments using the thermography systems play an important role to insure that the measured results achieve good quality. The calibration of the infrared system is based on the concept of the black body principle /6/, /7/. It is advisable to check the infrared system regularly. Therefore control measurements were regular
0
0,01
0,02
0,03
0 0,01 0,02 0,03 0,04 0,05∆ε (−)
∆T/
T (-)
ε = 0.5
ε = 0.7
ε = 0.9
Fig. 1. Influence of incorrect emissivity
carried out using a black body source MIKRON M335 with a temperature range of 300 to 1500 °C and an accuracy of + 0.4 % of reading + 1 digit. It achieves a temperature resolution of 1 K and a stability of 1 K per 8 hour period. The aperture dimensions are 19 mm diameter and 150 mm length. It reaches an emissivity of 0.99 + 0.003 and the sensor is a precision platinum thermocouple.
The determination of the temperature requires the knowledge of reliables values of the emissivity. The influence of uncertainties of the emissivity ε on the relative error of the temperature depends on ε, fig. 1. For the metals it is important to assure high emissivities to reduce the measuring error. By oxidizing the sample plates before welding, an uniform and relatively high emissivity of the surface was achieved. The emissivity of the oxidized welding specimen was measured in laboratory using a furnace which works between room temperature and 1200 °C. A thermocouple was fixed at the surface of the probe to watch and record its temperature. The welding specimen was put inside the furnace and the temperature increased gradually. By comparing the temperature of the thermocouple and the shown infrared temperature, the emissivity of the surface depending on the temperature was determined. Higher temperatures require the application of an inert gas. Furthermore, thermocouples were used to measure the temperature at selected surface points near the seam during the welding in order to verify the emissivity and to confirm the thermographic results.
http://dx.doi.org/10.21611/qirt.2004.077

H.9.3
However, the used infrared system program offers an analysis with a constant emissivity. Therefore, a program was developed which made possible the analysis with an emissivity depending on the temperature and the temperature could be corrected. 4. Results
First applications of the method were made for the narrow-gap arc welding in vertical position. This method is characterized by a low energy input and allows single pass joints up to plate thickness of 16 mm, where strong deformation of the weld pool occurs. The quality of the seam and the strength of the join depend on the temperature field in the workpiece, which can be determined by numerical simulations. A model proposed, /3/, uses a distribution function for the energy input, which depends on the shape of the free surface of the weld pool and on the surface temperature distribution. For the practical application of this model it is necessary to determine the dependence of the model parameters on the relevant welding parameters. For this purpose, experiments were systematically carried out. The seam shape and the location of fusion line and heat affected zone were derived from transversal and longitudinal macrographs. Temperature fields measured by means of an infrared thermography system and thermocouples were used for the adaptation of the model parameters used in the developed simulation program TENAS. In the experiments, the IR-camera was focused at the seam in the middle of the test sheet and a sequence of images with a frequency of 15 Hz or 30 Hz in the half images mode was registered. Thus, the unsteady temperature distribution can be determined for each point. Fig. 2 shows as an example an infrared image with analysis spots and the corresponding cooling curves crosswise to the joint. In the image, the thermocouples can be also seen at the right side of the seam.
50,0°C
1300,0°C
500
1000
SP01SP02SP03SP04
400
500
600
700
800
900
1000
32 34 36 38 40 42 44 46 48 50 52Time ( s )
Tem
pera
ture
( °C
)
Spot1Spot2Spot3Spot4
Fig. 2. Infrared image and determined temperature distributions ϑ(t) by arc welding
The welding torch with the electrode passes through the image from the bottom to the top. Related to a coordinate system bound to the moving electrode, the temperature field is steady with the exception of the begin and the end of the seam. Only some fluctuations caused by the real welding process appear. This fact can be used for different analysis methods of the registered surface temperature distribution. For the used low-alloyed steel, the t8/5–time, which denotes the cooling time from 800 °C to 500 °C, is characteristic for the formation of the microstructure. The resulting microstructure can be predicted using the theory proposed by Seyffarth /8/. Fig. 3 shows an image registered at a frequency of 15 Hz with the isotherms of 800 °C and 500 °C. The t8/5-time can be determined for each point directly from the experiment and can be then compared with the simulation results. The results of a validating experiment and the corresponding simulation after the parameter identification are presented in fig. 4. The comparison shows a good agreement between experimental and computed shapes and the position of isotherms bounding characteristic regions of the joint.
http://dx.doi.org/10.21611/qirt.2004.077

H.9.4
50,0°C
1500,0°C
500
1000
1500
Fig. 3. Isothermes at 800°C and 500°C
Fig. 4. Comparison of computed and measured location of the heat affected zone and seam shape
Compared to arc welding processes, laser beam welding (LBW) is characterized by very high local power densities and high temperature gradients, especially in the normal direction of the seam. Consequently high local resolution of the thermography system is required. The high power densities lead to the formation of a vapor capillary through the material, the so-called keyhole, see fig. 5, and most of the molten material will flow around the keyhole and solidify behind it as a result of the heat transfer in the workpiece moved relative to the laser. Heat transfer and fluid flow driven by the flow around the keyhole, the vapor flow in the capillary, surface tension forces and buoyancy forces have a great influence on the temperature field. The great number of influencing parameters and transport phenomena restricts efforts to develop general self-consistent models. Therefore, process-specific modeling on the basis of a parameter fit model is preferred. Such a
Fig. 5. Scheme of laser beam welding
simulation model based on a three-dimensional formulation is presented in /4/. The results of the simulations show a great influence of surface tension gradients. In fig. 6, numerically calculated temperature and velocity distributions for two different values of the Marangoni-number Ma are presented. Fig. 7 shows a characteristic surface temperature distribution.
Fig. 6.Temperature and velocity distribution for different Marangoni-numbers. Left : Ma = 100, right: Ma = 1000
http://dx.doi.org/10.21611/qirt.2004.077

H.9.5
The dimensionless melting point temperature is Θm = 0,5 and the corresponding isotherm characterizes the meltpool. The relation of the length to the width of the weld pool depends strongly on the Marangoni convection, as can be seen in fig. 6. Since the dependency of the surface tension on the temperature at higher values is not accurately available, experiments are necessary for the estimation of the influence of the Marangoni-effect on the model. For these reasons and for the adaptation of the model, infrared images
Fig. 7. Surface temperature distribution
300,0°C
1650,0°C
500
1000
1500
Fig. 8. IR-image of the weld pool (LBW)
250,0°C
1000,0°C
500
1000
Fig. 9. Curved laser seam
of the surface temperature distribution were made using both systems THV 900 and ThermaCAM SC 3000. Using a laser power of PL = 5000 W and different types of steel, the technological parameters of the welding process, especially the welding travel speed, have been varied, /4/. Typical infrared images are presented as an example in figs. 8 and 9 for both straight seam and curved seam. The comparison between measured and calculated results using characteristic isotherms allows the adaptation of the model to the real welding process.
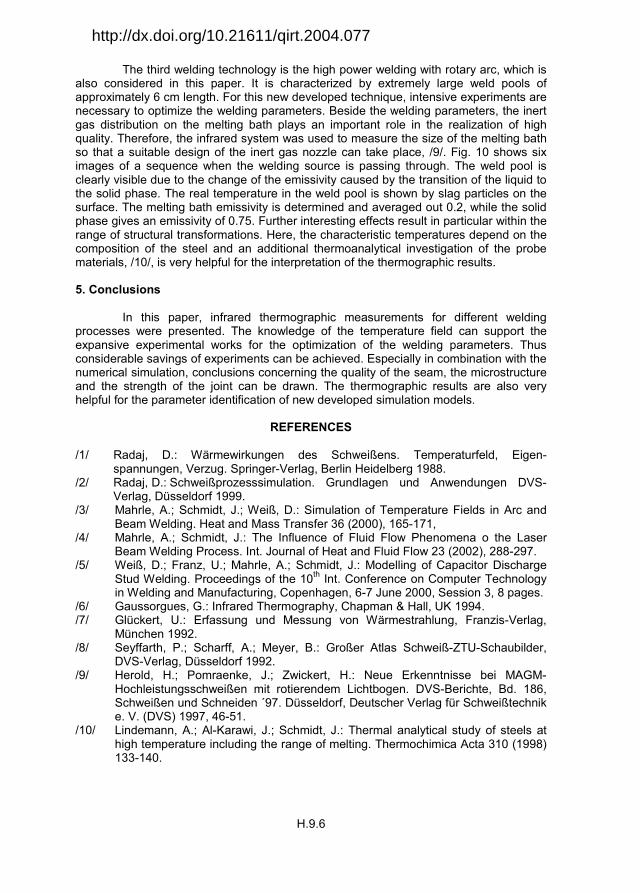
Fig. 10. Sequence of IR-images of high power welding with rotary arc
http://dx.doi.org/10.21611/qirt.2004.077
H.9.6
The third welding technology is the high power welding with rotary arc, which is also considered in this paper. It is characterized by extremely large weld pools of approximately 6 cm length. For this new developed technique, intensive experiments are necessary to optimize the welding parameters. Beside the welding parameters, the inert gas distribution on the melting bath plays an important role in the realization of high quality. Therefore, the infrared system was used to measure the size of the melting bath so that a suitable design of the inert gas nozzle can take place, /9/. Fig. 10 shows six images of a sequence when the welding source is passing through. The weld pool is clearly visible due to the change of the emissivity caused by the transition of the liquid to the solid phase. The real temperature in the weld pool is shown by slag particles on the surface. The melting bath emissivity is determined and averaged out 0.2, while the solid phase gives an emissivity of 0.75. Further interesting effects result in particular within the range of structural transformations. Here, the characteristic temperatures depend on the composition of the steel and an additional thermoanalytical investigation of the probe materials, /10/, is very helpful for the interpretation of the thermographic results. 5. Conclusions
In this paper, infrared thermographic measurements for different welding processes were presented. The knowledge of the temperature field can support the expansive experimental works for the optimization of the welding parameters. Thus considerable savings of experiments can be achieved. Especially in combination with the numerical simulation, conclusions concerning the quality of the seam, the microstructure and the strength of the joint can be drawn. The thermographic results are also very helpful for the parameter identification of new developed simulation models.
REFERENCES /1/ Radaj, D.: Wärmewirkungen des Schweißens. Temperaturfeld, Eigen-
spannungen, Verzug. Springer-Verlag, Berlin Heidelberg 1988. /2/ Radaj, D.: Schweißprozesssimulation. Grundlagen und Anwendungen DVS-
Verlag, Düsseldorf 1999. /3/ Mahrle, A.; Schmidt, J.; Weiß, D.: Simulation of Temperature Fields in Arc and
Beam Welding. Heat and Mass Transfer 36 (2000), 165-171, /4/ Mahrle, A.; Schmidt, J.: The Influence of Fluid Flow Phenomena o the Laser
Beam Welding Process. Int. Journal of Heat and Fluid Flow 23 (2002), 288-297. /5/ Weiß, D.; Franz, U.; Mahrle, A.; Schmidt, J.: Modelling of Capacitor Discharge
Stud Welding. Proceedings of the 10th Int. Conference on Computer Technology in Welding and Manufacturing, Copenhagen, 6-7 June 2000, Session 3, 8 pages.
/6/ Gaussorgues, G.: Infrared Thermography, Chapman & Hall, UK 1994. /7/ Glückert, U.: Erfassung und Messung von Wärmestrahlung, Franzis-Verlag,
München 1992. /8/ Seyffarth, P.; Scharff, A.; Meyer, B.: Großer Atlas Schweiß-ZTU-Schaubilder,
DVS-Verlag, Düsseldorf 1992. /9/ Herold, H.; Pomraenke, J.; Zwickert, H.: Neue Erkenntnisse bei MAGM-
Hochleistungsschweißen mit rotierendem Lichtbogen. DVS-Berichte, Bd. 186, Schweißen und Schneiden ´97. Düsseldorf, Deutscher Verlag für Schweißtechnik e. V. (DVS) 1997, 46-51.
/10/ Lindemann, A.; Al-Karawi, J.; Schmidt, J.: Thermal analytical study of steels at high temperature including the range of melting. Thermochimica Acta 310 (1998) 133-140.
http://dx.doi.org/10.21611/qirt.2004.077