application of graph theory to requirements traceability · pdf fileapplication of graph...
TRANSCRIPT

Application of Graph Theory to
Requirements Traceability Requirements Traceability
A methodology for visualization of
large requirements sets
Sam Brown
L-3 Communications
“This presentation consists of L-3 STRATIS general capabilities information that does not contain controlled technical data as defined within the International Traffic in Arms (ITAR) Part 120.10 or Export Administration Regulations (EAR) Part 734.7-11.”

Traceability in the Large
Level 2
Level 3
Project
System
Requirements Verification Events
Test traceability
Level 4
Level 5
SubSystem
Unit
Requirement Traceability
Traceability is key to both requirements development and requirements verification
Each project has unique approaches to traceability and verification

LMA Requirement FSW Requirement TLCM Requirement
387
The flight system shall
support the DOR tone
capability in the SDST,
including wideband DOR
tones at X-band. 1317
The flight software
shall command the
transponder as defined
by the transponder
documentation 706
The flight software shall configure the transponder telemetry inputs in accordance with the
active FS side whenever the trnsponder is powered ON. Reference transponder ICD for
selection table.
1997
The flight system shall
accommodate PCM / PSK /
PM modulation for the X
band downlink. 711
The flight software shall provide the capability to command an “active” telecom side which
determines the “active” transponder in use and the uplink channel.
712
The flight software shall propagate the power state and configuration of the transponder
when changing the “active” telecom side.
713
The flight software shall provide a default “active” telecom side upon initialization. The
default “active” telecom side, in the absence of faults or obituary table entries, will be Side
1 (Telecom Side 1 uses SDST 1, and Telecom Side 2 uses SDST 2).
714
The flight software shall only perform the necessary SDST initializations if a commanded
“active” telecom side is different from the currently “active” telecom side.
725
The flight software, upon initial application of transponder power ON, shall provide for a
configurable default state. Subsequent power ON transitions will default to last
commanded state.
Motivation for a Visualization
Methodology
Studying characteristics of
information flow in large
Requirements sets
>20 documents725 commanded state.
1200
The flight software shall provide the capability to enable or disable the X-Band exciter for
the active transponder.
1201
The flight software shall provide the capability to enable or disable c mode for the active
transponder.
1202
The flight software shall provide the capability to enable or disable X-Band Ranging for the
active transponder.
1203
The flight software shall provide the capability to set the Ranging Modulation Index for the
active transponder.
1204
The flight software shall provide the capability to enable or disable X-Band Differential One-
Way Ranging (DOR) Mode for the active transponder.
1205
The flight software shall provide the capability to command an X-Band convolutional
encoding mode of TLM_OFF, rate 7 1/2, or BYPASS for the active transponder.
1206
The flight software shall provide the capability to to command the Ranging Mode to
BASEBAND or EXTERNAL for the active transponder.
1207
The flight software shall provide the capability to command the X-Band Subcarrier for the
active transponder to one of the following frequencies: 281.25 Khz squarewave, 281.25 Khz
sinewave, 25 Khz squarewave, or 25Khz sinewave.
1208
The flight software shall provide the capability to command the X-Band Squarewave
Telemetry Modulation Index to one of 128 discrete values (0x00 to 0x7F) for the active
SDST.
1209
The flight software shall provide the capability to command the X-Band Sinewave
Telemetry Modulation Index to one of 16 discrete values (0x0 to 0xF) for the active SDST.
1211
The flight software shall provide the capability to command the X-Band telemetry
modulation mode to SUBCARRIER or BPSK for the active transponder.
>20 documents
>10,000 requirements
>7,000 linkages
Quickly communicate regarding patterns involving hundreds or thousands of requirements

Graph Theory History
Leonhard Euler: The seven bridges problem
Publication in 1736 as the first description of
graph theory, and is generally regarded
as the origin of topology
Vanermonde: The knights tour problem
Cauchy and L’Hullier: Relationships between faces,
edges, and vertices of convex polyhedrons
Study of pair-wise relationships between objects
Graphs are the parent family to a variety of topologies:
directed graphs
trees – Cayley and differential calculus
coloring problem

What is a graph?
• Graph theory is the study of mathematical structures used to model relationships between objects in finite collections.
• A graph is composed of nodes and edges
• Graphs can be classified as undirected, directed, tree, planar, etc depending upon the nature of the connections.
edgenode
edge
The Seven Bridges Problem
Four nodes, seven edges
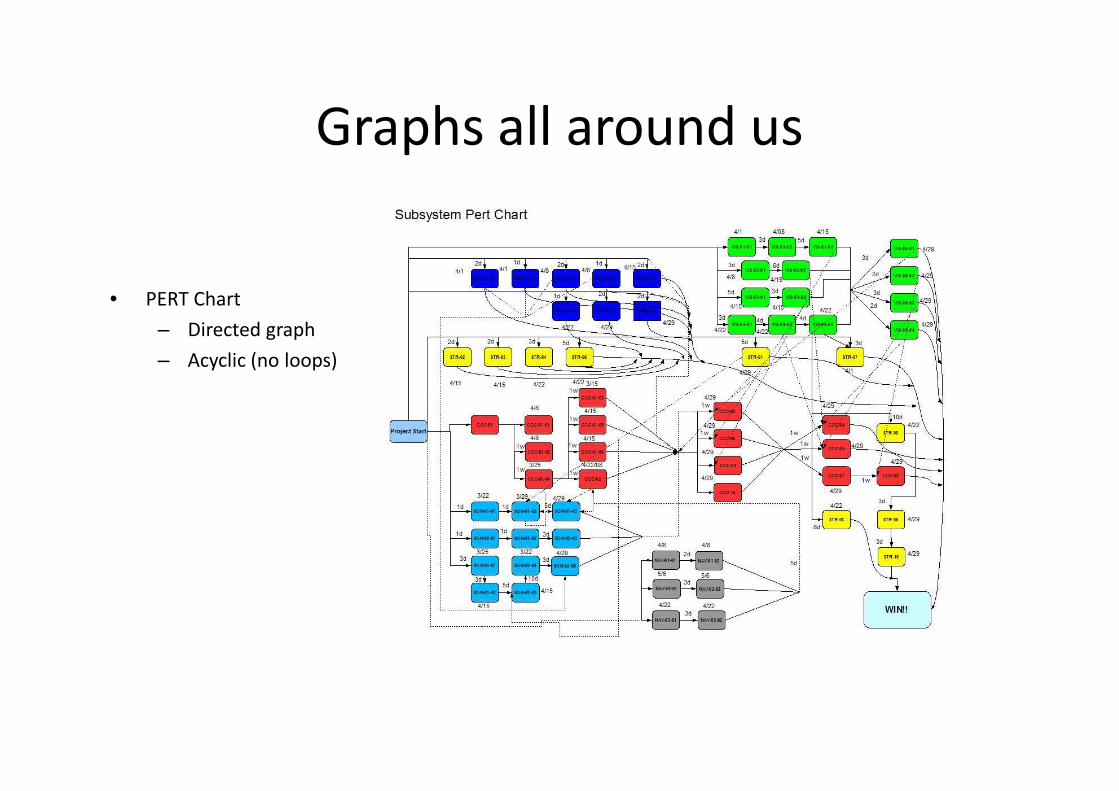
Graphs all around us
• PERT Chart
– Directed graph
– Acyclic (no loops)

Flow Charts as Graphs
Directed graph
Sometimes cyclicSometimes cyclic

Network Exploration Graphs
Mapping Universities
Cybermetrics Lab
IEDCYT, Joaquin Costa
Madrid Spain

Graphs of Requirements Sets Getting to the good stuff soon now…
Types of Graphs
Simple graph – nodes and edges
Directed graph – nodes and edges with direction (digraph)
Acyclic graph – no cycles (loops)
Connected graph – every node is reachable from any other node
Tree – connected acyclic graph
Forest – acyclic graph but unconnected
In the general case, requirements traceability forms an acyclic digraph, or forest
- Generally no single top-level node
- Generally not connected
- Almost always acyclic
- Directed
In the following examples of real system requirements graphs, the graphs
are drawn as digraphs with the arrow pointing from the parent to the
child. Untraced requirements are shown with red borders. We use
boxes to denote the nodes simply because they fit the numbers better.
These examples show a subnet of the full requirements net for clarity.

2394
1446
1447
1449
2295
2296
1450
L-4 Requirements318
2403309
2494
783
5545
322
5551
808326
334*
2440
338
2436
342
1242
344
346
2428
2429
2431
2433
24342437
347*
348
2436
377
384
396
421 2410
2441
2442
2444
1370
1372
1373
1374
1375
1376
1377
1378
1379
1380
1384
1385
1453
2470
1386
1387
1388
1389
1390
1391
1392
1393
1394
1395
1396
1400
2397
Device Traceability Topology
DE
VC
E
ICD
Requirements fan
out dramatically
from L-4 to L-5
L-5 Requirements
Note traceability
between ICD and
Requirements
23941450
1451
2194
344
2430
2432
1445
361
4142406
2408
2445778
2404
740
2443
438
742
2405
744
2445
2446
745
2450
469
2418746
2419
506
2425
2427 2423
773
2422
774
2424
775
2426
776
1380
1382
1383
1385
1453
1454
1455
1456
1489
1490
1399
1400
1401
1402
1403
1404
2399
2418
2419
2420
24212492
2493 2499 24162417
2448
2449 2395
2396
2394
2415 1505-1508
Device ICD Requirements are traced to
both L-4 and L-5 requirements . Two L-4
requirements are untraced to L-5, one is
probably incorrect trace to the ICD

Traceability Patterns
• Large fan-out from parent to child suggest a large change in level of abstraction.
• One-to-one suggests under-specified lower-level requirements. under-specified lower-level requirements.
• Hour-glass traces seem to indicate serious problems in the intermediate requirements document; traceability event-horizon. May indicate verification difficulties.

306
2282
314
2291-2293
2316-2317
318
2286
2288319
338 342
1153
344 346
2370
2372
2373 2375 2376
348
2374
740
2287
421
22942295
712
717
2289
719
2308-2313
445
446 453
2299
2300
2298
2326 2329 2333 2334 2335
2332
2290
1492
2327
2277-2279
23192320
2322
2323
2275 2276
Instrument ICD Instrument ICD Traceability Topology
2387
2377
2373 2375 2376
23782371
2374
2579
2453 2454
446
706
2452
453
707
469 714
2574
478 737
738 506 2577
734 736
1466
25802290
13701372-1385
1453-1456
1489-1490
1467
1386-1396
1399-1406
1458-1460
1488
2567
2568
2571
2576
1468
2248
L-5 GNC
2291
1469
2380-2382
1505-15082204
2578
L-3FSW
parents
L-4 FSW
L-5 PYLD

306
1531
1602
1669
311
1654
1801
314
1653
318
1536
346
1571 1574 1576
1579 1581 1583
348
1572 1577
1582
384
1637
407
443 1649
1655
850
1833
4211656
769
1834
771
1607 1608
1618
761
1658469
1557
773
1601
476
1561 1562
478
1559
484 827
1664
816
1665
817
16661667
1570
1565
1680
1632
1569
1621
1668
16711670
1539
16061611
1619
2248
1613
1540
1560
15731575
1578
1580
1584
1737
1738
1800
1674
1678
16811633
16721800
1550 1552
1603
ICD L-4 FSW
L-5 GNC
L-5 IO
2340
4333 4336
818 819
820 723
821 822
823
1471
1370
1372-1385
1453-1456
1489-1490
2465
2298
1386-1388 1390-1406
1458-1460
1488 1492
2619 2622
2623
1437
1553-1554
1590-15941596-1599
1629-16301635-1636
1659-1660
1447
1542-1544
1555-1556
1586-1588
1623-1624
1626-1627
23392642
2206
1546-1549
1566-1570
2337
1472
1483-1484
1550-1551
2644
2270
1505-1508
L-5 PYLD
parent
L-3 FS
Requirements fan
out dramatically
from L-4 to L-5
830
A more complex
topology

1317
706
711
712
713
714
725
1200
1201
1202
1203
1204
1205
1206
1207
1208
1209
1210
1211
1341
1342
227 228
230* 238
240 242
246 247
249 251
253 261
268 273
279 281
283 285
286
Inst
rum
en
t IC
D
FSW
L-4
Inst
rum
en
t L-
5
Instrument Traceability Topology
728730
1327
1997
The flight software shall command
the instrument as defined by the
instrument documentation
Typical ICD philosophy –
descriptive and untraced to
requirements1211
1212
1181
1319
1182
1175
2384
1199
1198
731
733-735
1184- 1185
738
740-742
743
745
747-749
751-753
620
626
1989
2189
2339
FS L-3
387
64 children

Graphs as Traceability Diagnostics
• Histograms of
connection counts:
– Statistics of connection
counts may suggest
decomposition problems
0
Common random graphs exhibit
exponential probability
distribution
decomposition problems
– Distributions are
typically exponential
(Internet, Kevin Bacon –
movie graph)
1
10
100
1000
10000
0 20 40 60 80 100 120Trace Count
Tra
ce F
req
ue
ncy
Example real project connection histogram
Conjecture: Exponent may be relatable to
the overall degree of abstraction change
between linked requirements:
High values mean small change


Automation of the Graphing Process
PowerPoint is NOT the
best tool for analysis
• VCG - http://rw4.cs.uni-sb.de/~sander/html/gsvcg1.html
• Graphviz http://www.graphviz.org/
• Jgraph – www.jgraph.com
• Guess - http://graphexploration.cond.org/
Automatic graph generation from A matrix and specification of groups
Numerous applications available
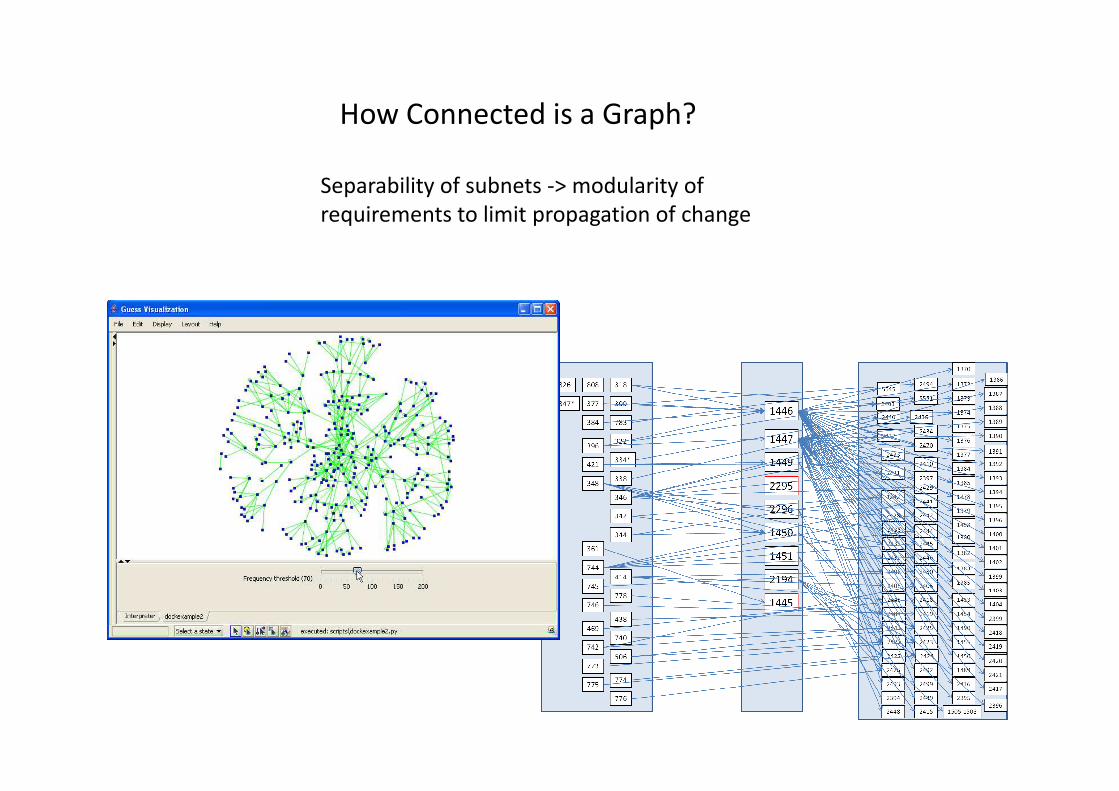
How Connected is a Graph?
Separability of subnets -> modularity of
requirements to limit propagation of change

Expressing Graphs as Mathematical
Structures - Vocabulary
Vertex: Endpoint (or connection point or node)
Edge: Connection between vertices
Incidence List : Array of pairs (tuples if directed) of vertices or connections
Adjacency List: List of pairs of vertices as a list (2x n array)
Incidence Matrix: Vertices by Edges matrix where each entry contains the Incidence Matrix: Vertices by Edges matrix where each entry contains the
endpoint data (1 = incident, 0 = not incident)
Adjacency matrix (A): N by N matrix where N = the number of vertices in the
graph. Entries are either 0 if not connected, 1 if connected.
If there is an edge from vertex k to vertex j then A(j,k)=1
Degree: Matrix of connection counts on the diagonal (D)
Laplacian matrix: L=D-A, where D= the diagonal degree matrix
Danger: Math Ahead

Connectivity and Graphing Here comes the math
Graph Fiedler Value
Path 1/n**2
Grid 1/n
3D Grid n**2/3
Expander 1
The smallest nonzero eigenvalue of
the Laplacian matrix is called the
Fiedler value (or spectral gap).
Binary tree 1/n
dumbell 1/n
Small values of the Fiedler number mean the graph is easier to cut into two subnets.
If the number is large, then every cut of the graph must cut many edges.
Conjecture: Would a large Fiedler number for a requirements graph indicate
a system that was difficult to partition into subnets, thus difficult to change?

A Simple Graph and Spectral Analysis
0 1
1 0 1
1 0 1 1 1
1 0
1 0
1 0
A Matrix
1 0
1 -1
-1 2 -1
-1 4 -1 -1 -1
-1 1
-1 1
-1 1
Laplacian (D-A) Eigenvalue:
From linear algebra
Lx=λx where λ is an eigenvalue
And x is a non-null eigenvector
Because L is symmetric the
eigenvalues are all real
λ={0, 0.486, 1, 1, 2.428, 5.086}
Fiedler number = 0.486
implying somewhere between an
expander (1) and a tree form (1/6)

Summary
• Graphs can be useful
visualization tools for
large requirements sets
– Big picture viewpoint
• Potential for analysis
– Relationship between
connection histogram
and requirement
decomposition– Patterns easily
recognized
– Multi-level tracing
– Identification of subnets
decomposition
– Ability to quantify
interconnectedness by
spectral analysis