application of ftir for quantitative analysis of lime · application of ftir for quantitative lime...
TRANSCRIPT

UNIVER511Y OF NO IH*TEXAS"·'
Application of FTIR for Quantitative Lime Analysis
Report Number 5-9028-01-1 Project Number 5-9028-01
Seifollah Nasrazadani and Esteban Eureste
April2008

Technical Report Documentation Page 1. Report No. 2. Government Accession No. 3. Recipient's Catalog No. FHW AITX -08/5-9028-01-1
4. Title and Subtitle 5. Report Date
April 16, 2008 Application of FTIR for Quantitative Analysis of Lime
6. Performing Organization Code
7. Author(s) 8. Performing Organization Report No. Seifollah Nasrazadani and Esteban Eureste 5-9028-01-1
9. Performing Organization Name and Address 10. Work Unit No. (TRAIS)
University ofNorth Texas 3940 N. Elm- Suite Fll5X (Research Park) 11. Contract or Grant No. Denton Texas 76207 5-9028-01 12. Sponsoring Agency Name and Address 13. Type of Report and Period Covered Texas Department of Transportation Technical Report Research and Technology Implementation Office March 2007-February 2008 P.O. Box 5080 Austin, TX 78763-5080 14. Sponsoring Agency Code
15. Supplementary Notes
Project performed in cooperation with the Texas Department ofTransportation and the Federal Highway Administration.
16. Abstract
TxDOT currently uses the titration method for the quantitative analysis of lime samples. The titration method is time consuming (hours if not an entire day is spent for each analysis) and it is not an accurate test due to chemical interferences and sample preparation variances. In addition, the titration method consumes chemicals that are costly and add to hazardous waste inventory. On the other hand, lime and its related materials absorb Infrared rays and exhibit their fingerprint spectra that are free of spectral interferences. In this implementation project, application of Fourier Transform Infrared spectroscopy (FTIR) was investigated for rapid and accurate quantitative analysis of lime from three forms including quick lime, hydrated lime and slurry lime. Calibration curves relating absorption relative intensities of lime to lime concentrations (for both quicklime and slurry lime samples) were generated that showed R2
= 0.88, and will be utilized to quantify lime content of an unknown sample. Sample preparation method for different forms of lime is discussed and precautions to consider for interference avoidance are discussed. Results indicated that FTIR is a safe and straightforward method that requires minimal operator training and expertise. Finally, a testing protocol for lime quantification using FTIR was develoQ_ed. 17. Key Word 18. Distribution Statement
FTIR, lime analysis, quick lime, hydrated lime, No restrictions. This document is available to the slurry lime public through the National Technical Information
Service, Springfield, Virginia 22161 , www.ntis.gov.
19. Security Classif. (of this report) 20. Security Classif. (of this page) 21. No. of Pages 22. Price
unclassified 60
Form DOT F 1700.7 (8-72) Reproduction of completed page authorized
11

Deliverable: Technical Report
Researchers: Dr. Seifollah Nasrazadani, Esteban Eureste, University ofNorth Texas
Deliverable Number: Rl of Project Number 5-9028-01
Project Number: 5-9028-01
Project Title: Application ofFTIR for Quantitative Lime Analysis
Sponsoring Agency: Performed in cooperation with the Texas Department ofTransportation
and the Federal Highway Administration
Date: 4115/08
Performing Agency: University ofNorth Texas (Performed in cooperation with Texas
Department ofTransportation and the Federal Highway Administration)
Ill

Disclaimers
Author's Disclaimer: The contents ofthis report reflect the views of the author(s), who is (are)
responsible for the facts and the accuracy of the data presented herein. The contents do not
necessarily reflect the official view or policies of the Federal Highway Administration (FHW A)
or the Texas Department ofTransportation (TxDOT). This report does not constitute a standard,
specification, or regulation.
Engineering Disclaimer: This report is not intended for construction, bidding, or permit
purposes.
Manufacturers' Notice: The Unites States Government and the State of Texas do not endorse
products or manu-facturers. Trade or manufacturers' names appear herein solely because they
are considered essential to the object of this report.
IV

Acknowledgements:
Authors acknowledge support and encouragement provided by Texas Department of
Transportation Project Monitoring Committee members including:
Dr. German Claros -Pavements & Materials Research Engineer
Claudia Kern -Implementation Director
Patricia Trujillo -Project Advisor
Frank Espinosa, Jr. -Contract Specialist, RMC I
Kristine Santos -Technical Staff
Jacob Wischnewsky-Technical Staff
v

Table of Contents
1.0 Background and Significance of Work ..................................................... 1
1.1 Existing standard methods for lime quantification and their drawbacks .......... 2
1.2 Application of FTIR for lime quantification .............................................. 3
1.2.1 Working Principle ............................................................................. 4
2.0 Literature review ................................................................................. 6
3.0 Research Method ................................................................................ 1 0
4.0 Results and Discussions ........................................................................ 12
4.1 FTIR Analysis of commercial Calcium Oxide ............................................. 12
4.2 FTIR Analysis of Field Quicklime Samples ................................................ 13
4.3 FTIR Analysis of Field Slurry Samples ...................................................... 15
4.4 X-ray Diffraction Analysis ..................................................................... 19
5.0 Summary ........................................................................................... 21
5.1 Recommendations ................................................................................ 21
6.0 References .......................................................................................... 22
Appendix A: Protocol ........................................................................... ..... 24
Appendix B: FTIR spectra of all samples ........................................................ 28
Appendix C: Field Samples Data Sheets ......................................................... 34
VI

List of Figures:
Figure 1: Stretching and bending vibrations of atoms due to absorption of IR radiation.
Figure 2: Experimental set-up for Fourier Transform Infrared Spectroscopy.
Figure 3: FTIR spectra of hydrated lime (a) and calcium carbonate (b) [7].
Figure 4: Superimposed FTIR spectra of lime-calcium carbonate blends.
Figure 5: IR spectra of calcium oxide and calcium hydroxide shown by Zaki et al [9].
Figure 6: Variation in Pressure in Pellet Die. Light Blue-5kpsi; Dark Blue-10kpsi; Red-15kpsi.
Figure 7: Variation in Atmosphere Exposure. Green-24hrs; Blue-48 hrs; Red-72 hrs.
Figure 8: Calcium Oxide (3640 peak) and Potassium Ferricyanide (2115 peak).
Figure 9: CaO Calibration Curve.
Figure 10: Intensity ratio vs CaO concentration for known field Quicklime samples.
Figure 11: Quicklime calibration curve based on the mathematical model.
Figure 12: Variations of CaO concentration based on the mathematical model.
Figure 13: Intensity ratio vs Ca(OH)2 concentration for known field slurry lime samples.
Figure 14: Slurry lime calibtaion curve based on the mathematical model.
Figure 15: Variations of Ca(OH)2 concentration based on the mathematical model.
Figure 16: XRD pattern of a typical lime sample with identified CaO diffraction peaks.
Figure 17: Calibration curve for Quicklime analysis using XRD.
Figure 18: Calibration curve for slurry lime analysis using XRD.
Vll

List ofTables:
Table 1: Reference identifications for lime samples 11 ].
Table 2: Peaks and baselines used for calcium carbonate and silica quantification, using the potassium ferricyanide standard 112].
Table 3: Infrared absorption bands for lime and its derivatives.
Table 4: FTIR absorption band ratio of CaO/Potassium Ferricyanide for four Quicklime field samples.
Table 5: CaO Concentration and FTIR intensity ratio for 878 cm-1/2116 cm-1 absorption bands for four known field samples.
Table 6: FTIR absorption band ratio ofCa(OH)2 (3641 cm-1)/CaO (878 cm-1) for three
slurry lime field samples.
Table 7: Ca(OH)2 Concentration and FTIR intensity ratio for 3641 cm-1 /878cm-1
absorption bands for three known field samples.
Table 8: Comparison of FTIR and XRD concentration measurements. Data sheets for all samples analyzed are given in Appendix C.
VIII

1.0 Background and Significance ofWork
Lime or calcium oxide (CaO) is produced through the calcinations process of lime kiln at high
temperatures. Lime also refers to calcium hydroxide, Ca(OH)2 and magnesium hydroxide,
Mg(OH)z, which are the hydroxides produced from this reaction of the oxide and water. In the
case of calcium oxide, CaO the reaction occurs readily and is highly exothermic. Both Ca(OH)z
and Mg(OH)2 are chemical bases. Lime is an important chemical widely used for neutralization
of acidic solutions as a cheap alkali and has numerous applications in building and construction,
where it can be utilized in masonry cement. In brick-laying applications it is well known that
addition of a small amount of lime to the mortar improves elasticity, workability, and water
retention to the mixture. Lime is produced through heating of limestone (CaC03) at elevated
temperatures ranging froml850 OCto 2450 OC as shown in reaction 1.
CaC03 -t CaO + C02 ( 1)
According to reaction 1, the main source of lime is limestone, which itselfhas a natural source in
some cases from oyster shells [ 1]. Therefore, depending on the purity of the natural source, the
amount of "available lime" varies from one source to another. Nature does create predominantly
limestone deposits composed of predominantly calcium carbonate; however, these locations are
considerably fewer than those of dolomitic limestone (high Calcium limestone). Calcium oxide
will react readily with water at normal temperatures to produce calcium hydroxide and an excess
of heat; this is an exothermic process.
Three common types of lime used in pavement industry include quicklime, hydrated lime, and
slurry lime. Quicklime (CaO) is a powder with the highest available lime (about I 00%) among
the three forms. Hydrated lime (Ca(OH)z) is produced by the hydration of quicklime according
to reaction 2.
CaO + HzO -t Ca(OH)z (2)
Based on reaction 2, it takes 56 lbs of lime and 18 lbs of water to make 74 \bs of hydrated lime.
In its simplest form, 56 lbs of quicklime is equivalent to 74 lbs of hydrated lime. Therefore,
quicklime has 1.32 times more available lime compared to hydrated lime, as it is the molar
weight ratio of Ca(OH)2/ CaO. Slurry lime contains the least amount of available lime, but is

suitable for some applications. Table 1 presents Standard Transportation Commodity Code
(STCC), Chemical Abstract Service (CAS), and the Environmental Protection Agency (EPA)
reference identifications for different lime forms.
Table 1: Reference identifications for lime samples[l ].
Quicklime Hydrated Lime
STCC 32-741-10 32-741-11
CAS# 1305-78-8 1305-62-0 ---
EPA# A350-2789 S349-3522 -- ··-··-·
Chemical Name calcium oxide calcium
hydroxide
Formula CaO Ca(OH)2 ---··-······-······· -~- --
Molecular Wgt 56.08 74.09 ---
Mol. Wg:_ Ratio 1 1.32
1.1 Existing standard methods for lime quantification and their drawbacks
ASTM C25 (American Society for Testing and Materials standard) and A WW A B202
(American Water Works Association) tests are two commonly used standard test procedures for
lime quality control. In these methods, available lime in a given sample is determined by
solubilization of the calcium through the use of a concentrated sugar solution to form calcium
sucrate. The laboratory steps in the two tests are very similar. The sample of quicklime or
hydrated lime is pulverized, weighed, and mixed with a specified amount of water in a flask. The
flask is heated and a specified amount of additional boiling water is added to compensate for
evaporation. The flask is swirled and boiled for a minute, then placed in a cold water bath to cool
it to room temperature. It is noteworthy that the solubility of lime is inversely proportional to
temperature. Sugar is added, and then the flask is swirled and allowed to stand for 15 minutes,
with periodic additional swirling to allow the sugar and lime reaction to take place.
Phenolphthalein solution serving as a pH change indicator is added, and the sample is titrated
until the first disappearance of the pink color that lasts for at least three seconds. The burette is
then read to determine the available calcium oxide percentage (CaO%). Both tests require a
specified sample weight and a specified acid normality such that 1 ml of the volume of acid used
2

equals 1% CaO. This way laboratory personnel simply read the volume of the acid in number of
milliliters used that equates the percentage of available lime in the sample.
Precise knowledge of lime sample weight, incomplete solubility of lime in solution, poor end
point detection in the titration process, prolonged time requirement for the complete analysis,
and sample weight change due to air slaking (described below) are among the drawbacks to these
procedures that warrant the need for development of a rapid and reliable method for lime
quantification.
All forms of quicklime immediately begin to undergo air slaking when exposed to any moisture
in the air [1]. This simply means that the moisture in the air reacts with the quicklime to form
calcium hydroxide. This process occurs all the time, but has its greatest effect when the sample
has been pulverized to a powder. The surface area of the quicklime is increased dramatically,
which increases the rate of air slaking. Weighing the sample to a very specific, designated weight
requires the laboratory personnel to take extra time in weighing at which point air slaking of the
sample is occurring. Depending upon the extra time required, the sample weight can change to
varying degrees. Although modifications to these procedures have been proposed [2], results
obtained in such tests are not error-free due to experimental and chemical interferences in the
titration process. In addition, these test procedures are slow and tedious.
1.2 Application ofFTffi for lime quantification
Fourier Transform Infrared Spectroscopy is a well-established analytical technique used for
analysis of solids, liquids and gases. This technique is routinely used for research and
development, as well as quality control/quality assurance in many industries including
pharmaceutical, paper and pulp, and polymers and plastics. FTIR was primarily developed for
analysis of organic matters based on their chemical bonding characteristics, but more and more,
this technique is finding its applications in the analysis of inorganic matters like oxides, nitrides,
etc. Relatively weaker chemical bonds in organic matters excite easier than stronger bonds
between a metallic element like iron and oxygen; however, chemical bonding in many oxides
including CaO and oxide-hydroxide such as Ca(OH)2 are weak enough to generate a vibration
spectrum that could be used for analytical purposes. The fact that lime and its derivatives
3

produce an interferometer spectrum will be utilized in this project to quantitatively analyze lime
samples.
1.2.1 Working Principle: FTIR involves the twisting, rotating, bending, and vibration of the
chemical bonding (Figure 1 ). Let incident infrared radiation intensity be 10 and I be the intensity
of the beam after it interacts with the sample. The ratio of intensities l/10 as a function of
frequency of light gives a spectrum, which can be in three formats: as transmittance, reflectance,
and absorbance. The multiplicity of vibrations occurring simultaneously produces a highly
complex absorption spectrum, which is a unique characteristic of the functional groups
comprising the molecule, and also the configuration of the atoms. A detector is used to read out
the intensity of light after it interacts with the sample. The typical setup of a FTIR is as shown in
the Figure 2. The author has successfully applied this technique for the identification and
characterization of iron oxides [3-6]. Specifically, magnetite and maghemite that are not
differentiable with popular x-ray diffraction technique were successfully identified by FTIR [5].
Advantages of applying this technique for quantification of lime include:
• Minimal sample preparation • Fast, reliable, and robust analysis • No need of messy chemicals • No spectra interferences • Fully computerized analysis • Ease of operation and minimal operator training and expertise
4

The IR Experiment Stntchiug Yibratiom Atompositions with respectto each other are not fixed!! There are relative movements to eoch other, which can be described by a spring-model. Considering two atoms results in the following model
H-- CI
....:c----a stretching vibration
Energy-uptake can be accomplished by electromagnet radiation
Stretching and Bending Vibrations of three atoms
Asymmetrical stretching
Vas
Symmetrical stretching
Vs
Figure 1: Stretching and bending vibrations of atoms due to absorption of IR radiation.
1. Source of
I
C"·~~ v
6. Spectrum
2. lnterferonneter
(' ; ~ r/'1 I v
I I I
()
D 5. Connputer. FFT
lnterferogrann
4. Detector
Figure 2: Experimental set-up for Fourier Transform Infrared Spectroscopy. (Adaptedfrom Richard Brundle eta!, 1992)
5

2.0 Literature review
T. Arnold et al [7] used FTIR for quantitative determination of lime in hot-mix asphalt. Their
results show hydrated lime exhibited a sharp peak at a wave number of 3640 em·' due to the
presence of the hydroxyl group in Ca(OH)2 (Figure 3.a). They suggested that this sharp peak
could be used to demonstrate the presence and quantify the amount of lime. They assigned a
peak at about 1390 em·' to C-0 stretching that they related to a calcium carbonate impurity. The
presence of calcium carbonate could be explained by reaction 3.
Ca(OH)2 + C02 .- CaC03 + H20 (3)
They clearly showed that the FTIR spectrum of calcium carbonate does not show one peak at
3640 cm-1, but rather shows two peaks: one at 1390cm-1
, and the other at 866 em·' (Figure 3.b).
Their analysis based on the linearity of the relationship between the 3640 cm-1 peak area and the
lime concentration showed a correlation factor, R2, of0.968 and based on peak height yielded an
R2 of 0.977. They did similar analysis for calcium carbonate based on 1390 cm-1 and 866 cm-1
peaks, and obtained an R2 of roughly 0.97, irrespective of the peak used, peak area, or height.
o:n
tl2!r
U.2J ..
0 ; :;_
0 J.) ...
U.IJ"r
(a)
/,. ... ·-·-... . .... ·,. --......-, .. ~-- \ .. --- ...... - -- ~,_ ~ ..... .'
• ' . ~ l • .... • ' ' . 31i£o .:MiD T.Dl )T •' ; nr:o ;.::rr :ox r· ;wn 1aY.J E.Oi ·!JfC, ,fcc · !""(C
~ ... ' ' . . . . - . . .. . .. BXI l(tJ" :U:.'lJ : 200 llJJ
\ \ f ·,'ti iUint• J
(b)
.J
I
i I
.·. I ',
-.-·-:-·---:- ... _--. ... ~ - \ --~ ~---. ~ .................... ,. 1ootl ~7.i.)) :';lQ0 2:DJ ;~ \T..O 1-iTI i _:
~·~·~H11.ifn~l r
fiG(
Figure 3: FTIR spectra of hydrated lime (a) and calcium carbonate (b) [7].
6

The T. Arnold group further suggested that visual examination ofthe FTIR spectrum provides an
instant indication of lime quality. To demonstrate this, they used the existence ofthe peak at
1390 cm-1 to indicate the presence of calcium carbonate impurity as shown in Figure 4. Figure 4
shows a series of superimposed spectra from samples with different carbonate amounts.
•)5-
0 ~-. c
~ i
•1 ~
0.2- ·
il l -
' I , • ~ • ~ I ill) ::£ff1 3«i( l <OC 11))] ~ ff . .O 141X I 2JJ 1 MJJ BDll
Figure 4: Superimposed FTIR spectra of lime-calcium carbonate blends.
Legodi et al [8] recommended FTIR as a rapid analytical tool for quantitative determination of
CaC03 in mixtures containing Ca(OH)2• In their analysis, they integrated carbonate bands
between 2646-2423 cm-1, 1833-782 cm-1
, 954-724 cm-1, and 930-730 cm-1
• They calculated the
fraction of CaC03 present by integrating the bands at various wave numbers relative to the
intensity in the same region of the spectrum of the 100% CaC03 sample. Their results show a
correlation coefficient of 0.993 and 0.987 when they used absorption bands around 2646-2423
cm-1 and 1833-1782 cm-1, respectively. Zaki et al [9] show a spectrum of CaO that displays a
sharp band at 3656 cm-1, two broad weak bands centered around 3822 and 3388 cm-1
, a medium
doublet centered around 1444 cm-1, and a very strong absorption below 600 cm-1
• Figure 5 shows
Zaki ' s IR spectra of CaO, Ca(OH)2, and CaC03. According to Zaki, Figure 5 reveals that all of
the absorptions displayed for CaO are rather similar to those exhibited by the pure CaO and
Ca(OH)2• McDevitt and Baun [10] were quoted by Zaki that there are two IR absorption bands
characteristics of Ca-0 lattice vibrations of pure CaO, a broad, strong absorption band centered
around 400 cm-1, and a medium strong band at 290 cm-1• Zaki further suggested that rehydration
of CaO by means of ambient water molecules converts CaO into Ca(OH)2. Gonzalez et a! [11]
indicated that Calcium oxide has a broad band between 250 and 600 cm-1 corresponding to a
stretching vibration of the Ca-0 group.
7

According to F. Bosch Reig and his colleagues [12], in constant ratio method "the
standard compound must be chemically and spectrally compatible with the sample, in other
words, homogenous, stable sample-standard mixtures must be obtained. Furthermore, the
standard must have a measurable absorbance signal in an area free of absorbance bands from the
sample itself." Table 2 shows peaks and baselines used for calcium carbonate and silica
quantification, using the potassium ferricyanide standard.
Table 2: Peaks and baselines used for calcium carbonate and silica quantification, using the potassium ferricyanide standard 112].
CoJtlpt')Und Peak ''m""' l!.as.e li G:e
hetghr {em ' ) {CI.tl I)
Potassium erricya· f ~ 115 :!082 2163 nid Calcium carbo t me c , S75 72R"'
c2 712 3if' Silica s. 796 83 1 7U9
s 2 779 831 709
a Horizontal base l.irre ta ngem at wavenumber indicued.
In the constant ratio method, the concentration of analyte in the sample is directly
proportional to the analyte/standard absorbances and the concentration of the standard. The
proportionality constant KM.p given in Equation (I) is the characteristic parameter of the system:
(1)
where CM is the concentration of analyte, KM,p(v1,v2) is the proportionality constant, Cp is the
concentration of the internal standard, AM (v1) is the absorbance of the analyte at the
wavenumber v1, and Ap (v2) is the absorbance of internal standard at the wavenumber v2. In this
method, the proportionality constant is determined experimentally. Furthermore, Reig et al.
emphasized the importance of solid inorganic particle size their distribution that must be kept
under control to obtain a reproducible proportionality constant. X-ray diffraction is another
technique used for the quantitative analysis oflime [13-17].
8

4000 3500 3000 2500 20lX) 1500 1000 500 I wavenumblrtcnf1
Figure 5: IR spectra of calcium oxide and calcium hydroxide shown by Zaki et al [9].
Based on available literature information gathered so far, a list of candidate FTIR peaks that
could possibly be used is given in Table 3.
a e : n rare T bl 3 I fi a sorp11on an s or 1me an d b r b d ti r I S erJVa ves. d "t d . ti
Phase FTIR Absorption Band Reference Comments Quicklime 3640 cm-1 7 Sharp peak
(Calcium oxide,CaO) *3656cm-1 **3822 cm-1
' ' 9 *Sharp band,
**3388cm-1, 9 **Broad and Weak
* 1444 cm-1 **<600 cm-1
' 9 *Medium, *v.Strong
*400 cm-1 **290 cm-1
' 10 *Broad & Strong,
250-600 cm-1 11 **Medium-Strong Broad band
Hydrated lime Overlapping bands with 9 (Calcium Hydroxide Quicklime
Ca(OH)2) Calcium Carbonate 1390 cm-1
, 866 cm-1 7 (CaC03) 2646-2423 cm-1,1833-782cm-1
, 8 954-724 cm-1
, 930-730 cm-1
9

The literature search will be conducted to compile a large collection ofFTIR spectra from
different sources for phases of interest including spectra of high purity standards acquired from
reliable sources like NIST etc. This process will identify common sources of impurities and their
FTIR spectra so that peak/band assignment to a given spectrum is done reliably.
3.0 Research Method
The Research Method for this study is experimental. The Nicolet Avatar 3 70 was used to
collect all FTIR spectra and the accompanying E-Z Omnic software was used to analysis the
collected spectra. Experiments were perfonned with the A TR attachment and the standard
transmission setup, it was decided that the standard transmission setup was easier to manage
sample amounts.
Several experiments were performed to identify what factors affected the results ofFTIR
test. Some of the factors that were experimented with were compression strength, sample sizes,
atmosphere exposure, and type of FTIR test (transmission or reflection). Figure 6 shows how the
variation in compression strength affects the FTIR spectra, the variation demonstrates an
inconsistent peak profile. Another factor that was identified from the literature review as a
potential factor was exposure to humidity in the atmosphere. Time trials were performed that
exposed samples to the atmosphere, Figure 7 shows the profiles of samples exposed to the
atmosphere for different amounts oftime. Sample sizes are also important; too much sample in
the pellet could lead to peaks that max out the FTIR scale for absorbance. It was also determined
that transmission is superior to reflectance test for quantitative purposes. With these factors in
mind a protocol was developed which will maximize repeatability, precision, and accuracy. A
complete protocol was developed and is given in Appendix A.
10

Figure 6: Variation in Pressure in Pellet Die. Light Blue-Skpsi; Dark Blue-lOkpsi; Red-15kpsi.
Figure 7: Variation in Atmosphere Exposure. Green-24hrs; Blue-48 hrs; Red-72 hrs.
Using the principle of relative intensity ratios this research developed a method for lime
quantification. The method involves using an internal standard to eliminate variation in peak
11

height from the same sample from run to run. The internal standard that was chosen for this
method was Potassium Ferricyanide. This standard was chosen because of its limited featured
spectra which will not interfere with the peaks that are to be analyzed from the calcium oxide.
Figure 8 shows the spectra of calcium oxide with the standard, notice the only peak that is a
result of the standard is the 2115cm-1 peak.
n ~<:) - -
~
"S
.~ tl ~
. } t.; ...
!! ;; i;l
20 -:;'
, .,.
1U ·
. I
uu:-~---:' ·_-·· . . 'l, .~ " . . . -
Yllol lfll ?'111 :rrf1 l'UI 1llli
Figure 8: Calcium Oxide (3640 peak) and Potassium Ferricyanide (2115 peak).
4.0 Results and Discussions:
4.1 FTIR Analysis of commercial Calcium Oxide:
Figure 9 shows incremental amount of a commercial high purity CaO. With larger concentrations
of CaO the peak height ratio with the internal standard increases. The linear regression used,
generated an R2 value of0.99.
12

CaO Calibration Curve
Figure 9: CaO Calibration Curve.
4.2 FTIR Analysis of Field Quicklime Samples:
Four Quicklime samples with known compositions were provided to researchers and 8 samples
of each quicklime batches were prepared for FTIR transmittance measurements. Results of
characteristics absorption band for CaO (absorption band at 878 cm-1) in reference to absorption
band of Potassium Ferricyanide (2116 cm-1) were measured and results were tabulated in Table
4. Appendix B contains FTIR spectra of all samples analyzed.
Table 4: FTIR absorption band ratio of CaO/Potassium Ferricyanide for four Quicklime field samples.
Quicklime 878/2116
J0o462349 J()6482J98 J()/.181649 107481648
1 0.0259 0.0356 0.0054 0.0084 2 0.0302 0.0368 0.0062 0.0080
3 0.0282 0.0384 0.0050 0.0088
4 0.0273 0.0350 0.0058 0.0081
5 0.0262 0.0372 0.0060 0.0092
6 0.0280 0.0400 0.0064 0.0085
7 0.0230 0.0370 0.0051 0.0080
8 0.0273 0.0355 0.0056 0.0078
AVG 0.02700 0.03694 0.00569 0.00835
STD 0.00210 0.00166 0.00050 0.00047
%STD 8% 4% 9% 6%
Variation in absorption intensities ratios measured for different samples are shown in Table 4.
Sample 10642349, 106482398, 107481649, and 107481648 showed 8,4,9, and 6 perent variations
13

with respect to their standard deviations respectively. Summary of known composition and
measured FTIR intensity ratio for 878 cm-1 /2116 em-] is shown in Table 5.
Table 5: CaO Concentration and FTIR intensity ratio for 878 cm-112116 cm-1 absorption bands for four known field samples.
~--~------------------------~ Quicklime
~.a 11 pic· .... or~r r.,r,Jtl• F"t\ic'
J06482349 88.9% 0.02700 J06482398 89.3% 0.03694
J07481649 58.8% 0.00569
J07481648 52.1% 0.00835
A linear regretion analysis was done based on complete data given in Table 4 and Figure I 0
presents a intensity ratio vs CaO concentration showing an R2 of 0.88. A generalized trend based
on data provided in Table 4 shows R2 of 0.88. Figure 11 shows calibration curve for Quiclime
based on the mathematical model developed and Figure 12 represent variation of Quicklime
concentration for each measurment based on the developed model.
0.045 -
"';" 0.04 --E u co 0.035 ..... ..... ~
0.03 ..... E: u
0.025 co ..... co 0 0.02 0
~ 0.015 0::
FTIR Analysis of Quicklime Samples
y = 0.0007x- 0.0326
R2 = 0.8803
~ 0.01 - ··-· Ill .
~ 0.005 11---·=-----
0 --.----r-r-...,-·-.----.-~---r
._ -I -
50 52 54 56 58 60 62 64 66 68 70 72 7 4 76 78 80 82 84 86 88 90 92
Concentration of CaO
Figure 10: Intensity ratio vs CaO concentration for known field Quicklime samples.
14

Quicklime Calibration Curve 0.05
0.04
0.04
0.03
0 0.03 .... Ill c:: 0.02
0.02
0 .01
0.01
48 .19% 55.59% 63.00% 70.40% 77.81% 85.21 % 92.61% 99.77%
Concentration
Figure 11: Quicklime calibration curve based on the mathematical model.
Quicklime Measured Sample Values 100.00%
90.00%
so.omi c 70.00~10 0 ·.;:; 60.00'/o Ill .... ... 50.0Ql.-f> c. (lJ v 40 .00~{, c. 0
30 .00~-o u
20.00~{,
10.00~{,
I) .00"{.
J064823L9 J05482398 ]07431649 .107481648
Sample
Figure 12: Variations of CaO concentration based on the mathematical model.
4.3 FTIR Analysis of Field Slurry Samples:
Three field slurry samples were received and analyzed usin FTIR. FTIR absorption band
at 3641 cm-1 that is the characteristic band for hydrated and slurry calcium hydroxide was used in
15

reference to absorption band at 878 cm-1• Measured values ofthe absorption band ratios for 8
separate measurements from 8 samples are given in Table 6. Average ratio, standard deviation
and percent standard deviation for these measurements are included in Table 6. Summary of
known composition and measured FTIR intensity ratio for 3641 cm- 1/878 cm-1is shown in Table
7.
Table 6: FTIR absorption band ratio ofCa(OH)2 (3641 cm-1)/CaO (878 cm-1) for three
slurry lime field samples.
Slurry 3641/878
J(!(·AS2 7.:: l llii.4:<:~720 JOb4S2697
1 16.4392 18.2713 21.9898 2 15.2039 15.1377 21.2871
3 14.8921 15.3941 20.4529
4 15.4573 17.4382 21.7584
5 14.2391 18.0112 22.7122
6 16.0205 16.8375 20.1728
7 15.1739 15.9728 21.2834
8 14.7824 14.7639 22.5382
AVG 15.2760 16.4783 21.5244
STD 0.6992 1.3513 0.9102
%STD 5% 8% 4%
Table 7: Ca(OH)2 Concentration and FTIR intensity ratio for 3641 cm-1 /878cm-1
absorption bands for three known field samples. Slurry
Svmple Co nee' ~H rc: ~;r n Rat1o
J06482741 91.4% 15.27605
J06482720 91.6% 16.47834 J06482697 93.6% 21.52435
A linear regretion analysis was done based on complete data given in Table 6 and Figure
13 presents a intensity ratio vs Ca(OH)2 concentration showing an R2 of 0.88. A generalized
trend based on data provided in Table 5 shows R2 of 0.88. Figure 14 shows calibration curve for
slurry lime based on the mathematical model developed and Figure 15 represent variation of
slurry lime concentration for each measurment based on the developed model.
For each of the seven samples that were analyized, eight runs were performed on each.
To be 95% confident of the concentration of any sample within 3% purity it was required to run
16

each sample eight times when developing the calibration curve. TxDOT will be using these
calibration curves primarily for a pass/fail or comparison, for these purposes readings within 3%
of the actual concentration is reasonable. Depending ofthe precission ofthe FTIR machine,
running more samples may narrow the confidence interval. If running more samples does not
narrow the confidence interval, then the FTIR's maximum precission has been reached.
c 10 0 .. "' ... ~ 0 5 1-----------c Cl) ... c
0
91 91 .5
FTIR Analysis of Slurry Lime y = 2.7116x- 232.25
R2 = 0.8799
92 92.5 93 93.5 94
Concentration of Ca(OH)2
Figure 13: Intensity ratio vs Ca(OH)2 concentration for known field slurry lime samples.
17
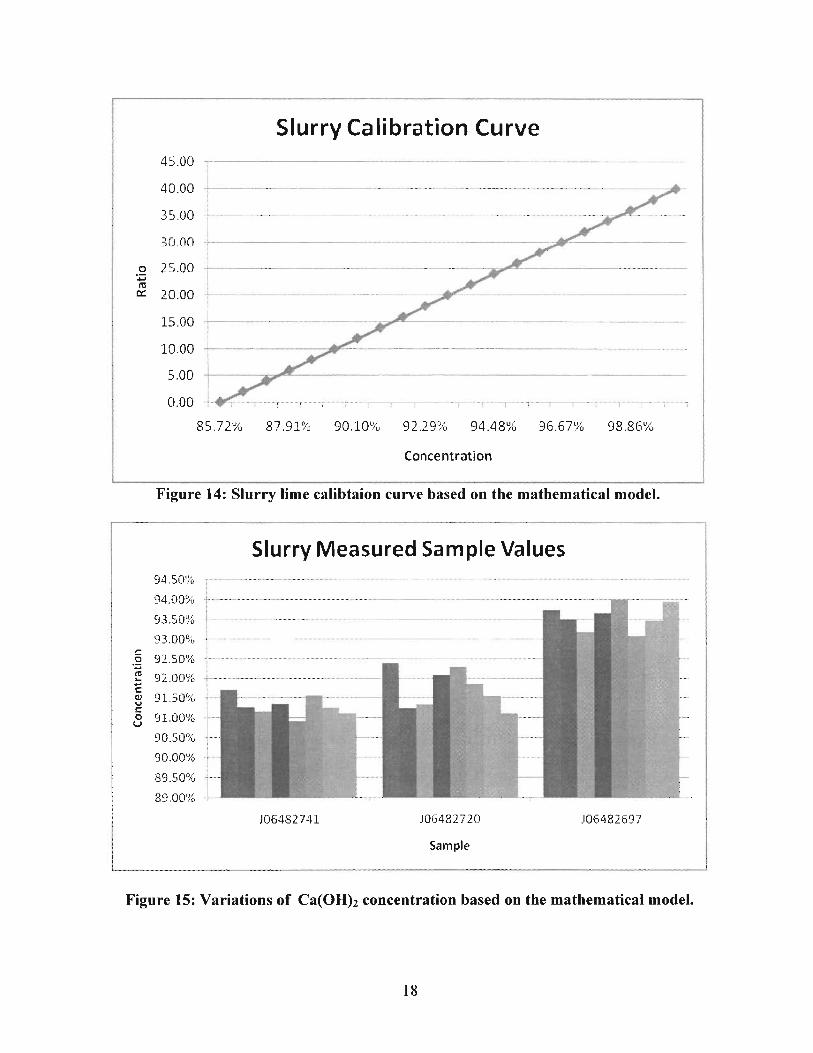
Slurry Calibration Curve 45.00 -··· --------· ··-·-·- -··- ··---
40.00
35.00
:w 00 ;
0 25.00 ·.;:::; ro ;
0::: 20.00 ~--·
15.00
10.00 ------ ----·-···-·-··-·-· ·· ···- ··
5.00
0.00 .--------· -,---- : ·····-, - ·······
85.72'/'o 87.91% 90.10% 92.29% 94.48% 96.67'?0 98.86'/;)
Co nee ntration
Figure 14: Slurry lime calibtaion curve based on the mathematical model.
Slurry Measured Sample Values 94.50%
94.00%
93.50%
93.00% c
92.50% .g ro 92.00% ,_ ..... c: ; w 91.50% v c 0 91.00% u
90.50%
90.00%
89.50%
89.00%
J06482741 J06482720 J06482697
Sample
Figure 15: Variations of Ca(OH)2 concentration based on the mathematical model.
18

4.4 X-ray Diffraction Analysis:
Experiments were also conducted using Raguku Ultra III with CuKa (A-=1.54 A) X-Ray
Diffraction (XRD) system. Experimental parameters used to run the XRD experiments are as
follows: start angle (28) = I 0 degrees; end angle (28) = 90 degrees; scan rate 2 degrees per
minute; step size 0.05 degrees. Figure 16 shows detected diffracted peaks that were identified in
a typical XRD pattern for a lime sample.
A similar calibration curve was developed using the peak height ratio of calcium oxide
and magnesium oxide, although the correlation factors were not nearly as high as the FTIR
correlation factors. The highest R2 value that was obtained from XRD regressions is 0.76.
Figures 17 and 18 show calibration curves developed based on XRD analysis for quicklime and
slurry lime samples respectively. The R2 value for the quicklime XRD data was 0.928. The R2
value for the slurry XRD data was 0.763. A side by side comparison of the concentrations
obtained from FTIR and XRD is given in Table 8.
r·--· -- -;:-~-~----~~=-=----· ::-----
! 900 ·-------
800
700 .j . i
60{1 :
500 t ----------
i 400 +-- -300 +- --- -200 , ------.
100 ----...... _.., 0
10 2.5
---------.. : --~--~=~--·/
(220)
(lll) -
(311)
(400) {331\
.}{} 55 70 85 !
Angle _j
Figure 16: XRD pattern of a typical lime sample with identified CaO diffraction peaks.
19

Quicklime XRD Calibration Curve 0.211 T
.................. ,,,_ , ..•.......
0.21
0.209
0.208 ...........
0.207 0 :;; 0 .206 l1l 0::
0.205
0 .204
0.203
0 .202
8.07% 22.48% 36.90% 51.32'7~. 65.74% 80.15% 94.57%
L_ Concentration
-------Figure 17: Calibration curve for Quicklime analysis using XRD.
1 -
0.9 -
0.8
Slurry XRD Calibration Curve
0.7 ············--··· - -···-
0.6 -- ·····-···--·
0.5 -.-- .............. ......... . ....................... --~~
0.4 -
0.3 ··--- ..
0. 2 .. - .... -................. - ............... .
0.1 ----···
0 -·-.. .. ................. '!" ..
44.49% 50.61% 56.73% 62.84% 68.96% 75 .08% 81.20% 87.32% 93 .43% 99.55%
Figure 18: Calibration curve for slurry lime analysis using XRD.
20

Table 8: Comparison of FTIR and XRD concentration measurements. Data sheets for all samples analyzed are given in Appendix C.
Titration FTIR XRD
Sample Concentration
J06482349 88.9% 88.91% 87.32%
J06482398 89.3% 89.30% 92.45%
J07481649 58.8% 58.77% 62.94%
J07481648 52.1% 52.05% 49.97%
J06482741 91.4% 91.40% 88.62%
J06482720 91.6% 91.60% 93.74%
J06482697 93.6% 93.60% 90.13%
5.0 Summary:
The goal of this study was to develop a protocol for the quantification of lime samples using an
FTIR system. In the new procedure minimal sample preparation, minimal uses of chemicals, and
adequate accuracy have been achieved. Using the FTIR quantification method developed in this
research lime sample concentrations can be quickly and accurately determined.
5.1 Recommendations:
FTIR has been proven to accurately classify different grades of lime. It is the
recommendation of the project to integrate this new quantification method into TXDOT's quality
assurance program. Although the results obtained from XRD are not as strong as FTIR
regressions, this project's results as a whole support the use ofFTIR. To ensure a smooth
transition from the old titration method to the new FTIR method it is highly recommended that
this technique be integrated and that all additional tests be used to fine-tune the results obtained
thus far. It is also recommended that when using the FTIR method the instructions developed in
21

this research should be followed precisely. As noted in the user manual all measurements should
be highly precise and all instruments should be properly calibrated.
6.0 References:
I. http://www .cheneylime.com/history .htm
2. J.H. Potgieter, S.S. Potgieter, and B. Legodi, "Proposed Modifications to the Method for the Determination of Available Lime," Materials Engineering, vol. 14, No. 5, pp. 515-523, 2001.
3. S. Nasrazadani and H. Namduri, "Study of Phase Transformation in Iron Oxides Using Laser Induced Breakdown Spectroscopy (LIBS), , Spectrochimica Acta, Part B 61 (2006) 565-571.
4. S. Nasrazadani, "Application of IR Spectroscopy for Study of Phosphoric and Tannic Acids Interactions with Magnetite, Goethite, and Lepidocrocite," Corrosion Science, Vol.39,No.IO-Il,pp.1845-1859, 1997.
5. S. Nasrazadani and A. Raman, "The Application of Infrared Spectroscopy to the Study of Rust Systems," Corrosion Science, Vol 34, No.8, pp. 1355-1365, 1993.
6. J. Stevens, R. Theimer, S. Nasrazadani, and H. Namduri "Secondary System Oxide and Lead Study at Comanche Peak", Proceeding oflnternational Conference on Water Chemistry ofNuclear Reactor Systems, Jeju Island South Koria, October 2006.
7. T. Arnold, M. Rozario-Ranasinghe, and J. Youtcheff, "Determination of Lime in HotMix Asphalt", Transportation Research Record 1962 pp. 113-120, 2006.
8. M.A. Legodi, D. de Waa1, J.H. Potgieter, and S.S. Potgieter, "Rapid Determination of CaC03 in Mixtures Utilizing FTIR Spectroscopy", Mineral Engineering Vol. 14, No.9, pp. 1107-1111, 2001.
9. M.l. Zaki, H. Knozinger, B. Tesche, G. A.H. Mekhemer, "Influence ofPhosphonation and Phosphation on Surface Acid-Base and Morphological Properties ofCaO as Investigated by in situ FTIR Spectroscopy and Electron Microscopy", Journal of Colloid and Interface Science, Yo. 303, pp. 9-17,2006.
10. N. T. McDevitt and W. L. Baun, Spectrochim. Acta, Vol. 20, p. 799, 1964.
II. M. Gonzalez, E. Hernandez, J. A. Ascencio, F. Pacheco, S. Pacheco, and R. Rodriguez, "Hydroxyapatite Crystals Grown on a Cellulose Matrix Using Titanium Alkoxide as a Coupling Agent," Journal of Materials Chemistry, Vol. 13, pp. 2948-2951 , 2003.
22

12. F. Bosch Reig, 1. V. Gimeno Adelantado, and M. C. M. Maya Moreno, "FTIR Quantitative Analysis of Calcium Carbonate (Calcite) and Silica (Quarts) Mixtures Using the Constant ratio Method," Talenta, Vol. 58, pp. 811-821, 2002.
13. V. Nikulshina, M. F. Galvez, and A. Steinfeld, "Kinetic Analysis ofthe Carbonation Reactions for the Capture of C02 from Air via the Ca(OH)2-CaC03-CaO Solar Thermochemical Cycle," Chemical Engineering Journal, Vol. 129, pp. 75-83, 2007.
14. S. Dash, M. Kamriddin, P. K. Ajikumar, A. K. Tyagi, and Baldev Raj, "Nanocrystalline and Metastable Phase Formation in Vacuum Thermal Decomposition of Calcium Carbonate," Thermochimica Acta, Vol. 363, pp. 129-135, 2000.
15. Said S. Al-Jaroudi, Anwar UI-Hamid, Abdul-Rashid I. Mohammed, and Salih Saner, "Use of X-ray Powder Diffraction for Quantitative Analysis of Carbonate Rock Reservoir samples," Powder Technology, Vol. 175, pp. 115-121,2007.
16. A.F. Gualtieri, A. Viani, and C. Montanari, "Quantitative Phase Analysis of Hydraulic Limes Using the Rietveld Method," Cement and Concrete Research, Vol. 36, pp. 401-406,2006.
17. S. Mahadevan, G. Gnanaparkash, 1. Philip, B. P. C. Rao, and T. Jayakumar, "X-ray Diffraction-Based Characterization of Magnetite Nanoparticles in Presence of Goethite and Correlation with Magnetic Properties," Physica E, Vol. 39, pp. 20-25, 2007.
23

Appendix A: Protocol
Application of FTIR for Quantitative Lime Analysis Testing Procedure
SCOPE
This test method is used to determine the percent concentration of Lime (CaO).
Lime is a compound that is infrared active. By using infrared spectrum of Lime
sample and the given calibration curve the concentration of Lime in a given
sample can be determined.
This test method implies that the equipment used for the analysis is operated by
experienced personnel according to the manufacturer ' s directions for optimum
performance. A thorough understanding of infrared spectral analysis is
recommended.
This method involves hazardous material, operations, or equipment. This standard
does not purport to address all of the safety concerns associated with its use. It is
the responsibility of the user of this method to establish appropriate safety and
health practices and determine the applicability of regulatory limitations prior to
use.
Part I, Sampling Lime Products (Content of part I is completely adopted from TXDOT website:
ftp:l/ftp.dot.state.tx.us/pub/txdot-info/cst/TMS/600-J series/pdf/cbm600.pdf)
This part covers the sampling of lime in powdered form as:
+ Bulk Hydrate, discharged from tank trucks.
+ Hydrated Lime, as bagged hydrate from bag trucks being loaded, or from bagged shipments
after delivery to warehouse or job site.
+ Quicklime in crushed or pebble form, discharged from tank trucks.
+Commercial Lime Slurry, a mixture of hydrated lime solids in water, from sampling port at
the plant site or in the distributor truck.
Apparatus
The following apparatus is required:
Bulk Hydrate
24

+ paint brush, 51 mm (2 in.) wide
+ 4 L ( 1 gal.) bucket with double friction type lid and bail
+top hatch sampling device consisting of a 2.8 m (9ft.) length of 38 mm ( 1.5 in.) IPS
PVC 1120 plastic pipe ofSDR 1.10 MPa (26,160 psi), to meet ASTM D 2241-94,
"Specification for Poly (Vinyl Chloride) (PVC) Pressure-Rated Pipe (SDR Series)."
• This pipe is fitted at one end with a rubber stopper drilled with a 6.4 mm (0.25 in.)
diameter hole.
• The stopper may be cemented in place, using a standard adhesive epoxy.
• A 76 mm x 51 mm (3 in. x 2 in.) half-round plate of 12-gauge steel, to which a hook is
spot-welded, should be riveted and cemented with epoxy to the rubber stopper
end of the pipe.
• The 76 mm (3 in.) long metal hook should be 13 mm x 19 mm (0.5 in. x 0.75 in.),
doubled over section, with a 6.4 mm (0.25 in.) slot.
• The opening of the hook should face away from the rubber stopper.
• The hook will catch the bucket bail, so the bucket and pipe can be lowered to the
ground. This allows the sampler to alight from the truck safely.
+bottom sampling tube consisting of two concentric plastic pipes:
• The outer pipe is a 3.2 m (115 in.) long, 38 mm (1.5 in.) inside diameter IPS PVC
plastic pipe fitted at one end with a tip made from a 191 mm (7.5 in.) length of
solid aluminum round stock 41 mm (1 5/8 in.) in diameter tapered to a point along
165 mm (6.5 in.) of its length, inserted 25 mm (1 in.) into the tube and fastened
with two screws through the wall of the pipe into tapped holes on either side of
the tip.
• The point of the tip should be rounded to a 13 mm (0.5 in.) diameter point for safety.
• An adhesive epoxy may be used to mold an epoxy tip in a metal, foil or cardboard
mold.
• The inner pipe is a 32 mm (1.25 in.) IPS PVC plastic pipe 3.0 m (10ft.) long.
• Slip this pipe inside the outer pipe. It will extend beyond the outer pipe at the upper
end, forming a handle to allow the sampler to rotate the inner tube within the
outer tube.
• Cut a 32 mm (1.25 in.) wide by 305 mm (12 in.) long sampling port through both
25

pipes 38 mm (1.5 in.) from the lower, plugged, end.
• Create index marks on the outside of the outer and inner pipes at the upper end
labeled "open" and "closed," to indicate the relative position ofthe opening in the
inner pipe to that of the outer.
Bagged Lime
+ paint brush, 51 mm (2 in.) wide
+ 4 L ( 1 gal.) bucket with double friction type 1 id and bail
+bag sampling tube made from 19 mm (0.75 in.) diameter steel electrical conduit 1m (3ft.)
long. The opening at one end shall be tapered with a I 02 mm ( 4 in.) diagonal cut.
Quicklime
+ safety goggles
+ respirator
+ rubber gloves
+ paint brush, 51 mm (2 in.) wide
+ 4 L (I gal.) bucket with double friction type lid and bail
+ device designed to hold a sample bucket between the wheel path of a bulk transport
discharging quicklime without allowing the bucket to tum over, but permitting safe,
easy removal of the container from the windrow with the sample intact. One suggested
design:
• From 19 mm (0. 75 in.) plywood, cut three pieces, one 457 mm (18 in.) square,
another 356 mm (14 in.) square and the third 254 mm (10 in.) square.
• Cut holes to closely fit the 4 L (1 gal.) sample bucket in the centers of the smaller
two plywood squares.
• Center the 254 mm (10 in.) board on the 356 mm (14 in.) board and fasten them
together.
• Center these two on top ofthe 457 mm (18 in.) board and fastened together.
• To a comer of this unit fasten a 2.4 m (8ft.) length of 3.2 mm ( 118 in.) diameter
flexible steel cable.
• To the other end ofthe cable attach a 254 mm (10 in.) length of steel conduit or wooden
dowel as a "T" handle, used to slide the filled bucket from wind-rowed quicklime.
+plastic sample bag 457 mm x 241 mm (18 in. x 9.5 in.)
26

Commercial Lime Slurry
+ safety goggles
+ 2 L (112 gal.) large-mouth (89 mm [3.5 in.] diameter) polyethylene bottle and a
polypropylene or phenolic screw cap- Nalge Company No. 2234-0020
+plastic electrical tape, PVC 19 mm (0.75 in.) wide
+ cloth rag or shop towel.
Sampling Procedures
+ Hydrated Lime
• from loaded tank trucks
CA UT/ON: These trucks are pressurized for unloading, and attempts to open a pressurized
top hatch could be fatal. Therefore, the contractor should make the load available for
sampling prior to pressurization, with top hatches open. If the truck is offered for
sampling pressurized, it shall be the responsibility of the contractor to bleed off the
pressure and open the top hatches.
The following describes the sampling procedure for hydrated lime in powdered form as bulk
hydrate.
Sampling Hydrated Lime from Loaded Tank Trucks
Step Action
1 Collect a 2 L (112 gal.) sample for analysis. To avoid contamination by moisture or other
materials, take samples from the truck prior to unloading.
CAUTION: These trucks are pressurized for unloading, and attempts to open a
pressurized top hatch could be fatal. Therefore, the contractor should make the load
available for sampling prior to pressurization, with top hatches open. If the truck is
offered for sampling pressurized, it shall be the responsibility of the contractor to
bleed off the pressure and open the top hatches.
2 The preferred sampling method is rodding material from the top of the truck through open
hatches.
3 If the material in the truck cannot be sampled prior to unloading, then various optional
sampling methods may be used, provided the sample is representative, and is not allowed
27

to become contaminated by moisture or mixing with base or other road material. Less
desirable methods include:
+ scoop samples obtained through open top hatches
+ as discharged from tank trucks
+ hose discharge
+dry application "catch-pan" method.
4 Do not scoop samples from material applied on roadway due to likelihood of
contamination. Bulk hydrated lime should be sampled at the rate of one sample per
181.44 Mg (200 tons), unless otherwise directed. This represents roughly one trailer of
every ten shipped. The trailer to be sampled should be selected at random and identified
on the sample ticket by seal number, name of producer and date sampled. The seal
numbers ofthe other nine loads need not be listed. Samples shall not be combined. Lime
becomes contaminated by exposure to the atmosphere. To preserve the quality of
samples, use the paintbrush to clear the sample bucket rim of lime collected during
sampling, so an effective seal is obtained. Two bulk samplers are listed. The top hatch
device samples the upper portion of the load through the top hatches of a bulk transport.
The unit is inserted with the air hole in the rubber stopper open. When withdrawing the
tube, hold the hole shut with a thumb. The bottom sampler is designed to obtain bottom
samples, but may be used to take samples at various levels within the truck, or for other
sampling tasks. The device is inserted at the sampling level desired with its port closed.
Then the port is opened, the tube is slid back and forth, the port is closed, and the tube is
removed. Lime is released from the tube by tapping the device and allowing the lime to
exit from the top end into a sample bucket.
• from bag trucks
The following procedure describes sampling for hydrated lime in powdered form as bagged
hydrate from bag trucks being loaded.
Sampling Hydrated Lime from Bag Trucks
Step Action
I Sample at least six sacks to represent each truck being shipped.
2 Sample at least four to six sacks from each lot being inspected and combine the material
28

to form a composite sample representing that lot.
3 Samples may be taken from the separate lots that comprise the whole ifthe entire lot
consigned for an individual truck is from several different warehouse lots.
4 Insert the bag sampling tube through the sack loading spout and take sufficient
diagonal roddings to insure a representative portion from each sack, without
significantly reducing the volume.
+Take care not to puncture the sack with the sampling tube.
• from bagged shipments after delivery to warehouse or job site
The following procedure describes the sampling of hydrated lime in powdered form as
bagged hydrate from warehouse or job site.
Sampling Hydrated Lime from Bagged Shipments after Delivery to Warehouse or Job Site
Step Action
1 Use the bag sampling tube described in the equipment list to obtain a 2 L ( 112 gal.)
sample from at least six sacks of material.
2 Select sacks for sampling from various points in the load or shipment, to collect a
representative sample.
3 + Insert the bag sampling tube through the sack loading spout and take sufficient
diagonal roddings to insure a representative portion from each sack, without
materially reducing the poundage.
+Take care not to puncture the bottom or sides of the sack with the sampling tube.
+ Quicklime in Crushed or Pebble Form
CA UTJON: Quicklime is extremely hazardous and capable of inflicting severe caustic bums
to skin, lung damage, and/or eye injury and blindness, if handled improperly. Personnel
handling, sampling or testing quicklime should wear proper protective clothing,
respirators, dust-proof goggles and waterproof gloves.
• discharged from tank trucks
The following procedure describes sampling of quicklime in crushed or pebble form as
discharged from tank trucks.
29

Sampling Quicklime (in Crushed or Pebble Form) as Discharged from Tank Trucks
Step Action
1 Instruct the truck to pass over a collection device while unloading.
CAUTION: Quicklime generates fines in transit. Since air-blown quicklime fines are
hazardous, quicklime is usually unloaded at the job site by gravity feed through ports at
the bottom of each compartment on the truck. Most trucks will be equipped with 3 or 4
such compartments, which are usually opened to discharge simultaneously.
2 Collect samples from the midpoint ofthe unloading of the truck.
NOTE: Specifications limit the amount of fines in the sample and include sizing
requirements. The sizing and gradation ofthe sample taken shall be representative of
the load. Quicklime fines tend to settle to the bottom of the compartments and the
initial discharge usually contains a higher percentage than the remainder of the load.
The top ofthe load tends to contain the coarsest material. The center of the discharge
run represents the entire load.
3 + The sampler should pick up the collection device and carefully transfer the entire
sample to a plastic sample bag.
+ Close and seal the bag with tape or rubber band and place in a sample bucket for
transport.
+The bucket should be marked "caustic" and "quicklime."
4 Ship samples by motor freight only.
NOTE: Do not ship by bus, parcel post, air, or rail. This is hazardous material, which, upon
contact with water and combustibles, can cause fires. For this and other safety-related
reasons, the carriers listed have refused to accept the material for shipment.
• from tank trucks
The following procedure describes the sampling of quicklime in crushed or pebble form
from tank trucks.
Sampling Quicklime (in Crushed or Pebble Form) from Tank Truck
Step Action
+Collect samples from the top of the trucks.
30

+Dig below the surface of the pebble quicklime at least 203 mm (8 in.) and dip a
sample with a 4 L ( l gal.) bucket.
Sampling Quicklime (in Crushed or Pebble Form) from Tank Truck
Step Action
+A sample should be a minimum of 3 L (3/4 gal.).
2 + Carefully transfer the entire sample to a plastic sample bag.
+ Close and seal the bag with tape or rubber band and place in a sample bucket for
transport.
+The bucket should be marked "caustic" and "quicklime."
3 Ship samples by motor freight only.
NOTE: Do not ship by bus, parcel post, air, or rail. This is hazardous material, which,
upon contact with water and combustibles, can cause fires. For this and other safety related
reasons, the carriers listed have refused to accept the material for shipment.
+ Commercial Lime Slurry
• from the truck
The following procedure describes the sampling of commercial lime slurry from the truck.
Sampling Commercial Lime Slurry from the Truck
Step Action
I. Draw the sample from the permanent sampling port located concentrically at the rear of the
truck.
NOTE: The sampling port shall consist of a 13 mm (0.5 in.) minimum, quick acting valve fitted
to a 19 mm (0.75 in .) diameter pipe and outlet spout.
2. Open the sampling valve quickly and completely during sampling.
3. Half fill the plastic sample jug, to permit agitation and testing.
4. Tightly seal the jug and tape the cap to avoid leakage during transport.
NOTE: The sampling, capping and sealing of the slurry sample shall be the sole responsibility of
the truck driver by direct request from a TxDOT representative.
• from the plant
31

The following procedure describes the sampling of commercial lime slurry from the plant.
Sampling Commercial Lime Slurry from the Plant
Step Action
1 Collect sample from the sampling valve in the vertical riser from the slurry tank to the
loading spout.
2 Observe the same consistency and sampling precautions as outlined above, in
'Sampling Commercial Lime Slurry from the Truck.'
3 Take a sample ( 1 per truckload) to represent a truckload.
4 Sampling must be witnessed by a TxDOT representative.
32

2.1.0
2.1 .1
2.1 .2
2.1.3
2.1.4
2.1.5
2.1.6
2.1.7
2.1.8
2.1.9
2.1.1 0
2.1.11
2.1.12
2.2.0
2.2.1
Part II, Testing Slurry & Hydrated Lime
APPARATUS
Digital Scale (precision >0.1 mg)
Hydraulic Press Capable of > 12 ksi
13 mm Pellet Die Set with Vacuum Attachment
Vacuum Pump with a Compatible Pellet Die Connection
Pestle and Mortar Set
Tweezers
Weighting Papers
Desiccator
Spatula
Fourier Transform Infrared Spectrometer (capable of recording spectrum between
400-4000 em· '
IR Grade Potassium Bromide
Reagent Grade Potassium Ferricyanide
PREPARATION OF SAMPLES
About 20 mg of slurry should be placed into a desiccator to allow for drying for
25 minutes. For Hydrated Lime in solid form skip this step and continue with the
step 2.2.2.
2.2.2 Prepare a mixture of2 mg of sample, 2 mg of Potassium Ferricyanide, and 100
mg of Potassium Bromide.
33

2.2.3 Grind the mixture for approximately 3 minutes with a pestle in a mortar, so that
the mixture is a uniform fme powder. It is highly recommended that the pestle and
mortar set be kept in an oven when not in use to keep moisture from
accumulating. It is also important that the set is at room temperature when used.
2.2.4 Then deposit the mixture in a 13 mm pellet die. By hand lightly tap the die to
spread the mixture as evenly as possible across the bottom anvil, then insert the
plunger and slowly rotate it 1-1.5 turns making sure not to apply pressure. Then
remove plunger and proceed with the top anvil and compress with the plunger.
Compress the mixture with 12 ksi for 4 minutes under vacuum. As with the
grinding set the die should be kept in an oven when not in use, but should be
allowed to cool to room temperature before use.
2.2.5 Carefully remove the pellet from the die with tweezers and place the pellet in the
spectrometer's sample holder or an IR pellet sample holder card. Often the sample
is not fully uniformly compressed, so white spots may appear, in which case
avoid placing the white spot in the center of the holder window. Ifthe sample is
composed predominantly of the white spots preparation of another sample is
recommended.
2.3.0 TESTING PARAMETERS
2.3.1 KBr Beam Splitter FTIR
2.3.2 Collection of spectrum from 4000-400 em-•
2.3.3 Transmission Mode
2.3.4 32 Scans
2.3.5 Resolution of2 em-•
2.3.6 Gain 1.0
2.3. 7 Aperture 100
2.3.8 Mirror Velocity at 0.6329
2.4.0 TESTING PROCEDURE
34

2.4.1 With the above testing parameters run the FTIR scan, it is recommended that the
background be measured before taking the measurement. Figure 1 is an example
ofwhat the spectra ofLime should look like.
2.4.2 Use the standard baseline subtraction tool to eliminate tilt of the baseline. When
the baseline is severely tilted the most likely cause is that the mixture was not
ground finely enough, in that case the pellet should be remade and retested.
- I •'-- __,---/ I~ ltul . I
Figure 1: Typical Lime Spectra
2.5.0 ANALYSIS
2.5.1 Zoom in so that the peaks that are to be measured can be viewed clearly, but are
not large to hinder baseline point identification. Use the peak height measurement
tool to calculate the peak height of interest:
• 3640 peak
• 878 peak
2.5.2 Calculate the ratio of the two peak heights: • Slurry Ratio=Height of 3640 peak/Height of 878 peak
2.5.3 Using the calibration curve and the intensity ratio determine the concentration of
lime (Figure 2).
35

Slurry Calibration Curve '15 00
!lO 00
35 00
3000
c ) c; ()() ·.o:;
"' IX 2000
lS 00
1 () ()(]
5.00
0 .00
85 .72% 87.91 o/c 90.10'% S2.29:-c. 94.48Yo 96 67'!{, 98.86%
Concentration
Figure 2: Slurry Calibration Curve
Part III, Testing Quicklime
3.1.0 APPARATUS
3.1.1 Digital Scale (precision >0.1 mg)
3.1.2 Hydraulic Press Capable of > 12 ksi
3 .1.3 13 mm Pellet Die Set with Vacuum Attachment
3.1.4 Vacuum Pump with a Compatible Pellet Die Connection
3.1.5 Pestle and Mortar Set
3.1.6 Tweezers
3 .1. 7 Weighting Papers
3.1.8 Desiccator
3.1.9 Spatula
36

3.1.10
3.1.11
3.1.12
3.2.0
3.2.1
Fourier Transform Infrared Spectrometer( capable of recording spectrum between
400-4000 cm-1
IR Grade Potassium Bromide
Reagent Grade Potassium Ferricyanide
PREPARATION OF SAMPLES
Prepare a mixture of2 mg of sample, 2 mg of Potassium Ferricyanide, and 100
mg of Potassium Bromide.
3.2.2 Grind the mixture for approximately 3 minutes with a pestle in a mortar, so that
the mixture is a uniform fine powder. It is highly recommended that the pestle and
mortar set be kept in an oven when not in use to keep moisture from
accumulating. It is also important that the set is at room temperature when used.
3.2.3 Then deposit the mixture in a 13 mm pellet die. By hand lightly tap the die to
spread the mixture as evenly as possible across the bottom anvil, then insert the
plunger and slowly rotate it 1-1.5 turns making sure not to apply pressure. Then
remove plunger and proceed with the top anvil and compress with the plunger.
Compress the mixture with 12 ksi for 4 minutes under vacuum. As with the
grinding set the die should be kept in an oven when not in use, but should be
allowed to cool to room temperature before use.
3 .2.4 Carefully remove the pellet from the die with tweezers and place the pellet in the
spectrometer's sample holder or an IR pellet sample holder card. Often the sample
is not fully uniformly compressed, so white spots may appear, in which case
avoid placing the white spot in the center of the holder window. If the sample is
composed predominantly of the white spots preparation of another sample is
recommended.
3.3.0 TESTING PARAMETERS
3.3.1 KBr Beam Splitter FTIR
3.3.2 Collection of spectrum from 4000-400 cm-1
37

3.3.3 Transmission Mode
3.3.4 32 Scans
3.3.5 Resolution of2 cm-1
3.3.6 Gain 1.0
3.3.7 Aperture I 00
3.3.8 Mirror Velocity at 0.6329
3.4.0 TESTING PROCEDURE
3.4.1 With the above testing parameters run the FTIR scan, it is recommended that the
background be measured before taking the measurement. Figure 1 is an example
of what the spectra ofLime should look like.
•(!.
.t-"' __ _
f) {; _...#"_; \ , --- - - -. -.- ... . . --~- - . .. / ~ ..• _ .•.. ; ~- ..... :llJJ IIJ..TJ nm
Figure 1: Typical Lime Spectra 3.4.2 Use the standard baseline subtraction tool to eliminate tilt of the baseline. When
the baseline is severely tilted the most likely cause is that the mixture was not
ground finely enough, in that case the pellet should be remade and retested.
38

3.5.0 ANALYSIS
3.5.1 Zoom in so that the peaks that are to be measured can be viewed clearly, but are
not large to hinder baseline point identification. Use the peak height measurement
tool to calculate the peak height of interest:
• 2115 peak • 878 peak
3.5.2 Calculate the ratio of the two peak heights: • Quicklime Ratio=Height of878 peak/Height of2116 peak
3.5.3 Using the calibration curve and the intensity ratio determine the concentration of
lime (Figure 3).
Quicklime Calibration Curve 0.05
0.04
0.04 ···--
' 0.03 .\
.!2 0.03 I - --- -~
ro i a: 002 l-""
0.02 ~---
0.01 ~ .
001 1--X7"''"------__________ _ 0.00 T ' ....................... ~---~ ··············-~·
48.1 9% 55.59% 6300% 70.40% 77.81% 85.21% 92.61% 99.77%
Concentration
Figure 3: Quicklime Calibration Curve
39

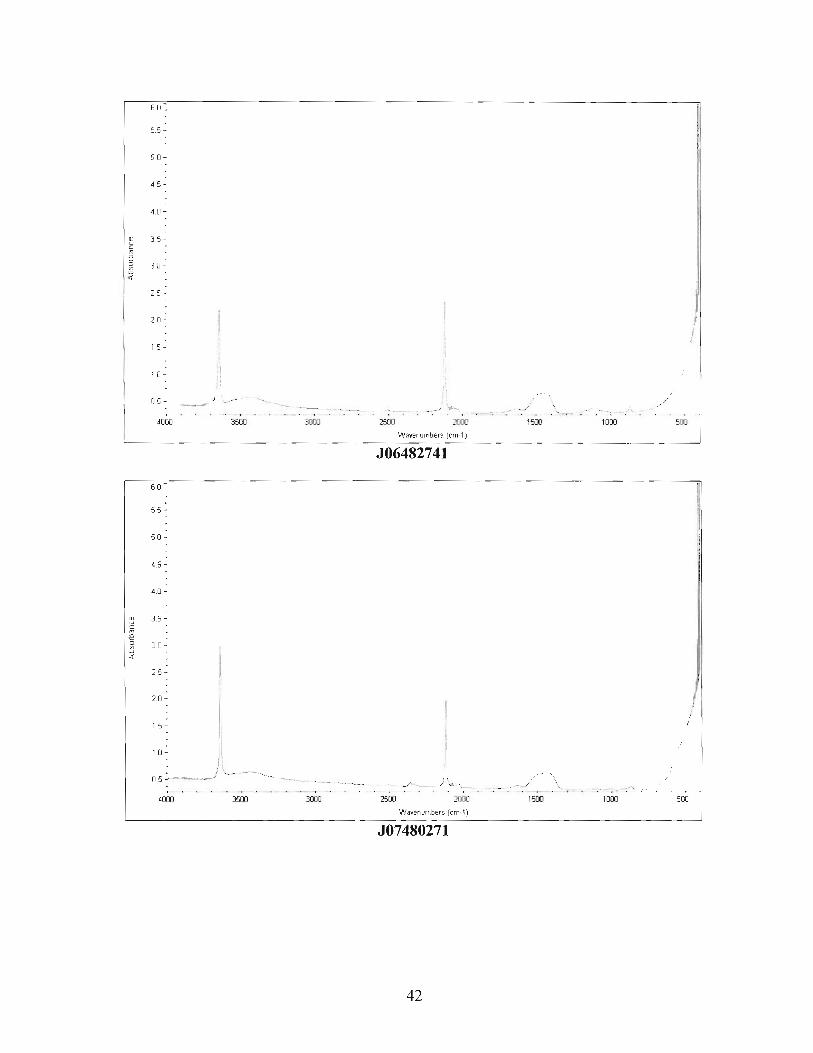
Appendix B: FTIR spectra of all samples
50~
55 -
50 -
4 5 -
40-
35-
3.0-
25-
2 0 -
15 -
I 0 -
0.5 -._ ,, .. •'' ,. 4000 3500 3000 2500 2Lm 15CHJ 1000 500
Wavenumbers (cm-1)
J06482349
2 4.:
2.0 ~
18 : I
1 2 ~
> -· / '··: -- . I
. ···~ \. ...
4000 3500 1500 1000 500
w a..-enumbers (cm-1)
J06482398
40

2.4 -
2.2 ~
2.0 ~
1 8~
1 6 -
1.4 -
1.2 -
1.0 -
0.8 - ;
0.6 .. l
400J 3500
2.8:
2.6 ~
24l
2.2 ~
20~
1.8 :
1.6 ~
1.4 ~
I: u :
1 0: p
08 ~
·----400J 350J
2500 l(IOJ
Wavenumbers (cm-1)
J06482697
250J
Wavenumbers (cm-1)
J06482720
41
/ / /\, ..--r
/ I
i I
/
I )
50J
J
50J
60
5.5-
50-
4.5 -
4.0 -
3.5 -
3 0 -
25-
2.0-
I. I
1 5 -
10 -
} ~ 0 5 ~- ·- -- - ....-·; \ ....
4000 3500 3000
~ ·-;- : --.
\.Va11enumbers (cm-1)
J06482741
- _/""--.._ ; · . ..~. ··-251)) :>OOJ
Wavenumbers (cm-1)
J07480271
42
1000
. -.,./ \
151)) 1000
5I))
500
I i
/

60~
5.5-
50-
4 5-
40-
3.5-
3.0-
2.5-
2.0-
15-
1. 10- I; 05~ _____ ;
4[0)
3.2 ~
28~
2.6 ~
24~
22~
2.0 ~
16 ~
1 4 ~
10:
0.6-: i :-----~
04-:
4000
i ;
3500
3500
3000 2500 200J
wa ... enumbers (cm-1)
J07480295
·· ·---. .. __
3000
Wavenumbers (cm-1)
J07480356
43
/ .- ---:--·
1500 1000
T -~.:_;""::_-:----- •
1500 1000
i
/ ......... ~--- ,./
)
500
' I

3.2-:
30~
2.8 _:
2.5 ~
2.4 ~
20-:
18:
16:
I 4 ~
I 0 ~
os-:
06: - -----~ ...
04:
4000
6 0 .
5.5-
50-
4 5-
40-
3.5-
3.0-
2.5-
20-
1.5-
I 0-
05-
4000
\
3500
2500 2000
Wave numbers (ern- I)
J07480357
I;
31lJU 2500 200J
\)'/ave numbers (cm-1)
J07481648
44
-. 1500 1000
I ·I
'-\
1500 1000
500
( I I ··'
500
I I

2.4-
2.2 ~
2.0 ~
1 8 -
1.6-
1.4 -
1 2 ~
i
1 0~
\:_r, r•: \ , . 0.8-
0.4 ~
4(((1 3500
5.5 -
5.0-
45-
4.0 -
3.5 -
30-
2 0-
1.5-
1.0 -
3500
I' ,,
-- - . -- - _,. ·- ..... ~-· ___ : it.J'·- ---.--~...'.,: 'n"'("""~ ./ 3(((1 2500 1500
wa ... enumbers (cm-1)
J07481649
/ \ \ •'
II _ .. _./ \) .... __ .
2500 1500
Wavenumbers (cm-1)
J07481891
45
'-·: ' )
1oo:J
/'-c;·· /
; /
500
} I
j
1(((1 500

Appendix C: Field Samples Data Sheets
Sample N rnber: J06482349
Sample Identificat ion :
Lab Number : J06482349
Date Received : 11!3/2006
Material Code : 349
CSJ # ; 055002032
Date Sampled :
- Lime
Site Manager No. : 02510008060090
Date Completed ; 11 / 7 .'2006
Fabricator :
Producer Code : 353 Producer Name : C11em•cal Lime (Clifton)
District : 02 - For1 VVorth County : Eroth 10 Marks : 56
Requisition No. : Reference No. :
Quanti ty ;
Stamp Code :
Remarks :
Test Results :
Units : TON
- Meets Specif ications
Tex 600j_03: Lime: Quicklime
Titration
N HCI
Sample wt. (g)
HGl {ml)
Results
2.504
79.4
Spec Item:
CaO (%) 68.91 ~ I n - Max 8 7"/a -
Retained on 1" Sieve (%)
Retained on 3/4" Steve (%)
Retained on No.6 Sieve (%)
Comments
Tested By fv1SEPULV
Date Rec'd 11/3i2006
Entered By MSEPUL\t
Completed ;;- < 1/1 0106
46
Seal to ·

Sample Number: J06482398
Sample Identification :
Lab Number : J06482398
Date Received : 11/8/ 006
CSJ # : 013810018
Date Sampled :
Site Manager No. ; '1905006RBORGAW ·oo3
Date Completed: 11/ 7/2006
Material Code : 349 · Lime Fabricator :
Producer Name : Texas Lime Co. Producer Code : 356
District: 19 . Atlanta
Requisition No. :
County : ID Marks :
Reference No. :
Quantity .
Stamp Code :
Remarks :
Test Results:
Units:
eels SpecJficatJons
Te-x 6U0j_03: Lime: Quicklime
Titration
N HCl
Sample wt. (g) 2.5998
HCI (mL) 82 8
Results
Spec Item:
CaO (%) 89.30 Min • Max 87% •
Retained on 1" Sieve(%)
Retained on 3/4" Sieve (%)
Retained on No.6 Sieve (%)
Comments
Tested By MSEPULV
Date Rec'd 11/8/2006
Entered By CKERN
Completed __ 1, 11/17i06
47
SeaiiD :

Sa pie Number: J07 481649
Sample Identification :
Lab Number: ,)07481649
Date Received : 9111/2007
CSJ #: 038 04037 Site Manager No.: 0251007TCUNt' I '218
Date Sampled: 8/28/2007 Date Completed : 9!1 2/2007
Material Code : 349 Fabricator :
Producer Code : 353
District ; 02 - Fort Worth
Producer Name : Olernical Lime (Clifton}
County : Koo-ct ID Marks :
Requisftion No. : Reference No. :
Quantity: Units : Spec Item:
Stamp Code : 5 - Does N l Meet Specifications
Remarks :
Test Results:
Tex 600L 03: lima: Quicklime
Titration
N HCI
Sample wt. (g) 2 6052
HCI (ml) 54.6
Results Min - Max
GaO (%) 58.77
Retained on 1" Sieve (%)
Retained on 3/4" Sieve (%)
Retained on No.6 Sieve (%)
87% - LOW
Warning · Test result is outs ide of the specif ication l imi s.
Comments Split sample and re-ran
Tested By PWOODRU
Date Rec'd 9/1 112007
Entered By PW OODRU
Completed '7 09/1 2/07
48
Seaf ID : 261 350

Sample Number: J07481648
Sample Identification :
Lab Number : J0748 1648
Date Received : 91'1 1/2007
CSJ #: 017104067 Site Manager No. : 0205207THOMS0'067
Date Sampled ; 8/3012007 Date Completed : 9!12/2007
Material Code : 349 . Lirne Fabricator:
Producer Name : Chemical Lime (Clifton) Producer Code : 353
District : 02 - Fort W orth
Requisition No. :
County : Tarrant
Reference No. :
ID Marks:
Quantity ; Units: Spec Item:
Stamp Code : 5 - Does Not Meet Specifications
Remarks :
Test Results;
Tex 600j_03: Lime: Quicklime
Titration
Sample wt. (g) 2.7908
HCI {ml) 51.8
Results Min - Max
CaO (%) 52.05
Retained on 1" Sieve (%)
Retained on 3/4" Sieve(%)
Retained on. No.6 Sieve(%)
87% - LOW
Warning· Test result is outside of the specification hmits .
Comments Split sample initially
Tested By PWOODRU
Date Rec'd 9/11 /2007
Entered By P~OODRU
Completed -/ j 09/12/07
49
Seal ID : 26765

Sample Number: J0648274
Sample Identification :
Lab Number : J06482741
Date Received : i 2/20/2006
CSJ # : 050602086 Site Manager No. : 2005406K .100 RE5"03 1
Date Sampled : 11114/2005 Date Completed :
Material Code : 348 - l in .,c Fabricator :
Producer Code : 358 Producer Name : Chemicnl Lime (laPorte)
Distric t : 20 - Beaumont County : Chambers 10 Marks :
Requisition No. : Reference No. :
Quantity : Units : Sp~c Item:
Stamp Code : 0 - Not Completed
Remarks :
Test Results:
Tex 600j_02:Lime: Slurry
Bufk Density 11 .73
Titration
N HCI
N NaOH
Samplowt. (g) 7.4975
HCI B.3 (mL) qr;
HCI Total (mL) 109
NaOH 4.4 (mL) 9 .7
Rosults
Muffle
Sample wt. {g) 6 .8114
Cruc. Wt. (g) 26.7094
Cruc. Wt. + Res. (g) 29 3923
Solids(%)
Ca(OH)2 ('%.}
51.9
9 1.4
LOI (%) 60.61
Min • Max
87% •
Retained on No. 6 Sieve(%} 0.2% -
Retained on No. 30 Sieve {%) 4% •
Seai iD :
· • 28% minimum for Bealls. 38% minimum for CLI-La Feria. 35% m inimum for CLI-New Braunfe ls
38% minimum for CLI-LaPortfil, 38'% minimum for CLI-NW Houston, J8% minimum for CLI-A rcola
All other producers: 40% minimum solids
Comments :
Tested By: PWOODRU Entered By: PINQOORU
Date Rec'd: 12i21J/2006 Completed : :;;;-- ' 12/28/06
50

Sa pie Number: J06482720
Sample Identification :
Lab Number : J06482 720
Date Received: 12/18/2006
CSJ # : 003919042 Site Manager No. : 2151 006JMOREN0 1164
Date Sampled : 12114/2006 Date Com plated : 121'21 /2006
Material Code : 348 ·Lime Fabricator:
Producer Code : 272 Producer Name : Chemical lime (La Feria)
District : 2 1 · Pharr County : Cameron ID Marks :
Requisition No. : Refe.renco No. :
Quantity: Units: Spec Item :
Stamp Code : - Meets Specifications
Remarks :
Test Results:
Tex 600j_02:Lime: Slurry
Bulk Densi ty 1:165
Titration
N HCI
N NaOH
Sample wt. (g )
HCI8.3 (ml)
HCI Total (mL)
NaOH 4.4 (mL)
Results
4.0426
38 .9
51
10.7
Muffle
Sample wt. (g) 6.7837
Cruc. Wt. (g) 21 0805
Cruc . Wt. + Res. (g) 29.0806
Mtn - Max Solids (%) 38.9
Ca(OH)2 (%} 91.6 876/D •
LOI (%} 70.52
Retained on No. 6 Sieve (%} 0.2% •
Retained on No. 30 Sieve (%} 4% •
SeaiiD :
~· 28% minimum for Boalls, 38% minimum for CLI-La Fena, 35% minimum for CLI-New Braunfels
38°/• minimum for CLI·l aPorte, 38% minimum for CLI·NW Houston, 38% minimum for CLI-Arcola
AJI other producers: 40% minimum solids
Comm0nts:
Tested By: LISELT
Date Rec'd : 1211812006
Entered By:
Completed : 7
51
LISELT
12118/06

Sample Number: J06482697
Sample Identification :
Lab Number: J06482697
Date Received : 12.! 1512006
CSJ # : 350810002 Site Manager No. : 20 5406JFELAN".022
Date Sampled : 12/612006 Date Completed : 12121/2006
Material Code : 348 -Lime Fabricator :
Producer Code : 358
District : 20 - Beaumont
Producer Name : Chemtcal Ltme (LaPorte)
County : Chambers ID Marks:
Requisition No. : Reference No. :
Quantity : Units : Spec Item:
Stamp Code : - Meets Specificalions
Remarks :
Test Results :
Tex 600j_02:Lirne: Slurry
Bulk Density 11.41
Titration Muffle
N HCI Sample wt. (g) 6 8'728
N NaOH 1 Cruc. Wt. {g) 30 6874
Sample wt. (g} 4.4209 Cruc. Wt. +Res. (g) 33.1835
HCI 8.3 (mi-.} 53 6
HC! Total (ml) 66
NaOH 4.4 (ml) 10 9
Results Min • Max Solids(%)
Ca(OH)2 (%}
48.0
93.6
LOI (%) 63.68
87% -
Reta ined on No.6 Sieve(%) 0.2% •
Retained on No. 30 Sieve (%) 4% -
SeaiiD :
•• 28% minlmum for Bcalls, 38% minimum for CLI-La Feria, 35% minimum for CLI-New Braunfe-ls
38•. minimum for CLl-LaPorte, 38% m inimum for CLI·NW Houston, 38•,>. mlnimum for CL1-Arcola
All other producers: 40~• minimum solids
Comments :
Tested By: LISEL T
Date Rec'd: 12/1512006
Entered By:
Completed : /
52
USELT
12/ 8/06