application of fourier descriptors & artificial neural network to bearing vibration ... ·...
TRANSCRIPT

Universal Journal of Aeronautical amp Aerospace Sciences 2 (2014) 37-54 wwwpapersciencescom
Application of Fourier Descriptors amp Artificial Neural Network to Bearing Vibration Signals for Fault Detection amp Classification
A Oulmane AALakis and N Mureithi
Department of Mechanical Engineering Eacutecole Polytechnique de Montreacuteal CP 6079 Succ Centre-Ville Montreacuteal
Queacutebec Canada H3C 3A7 abdelhakoulmanepolymtlca
Abstract Automatic fault detection and diagnosis has always been a challenge when monitoring rotating machinery Specifically bearing diagnostics have seen an extensive research in the field of fault detection and diagnosis In this paper the time-frequency representations of vibration acceleration signals which were acquired from the bearing in different states were calculated and displayed in grey scale images Artificial neural networks (ANN) were then used to classify the timendashfrequency images after the images were normalized By this way the fault diagnosis of the bearing was transformed to the classification the Fourier Descriptors of timendashfrequency images As there is no need to extract further fault features such as eigenvalues or symptom parameters from the timendashfrequency distributions before classification the fault diagnosis process is highly simplified The challenge is not only to be capable of diagnosing automatically but also to generalize the process of classification of the measured signals The analysis results show that this approach effectively improves the accuracy and reliability of fault diagnosis of the bearing Key Word and Phrases Condition Monitoring Fault Diagnosis and Classification Time-frequency Analysis Fourier Descriptors Artificial Neural Network
1 Introduction
Automatic fault detection and diagnosis has become an interesting added value as a result of incorporating intelligent procedures into machine control systems The artificial intelligence techniques have been proposed for machine component predictive maintenance strategies Bearing monitoring has seen an extensive research in the field of fault detection by vibration analysis techniques Rolling bearings are bound to fail due to their continuous use in demanding situations Their faults can provoke from safety problems to production loses Therefore the automatic and rapid detection of the fault is a peremptory requirement
Machine condition monitoring early fault detection diagnosis and classification are extremely important topics in the engineering field Proper machine monitoring and fault detection method will result in improved safety improved reliability and reduction of the cost of different engineering system operation [1]
A traditional approach to prevent machine failure is based on planning regular inspection parts replacement and preventive maintenance Although these methods are effective they are all incapable of given early warning for the machine conditions under operation For this reason automatic fault detection and diagnosis methods that monitor the machine while it operating is becoming popular
In rotary machines bearings are crucial components and the majority of failures arise from defective bearing The unprocessed vibration data collected from a rotary machines gives some information about the condition of the bearing however to detect fault at early stages further processing of the vibration signal is necessary Several methods in different domains have been implemented for interpreting the vibration signals
Time-domain analysis is a method of representing a waveform by plotting amplitude over time In addition time-domain analysis calculates characteristic features from time waveform signals as
37
A Oulmane AALakis amp N Mureithi
descriptive statistics For example mean peak peak-to-peak interval crest factor high order statistics RMS (root mean square) kurtosis etc
Frequency-domain analysis is a method of representing a waveform by plotting its amplitude against frequency The advantage of frequency-domain analysis over time-domain analysis is its ability to easily identify and isolate certain frequency components of interest The Fourier transform transforms a time domain signal into a frequency domain representation of that signal
This means that it generates a description of the distribution of the energy in the signal as a function of frequency So this is normally displayed as a plot of frequency (x-axis) against amplitude (y-axis) called a spectrum The main idea of spectrum analysis is to either look at the whole spectrum or look closely at certain frequency components of interest and thus extract features from the signal
In digital signal processing the Fourier transform is almost always performed using an algorithm called the Fast Fourier Transform or FFT This is as its name suggests a quick way of performing this transform and it gives the same results as the slower Discrete Fourier Transform (DFT) would The Fourier transform of third-order cumulant-generating function is called the bispectrum or bispectral density Bispectrum analysis has been shown to have wide application in machinery diagnostics for various mechanical systems such as gears [2] bearings [3] rotating machines [4] and induction machines [5] Li et al investigated the application of bispectrum diagonal slice to gear fault diagnostics Yang et al used both bispectrum diagonal slice and bi-coherence diagonal slice summed bispectrum and summed bi-coherence for bearing fault diagnostics A limitation of Frequency-domain analysis is its incapacity to handle the instantaneous signals which are very common when the fault of machines occur Thus time-frequency analysis which investigates waveform signals in both time and frequency domain has been developed for non-stationary waveform signals
The analysis of nonstationary signals generally consists of the description of temporal evolution of certain relevant properties of the analyzed signals There are two major classes of approaches based on whether the spectral contents (time-frequency methods) are considered or if the behavior of the signal in various scales of observation (time-scale methods) is aimed Time-frequency analysis uses time-frequency distributions which represents the energy or power of waveform signals in two-dimensional functions of both time and frequency Short-time Fourier transforms (STFT) [6]-[7] and Wigner-Ville distributions [8]-[9] are the most popular time-frequency distributions Cohen reviewed a class of time-frequency distributions which include spectrogram Wigner-Ville distribution Choi-Williams and others
The complicated theory of time-frequency analysis restricts engineers from using these methods in machine diagnosis To implement all the above-mentioned methods an in- house software program (TF-Analysis) has been developed This program has been developed especially for the diagnosis of defects in machinery and it allows the user to different distributions of Cohenrsquos class of time-frequency method and it provides different kinds of Wavelet transforms
In most cases to identifying the deteriorations the general method is to classify the images through a visual inspection made by a technician This is clearly dependent on human experience and introduces many subjective factors and errors in fault diagnosis Unsurprisingly the recognition results are usually not very good for this reason it is necessary to develop automatic monitoring systems to detect faults more reliable and more effective
There exists a great deal of diagnosis techniques that appear to be classified in the literature in diverse ways [10] [11] [12] [13] For the case of machinery diagnostics signal-based Fault Detection and Identification techniques are the most convenient since vibration signals can provide a fault signature when diagnosing rotating machinery components The stage of feature extraction implies preparing the signal so that its information is interpretable This is generally achieved by means of signal processing techniques On the other hand the classification (to interpret the signal information to decide whether there is a fault and which is the element in fault) typically involves applying all techniques Finally due to the blooming of artificial intelligence the fault diagnosis techniques have been increasingly developed with the use of learning algorithm [14] artificial neural networks [15] Fuzzy logic method [16] and genetic algorithms [17]
38
A Oulmane AALakis amp N Mureithi
In this paper Time-frequency distributions are used to analyze vibration signals The analyses of results are expressed in timendashfrequency images An artificial neural network algorithm is then used to classify non-linearly separable data directly using the Fourier descriptors of these timendashfrequency images As there is no need to extract further fault features such as Eigenvalues or symptom parameters the classification and fault diagnosis process becomes simple and easy to apply
2 Signal Processing Procedure
The shapes we consider in this paper are outline shapes which can be described as single plane closed curves The shapes in our database are obtained from timendashfrequency analysis images and they are presented in the form of gray level images The purpose of pre-processing is to extract boundary information (coordinates of the boundary) from the shape Figure 1 shows the structure of the pre-processing algorithm
Vibration Boundary connection
tracing and Boundary
coordinates
Image acquisition Binarisation and de‐
noising Signal (TF A l i )
Fig1 Image processing system
The first step in pre-processing is to binarize the shape image a simple thresholding function is applied to convert the gray level shape image into a binary image In reality shape images are often corrupted with noise and as a result the shape obtained from the threshold usually has noise around its boundary A de-noising process is therefore applied This eliminates isolated pixels and small isolated regions or segments For a non-silhouette shape the shape boundary is not always connected and therefore an m-connectivity connection technique is used to fill the gaps between boundary points The shape is then traced using an 8-connectivity contour tracing technique to obtain the shape boundary coordinates
3 Fourier Descriptors
Fourier descriptors are used to describe the shape of any object (input image) Their main advantage is that they are not affected by translation rotation and scaling of the observed object Also they are easily computed and based on the well-developed theory of Fourier transformation
In this paper the shape of the pattern is described by coordinates of its contour in a complex coordinate system and then a Discrete Fourier Transformation is applied to this data to obtain the Fourier Descriptors of the shape
Function that finds a set of Fourier
Descriptors for every object in image
Defect
Neural network MLP
Classifier
39
A Oulmane AALakis amp N Mureithi
Fig2 Representing a contour using Fourier descriptors [18]
31 Calculating the Fourier Descriptors
Before calculating the Fourier descriptors the input image must be segmented and the boundary of the object must be determined The boundary will be presented as an array of complex numbers which correspond to the pixels of the object boundary if the image is placed in the complex plane Fourier descriptors are calculated by combining Fourier transform coefficients of the complex array
Let the complex array Z0 Z1 Z2helliphellipZN-1 represent the boundary belonging to the object whose shape needs to be described The k-th Fourier transform coefficient is calculated as [19]
k=0 1helliphelliphelliphelliphelliphellip N-1 (31) NiknN
nnK eZZ 2
1
0
The Fourier descriptors are obtained from the sequence Zk as follows
1Z
ZC k
K k=2 3helliphelliphelliphelliphelliphellip N-1 (32)
To make Fourier Descriptors rotation- and shift- invariant we must use only absolute values of coefficients Zk and in order to make them scale invariant we normalize them by dividing each one by the first value
4 Artificial Neural Network Classifier Designs The multilayer perceptron is the most widely used paradigm among neural networks in various
applications It is biologically inspired that is it is designed to have a similar structure and behavior to a biological neural system A first interest in neural networks emerged after the introducing of simplified neurons by McCulloch and Pitts in 1943 These neurons were presented as models of biological neurons and as conceptual components for circuits that could perform computational works
Inputs Weights
Fig3 An Artificial neuron
w1 sum
x1 Sum Transfer function Output
f
wn
xn
40
A Oulmane AALakis amp N Mureithi
Even if it is far from the real biological neural system it is a powerful signal processing algorithm for solving many practical problems It is known to be a universal approximator in which it can approximate any function to any degree of accuracy given enough nodes in hidden layer This capability makes the MLP a powerful classifier in pattern classification problem An artificial network consists of a set of simple processing units (neurons) which communicate by sending signals to each other over a large number of weighted connections
Every Neural Networks should be trained before usage it can learn from examples through training During the training process neural network changes the values of weights and biases to perform desired response Besides its ability to approximate MLPs have a good generalization After successful training it can give good results for unseen input data within the same input space There are two categories of the learning rules
supervised learning Associative learning in which the network is trained by providing it with input and matching output patterns These input-output pairs can be provided by an external teacher or by the system which contains the network (this category of Neural Network training is used in this paper)
unsupervised learning Self-organization in which an output unit is trained to respond to clusters of pattern within the input In this paradigm the system is supposed to discover statistically salient features of the input population Unlike the supervised learning paradigm there is no feedback from the environment to indicate what the desired outputs of a network should be or whether they are correct rather the system must develop its own representation of the input stimuli 41 Classifying the TimendashFrequency Images with ANN
Minsky and al [20] showed that a two layer feed forward network can overcome many restrictions but did not present a solution to the problem of how to adjust the weights from input to hidden units An answer to this question was presented in [21] The main idea behind this solution is that the errors for the units of the hidden layer are determined by back-propagating the errors of the units of the output layer For this reason the method is called back-propagation learning algorithm The back-propagation algorithm performs two steps The first step is that the inputs are ordinarily propagated forward from input to output layer and then it produces an actual output The error from the difference between target values and actual values are propagated backward from output layer to the previous layers to update their weights A back-propagation method is a non-parametric statistical model for extracting nonlinear relations in the data
Fig4 Block diagram of the Multi-layer perceptron network used in this paper
x1 Input Layer Second layer (Hidden Layer)
xn
sum F()
sum F()
sum F()
Third Layer (Output Layer)
Output
41
A Oulmane AALakis amp N Mureithi
By the current research classification method based on artificial neural network was used For this classification problem this Multi-layer perceptron network consists of three layers input layer hidden layer and output layer as shown in Figure 4 The input layer unit does not perform any computation but simply distributes the input to the neurons in the pattern layer Initial weights and biases were generated randomly in this algorithm and the output layer indicates what configuration was used at the input
5 Bearing Fault Signatures
Fig5 Dimension and frequencies related to bearing faults signatures
The most typical faults in ball bearings are produced by a localized wear in the inner race the outer race or the balls Localized defects include cracks pits and spalls on the rolling surface although the dominant mode of fault is the spalling of the races When the ball strikes the defect a shock is produced exciting high frequency resonances of the structure The presence of such defect causes a significant increase in the vibration level The frequency of the shocks can be calculated by the following formulas
)cos1 BD
1(2 P
RCF DFF
(51)
)cos
1(2 P
BR
BORF D
DF
NF
(52)
)cos
1(2 P
BR
BIRF D
DF
NF
(53)
)cos
1(2 2
22
P
B
RB
PBF D
DF
D
DF
(54)
where FCF FORF and FIRF are the cage fault frequency ball pass frequencies for outer and inner race respectively and FBF is the ball fault frequency These fault frequencies are dependent on the number of balls (NB) shaft speed (FR) contact angle (θ) and ball (DB) and pitch (DP) diameters
42
A Oulmane AALakis amp N Mureithi
6 Experiments 61 Data acquisition
In order to verify the practicability of the proposed method vibration signals were collected from a test rig lsquoSqueeze Film Damper (SFD)rsquo at Eacutecole Polytechnique de Montreacuteal The original design of the SFD [22] has been modified to allow the testing of a defective bearing The test setup is composed of a conical steel shaft supported at its ends by two rolling bearings The shaft is connected to the motor via a rigid coupling Bearing near the coupling is auto-aligning and it is mounted freely (can keep the angular misalignment permitted by the rigid coupling) The opposite housing contains the tested bearing Two accelerometers were used one mounted on each bearing housing (Figure 6) Signals were gathered at a sampling frequency of 32768 kHz for a period of 20 seconds while the shaft was running at different speed 1800 rpm 1500 rpm 1200rpm 900 rpm and 600 rpm [23]
Fig6 Test setup at Eacutecole Polytechnique de Montreacuteal
Fig6 Continued
Tested bearing
Tested bearing
43
A Oulmane AALakis amp N Mureithi
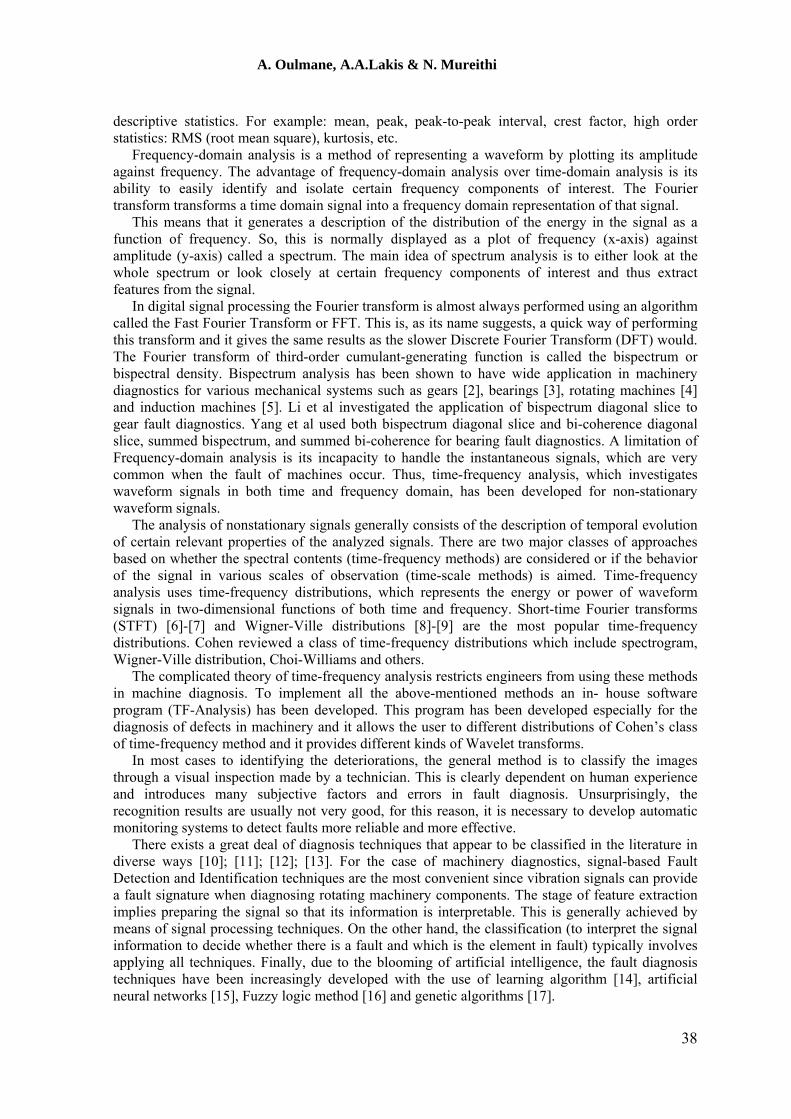
Table 1 Test Setup Characteristics
Components Technical Specifications
Motor 1 Hp 1750 rpm 60 Hz 12 amp
Coupling 78 po to 1 1 4 po
Bearing near coupling SKF 2310 E2RS1TN9
Tested bearing SKF 1211 EKTN9
Table 2 Fault frequency (Hz)
Model BPFOFR BPFIFR BSFFR
SKF 2310 E2RS1TN9
536 764 547
SKF 1211 EKTN9 868 113 739
7 Artificial Neural Network Defect Classifier using Fourier Descriptors
Most of the rotating machine fault phenomena (outer inner race and ball fault) behave in a nonlinear way meaning that the observed data describe a curve or curved subspace in the original data space Identifying such nonlinear manifolds becomes more and more important in the field of diagnostic Artificial Neural Networks (ANN) which used in this study can be used in numerous main tasks function approximation and classification Neural networks are nonlinear multivariable models built from a set of inputoutput data Generally there are 3 layers input hidden and output Each layer contains neurons that take a weighted sum of its inputs and applies a function to introduce nonlinearity For ANNs that nonlinear function generally is sigmoidal
Four different synthetic classes are considered to test the performance of the proposed intelligent system normal inner race outer race and ball fault (the size shape and depth of the defects performed on bearing components could not be controlled adequately The approach adopted for this purpose is by trial-error the component is damaged until the theoretical frequency of fault can be clearly distinguished)
a)
c)
b)
Fig7 Fault simulations on SKF 1211bearing a) outer race fault b) inner race fault and c) ball fault
44
A Oulmane AALakis amp N Mureithi
There are three main factors influencing the generalization of a network the size efficiency of the training data and the physical complexity of the problem at hand and the architecture of the network used [24]
All factors are equally important to overall classification performance of a network Learning
of different classes due to the complexity of classification andor an uneven number of training data from different classes is likely to be encountered in practice In an ideal case the number of training data should be equal with an ample and representative amount for each class
MLP networks can be trained by several methods but the most popular method is the error
backpropagation algorithm This algorithm uses a gradient-descent to update the weights of the network Although there are several methods to improve the rate of convergence of the error backpropagation the standard error backpropagation is used throughout this research in order to classify input signals in four classes To test the reliability of the learning process 100 signals per class (normal inner race outer race and ball fault) are fed to the training block then the classifier uses these training data to provide decision 8 Discussions and Results
The results of Time-Frequency Analysis are the Spectrogram (STFT) of the simulated normal and defective SKF 1211 bearing The output of Time-Frequency Analysis for each signal is an ntimesn matrix and represent by an image The Time-Frequency Analysis method provides a three dimensional representation of a signal Figures 7 8 9 and 10 show time-frequency representations with normal and defects fault located at different speed of the simulated classes
During classification the most significant fifteen Fourier Descriptors (This selection is justifiable by simple propertymdashmost of the information about the object boundary will be located in the low frequency part of the discrete Fourier transform) representing objects found in the Time-Frequency image are sent to the trained Neural Network block
Every training input vector is labeled with its corresponding feature class in binary
representation as indicated in table If a Pattern vector is classified as faulty or non-faulty bearing signal then its corresponding feature class is copied to the output image The remaining combinations can be considered are unknown or unclassified defect classes
45
A Oulmane AALakis amp N Mureithi
Objects
a)
b)
Objects
c)
Fig8 STFT image of the simulated Normal class at a) 600 rpm b) 1200 rpm and 1800 rpm
46
A Oulmane AALakis amp N Mureithi
a)
Objects
b)
Objects
c)
Fig9 STFT image of the simulated Ball fault class at a) 600 rpm b) 1200 rpm and 1800 rpm
47
A Oulmane AALakis amp N Mureithi
a)
b)
c)
Fig10 STFT image of the simulated Inner fault class at a) 600 rpm b) 1200 rpm and 1800 rpm
48
A Oulmane AALakis amp N Mureithi
Objects
a)
b)
c)
Fig11 STFT image of the simulated Outer fault class at a) 600 rpm b) 1200 rpm and 1800 rpm
49
A Oulmane AALakis amp N Mureithi
a)
b)
c)
d)
Fig12 Fourier descriptors of one object of STFT image at 600 rpm of a) Normal class b) Defect ball c)
Inner race defect d) Outer race defect
50
A Oulmane AALakis amp N Mureithi
As it was mentioned earlier the classifier uses the trained data to provide decision for this
reason when the training is complete the network performance is checked to determine if any changes need to be made to the training process the network architecture or the data sets Figure 12
Fig13 Training curve of the Neural Network Classifier
This figure doesnrsquot indicate any major problems with the training The validation and test curves are very similar After the network training and validation the network object is used to calculate the network response to input Fourier Descriptors vector of the simulated classes In this work Pattern recognition networks used are feedforward networks that can be trained to classify inputs according to target classes The target data for pattern recognition networks should consist of vectors of all zero values except for a 1 in element i where i is the class they are to represent
Defect Targets is an ntimesn matrix of associated class vectors defining which of four classes each input is assigned to Classes are represented by a 1 in row 1 2 3 or 4 1) Normal class 1 2) Defect class 2 3) Defect class 3 4) Defect class 4 Table 3 Binary representation of defect classes
Defect class Class Binary Representation
Normal class 1 0 0 0
Ball Defect 0 1 0 0
Inner race Defect 0 0 1 0
Outer race Defect 0 0 0 1
51
A Oulmane AALakis amp N Mureithi
The objective at this stage is to use this dictionary to classify the signals derived from distributions that give the best results for our case Based on the fact that the best distribution is the one that has the largest peak the image of the top three time-frequency distributions will be selected for this component and hence the dictionary is created
For a new product to verify whether or not the signal has a fault the process of detection is as follows first the signal is processed by the top three distributions retained In the second step a series of twelve Fourier descriptors should be found for every object in the time-frequency image These significant Fourier descriptors will be chosen as the elements of the pattern vector for description of the object and a comparison procedure will be implemented between the latter and the dictionary (only signals that correspond to the state of the bearing) to identify its state
Figure 14 indicates the successful classification of new added points used to evaluate the classifier The classification performance result using neural network and Fourier Descriptors is reported in Table 4 It is obvious that the classifier response correctly to all of the test and training data This appears to be an over-training problem However the goal was to create a system able to perform efficient classification with limited input cases in attempt to achieve the neural network training with a reduced number of case patterns
Fig 14 Classification of new added points ( )
Table 4 Classification performance result
Procedure Classification results
Normal class Correct decision
Ball Defect Correct decision
Inner race Defect Correct decision
Outer race Defect Correct decision
Healthy Class
52
A Oulmane AALakis amp N Mureithi
9 Conclusions
In this paper we proposed an automatic detection and diagnosis methods The results were displayed in grey images an important application of artificial neural network and Fourier Descriptors of Time-Frequency image for automatic defect classification using defect bearing signatures This method does not require extract further fault features such as eigenvalues or symptom parameters from timendashfrequency distributions before classification the fault diagnosis process is highly simplified The superior performance of the proposed method has been demonstrated using experimental setups The results obtained for this approach show that the classification of Fourier Descriptors of timendashfrequency images has been proved to have a high sensitivity as well as accuracy in detection localization and assessment of the faulty conditions of ball bearings 10 Acknowledgement
This research was supported by the collaborative research and development grant (NoCRDPJ-335472-05) of Natural Sciences and Engineering Research Council of Canada (NSERC) Pratt amp Whitney Canada Bombardier Aeronautics and National Research Council of Canada (NRC) References
1 Chow MY lsquoMethodologies of Using Neural Network and Fuzzy logic Technologies for Motor Incipient Fault Detectionrsquo World Scientific Publishing Company 1998
2 Xiong L Shi T Yang S and Rao R B K N lsquoA novel application of wavelet-based bispectrum analysis to diagnose faults in gearsrsquo International Journal of COMADEM 5 (2002) 31-38
3 Yang DM Stronach A F McConnell P and Penman J lsquoThird-order spectral techniques for the diagnosis of motor bearing condition using artificial neural networksrsquo Mechanical Systems and Signal Processing 16 (2002) 391-411
4 Chow T W S and Fei G lsquoThree phase induction machines asymmetrical faults identification using bispectrumrsquo IEEE Transactions on Energy Conversion 10 (1995) 688-693
5 Arthur N and Penman J lsquoInverter fed induction machine condition monitoring using the bispectrumrsquo in Proceedings of the IEEE Signal Processing Workshop on Higher-Order Statistics Banff Alta Canada (1997) pp 67-71
6 Li W Zhang G Shi T and Yang S lsquoGear crack early diagnosis using bispectrum diagonal slicersquo Chinese Journal of Mechanical Engineering (English Edition) 16 (2003) 193-196
7 Wang W J and McFadden P D lsquoEarly detection of gear failure by vibration analysis I Calculation of the time-frequency distributionrsquo Mechanical Systems and Signal Processing (1993) pp 193-203
8 Andrade F A Esat I and Badi M N M lsquoGearbox fault detection using statistical methods time-frequency methods (STFT and Wigner-Ville distribution) and harmonic wavelet - A comparative studyrsquo in Proceedings of COMADEM 99 Chipping Norton (1999) pp 77-85
9 Meng Q and Qu L lsquoRotating machinery fault diagnosis using Wigner distributionrsquo Mechanical Systems and Signal Processing (1991) pp 155-166
10 Baydar N and Ball A lsquoA comparative study of acoustic and vibration signals in detection of gear failures using Wigner-Ville distributionrsquo Mechanical Systems and Signal Processing (2001) pp 1091-1107
11 Cohen L lsquoTime-frequency distribution - a reviewrsquo Proceedings of the IEEE (1989) pp 941-981 12 Abad PL and Banks WJ lsquoNew LP based heuristics for the classification problemrsquo European Journal
of Operational Research 67 (1993) 88-100 13 Burke LL lsquoIntroduction to artificial neural systems for pattern recognitionrsquo Computers and Operations
Research 18 (1991) 211-220 14 Chen D and Wang W J lsquoClassification of Wavelet Map Patterns Using Multilayer Neural Networks
for Gear Fault Detectingrsquo Mechanical Systems and Signal Processing Vol 16 Issue 4 (2002) 695-704
53
A Oulmane AALakis amp N Mureithi
54
15 Li B Chow M Y Tipsuwan Y and Hung J ClsquoNeural Network Based Motor Rolling Bearing fault Diagnosisrsquo IEEE Transactions on Industriel Electronics (2000) Vol47 Issue 5 1060-1069
16 Paya B A Esat II and Badi MNM lsquoArtificial Neural Network Based Fault Diagnostics of Rotating Machinery Using Wavelet Transforms as a Preprocessorrsquo Mechanical Systems and Signal Processing Vol 11 Issue 5 (1997) 751-765
17 Rumelhart D E Hinton G E and Williams R J lsquoLearning representations by back-propagating errorsrsquo Neuro-computing foundations of research MIT Press Cambridge MA (1988) page 696-699
18 Milan S Valcav H and Roger B lsquoImage Processing Analysis and Machine Visionrsquo Chapman amp Hall computing series London First edition 1993
19 McElroy T Wilson E and Anspach G lsquoFourier descriptors and neural networks for shape classificationrsquo Acoustic Speech and Signal Processing ICASSP International conference on (1995) vol5 pp3435-3438
20 Minsky M L and Papert SA lsquoPerceptronrsquosrsquo Cambridge MA MIT Press 1969 21 McCulloch W S and Pitts W H lsquoA logical calculus of the ideas immanent in nervous activityrsquo
Bulletin of Mathematical Biophysics 5 (1943) 115-133 22 Turgeon F lsquoDesign drsquoun Squeeze Film Damper rapport techniquersquo Chaire industrielle
CRNSGEACLBWC Eacutecole Polytechnique de Montreacuteal 2007 23 Christian Komgom meacutemoire de maicirctrise lsquoDevelopment drsquoune proceacutedure intelligente de diagnostic des
deacutefauts de Roulement et eacutetude de lrsquoimpact du chemin de transmission du signal sur sa fiabiliteacutersquo Eacutecole Polytechnique de Montreacuteal 2008
24 Li B Chow M y Tipsuwan Y and Hung J C lsquoNeural-Network-Based Motor Rolling Bearing Fault Diagnosisrsquo IEEE Transaction on Industrial Electronics (2000)Vol 47 Issue 5 1060-1069
A Oulmane AALakis amp N Mureithi
descriptive statistics For example mean peak peak-to-peak interval crest factor high order statistics RMS (root mean square) kurtosis etc
Frequency-domain analysis is a method of representing a waveform by plotting its amplitude against frequency The advantage of frequency-domain analysis over time-domain analysis is its ability to easily identify and isolate certain frequency components of interest The Fourier transform transforms a time domain signal into a frequency domain representation of that signal
This means that it generates a description of the distribution of the energy in the signal as a function of frequency So this is normally displayed as a plot of frequency (x-axis) against amplitude (y-axis) called a spectrum The main idea of spectrum analysis is to either look at the whole spectrum or look closely at certain frequency components of interest and thus extract features from the signal
In digital signal processing the Fourier transform is almost always performed using an algorithm called the Fast Fourier Transform or FFT This is as its name suggests a quick way of performing this transform and it gives the same results as the slower Discrete Fourier Transform (DFT) would The Fourier transform of third-order cumulant-generating function is called the bispectrum or bispectral density Bispectrum analysis has been shown to have wide application in machinery diagnostics for various mechanical systems such as gears [2] bearings [3] rotating machines [4] and induction machines [5] Li et al investigated the application of bispectrum diagonal slice to gear fault diagnostics Yang et al used both bispectrum diagonal slice and bi-coherence diagonal slice summed bispectrum and summed bi-coherence for bearing fault diagnostics A limitation of Frequency-domain analysis is its incapacity to handle the instantaneous signals which are very common when the fault of machines occur Thus time-frequency analysis which investigates waveform signals in both time and frequency domain has been developed for non-stationary waveform signals
The analysis of nonstationary signals generally consists of the description of temporal evolution of certain relevant properties of the analyzed signals There are two major classes of approaches based on whether the spectral contents (time-frequency methods) are considered or if the behavior of the signal in various scales of observation (time-scale methods) is aimed Time-frequency analysis uses time-frequency distributions which represents the energy or power of waveform signals in two-dimensional functions of both time and frequency Short-time Fourier transforms (STFT) [6]-[7] and Wigner-Ville distributions [8]-[9] are the most popular time-frequency distributions Cohen reviewed a class of time-frequency distributions which include spectrogram Wigner-Ville distribution Choi-Williams and others
The complicated theory of time-frequency analysis restricts engineers from using these methods in machine diagnosis To implement all the above-mentioned methods an in- house software program (TF-Analysis) has been developed This program has been developed especially for the diagnosis of defects in machinery and it allows the user to different distributions of Cohenrsquos class of time-frequency method and it provides different kinds of Wavelet transforms
In most cases to identifying the deteriorations the general method is to classify the images through a visual inspection made by a technician This is clearly dependent on human experience and introduces many subjective factors and errors in fault diagnosis Unsurprisingly the recognition results are usually not very good for this reason it is necessary to develop automatic monitoring systems to detect faults more reliable and more effective
There exists a great deal of diagnosis techniques that appear to be classified in the literature in diverse ways [10] [11] [12] [13] For the case of machinery diagnostics signal-based Fault Detection and Identification techniques are the most convenient since vibration signals can provide a fault signature when diagnosing rotating machinery components The stage of feature extraction implies preparing the signal so that its information is interpretable This is generally achieved by means of signal processing techniques On the other hand the classification (to interpret the signal information to decide whether there is a fault and which is the element in fault) typically involves applying all techniques Finally due to the blooming of artificial intelligence the fault diagnosis techniques have been increasingly developed with the use of learning algorithm [14] artificial neural networks [15] Fuzzy logic method [16] and genetic algorithms [17]
38
A Oulmane AALakis amp N Mureithi
In this paper Time-frequency distributions are used to analyze vibration signals The analyses of results are expressed in timendashfrequency images An artificial neural network algorithm is then used to classify non-linearly separable data directly using the Fourier descriptors of these timendashfrequency images As there is no need to extract further fault features such as Eigenvalues or symptom parameters the classification and fault diagnosis process becomes simple and easy to apply
2 Signal Processing Procedure
The shapes we consider in this paper are outline shapes which can be described as single plane closed curves The shapes in our database are obtained from timendashfrequency analysis images and they are presented in the form of gray level images The purpose of pre-processing is to extract boundary information (coordinates of the boundary) from the shape Figure 1 shows the structure of the pre-processing algorithm
Vibration Boundary connection
tracing and Boundary
coordinates
Image acquisition Binarisation and de‐
noising Signal (TF A l i )
Fig1 Image processing system
The first step in pre-processing is to binarize the shape image a simple thresholding function is applied to convert the gray level shape image into a binary image In reality shape images are often corrupted with noise and as a result the shape obtained from the threshold usually has noise around its boundary A de-noising process is therefore applied This eliminates isolated pixels and small isolated regions or segments For a non-silhouette shape the shape boundary is not always connected and therefore an m-connectivity connection technique is used to fill the gaps between boundary points The shape is then traced using an 8-connectivity contour tracing technique to obtain the shape boundary coordinates
3 Fourier Descriptors
Fourier descriptors are used to describe the shape of any object (input image) Their main advantage is that they are not affected by translation rotation and scaling of the observed object Also they are easily computed and based on the well-developed theory of Fourier transformation
In this paper the shape of the pattern is described by coordinates of its contour in a complex coordinate system and then a Discrete Fourier Transformation is applied to this data to obtain the Fourier Descriptors of the shape
Function that finds a set of Fourier
Descriptors for every object in image
Defect
Neural network MLP
Classifier
39
A Oulmane AALakis amp N Mureithi
Fig2 Representing a contour using Fourier descriptors [18]
31 Calculating the Fourier Descriptors
Before calculating the Fourier descriptors the input image must be segmented and the boundary of the object must be determined The boundary will be presented as an array of complex numbers which correspond to the pixels of the object boundary if the image is placed in the complex plane Fourier descriptors are calculated by combining Fourier transform coefficients of the complex array
Let the complex array Z0 Z1 Z2helliphellipZN-1 represent the boundary belonging to the object whose shape needs to be described The k-th Fourier transform coefficient is calculated as [19]
k=0 1helliphelliphelliphelliphelliphellip N-1 (31) NiknN
nnK eZZ 2
1
0
The Fourier descriptors are obtained from the sequence Zk as follows
1Z
ZC k
K k=2 3helliphelliphelliphelliphelliphellip N-1 (32)
To make Fourier Descriptors rotation- and shift- invariant we must use only absolute values of coefficients Zk and in order to make them scale invariant we normalize them by dividing each one by the first value
4 Artificial Neural Network Classifier Designs The multilayer perceptron is the most widely used paradigm among neural networks in various
applications It is biologically inspired that is it is designed to have a similar structure and behavior to a biological neural system A first interest in neural networks emerged after the introducing of simplified neurons by McCulloch and Pitts in 1943 These neurons were presented as models of biological neurons and as conceptual components for circuits that could perform computational works
Inputs Weights
Fig3 An Artificial neuron
w1 sum
x1 Sum Transfer function Output
f
wn
xn
40
A Oulmane AALakis amp N Mureithi
Even if it is far from the real biological neural system it is a powerful signal processing algorithm for solving many practical problems It is known to be a universal approximator in which it can approximate any function to any degree of accuracy given enough nodes in hidden layer This capability makes the MLP a powerful classifier in pattern classification problem An artificial network consists of a set of simple processing units (neurons) which communicate by sending signals to each other over a large number of weighted connections
Every Neural Networks should be trained before usage it can learn from examples through training During the training process neural network changes the values of weights and biases to perform desired response Besides its ability to approximate MLPs have a good generalization After successful training it can give good results for unseen input data within the same input space There are two categories of the learning rules
supervised learning Associative learning in which the network is trained by providing it with input and matching output patterns These input-output pairs can be provided by an external teacher or by the system which contains the network (this category of Neural Network training is used in this paper)
unsupervised learning Self-organization in which an output unit is trained to respond to clusters of pattern within the input In this paradigm the system is supposed to discover statistically salient features of the input population Unlike the supervised learning paradigm there is no feedback from the environment to indicate what the desired outputs of a network should be or whether they are correct rather the system must develop its own representation of the input stimuli 41 Classifying the TimendashFrequency Images with ANN
Minsky and al [20] showed that a two layer feed forward network can overcome many restrictions but did not present a solution to the problem of how to adjust the weights from input to hidden units An answer to this question was presented in [21] The main idea behind this solution is that the errors for the units of the hidden layer are determined by back-propagating the errors of the units of the output layer For this reason the method is called back-propagation learning algorithm The back-propagation algorithm performs two steps The first step is that the inputs are ordinarily propagated forward from input to output layer and then it produces an actual output The error from the difference between target values and actual values are propagated backward from output layer to the previous layers to update their weights A back-propagation method is a non-parametric statistical model for extracting nonlinear relations in the data
Fig4 Block diagram of the Multi-layer perceptron network used in this paper
x1 Input Layer Second layer (Hidden Layer)
xn
sum F()
sum F()
sum F()
Third Layer (Output Layer)
Output
41
A Oulmane AALakis amp N Mureithi
By the current research classification method based on artificial neural network was used For this classification problem this Multi-layer perceptron network consists of three layers input layer hidden layer and output layer as shown in Figure 4 The input layer unit does not perform any computation but simply distributes the input to the neurons in the pattern layer Initial weights and biases were generated randomly in this algorithm and the output layer indicates what configuration was used at the input
5 Bearing Fault Signatures
Fig5 Dimension and frequencies related to bearing faults signatures
The most typical faults in ball bearings are produced by a localized wear in the inner race the outer race or the balls Localized defects include cracks pits and spalls on the rolling surface although the dominant mode of fault is the spalling of the races When the ball strikes the defect a shock is produced exciting high frequency resonances of the structure The presence of such defect causes a significant increase in the vibration level The frequency of the shocks can be calculated by the following formulas
)cos1 BD
1(2 P
RCF DFF
(51)
)cos
1(2 P
BR
BORF D
DF
NF
(52)
)cos
1(2 P
BR
BIRF D
DF
NF
(53)
)cos
1(2 2
22
P
B
RB
PBF D
DF
D
DF
(54)
where FCF FORF and FIRF are the cage fault frequency ball pass frequencies for outer and inner race respectively and FBF is the ball fault frequency These fault frequencies are dependent on the number of balls (NB) shaft speed (FR) contact angle (θ) and ball (DB) and pitch (DP) diameters
42
A Oulmane AALakis amp N Mureithi
6 Experiments 61 Data acquisition
In order to verify the practicability of the proposed method vibration signals were collected from a test rig lsquoSqueeze Film Damper (SFD)rsquo at Eacutecole Polytechnique de Montreacuteal The original design of the SFD [22] has been modified to allow the testing of a defective bearing The test setup is composed of a conical steel shaft supported at its ends by two rolling bearings The shaft is connected to the motor via a rigid coupling Bearing near the coupling is auto-aligning and it is mounted freely (can keep the angular misalignment permitted by the rigid coupling) The opposite housing contains the tested bearing Two accelerometers were used one mounted on each bearing housing (Figure 6) Signals were gathered at a sampling frequency of 32768 kHz for a period of 20 seconds while the shaft was running at different speed 1800 rpm 1500 rpm 1200rpm 900 rpm and 600 rpm [23]
Fig6 Test setup at Eacutecole Polytechnique de Montreacuteal
Fig6 Continued
Tested bearing
Tested bearing
43
A Oulmane AALakis amp N Mureithi
Table 1 Test Setup Characteristics
Components Technical Specifications
Motor 1 Hp 1750 rpm 60 Hz 12 amp
Coupling 78 po to 1 1 4 po
Bearing near coupling SKF 2310 E2RS1TN9
Tested bearing SKF 1211 EKTN9
Table 2 Fault frequency (Hz)
Model BPFOFR BPFIFR BSFFR
SKF 2310 E2RS1TN9
536 764 547
SKF 1211 EKTN9 868 113 739
7 Artificial Neural Network Defect Classifier using Fourier Descriptors
Most of the rotating machine fault phenomena (outer inner race and ball fault) behave in a nonlinear way meaning that the observed data describe a curve or curved subspace in the original data space Identifying such nonlinear manifolds becomes more and more important in the field of diagnostic Artificial Neural Networks (ANN) which used in this study can be used in numerous main tasks function approximation and classification Neural networks are nonlinear multivariable models built from a set of inputoutput data Generally there are 3 layers input hidden and output Each layer contains neurons that take a weighted sum of its inputs and applies a function to introduce nonlinearity For ANNs that nonlinear function generally is sigmoidal
Four different synthetic classes are considered to test the performance of the proposed intelligent system normal inner race outer race and ball fault (the size shape and depth of the defects performed on bearing components could not be controlled adequately The approach adopted for this purpose is by trial-error the component is damaged until the theoretical frequency of fault can be clearly distinguished)
a)
c)
b)
Fig7 Fault simulations on SKF 1211bearing a) outer race fault b) inner race fault and c) ball fault
44
A Oulmane AALakis amp N Mureithi
There are three main factors influencing the generalization of a network the size efficiency of the training data and the physical complexity of the problem at hand and the architecture of the network used [24]
All factors are equally important to overall classification performance of a network Learning
of different classes due to the complexity of classification andor an uneven number of training data from different classes is likely to be encountered in practice In an ideal case the number of training data should be equal with an ample and representative amount for each class
MLP networks can be trained by several methods but the most popular method is the error
backpropagation algorithm This algorithm uses a gradient-descent to update the weights of the network Although there are several methods to improve the rate of convergence of the error backpropagation the standard error backpropagation is used throughout this research in order to classify input signals in four classes To test the reliability of the learning process 100 signals per class (normal inner race outer race and ball fault) are fed to the training block then the classifier uses these training data to provide decision 8 Discussions and Results
The results of Time-Frequency Analysis are the Spectrogram (STFT) of the simulated normal and defective SKF 1211 bearing The output of Time-Frequency Analysis for each signal is an ntimesn matrix and represent by an image The Time-Frequency Analysis method provides a three dimensional representation of a signal Figures 7 8 9 and 10 show time-frequency representations with normal and defects fault located at different speed of the simulated classes
During classification the most significant fifteen Fourier Descriptors (This selection is justifiable by simple propertymdashmost of the information about the object boundary will be located in the low frequency part of the discrete Fourier transform) representing objects found in the Time-Frequency image are sent to the trained Neural Network block
Every training input vector is labeled with its corresponding feature class in binary
representation as indicated in table If a Pattern vector is classified as faulty or non-faulty bearing signal then its corresponding feature class is copied to the output image The remaining combinations can be considered are unknown or unclassified defect classes
45
A Oulmane AALakis amp N Mureithi
Objects
a)
b)
Objects
c)
Fig8 STFT image of the simulated Normal class at a) 600 rpm b) 1200 rpm and 1800 rpm
46
A Oulmane AALakis amp N Mureithi
a)
Objects
b)
Objects
c)
Fig9 STFT image of the simulated Ball fault class at a) 600 rpm b) 1200 rpm and 1800 rpm
47
A Oulmane AALakis amp N Mureithi
a)
b)
c)
Fig10 STFT image of the simulated Inner fault class at a) 600 rpm b) 1200 rpm and 1800 rpm
48
A Oulmane AALakis amp N Mureithi
Objects
a)
b)
c)
Fig11 STFT image of the simulated Outer fault class at a) 600 rpm b) 1200 rpm and 1800 rpm
49
A Oulmane AALakis amp N Mureithi
a)
b)
c)
d)
Fig12 Fourier descriptors of one object of STFT image at 600 rpm of a) Normal class b) Defect ball c)
Inner race defect d) Outer race defect
50
A Oulmane AALakis amp N Mureithi
As it was mentioned earlier the classifier uses the trained data to provide decision for this
reason when the training is complete the network performance is checked to determine if any changes need to be made to the training process the network architecture or the data sets Figure 12
Fig13 Training curve of the Neural Network Classifier
This figure doesnrsquot indicate any major problems with the training The validation and test curves are very similar After the network training and validation the network object is used to calculate the network response to input Fourier Descriptors vector of the simulated classes In this work Pattern recognition networks used are feedforward networks that can be trained to classify inputs according to target classes The target data for pattern recognition networks should consist of vectors of all zero values except for a 1 in element i where i is the class they are to represent
Defect Targets is an ntimesn matrix of associated class vectors defining which of four classes each input is assigned to Classes are represented by a 1 in row 1 2 3 or 4 1) Normal class 1 2) Defect class 2 3) Defect class 3 4) Defect class 4 Table 3 Binary representation of defect classes
Defect class Class Binary Representation
Normal class 1 0 0 0
Ball Defect 0 1 0 0
Inner race Defect 0 0 1 0
Outer race Defect 0 0 0 1
51
A Oulmane AALakis amp N Mureithi
The objective at this stage is to use this dictionary to classify the signals derived from distributions that give the best results for our case Based on the fact that the best distribution is the one that has the largest peak the image of the top three time-frequency distributions will be selected for this component and hence the dictionary is created
For a new product to verify whether or not the signal has a fault the process of detection is as follows first the signal is processed by the top three distributions retained In the second step a series of twelve Fourier descriptors should be found for every object in the time-frequency image These significant Fourier descriptors will be chosen as the elements of the pattern vector for description of the object and a comparison procedure will be implemented between the latter and the dictionary (only signals that correspond to the state of the bearing) to identify its state
Figure 14 indicates the successful classification of new added points used to evaluate the classifier The classification performance result using neural network and Fourier Descriptors is reported in Table 4 It is obvious that the classifier response correctly to all of the test and training data This appears to be an over-training problem However the goal was to create a system able to perform efficient classification with limited input cases in attempt to achieve the neural network training with a reduced number of case patterns
Fig 14 Classification of new added points ( )
Table 4 Classification performance result
Procedure Classification results
Normal class Correct decision
Ball Defect Correct decision
Inner race Defect Correct decision
Outer race Defect Correct decision
Healthy Class
52
A Oulmane AALakis amp N Mureithi
9 Conclusions
In this paper we proposed an automatic detection and diagnosis methods The results were displayed in grey images an important application of artificial neural network and Fourier Descriptors of Time-Frequency image for automatic defect classification using defect bearing signatures This method does not require extract further fault features such as eigenvalues or symptom parameters from timendashfrequency distributions before classification the fault diagnosis process is highly simplified The superior performance of the proposed method has been demonstrated using experimental setups The results obtained for this approach show that the classification of Fourier Descriptors of timendashfrequency images has been proved to have a high sensitivity as well as accuracy in detection localization and assessment of the faulty conditions of ball bearings 10 Acknowledgement
This research was supported by the collaborative research and development grant (NoCRDPJ-335472-05) of Natural Sciences and Engineering Research Council of Canada (NSERC) Pratt amp Whitney Canada Bombardier Aeronautics and National Research Council of Canada (NRC) References
1 Chow MY lsquoMethodologies of Using Neural Network and Fuzzy logic Technologies for Motor Incipient Fault Detectionrsquo World Scientific Publishing Company 1998
2 Xiong L Shi T Yang S and Rao R B K N lsquoA novel application of wavelet-based bispectrum analysis to diagnose faults in gearsrsquo International Journal of COMADEM 5 (2002) 31-38
3 Yang DM Stronach A F McConnell P and Penman J lsquoThird-order spectral techniques for the diagnosis of motor bearing condition using artificial neural networksrsquo Mechanical Systems and Signal Processing 16 (2002) 391-411
4 Chow T W S and Fei G lsquoThree phase induction machines asymmetrical faults identification using bispectrumrsquo IEEE Transactions on Energy Conversion 10 (1995) 688-693
5 Arthur N and Penman J lsquoInverter fed induction machine condition monitoring using the bispectrumrsquo in Proceedings of the IEEE Signal Processing Workshop on Higher-Order Statistics Banff Alta Canada (1997) pp 67-71
6 Li W Zhang G Shi T and Yang S lsquoGear crack early diagnosis using bispectrum diagonal slicersquo Chinese Journal of Mechanical Engineering (English Edition) 16 (2003) 193-196
7 Wang W J and McFadden P D lsquoEarly detection of gear failure by vibration analysis I Calculation of the time-frequency distributionrsquo Mechanical Systems and Signal Processing (1993) pp 193-203
8 Andrade F A Esat I and Badi M N M lsquoGearbox fault detection using statistical methods time-frequency methods (STFT and Wigner-Ville distribution) and harmonic wavelet - A comparative studyrsquo in Proceedings of COMADEM 99 Chipping Norton (1999) pp 77-85
9 Meng Q and Qu L lsquoRotating machinery fault diagnosis using Wigner distributionrsquo Mechanical Systems and Signal Processing (1991) pp 155-166
10 Baydar N and Ball A lsquoA comparative study of acoustic and vibration signals in detection of gear failures using Wigner-Ville distributionrsquo Mechanical Systems and Signal Processing (2001) pp 1091-1107
11 Cohen L lsquoTime-frequency distribution - a reviewrsquo Proceedings of the IEEE (1989) pp 941-981 12 Abad PL and Banks WJ lsquoNew LP based heuristics for the classification problemrsquo European Journal
of Operational Research 67 (1993) 88-100 13 Burke LL lsquoIntroduction to artificial neural systems for pattern recognitionrsquo Computers and Operations
Research 18 (1991) 211-220 14 Chen D and Wang W J lsquoClassification of Wavelet Map Patterns Using Multilayer Neural Networks
for Gear Fault Detectingrsquo Mechanical Systems and Signal Processing Vol 16 Issue 4 (2002) 695-704
53
A Oulmane AALakis amp N Mureithi
54
15 Li B Chow M Y Tipsuwan Y and Hung J ClsquoNeural Network Based Motor Rolling Bearing fault Diagnosisrsquo IEEE Transactions on Industriel Electronics (2000) Vol47 Issue 5 1060-1069
16 Paya B A Esat II and Badi MNM lsquoArtificial Neural Network Based Fault Diagnostics of Rotating Machinery Using Wavelet Transforms as a Preprocessorrsquo Mechanical Systems and Signal Processing Vol 11 Issue 5 (1997) 751-765
17 Rumelhart D E Hinton G E and Williams R J lsquoLearning representations by back-propagating errorsrsquo Neuro-computing foundations of research MIT Press Cambridge MA (1988) page 696-699
18 Milan S Valcav H and Roger B lsquoImage Processing Analysis and Machine Visionrsquo Chapman amp Hall computing series London First edition 1993
19 McElroy T Wilson E and Anspach G lsquoFourier descriptors and neural networks for shape classificationrsquo Acoustic Speech and Signal Processing ICASSP International conference on (1995) vol5 pp3435-3438
20 Minsky M L and Papert SA lsquoPerceptronrsquosrsquo Cambridge MA MIT Press 1969 21 McCulloch W S and Pitts W H lsquoA logical calculus of the ideas immanent in nervous activityrsquo
Bulletin of Mathematical Biophysics 5 (1943) 115-133 22 Turgeon F lsquoDesign drsquoun Squeeze Film Damper rapport techniquersquo Chaire industrielle
CRNSGEACLBWC Eacutecole Polytechnique de Montreacuteal 2007 23 Christian Komgom meacutemoire de maicirctrise lsquoDevelopment drsquoune proceacutedure intelligente de diagnostic des
deacutefauts de Roulement et eacutetude de lrsquoimpact du chemin de transmission du signal sur sa fiabiliteacutersquo Eacutecole Polytechnique de Montreacuteal 2008
24 Li B Chow M y Tipsuwan Y and Hung J C lsquoNeural-Network-Based Motor Rolling Bearing Fault Diagnosisrsquo IEEE Transaction on Industrial Electronics (2000)Vol 47 Issue 5 1060-1069

A Oulmane AALakis amp N Mureithi
6 Experiments 61 Data acquisition
In order to verify the practicability of the proposed method vibration signals were collected from a test rig lsquoSqueeze Film Damper (SFD)rsquo at Eacutecole Polytechnique de Montreacuteal The original design of the SFD [22] has been modified to allow the testing of a defective bearing The test setup is composed of a conical steel shaft supported at its ends by two rolling bearings The shaft is connected to the motor via a rigid coupling Bearing near the coupling is auto-aligning and it is mounted freely (can keep the angular misalignment permitted by the rigid coupling) The opposite housing contains the tested bearing Two accelerometers were used one mounted on each bearing housing (Figure 6) Signals were gathered at a sampling frequency of 32768 kHz for a period of 20 seconds while the shaft was running at different speed 1800 rpm 1500 rpm 1200rpm 900 rpm and 600 rpm [23]
Fig6 Test setup at Eacutecole Polytechnique de Montreacuteal
Fig6 Continued
Tested bearing
Tested bearing
43
A Oulmane AALakis amp N Mureithi
Table 1 Test Setup Characteristics
Components Technical Specifications
Motor 1 Hp 1750 rpm 60 Hz 12 amp
Coupling 78 po to 1 1 4 po
Bearing near coupling SKF 2310 E2RS1TN9
Tested bearing SKF 1211 EKTN9
Table 2 Fault frequency (Hz)
Model BPFOFR BPFIFR BSFFR
SKF 2310 E2RS1TN9
536 764 547
SKF 1211 EKTN9 868 113 739
7 Artificial Neural Network Defect Classifier using Fourier Descriptors
Most of the rotating machine fault phenomena (outer inner race and ball fault) behave in a nonlinear way meaning that the observed data describe a curve or curved subspace in the original data space Identifying such nonlinear manifolds becomes more and more important in the field of diagnostic Artificial Neural Networks (ANN) which used in this study can be used in numerous main tasks function approximation and classification Neural networks are nonlinear multivariable models built from a set of inputoutput data Generally there are 3 layers input hidden and output Each layer contains neurons that take a weighted sum of its inputs and applies a function to introduce nonlinearity For ANNs that nonlinear function generally is sigmoidal
Four different synthetic classes are considered to test the performance of the proposed intelligent system normal inner race outer race and ball fault (the size shape and depth of the defects performed on bearing components could not be controlled adequately The approach adopted for this purpose is by trial-error the component is damaged until the theoretical frequency of fault can be clearly distinguished)
a)
c)
b)
Fig7 Fault simulations on SKF 1211bearing a) outer race fault b) inner race fault and c) ball fault
44
A Oulmane AALakis amp N Mureithi
There are three main factors influencing the generalization of a network the size efficiency of the training data and the physical complexity of the problem at hand and the architecture of the network used [24]
All factors are equally important to overall classification performance of a network Learning
of different classes due to the complexity of classification andor an uneven number of training data from different classes is likely to be encountered in practice In an ideal case the number of training data should be equal with an ample and representative amount for each class
MLP networks can be trained by several methods but the most popular method is the error
backpropagation algorithm This algorithm uses a gradient-descent to update the weights of the network Although there are several methods to improve the rate of convergence of the error backpropagation the standard error backpropagation is used throughout this research in order to classify input signals in four classes To test the reliability of the learning process 100 signals per class (normal inner race outer race and ball fault) are fed to the training block then the classifier uses these training data to provide decision 8 Discussions and Results
The results of Time-Frequency Analysis are the Spectrogram (STFT) of the simulated normal and defective SKF 1211 bearing The output of Time-Frequency Analysis for each signal is an ntimesn matrix and represent by an image The Time-Frequency Analysis method provides a three dimensional representation of a signal Figures 7 8 9 and 10 show time-frequency representations with normal and defects fault located at different speed of the simulated classes
During classification the most significant fifteen Fourier Descriptors (This selection is justifiable by simple propertymdashmost of the information about the object boundary will be located in the low frequency part of the discrete Fourier transform) representing objects found in the Time-Frequency image are sent to the trained Neural Network block
Every training input vector is labeled with its corresponding feature class in binary
representation as indicated in table If a Pattern vector is classified as faulty or non-faulty bearing signal then its corresponding feature class is copied to the output image The remaining combinations can be considered are unknown or unclassified defect classes
45
A Oulmane AALakis amp N Mureithi
Objects
a)
b)
Objects
c)
Fig8 STFT image of the simulated Normal class at a) 600 rpm b) 1200 rpm and 1800 rpm
46
A Oulmane AALakis amp N Mureithi
a)
Objects
b)
Objects
c)
Fig9 STFT image of the simulated Ball fault class at a) 600 rpm b) 1200 rpm and 1800 rpm
47
A Oulmane AALakis amp N Mureithi
a)
b)
c)
Fig10 STFT image of the simulated Inner fault class at a) 600 rpm b) 1200 rpm and 1800 rpm
48
A Oulmane AALakis amp N Mureithi
Objects
a)
b)
c)
Fig11 STFT image of the simulated Outer fault class at a) 600 rpm b) 1200 rpm and 1800 rpm
49
A Oulmane AALakis amp N Mureithi
a)
b)
c)
d)
Fig12 Fourier descriptors of one object of STFT image at 600 rpm of a) Normal class b) Defect ball c)
Inner race defect d) Outer race defect
50
A Oulmane AALakis amp N Mureithi
As it was mentioned earlier the classifier uses the trained data to provide decision for this
reason when the training is complete the network performance is checked to determine if any changes need to be made to the training process the network architecture or the data sets Figure 12
Fig13 Training curve of the Neural Network Classifier
This figure doesnrsquot indicate any major problems with the training The validation and test curves are very similar After the network training and validation the network object is used to calculate the network response to input Fourier Descriptors vector of the simulated classes In this work Pattern recognition networks used are feedforward networks that can be trained to classify inputs according to target classes The target data for pattern recognition networks should consist of vectors of all zero values except for a 1 in element i where i is the class they are to represent
Defect Targets is an ntimesn matrix of associated class vectors defining which of four classes each input is assigned to Classes are represented by a 1 in row 1 2 3 or 4 1) Normal class 1 2) Defect class 2 3) Defect class 3 4) Defect class 4 Table 3 Binary representation of defect classes
Defect class Class Binary Representation
Normal class 1 0 0 0
Ball Defect 0 1 0 0
Inner race Defect 0 0 1 0
Outer race Defect 0 0 0 1
51
A Oulmane AALakis amp N Mureithi
The objective at this stage is to use this dictionary to classify the signals derived from distributions that give the best results for our case Based on the fact that the best distribution is the one that has the largest peak the image of the top three time-frequency distributions will be selected for this component and hence the dictionary is created
For a new product to verify whether or not the signal has a fault the process of detection is as follows first the signal is processed by the top three distributions retained In the second step a series of twelve Fourier descriptors should be found for every object in the time-frequency image These significant Fourier descriptors will be chosen as the elements of the pattern vector for description of the object and a comparison procedure will be implemented between the latter and the dictionary (only signals that correspond to the state of the bearing) to identify its state
Figure 14 indicates the successful classification of new added points used to evaluate the classifier The classification performance result using neural network and Fourier Descriptors is reported in Table 4 It is obvious that the classifier response correctly to all of the test and training data This appears to be an over-training problem However the goal was to create a system able to perform efficient classification with limited input cases in attempt to achieve the neural network training with a reduced number of case patterns
Fig 14 Classification of new added points ( )
Table 4 Classification performance result
Procedure Classification results
Normal class Correct decision
Ball Defect Correct decision
Inner race Defect Correct decision
Outer race Defect Correct decision
Healthy Class
52
A Oulmane AALakis amp N Mureithi
9 Conclusions
In this paper we proposed an automatic detection and diagnosis methods The results were displayed in grey images an important application of artificial neural network and Fourier Descriptors of Time-Frequency image for automatic defect classification using defect bearing signatures This method does not require extract further fault features such as eigenvalues or symptom parameters from timendashfrequency distributions before classification the fault diagnosis process is highly simplified The superior performance of the proposed method has been demonstrated using experimental setups The results obtained for this approach show that the classification of Fourier Descriptors of timendashfrequency images has been proved to have a high sensitivity as well as accuracy in detection localization and assessment of the faulty conditions of ball bearings 10 Acknowledgement
This research was supported by the collaborative research and development grant (NoCRDPJ-335472-05) of Natural Sciences and Engineering Research Council of Canada (NSERC) Pratt amp Whitney Canada Bombardier Aeronautics and National Research Council of Canada (NRC) References
1 Chow MY lsquoMethodologies of Using Neural Network and Fuzzy logic Technologies for Motor Incipient Fault Detectionrsquo World Scientific Publishing Company 1998
2 Xiong L Shi T Yang S and Rao R B K N lsquoA novel application of wavelet-based bispectrum analysis to diagnose faults in gearsrsquo International Journal of COMADEM 5 (2002) 31-38
3 Yang DM Stronach A F McConnell P and Penman J lsquoThird-order spectral techniques for the diagnosis of motor bearing condition using artificial neural networksrsquo Mechanical Systems and Signal Processing 16 (2002) 391-411
4 Chow T W S and Fei G lsquoThree phase induction machines asymmetrical faults identification using bispectrumrsquo IEEE Transactions on Energy Conversion 10 (1995) 688-693
5 Arthur N and Penman J lsquoInverter fed induction machine condition monitoring using the bispectrumrsquo in Proceedings of the IEEE Signal Processing Workshop on Higher-Order Statistics Banff Alta Canada (1997) pp 67-71
6 Li W Zhang G Shi T and Yang S lsquoGear crack early diagnosis using bispectrum diagonal slicersquo Chinese Journal of Mechanical Engineering (English Edition) 16 (2003) 193-196
7 Wang W J and McFadden P D lsquoEarly detection of gear failure by vibration analysis I Calculation of the time-frequency distributionrsquo Mechanical Systems and Signal Processing (1993) pp 193-203
8 Andrade F A Esat I and Badi M N M lsquoGearbox fault detection using statistical methods time-frequency methods (STFT and Wigner-Ville distribution) and harmonic wavelet - A comparative studyrsquo in Proceedings of COMADEM 99 Chipping Norton (1999) pp 77-85
9 Meng Q and Qu L lsquoRotating machinery fault diagnosis using Wigner distributionrsquo Mechanical Systems and Signal Processing (1991) pp 155-166
10 Baydar N and Ball A lsquoA comparative study of acoustic and vibration signals in detection of gear failures using Wigner-Ville distributionrsquo Mechanical Systems and Signal Processing (2001) pp 1091-1107
11 Cohen L lsquoTime-frequency distribution - a reviewrsquo Proceedings of the IEEE (1989) pp 941-981 12 Abad PL and Banks WJ lsquoNew LP based heuristics for the classification problemrsquo European Journal
of Operational Research 67 (1993) 88-100 13 Burke LL lsquoIntroduction to artificial neural systems for pattern recognitionrsquo Computers and Operations
Research 18 (1991) 211-220 14 Chen D and Wang W J lsquoClassification of Wavelet Map Patterns Using Multilayer Neural Networks
for Gear Fault Detectingrsquo Mechanical Systems and Signal Processing Vol 16 Issue 4 (2002) 695-704
53
A Oulmane AALakis amp N Mureithi
54
15 Li B Chow M Y Tipsuwan Y and Hung J ClsquoNeural Network Based Motor Rolling Bearing fault Diagnosisrsquo IEEE Transactions on Industriel Electronics (2000) Vol47 Issue 5 1060-1069
16 Paya B A Esat II and Badi MNM lsquoArtificial Neural Network Based Fault Diagnostics of Rotating Machinery Using Wavelet Transforms as a Preprocessorrsquo Mechanical Systems and Signal Processing Vol 11 Issue 5 (1997) 751-765
17 Rumelhart D E Hinton G E and Williams R J lsquoLearning representations by back-propagating errorsrsquo Neuro-computing foundations of research MIT Press Cambridge MA (1988) page 696-699
18 Milan S Valcav H and Roger B lsquoImage Processing Analysis and Machine Visionrsquo Chapman amp Hall computing series London First edition 1993
19 McElroy T Wilson E and Anspach G lsquoFourier descriptors and neural networks for shape classificationrsquo Acoustic Speech and Signal Processing ICASSP International conference on (1995) vol5 pp3435-3438
20 Minsky M L and Papert SA lsquoPerceptronrsquosrsquo Cambridge MA MIT Press 1969 21 McCulloch W S and Pitts W H lsquoA logical calculus of the ideas immanent in nervous activityrsquo
Bulletin of Mathematical Biophysics 5 (1943) 115-133 22 Turgeon F lsquoDesign drsquoun Squeeze Film Damper rapport techniquersquo Chaire industrielle
CRNSGEACLBWC Eacutecole Polytechnique de Montreacuteal 2007 23 Christian Komgom meacutemoire de maicirctrise lsquoDevelopment drsquoune proceacutedure intelligente de diagnostic des
deacutefauts de Roulement et eacutetude de lrsquoimpact du chemin de transmission du signal sur sa fiabiliteacutersquo Eacutecole Polytechnique de Montreacuteal 2008
24 Li B Chow M y Tipsuwan Y and Hung J C lsquoNeural-Network-Based Motor Rolling Bearing Fault Diagnosisrsquo IEEE Transaction on Industrial Electronics (2000)Vol 47 Issue 5 1060-1069
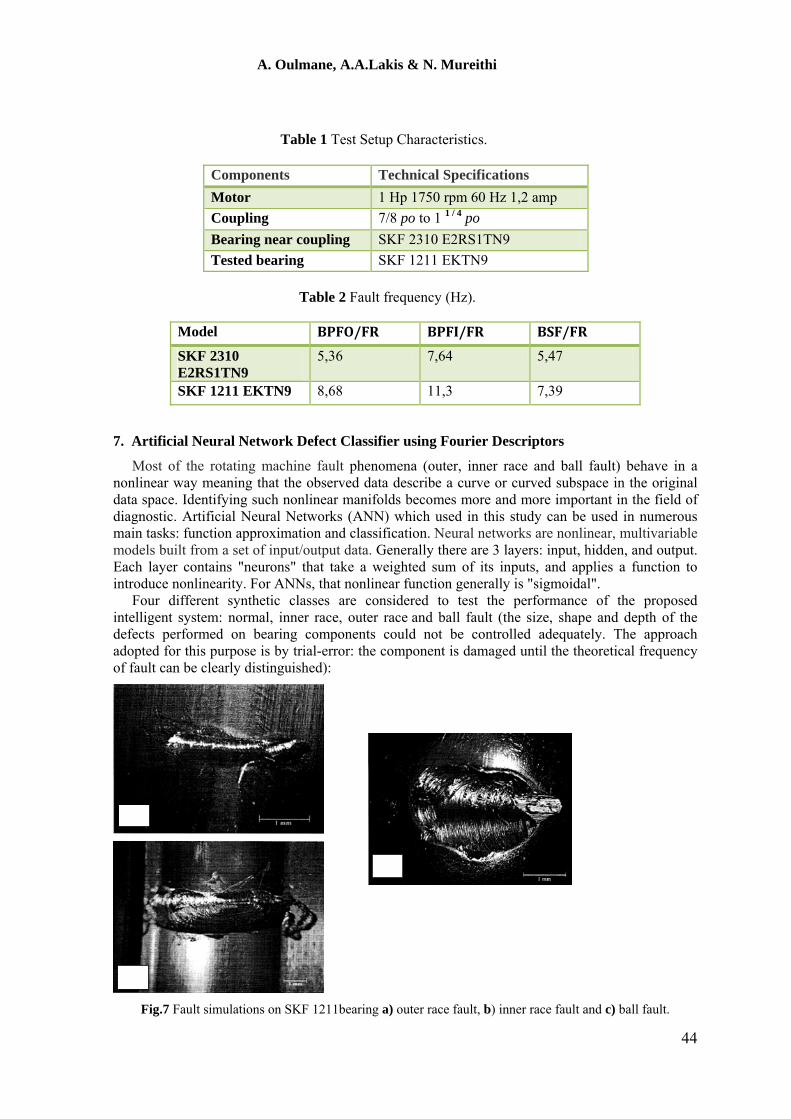
A Oulmane AALakis amp N Mureithi
Objects
a)
b)
Objects
c)
Fig8 STFT image of the simulated Normal class at a) 600 rpm b) 1200 rpm and 1800 rpm
46
A Oulmane AALakis amp N Mureithi
a)
Objects
b)
Objects
c)
Fig9 STFT image of the simulated Ball fault class at a) 600 rpm b) 1200 rpm and 1800 rpm
47
A Oulmane AALakis amp N Mureithi
a)
b)
c)
Fig10 STFT image of the simulated Inner fault class at a) 600 rpm b) 1200 rpm and 1800 rpm
48
A Oulmane AALakis amp N Mureithi
Objects
a)
b)
c)
Fig11 STFT image of the simulated Outer fault class at a) 600 rpm b) 1200 rpm and 1800 rpm
49
A Oulmane AALakis amp N Mureithi
a)
b)
c)
d)
Fig12 Fourier descriptors of one object of STFT image at 600 rpm of a) Normal class b) Defect ball c)
Inner race defect d) Outer race defect
50
A Oulmane AALakis amp N Mureithi
As it was mentioned earlier the classifier uses the trained data to provide decision for this
reason when the training is complete the network performance is checked to determine if any changes need to be made to the training process the network architecture or the data sets Figure 12
Fig13 Training curve of the Neural Network Classifier
This figure doesnrsquot indicate any major problems with the training The validation and test curves are very similar After the network training and validation the network object is used to calculate the network response to input Fourier Descriptors vector of the simulated classes In this work Pattern recognition networks used are feedforward networks that can be trained to classify inputs according to target classes The target data for pattern recognition networks should consist of vectors of all zero values except for a 1 in element i where i is the class they are to represent
Defect Targets is an ntimesn matrix of associated class vectors defining which of four classes each input is assigned to Classes are represented by a 1 in row 1 2 3 or 4 1) Normal class 1 2) Defect class 2 3) Defect class 3 4) Defect class 4 Table 3 Binary representation of defect classes
Defect class Class Binary Representation
Normal class 1 0 0 0
Ball Defect 0 1 0 0
Inner race Defect 0 0 1 0
Outer race Defect 0 0 0 1
51
A Oulmane AALakis amp N Mureithi
The objective at this stage is to use this dictionary to classify the signals derived from distributions that give the best results for our case Based on the fact that the best distribution is the one that has the largest peak the image of the top three time-frequency distributions will be selected for this component and hence the dictionary is created
For a new product to verify whether or not the signal has a fault the process of detection is as follows first the signal is processed by the top three distributions retained In the second step a series of twelve Fourier descriptors should be found for every object in the time-frequency image These significant Fourier descriptors will be chosen as the elements of the pattern vector for description of the object and a comparison procedure will be implemented between the latter and the dictionary (only signals that correspond to the state of the bearing) to identify its state
Figure 14 indicates the successful classification of new added points used to evaluate the classifier The classification performance result using neural network and Fourier Descriptors is reported in Table 4 It is obvious that the classifier response correctly to all of the test and training data This appears to be an over-training problem However the goal was to create a system able to perform efficient classification with limited input cases in attempt to achieve the neural network training with a reduced number of case patterns
Fig 14 Classification of new added points ( )
Table 4 Classification performance result
Procedure Classification results
Normal class Correct decision
Ball Defect Correct decision
Inner race Defect Correct decision
Outer race Defect Correct decision
Healthy Class
52
A Oulmane AALakis amp N Mureithi
9 Conclusions
In this paper we proposed an automatic detection and diagnosis methods The results were displayed in grey images an important application of artificial neural network and Fourier Descriptors of Time-Frequency image for automatic defect classification using defect bearing signatures This method does not require extract further fault features such as eigenvalues or symptom parameters from timendashfrequency distributions before classification the fault diagnosis process is highly simplified The superior performance of the proposed method has been demonstrated using experimental setups The results obtained for this approach show that the classification of Fourier Descriptors of timendashfrequency images has been proved to have a high sensitivity as well as accuracy in detection localization and assessment of the faulty conditions of ball bearings 10 Acknowledgement
This research was supported by the collaborative research and development grant (NoCRDPJ-335472-05) of Natural Sciences and Engineering Research Council of Canada (NSERC) Pratt amp Whitney Canada Bombardier Aeronautics and National Research Council of Canada (NRC) References
1 Chow MY lsquoMethodologies of Using Neural Network and Fuzzy logic Technologies for Motor Incipient Fault Detectionrsquo World Scientific Publishing Company 1998
2 Xiong L Shi T Yang S and Rao R B K N lsquoA novel application of wavelet-based bispectrum analysis to diagnose faults in gearsrsquo International Journal of COMADEM 5 (2002) 31-38
3 Yang DM Stronach A F McConnell P and Penman J lsquoThird-order spectral techniques for the diagnosis of motor bearing condition using artificial neural networksrsquo Mechanical Systems and Signal Processing 16 (2002) 391-411
4 Chow T W S and Fei G lsquoThree phase induction machines asymmetrical faults identification using bispectrumrsquo IEEE Transactions on Energy Conversion 10 (1995) 688-693
5 Arthur N and Penman J lsquoInverter fed induction machine condition monitoring using the bispectrumrsquo in Proceedings of the IEEE Signal Processing Workshop on Higher-Order Statistics Banff Alta Canada (1997) pp 67-71
6 Li W Zhang G Shi T and Yang S lsquoGear crack early diagnosis using bispectrum diagonal slicersquo Chinese Journal of Mechanical Engineering (English Edition) 16 (2003) 193-196
7 Wang W J and McFadden P D lsquoEarly detection of gear failure by vibration analysis I Calculation of the time-frequency distributionrsquo Mechanical Systems and Signal Processing (1993) pp 193-203
8 Andrade F A Esat I and Badi M N M lsquoGearbox fault detection using statistical methods time-frequency methods (STFT and Wigner-Ville distribution) and harmonic wavelet - A comparative studyrsquo in Proceedings of COMADEM 99 Chipping Norton (1999) pp 77-85
9 Meng Q and Qu L lsquoRotating machinery fault diagnosis using Wigner distributionrsquo Mechanical Systems and Signal Processing (1991) pp 155-166
10 Baydar N and Ball A lsquoA comparative study of acoustic and vibration signals in detection of gear failures using Wigner-Ville distributionrsquo Mechanical Systems and Signal Processing (2001) pp 1091-1107
11 Cohen L lsquoTime-frequency distribution - a reviewrsquo Proceedings of the IEEE (1989) pp 941-981 12 Abad PL and Banks WJ lsquoNew LP based heuristics for the classification problemrsquo European Journal
of Operational Research 67 (1993) 88-100 13 Burke LL lsquoIntroduction to artificial neural systems for pattern recognitionrsquo Computers and Operations
Research 18 (1991) 211-220 14 Chen D and Wang W J lsquoClassification of Wavelet Map Patterns Using Multilayer Neural Networks
for Gear Fault Detectingrsquo Mechanical Systems and Signal Processing Vol 16 Issue 4 (2002) 695-704
53
A Oulmane AALakis amp N Mureithi
54
15 Li B Chow M Y Tipsuwan Y and Hung J ClsquoNeural Network Based Motor Rolling Bearing fault Diagnosisrsquo IEEE Transactions on Industriel Electronics (2000) Vol47 Issue 5 1060-1069
16 Paya B A Esat II and Badi MNM lsquoArtificial Neural Network Based Fault Diagnostics of Rotating Machinery Using Wavelet Transforms as a Preprocessorrsquo Mechanical Systems and Signal Processing Vol 11 Issue 5 (1997) 751-765
17 Rumelhart D E Hinton G E and Williams R J lsquoLearning representations by back-propagating errorsrsquo Neuro-computing foundations of research MIT Press Cambridge MA (1988) page 696-699
18 Milan S Valcav H and Roger B lsquoImage Processing Analysis and Machine Visionrsquo Chapman amp Hall computing series London First edition 1993
19 McElroy T Wilson E and Anspach G lsquoFourier descriptors and neural networks for shape classificationrsquo Acoustic Speech and Signal Processing ICASSP International conference on (1995) vol5 pp3435-3438
20 Minsky M L and Papert SA lsquoPerceptronrsquosrsquo Cambridge MA MIT Press 1969 21 McCulloch W S and Pitts W H lsquoA logical calculus of the ideas immanent in nervous activityrsquo
Bulletin of Mathematical Biophysics 5 (1943) 115-133 22 Turgeon F lsquoDesign drsquoun Squeeze Film Damper rapport techniquersquo Chaire industrielle
CRNSGEACLBWC Eacutecole Polytechnique de Montreacuteal 2007 23 Christian Komgom meacutemoire de maicirctrise lsquoDevelopment drsquoune proceacutedure intelligente de diagnostic des
deacutefauts de Roulement et eacutetude de lrsquoimpact du chemin de transmission du signal sur sa fiabiliteacutersquo Eacutecole Polytechnique de Montreacuteal 2008
24 Li B Chow M y Tipsuwan Y and Hung J C lsquoNeural-Network-Based Motor Rolling Bearing Fault Diagnosisrsquo IEEE Transaction on Industrial Electronics (2000)Vol 47 Issue 5 1060-1069

A Oulmane AALakis amp N Mureithi
a)
Objects
b)
Objects
c)
Fig9 STFT image of the simulated Ball fault class at a) 600 rpm b) 1200 rpm and 1800 rpm
47
A Oulmane AALakis amp N Mureithi
a)
b)
c)
Fig10 STFT image of the simulated Inner fault class at a) 600 rpm b) 1200 rpm and 1800 rpm
48
A Oulmane AALakis amp N Mureithi
Objects
a)
b)
c)
Fig11 STFT image of the simulated Outer fault class at a) 600 rpm b) 1200 rpm and 1800 rpm
49
A Oulmane AALakis amp N Mureithi
a)
b)
c)
d)
Fig12 Fourier descriptors of one object of STFT image at 600 rpm of a) Normal class b) Defect ball c)
Inner race defect d) Outer race defect
50
A Oulmane AALakis amp N Mureithi
As it was mentioned earlier the classifier uses the trained data to provide decision for this
reason when the training is complete the network performance is checked to determine if any changes need to be made to the training process the network architecture or the data sets Figure 12
Fig13 Training curve of the Neural Network Classifier
This figure doesnrsquot indicate any major problems with the training The validation and test curves are very similar After the network training and validation the network object is used to calculate the network response to input Fourier Descriptors vector of the simulated classes In this work Pattern recognition networks used are feedforward networks that can be trained to classify inputs according to target classes The target data for pattern recognition networks should consist of vectors of all zero values except for a 1 in element i where i is the class they are to represent
Defect Targets is an ntimesn matrix of associated class vectors defining which of four classes each input is assigned to Classes are represented by a 1 in row 1 2 3 or 4 1) Normal class 1 2) Defect class 2 3) Defect class 3 4) Defect class 4 Table 3 Binary representation of defect classes
Defect class Class Binary Representation
Normal class 1 0 0 0
Ball Defect 0 1 0 0
Inner race Defect 0 0 1 0
Outer race Defect 0 0 0 1
51
A Oulmane AALakis amp N Mureithi
The objective at this stage is to use this dictionary to classify the signals derived from distributions that give the best results for our case Based on the fact that the best distribution is the one that has the largest peak the image of the top three time-frequency distributions will be selected for this component and hence the dictionary is created
For a new product to verify whether or not the signal has a fault the process of detection is as follows first the signal is processed by the top three distributions retained In the second step a series of twelve Fourier descriptors should be found for every object in the time-frequency image These significant Fourier descriptors will be chosen as the elements of the pattern vector for description of the object and a comparison procedure will be implemented between the latter and the dictionary (only signals that correspond to the state of the bearing) to identify its state
Figure 14 indicates the successful classification of new added points used to evaluate the classifier The classification performance result using neural network and Fourier Descriptors is reported in Table 4 It is obvious that the classifier response correctly to all of the test and training data This appears to be an over-training problem However the goal was to create a system able to perform efficient classification with limited input cases in attempt to achieve the neural network training with a reduced number of case patterns
Fig 14 Classification of new added points ( )
Table 4 Classification performance result
Procedure Classification results
Normal class Correct decision
Ball Defect Correct decision
Inner race Defect Correct decision
Outer race Defect Correct decision
Healthy Class
52
A Oulmane AALakis amp N Mureithi
9 Conclusions
In this paper we proposed an automatic detection and diagnosis methods The results were displayed in grey images an important application of artificial neural network and Fourier Descriptors of Time-Frequency image for automatic defect classification using defect bearing signatures This method does not require extract further fault features such as eigenvalues or symptom parameters from timendashfrequency distributions before classification the fault diagnosis process is highly simplified The superior performance of the proposed method has been demonstrated using experimental setups The results obtained for this approach show that the classification of Fourier Descriptors of timendashfrequency images has been proved to have a high sensitivity as well as accuracy in detection localization and assessment of the faulty conditions of ball bearings 10 Acknowledgement
This research was supported by the collaborative research and development grant (NoCRDPJ-335472-05) of Natural Sciences and Engineering Research Council of Canada (NSERC) Pratt amp Whitney Canada Bombardier Aeronautics and National Research Council of Canada (NRC) References
1 Chow MY lsquoMethodologies of Using Neural Network and Fuzzy logic Technologies for Motor Incipient Fault Detectionrsquo World Scientific Publishing Company 1998
2 Xiong L Shi T Yang S and Rao R B K N lsquoA novel application of wavelet-based bispectrum analysis to diagnose faults in gearsrsquo International Journal of COMADEM 5 (2002) 31-38
3 Yang DM Stronach A F McConnell P and Penman J lsquoThird-order spectral techniques for the diagnosis of motor bearing condition using artificial neural networksrsquo Mechanical Systems and Signal Processing 16 (2002) 391-411
4 Chow T W S and Fei G lsquoThree phase induction machines asymmetrical faults identification using bispectrumrsquo IEEE Transactions on Energy Conversion 10 (1995) 688-693
5 Arthur N and Penman J lsquoInverter fed induction machine condition monitoring using the bispectrumrsquo in Proceedings of the IEEE Signal Processing Workshop on Higher-Order Statistics Banff Alta Canada (1997) pp 67-71
6 Li W Zhang G Shi T and Yang S lsquoGear crack early diagnosis using bispectrum diagonal slicersquo Chinese Journal of Mechanical Engineering (English Edition) 16 (2003) 193-196
7 Wang W J and McFadden P D lsquoEarly detection of gear failure by vibration analysis I Calculation of the time-frequency distributionrsquo Mechanical Systems and Signal Processing (1993) pp 193-203
8 Andrade F A Esat I and Badi M N M lsquoGearbox fault detection using statistical methods time-frequency methods (STFT and Wigner-Ville distribution) and harmonic wavelet - A comparative studyrsquo in Proceedings of COMADEM 99 Chipping Norton (1999) pp 77-85
9 Meng Q and Qu L lsquoRotating machinery fault diagnosis using Wigner distributionrsquo Mechanical Systems and Signal Processing (1991) pp 155-166
10 Baydar N and Ball A lsquoA comparative study of acoustic and vibration signals in detection of gear failures using Wigner-Ville distributionrsquo Mechanical Systems and Signal Processing (2001) pp 1091-1107
11 Cohen L lsquoTime-frequency distribution - a reviewrsquo Proceedings of the IEEE (1989) pp 941-981 12 Abad PL and Banks WJ lsquoNew LP based heuristics for the classification problemrsquo European Journal
of Operational Research 67 (1993) 88-100 13 Burke LL lsquoIntroduction to artificial neural systems for pattern recognitionrsquo Computers and Operations
Research 18 (1991) 211-220 14 Chen D and Wang W J lsquoClassification of Wavelet Map Patterns Using Multilayer Neural Networks
for Gear Fault Detectingrsquo Mechanical Systems and Signal Processing Vol 16 Issue 4 (2002) 695-704
53
A Oulmane AALakis amp N Mureithi
54
15 Li B Chow M Y Tipsuwan Y and Hung J ClsquoNeural Network Based Motor Rolling Bearing fault Diagnosisrsquo IEEE Transactions on Industriel Electronics (2000) Vol47 Issue 5 1060-1069
16 Paya B A Esat II and Badi MNM lsquoArtificial Neural Network Based Fault Diagnostics of Rotating Machinery Using Wavelet Transforms as a Preprocessorrsquo Mechanical Systems and Signal Processing Vol 11 Issue 5 (1997) 751-765
17 Rumelhart D E Hinton G E and Williams R J lsquoLearning representations by back-propagating errorsrsquo Neuro-computing foundations of research MIT Press Cambridge MA (1988) page 696-699
18 Milan S Valcav H and Roger B lsquoImage Processing Analysis and Machine Visionrsquo Chapman amp Hall computing series London First edition 1993
19 McElroy T Wilson E and Anspach G lsquoFourier descriptors and neural networks for shape classificationrsquo Acoustic Speech and Signal Processing ICASSP International conference on (1995) vol5 pp3435-3438
20 Minsky M L and Papert SA lsquoPerceptronrsquosrsquo Cambridge MA MIT Press 1969 21 McCulloch W S and Pitts W H lsquoA logical calculus of the ideas immanent in nervous activityrsquo
Bulletin of Mathematical Biophysics 5 (1943) 115-133 22 Turgeon F lsquoDesign drsquoun Squeeze Film Damper rapport techniquersquo Chaire industrielle
CRNSGEACLBWC Eacutecole Polytechnique de Montreacuteal 2007 23 Christian Komgom meacutemoire de maicirctrise lsquoDevelopment drsquoune proceacutedure intelligente de diagnostic des
deacutefauts de Roulement et eacutetude de lrsquoimpact du chemin de transmission du signal sur sa fiabiliteacutersquo Eacutecole Polytechnique de Montreacuteal 2008
24 Li B Chow M y Tipsuwan Y and Hung J C lsquoNeural-Network-Based Motor Rolling Bearing Fault Diagnosisrsquo IEEE Transaction on Industrial Electronics (2000)Vol 47 Issue 5 1060-1069

A Oulmane AALakis amp N Mureithi
a)
b)
c)
Fig10 STFT image of the simulated Inner fault class at a) 600 rpm b) 1200 rpm and 1800 rpm
48
A Oulmane AALakis amp N Mureithi
Objects
a)
b)
c)
Fig11 STFT image of the simulated Outer fault class at a) 600 rpm b) 1200 rpm and 1800 rpm
49
A Oulmane AALakis amp N Mureithi
a)
b)
c)
d)
Fig12 Fourier descriptors of one object of STFT image at 600 rpm of a) Normal class b) Defect ball c)
Inner race defect d) Outer race defect
50
A Oulmane AALakis amp N Mureithi
As it was mentioned earlier the classifier uses the trained data to provide decision for this
reason when the training is complete the network performance is checked to determine if any changes need to be made to the training process the network architecture or the data sets Figure 12
Fig13 Training curve of the Neural Network Classifier
This figure doesnrsquot indicate any major problems with the training The validation and test curves are very similar After the network training and validation the network object is used to calculate the network response to input Fourier Descriptors vector of the simulated classes In this work Pattern recognition networks used are feedforward networks that can be trained to classify inputs according to target classes The target data for pattern recognition networks should consist of vectors of all zero values except for a 1 in element i where i is the class they are to represent
Defect Targets is an ntimesn matrix of associated class vectors defining which of four classes each input is assigned to Classes are represented by a 1 in row 1 2 3 or 4 1) Normal class 1 2) Defect class 2 3) Defect class 3 4) Defect class 4 Table 3 Binary representation of defect classes
Defect class Class Binary Representation
Normal class 1 0 0 0
Ball Defect 0 1 0 0
Inner race Defect 0 0 1 0
Outer race Defect 0 0 0 1
51
A Oulmane AALakis amp N Mureithi
The objective at this stage is to use this dictionary to classify the signals derived from distributions that give the best results for our case Based on the fact that the best distribution is the one that has the largest peak the image of the top three time-frequency distributions will be selected for this component and hence the dictionary is created
For a new product to verify whether or not the signal has a fault the process of detection is as follows first the signal is processed by the top three distributions retained In the second step a series of twelve Fourier descriptors should be found for every object in the time-frequency image These significant Fourier descriptors will be chosen as the elements of the pattern vector for description of the object and a comparison procedure will be implemented between the latter and the dictionary (only signals that correspond to the state of the bearing) to identify its state
Figure 14 indicates the successful classification of new added points used to evaluate the classifier The classification performance result using neural network and Fourier Descriptors is reported in Table 4 It is obvious that the classifier response correctly to all of the test and training data This appears to be an over-training problem However the goal was to create a system able to perform efficient classification with limited input cases in attempt to achieve the neural network training with a reduced number of case patterns
Fig 14 Classification of new added points ( )
Table 4 Classification performance result
Procedure Classification results
Normal class Correct decision
Ball Defect Correct decision
Inner race Defect Correct decision
Outer race Defect Correct decision
Healthy Class
52
A Oulmane AALakis amp N Mureithi
9 Conclusions
In this paper we proposed an automatic detection and diagnosis methods The results were displayed in grey images an important application of artificial neural network and Fourier Descriptors of Time-Frequency image for automatic defect classification using defect bearing signatures This method does not require extract further fault features such as eigenvalues or symptom parameters from timendashfrequency distributions before classification the fault diagnosis process is highly simplified The superior performance of the proposed method has been demonstrated using experimental setups The results obtained for this approach show that the classification of Fourier Descriptors of timendashfrequency images has been proved to have a high sensitivity as well as accuracy in detection localization and assessment of the faulty conditions of ball bearings 10 Acknowledgement
This research was supported by the collaborative research and development grant (NoCRDPJ-335472-05) of Natural Sciences and Engineering Research Council of Canada (NSERC) Pratt amp Whitney Canada Bombardier Aeronautics and National Research Council of Canada (NRC) References
1 Chow MY lsquoMethodologies of Using Neural Network and Fuzzy logic Technologies for Motor Incipient Fault Detectionrsquo World Scientific Publishing Company 1998
2 Xiong L Shi T Yang S and Rao R B K N lsquoA novel application of wavelet-based bispectrum analysis to diagnose faults in gearsrsquo International Journal of COMADEM 5 (2002) 31-38
3 Yang DM Stronach A F McConnell P and Penman J lsquoThird-order spectral techniques for the diagnosis of motor bearing condition using artificial neural networksrsquo Mechanical Systems and Signal Processing 16 (2002) 391-411
4 Chow T W S and Fei G lsquoThree phase induction machines asymmetrical faults identification using bispectrumrsquo IEEE Transactions on Energy Conversion 10 (1995) 688-693
5 Arthur N and Penman J lsquoInverter fed induction machine condition monitoring using the bispectrumrsquo in Proceedings of the IEEE Signal Processing Workshop on Higher-Order Statistics Banff Alta Canada (1997) pp 67-71
6 Li W Zhang G Shi T and Yang S lsquoGear crack early diagnosis using bispectrum diagonal slicersquo Chinese Journal of Mechanical Engineering (English Edition) 16 (2003) 193-196
7 Wang W J and McFadden P D lsquoEarly detection of gear failure by vibration analysis I Calculation of the time-frequency distributionrsquo Mechanical Systems and Signal Processing (1993) pp 193-203
8 Andrade F A Esat I and Badi M N M lsquoGearbox fault detection using statistical methods time-frequency methods (STFT and Wigner-Ville distribution) and harmonic wavelet - A comparative studyrsquo in Proceedings of COMADEM 99 Chipping Norton (1999) pp 77-85
9 Meng Q and Qu L lsquoRotating machinery fault diagnosis using Wigner distributionrsquo Mechanical Systems and Signal Processing (1991) pp 155-166
10 Baydar N and Ball A lsquoA comparative study of acoustic and vibration signals in detection of gear failures using Wigner-Ville distributionrsquo Mechanical Systems and Signal Processing (2001) pp 1091-1107
11 Cohen L lsquoTime-frequency distribution - a reviewrsquo Proceedings of the IEEE (1989) pp 941-981 12 Abad PL and Banks WJ lsquoNew LP based heuristics for the classification problemrsquo European Journal
of Operational Research 67 (1993) 88-100 13 Burke LL lsquoIntroduction to artificial neural systems for pattern recognitionrsquo Computers and Operations
Research 18 (1991) 211-220 14 Chen D and Wang W J lsquoClassification of Wavelet Map Patterns Using Multilayer Neural Networks
for Gear Fault Detectingrsquo Mechanical Systems and Signal Processing Vol 16 Issue 4 (2002) 695-704
53
A Oulmane AALakis amp N Mureithi
54
15 Li B Chow M Y Tipsuwan Y and Hung J ClsquoNeural Network Based Motor Rolling Bearing fault Diagnosisrsquo IEEE Transactions on Industriel Electronics (2000) Vol47 Issue 5 1060-1069
16 Paya B A Esat II and Badi MNM lsquoArtificial Neural Network Based Fault Diagnostics of Rotating Machinery Using Wavelet Transforms as a Preprocessorrsquo Mechanical Systems and Signal Processing Vol 11 Issue 5 (1997) 751-765
17 Rumelhart D E Hinton G E and Williams R J lsquoLearning representations by back-propagating errorsrsquo Neuro-computing foundations of research MIT Press Cambridge MA (1988) page 696-699
18 Milan S Valcav H and Roger B lsquoImage Processing Analysis and Machine Visionrsquo Chapman amp Hall computing series London First edition 1993
19 McElroy T Wilson E and Anspach G lsquoFourier descriptors and neural networks for shape classificationrsquo Acoustic Speech and Signal Processing ICASSP International conference on (1995) vol5 pp3435-3438
20 Minsky M L and Papert SA lsquoPerceptronrsquosrsquo Cambridge MA MIT Press 1969 21 McCulloch W S and Pitts W H lsquoA logical calculus of the ideas immanent in nervous activityrsquo
Bulletin of Mathematical Biophysics 5 (1943) 115-133 22 Turgeon F lsquoDesign drsquoun Squeeze Film Damper rapport techniquersquo Chaire industrielle
CRNSGEACLBWC Eacutecole Polytechnique de Montreacuteal 2007 23 Christian Komgom meacutemoire de maicirctrise lsquoDevelopment drsquoune proceacutedure intelligente de diagnostic des
deacutefauts de Roulement et eacutetude de lrsquoimpact du chemin de transmission du signal sur sa fiabiliteacutersquo Eacutecole Polytechnique de Montreacuteal 2008
24 Li B Chow M y Tipsuwan Y and Hung J C lsquoNeural-Network-Based Motor Rolling Bearing Fault Diagnosisrsquo IEEE Transaction on Industrial Electronics (2000)Vol 47 Issue 5 1060-1069

A Oulmane AALakis amp N Mureithi
a)
b)
c)
d)
Fig12 Fourier descriptors of one object of STFT image at 600 rpm of a) Normal class b) Defect ball c)
Inner race defect d) Outer race defect
50
A Oulmane AALakis amp N Mureithi
As it was mentioned earlier the classifier uses the trained data to provide decision for this
reason when the training is complete the network performance is checked to determine if any changes need to be made to the training process the network architecture or the data sets Figure 12
Fig13 Training curve of the Neural Network Classifier
This figure doesnrsquot indicate any major problems with the training The validation and test curves are very similar After the network training and validation the network object is used to calculate the network response to input Fourier Descriptors vector of the simulated classes In this work Pattern recognition networks used are feedforward networks that can be trained to classify inputs according to target classes The target data for pattern recognition networks should consist of vectors of all zero values except for a 1 in element i where i is the class they are to represent
Defect Targets is an ntimesn matrix of associated class vectors defining which of four classes each input is assigned to Classes are represented by a 1 in row 1 2 3 or 4 1) Normal class 1 2) Defect class 2 3) Defect class 3 4) Defect class 4 Table 3 Binary representation of defect classes
Defect class Class Binary Representation
Normal class 1 0 0 0
Ball Defect 0 1 0 0
Inner race Defect 0 0 1 0
Outer race Defect 0 0 0 1
51
A Oulmane AALakis amp N Mureithi
The objective at this stage is to use this dictionary to classify the signals derived from distributions that give the best results for our case Based on the fact that the best distribution is the one that has the largest peak the image of the top three time-frequency distributions will be selected for this component and hence the dictionary is created
For a new product to verify whether or not the signal has a fault the process of detection is as follows first the signal is processed by the top three distributions retained In the second step a series of twelve Fourier descriptors should be found for every object in the time-frequency image These significant Fourier descriptors will be chosen as the elements of the pattern vector for description of the object and a comparison procedure will be implemented between the latter and the dictionary (only signals that correspond to the state of the bearing) to identify its state
Figure 14 indicates the successful classification of new added points used to evaluate the classifier The classification performance result using neural network and Fourier Descriptors is reported in Table 4 It is obvious that the classifier response correctly to all of the test and training data This appears to be an over-training problem However the goal was to create a system able to perform efficient classification with limited input cases in attempt to achieve the neural network training with a reduced number of case patterns
Fig 14 Classification of new added points ( )
Table 4 Classification performance result
Procedure Classification results
Normal class Correct decision
Ball Defect Correct decision
Inner race Defect Correct decision
Outer race Defect Correct decision
Healthy Class
52
A Oulmane AALakis amp N Mureithi
9 Conclusions
In this paper we proposed an automatic detection and diagnosis methods The results were displayed in grey images an important application of artificial neural network and Fourier Descriptors of Time-Frequency image for automatic defect classification using defect bearing signatures This method does not require extract further fault features such as eigenvalues or symptom parameters from timendashfrequency distributions before classification the fault diagnosis process is highly simplified The superior performance of the proposed method has been demonstrated using experimental setups The results obtained for this approach show that the classification of Fourier Descriptors of timendashfrequency images has been proved to have a high sensitivity as well as accuracy in detection localization and assessment of the faulty conditions of ball bearings 10 Acknowledgement
This research was supported by the collaborative research and development grant (NoCRDPJ-335472-05) of Natural Sciences and Engineering Research Council of Canada (NSERC) Pratt amp Whitney Canada Bombardier Aeronautics and National Research Council of Canada (NRC) References
1 Chow MY lsquoMethodologies of Using Neural Network and Fuzzy logic Technologies for Motor Incipient Fault Detectionrsquo World Scientific Publishing Company 1998
2 Xiong L Shi T Yang S and Rao R B K N lsquoA novel application of wavelet-based bispectrum analysis to diagnose faults in gearsrsquo International Journal of COMADEM 5 (2002) 31-38
3 Yang DM Stronach A F McConnell P and Penman J lsquoThird-order spectral techniques for the diagnosis of motor bearing condition using artificial neural networksrsquo Mechanical Systems and Signal Processing 16 (2002) 391-411
4 Chow T W S and Fei G lsquoThree phase induction machines asymmetrical faults identification using bispectrumrsquo IEEE Transactions on Energy Conversion 10 (1995) 688-693
5 Arthur N and Penman J lsquoInverter fed induction machine condition monitoring using the bispectrumrsquo in Proceedings of the IEEE Signal Processing Workshop on Higher-Order Statistics Banff Alta Canada (1997) pp 67-71
6 Li W Zhang G Shi T and Yang S lsquoGear crack early diagnosis using bispectrum diagonal slicersquo Chinese Journal of Mechanical Engineering (English Edition) 16 (2003) 193-196
7 Wang W J and McFadden P D lsquoEarly detection of gear failure by vibration analysis I Calculation of the time-frequency distributionrsquo Mechanical Systems and Signal Processing (1993) pp 193-203
8 Andrade F A Esat I and Badi M N M lsquoGearbox fault detection using statistical methods time-frequency methods (STFT and Wigner-Ville distribution) and harmonic wavelet - A comparative studyrsquo in Proceedings of COMADEM 99 Chipping Norton (1999) pp 77-85
9 Meng Q and Qu L lsquoRotating machinery fault diagnosis using Wigner distributionrsquo Mechanical Systems and Signal Processing (1991) pp 155-166
10 Baydar N and Ball A lsquoA comparative study of acoustic and vibration signals in detection of gear failures using Wigner-Ville distributionrsquo Mechanical Systems and Signal Processing (2001) pp 1091-1107
11 Cohen L lsquoTime-frequency distribution - a reviewrsquo Proceedings of the IEEE (1989) pp 941-981 12 Abad PL and Banks WJ lsquoNew LP based heuristics for the classification problemrsquo European Journal
of Operational Research 67 (1993) 88-100 13 Burke LL lsquoIntroduction to artificial neural systems for pattern recognitionrsquo Computers and Operations
Research 18 (1991) 211-220 14 Chen D and Wang W J lsquoClassification of Wavelet Map Patterns Using Multilayer Neural Networks
for Gear Fault Detectingrsquo Mechanical Systems and Signal Processing Vol 16 Issue 4 (2002) 695-704
53
A Oulmane AALakis amp N Mureithi
54
15 Li B Chow M Y Tipsuwan Y and Hung J ClsquoNeural Network Based Motor Rolling Bearing fault Diagnosisrsquo IEEE Transactions on Industriel Electronics (2000) Vol47 Issue 5 1060-1069
16 Paya B A Esat II and Badi MNM lsquoArtificial Neural Network Based Fault Diagnostics of Rotating Machinery Using Wavelet Transforms as a Preprocessorrsquo Mechanical Systems and Signal Processing Vol 11 Issue 5 (1997) 751-765
17 Rumelhart D E Hinton G E and Williams R J lsquoLearning representations by back-propagating errorsrsquo Neuro-computing foundations of research MIT Press Cambridge MA (1988) page 696-699
18 Milan S Valcav H and Roger B lsquoImage Processing Analysis and Machine Visionrsquo Chapman amp Hall computing series London First edition 1993
19 McElroy T Wilson E and Anspach G lsquoFourier descriptors and neural networks for shape classificationrsquo Acoustic Speech and Signal Processing ICASSP International conference on (1995) vol5 pp3435-3438
20 Minsky M L and Papert SA lsquoPerceptronrsquosrsquo Cambridge MA MIT Press 1969 21 McCulloch W S and Pitts W H lsquoA logical calculus of the ideas immanent in nervous activityrsquo
Bulletin of Mathematical Biophysics 5 (1943) 115-133 22 Turgeon F lsquoDesign drsquoun Squeeze Film Damper rapport techniquersquo Chaire industrielle
CRNSGEACLBWC Eacutecole Polytechnique de Montreacuteal 2007 23 Christian Komgom meacutemoire de maicirctrise lsquoDevelopment drsquoune proceacutedure intelligente de diagnostic des
deacutefauts de Roulement et eacutetude de lrsquoimpact du chemin de transmission du signal sur sa fiabiliteacutersquo Eacutecole Polytechnique de Montreacuteal 2008
24 Li B Chow M y Tipsuwan Y and Hung J C lsquoNeural-Network-Based Motor Rolling Bearing Fault Diagnosisrsquo IEEE Transaction on Industrial Electronics (2000)Vol 47 Issue 5 1060-1069
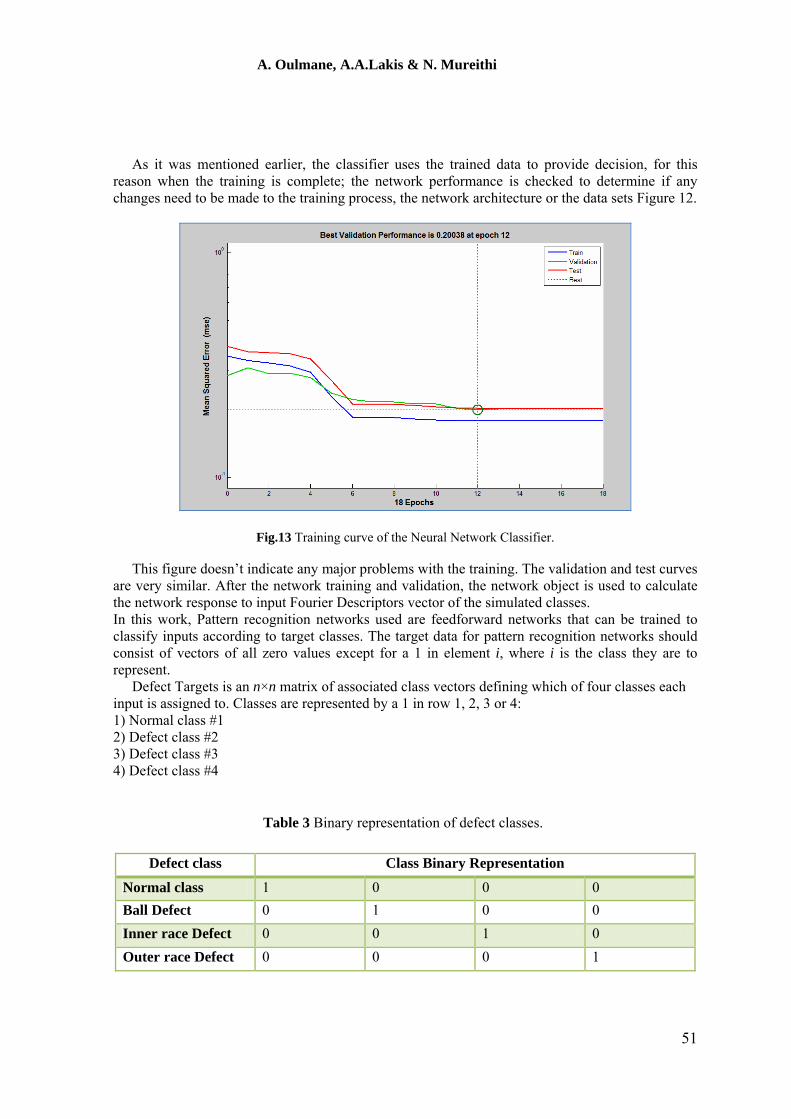
A Oulmane AALakis amp N Mureithi
54
15 Li B Chow M Y Tipsuwan Y and Hung J ClsquoNeural Network Based Motor Rolling Bearing fault Diagnosisrsquo IEEE Transactions on Industriel Electronics (2000) Vol47 Issue 5 1060-1069
16 Paya B A Esat II and Badi MNM lsquoArtificial Neural Network Based Fault Diagnostics of Rotating Machinery Using Wavelet Transforms as a Preprocessorrsquo Mechanical Systems and Signal Processing Vol 11 Issue 5 (1997) 751-765
17 Rumelhart D E Hinton G E and Williams R J lsquoLearning representations by back-propagating errorsrsquo Neuro-computing foundations of research MIT Press Cambridge MA (1988) page 696-699
18 Milan S Valcav H and Roger B lsquoImage Processing Analysis and Machine Visionrsquo Chapman amp Hall computing series London First edition 1993
19 McElroy T Wilson E and Anspach G lsquoFourier descriptors and neural networks for shape classificationrsquo Acoustic Speech and Signal Processing ICASSP International conference on (1995) vol5 pp3435-3438
20 Minsky M L and Papert SA lsquoPerceptronrsquosrsquo Cambridge MA MIT Press 1969 21 McCulloch W S and Pitts W H lsquoA logical calculus of the ideas immanent in nervous activityrsquo
Bulletin of Mathematical Biophysics 5 (1943) 115-133 22 Turgeon F lsquoDesign drsquoun Squeeze Film Damper rapport techniquersquo Chaire industrielle
CRNSGEACLBWC Eacutecole Polytechnique de Montreacuteal 2007 23 Christian Komgom meacutemoire de maicirctrise lsquoDevelopment drsquoune proceacutedure intelligente de diagnostic des
deacutefauts de Roulement et eacutetude de lrsquoimpact du chemin de transmission du signal sur sa fiabiliteacutersquo Eacutecole Polytechnique de Montreacuteal 2008
24 Li B Chow M y Tipsuwan Y and Hung J C lsquoNeural-Network-Based Motor Rolling Bearing Fault Diagnosisrsquo IEEE Transaction on Industrial Electronics (2000)Vol 47 Issue 5 1060-1069