application of factorial designs and doehlert matrix in ... · 10 yqq y100 y108 11 yqy q90 y97.8 12...
TRANSCRIPT
Spectrochimica Acta Part B 57(2002) 1939–1950
0584-8547/02/$ - see front matter� 2002 Elsevier Science B.V. All rights reserved.PII: S 0 5 8 4 - 8 5 4 7Ž0 2.0 0 1 6 0 - X
Application of factorial designs and Doehlert matrix inoptimization of experimental variables associated with the
preconcentration and determination of vanadium and copper inseawater by inductively coupled plasma optical emission
spectrometry�
Sergio L.C. Ferreira*, Adriana S. Queiroz, Marcelo S. Fernandes, Hilda C. dos Santos´
Universidade Federal da Bahia, Instituto de Quımica, Grupo de Pesquisa em Quımica Analıtica,´ ´ ´Campus Universitario de Ondina, Salvador, Bahia, Brazil 40170-290´
Received 12 March 2002; accepted 30 July 2002
Abstract
In the present paper a procedure for preconcentration and determination of vanadium and copper in seawater usinginductively coupled plasma optical emission spectrometry(ICP OES) is proposed, which is based on solid-phaseextraction of vanadium(IV), vanadium(V) and copper(II) ions as 1-(2-pyridylazo)-2-naphthol(PAN) complexesby active carbon. The optimization process was carried out using two-level full factorials and Doehlert matrix designs.Four variables(PAN mass, pH, active carbon mass and shaking time) were regarded as factors in the optimization.Results of the two-level full factorial design 2 with 16 runs for vanadium extraction, based on the variance analysis4
(ANOVA), demonstrated that the factors pH and active carbon mass, besides the interaction(pH=active carbonmass), are statistically significant. For copper, the ANOVA revealed that the factors PAN mass, pH and active carbonmass and the interactions(PAN mass=pH) and (pH=active carbon mass) are statistically significant. Doehlertdesigns were applied in order to determine the optimum conditions for extraction. The procedure proposed allowedthe determination of vanadium and copper with detection limits(3syS) of 73 and 94 ng l , respectively. They1
precision, calculated as relative standard deviation(R.S.D.), was 1.22 and 1.37% for 12.50mg l of vanadium andy1
copper, respectively. The preconcentration factor was 80. The recovery achieved for determination of vanadium andcopper in the presence of several cations demonstrated that this procedure improved the selectivity required forseawater analysis. The procedure was applied to the determination of vanadium and copper in seawater samplescollected in Salvador City, Brazil. Results showed good agreement with other data reported in the literature.� 2002 Elsevier Science B.V. All rights reserved.
Keywords: Vanadium; Copper; Seawater; Doehlert matrix; Inductively coupled plasma optical emission spectrometry(ICP OES)
� This paper was presented at the 7th Rio Symposium on Atomic Spectrometry, held in Florianopolis, Brazil, April 2002 and is´published in the Special Issue ofSpectrochimica Acta Part B, dedicated to that conference.
*Corresponding author. Fax:q55-71-2355166.E-mail address: [email protected](S.L. Ferreira).

1940 S.L. Ferreira et al. / Spectrochimica Acta Part B 57 (2002) 1939–1950
1. Introduction
Procedures for optimization of factors by mul-tivariate techniquesw1,2x have been encouraged,as they are faster, more economical and effective,and allow more than one variable to be optimizedsimultaneously. This optimization can be accom-plished using experimental designsw3x, which canbe of first or second order. The second-orderdesigns have advantages, because they not onlydetermine the influence of the variables to beoptimized on the response, but also enable theresponse function to be obtained and optimized.
The Doehlert matrix w4x is an optimizationsystem, defined as a second-order design. For aprocess involving two variables(A and B) and anexperimental response(Y), the model is describedas:
2 2YsaqbAqcBqdA qeB qfAB (1)
where Y is the experimental response,A and Brepresent the variables to be optimized,a is anindependent term,b and c are coefficients of thelinear terms, d and e are coefficients of thequadratic terms andf is the coefficient of theinteraction term. The identification of the criticalpoints (maximum, minimum or saddle point) iscarried out with application of the Lagrange cri-terion in the equation obtained during the optimi-zation process using experimental data. Inanalytical chemistry, the Doehlert matrixw5–16xhas been widely used in several situations, suchas: development of an on-line procedure for pre-concentration and determination of zinc by induc-tively coupled plasma optical emissionspectrometry (ICP OES) w5x; optimization ofexperimental variables in solid-phase spectropho-tometry w6,7x; optimization process for simultane-ous solvent extraction of several metalsw8,9x;methodology for spectrophotometric determinationw10x; optimization for spectrofluorimetric determi-nation w11x; methodology for separation processusing micellar electrokinetic capillary chromatog-raphy w12x; extraction process using microwavesw13x; optimization for voltammetry determinationw14x; and investigation of matrix effects in ICPOESw15x. In our laboratory, Doehlert designs wereused for the optimization of variables for the
preconcentration and determination of molybde-num in seawater by ICP OESw16x.
Vanadium is an essential trace element for plantsand animals, which stimulates the synthesis ofchlorophyll and promotes the growth of younganimals. Copper is also an essential trace elementfor humans, higher mammals and numerous plants.The blood of marine mollusks and crabs containsthe Cu complex hemocyanin rather than the Fecomplex hemoglobin, which is taken up from theseawater and acts as a respiratory catalystw17x.Thus, these metals are frequently determined inseawater. However, their determination by ICPOES w18x is difficult because of its relatively lowsensitivity and the high saline concentration ofseawater. The concentration ranges for vanadiumand copper in seawater are 2.0–3.0 and 0.2–4.0mg l , respectivelyw19x.y1
The reagent 1-(2-pyridylazo)-2-naphthol(PAN)forms complexes with several metal ions, includingvanadium(IV), vanadium(V) and copper(II). Inpreconcentration procedures, PAN was repeatedlyused for different analytical separation strategies,such as: solid phase extraction using an activecarbon columnw20x; silica gelw21,22x; naphthalenew23x; Amberlite XAD-2000 w24x; alumina w25x;Amberlite XAD-2 w26,27x; Amberlite XAD-4 w28x;and chloromethylated polystyrenew29x, as well asby cloud-point extractionw30,31x.
In this work, a procedure for the preconcentra-tion and determination of vanadium and copper inseawater using ICP OES is proposed. Factorialdesigns and a Doehlert matrix were used foroptimization of the experimental variables. It isbased on the solid-phase extraction of vanadiumand copper ions as PAN complexes on activecarbon.
2. Experimental
2.1. Instrumentation
A Research Laboratories model 3410 minitorchsequential inductively coupled plasma opticalemission spectrometer(Dearborn, MI, USA) cou-pled to an IBM PC-AT computer was used. Emis-sion intensities were measured under the conditionsshown in Table 1. The calibration curves(0–2.0
1941S.L. Ferreira et al. / Spectrochimica Acta Part B 57 (2002) 1939–1950
Table 1Operating parameters for the inductively coupled plasma opti-cal emission spectrometer
Incident output power 650 WReflected power -5 WNebulizer Glass, MeinhardPlasma gas flow rate 7.5 l miny1
Auxiliary gas flow rate 0.81 l miny1
Aerosol carrier gas flow 0.81 ml miny1
Solution uptake rate 2.5 l miny1
Signal integration time 5 sIntegration for determination 3Emission line(nm)
V(II) 309.311Cu(II) 324.754
mg ml ) for vanadium and copper were plottedy1
with solutions prepared from a 100.0mg mly1
stock solution. A Digimed pH meter(Santo Ama-ro, Brazil) was used to measure pH values. AnEtica mechanical shaker(Sao Paulo, Brazil) at˜100 counts min was also used.y1
2.2. Reagents
All reagents were of analytical grade unlessotherwise stated. Ultrapure water was obtainedfrom an EASYpure RF set-up(Barnstedt,Dubuque, IA, USA). Nitric and hydrochloric acidwere of Suprapur quality(Merck). Laboratoryglassware was kept overnight in 10% nitric acidsolution, rinsed with deionized water before use,and dried in a dust-free environment.
Vanadium solution(10.0 mg ml ) was pre-y1
pared by diluting a 1000mg ml vanadiumy1
solution(Merck) with 1% (vyv) hydrochloric acid.Copper solution(10.0 mg ml ) was preparedy1
by diluting a 1000 mg ml copper solutiony1
(Merck) with 1% (vyv) hydrochloric acid.PAN solution 0.25%(wyv) was prepared by
dissolving 1.25 g of 1-(2-pyridylazo)-2-naphthol(Aldrich) in 500 ml of ethanol(Merck).
Acetate buffer(pH 3.75) was prepared by mix-ing 14.76 g of sodium acetate with 104.1 ml ofconcentrated acetic acid and diluting it to 1 l withultrapure water.
Acetate buffer(pH 5.75) was prepared by mix-ing 149.24 g of sodium acetate with 10.3 ml of
concentrated acetic acid and diluting it to 1 l withultrapure water.
Synthetic seawater was prepared with a com-position w5x of: 27.9 mg ml NaCl; 1.4 g ly1 y1
KCl; 2.8 g l MgCl ; 0.5 g l NaBr; and 2.0 gy1 y12
l MgSO .y14
2.3. Surface seawater samples
Seawater samples were collected in polypropyl-ene bottles, previously cleaned by soaking in 2mol l nitric acid. Samples were filtered throughy1
a membrane of 0.45-mm pore size, acidified to 1% (vyv) with concentrated nitric acid, and storedfrozen until they were analyzed. Sampling stationswere beaches on the Atlantic Ocean in SalvadorCity, Brazil.
2.4. General procedure
A sample volume of 800 ml, containing vana-dium and copper ions, was transferred into astoppered flask; 10 ml of acetate buffer solutionand a volume of PAN solution(0.25%) wereadded. After fast shaking, a mass of active carbonwas added and the mixture was shaken again fora certain time. The system was then filtered undervacuum through a 2.5-cm-diameter cellulosemembrane. The residue of active carbon was trans-ferred to an Erlenmeyer flask and digested at 1208C with 4.00 ml of concentrated nitric acid solutionuntil dryness. The residue was treated with 10.0ml of 3 mol l nitric acid, and filtered through ay1
paper filter (Whatman no 40). The filtrate wascollected and used for determination of vanadiumand copper by ICP OES using the emission linesV(II) 309.311 and Cu(II) 324.754 nm.
2.5. Procedure used in the factorial design
The general procedure was applied using thevariable experimental conditions for PAN mass,pH, active carbon mass and shaking time shownin Table 2. Maximum and minimum levels of eachfactor were chosen according to data from previousexperiments.

1942 S.L. Ferreira et al. / Spectrochimica Acta Part B 57 (2002) 1939–1950
Table 2Factors and levels used in the factorial design for extraction ofvanadium and copper
Variable Low (y) High (q)
PAN mass(A) (mg) 1250 12500pH (B) 3.75 5.75Active carbon mass(C) (mg) 50 200Shaking time(D) (min) 10 50
Table 3Design matrix and the results of vanadium extraction
No PAN pH Active Shaking Vanadiummass carbon time extraction
mass (%)
1 q q q q 100y1102 q q q y 98y1023 q q y q 90y984 q q y y 94y88.45 q y q q 98y956 q y q y 97y94.47 q y y q 62y70.88 q y y y 53y55.69 y q q q 104y104
10 y q q y 100y10811 y q y q 90y97.812 y q y y 91y9513 y y q q 90y9214 y y q y 88y9415 y y y q 72y76.616 y y y y 55y65
2.6. Procedures used in the Doehlert matrix
The general procedure was applied and theexperimental conditions for pH, PAN mass, activecarbon mass and shaking time were established inagreement with requirement by the optimizationprocess.
2.7. Optimization strategy
The optimization process was carried out usingtwo-level full factorial and Doehlert matrixdesigns. All experiments were carried out in dupli-cate, using 800 ml of synthetic seawater containing10.0 mg of vanadium and copper. Four variables(PAN mass, pH, active carbon mass and shakingtime) were regarded as factors, and the experimen-tal data were processed using theSTATISTICAL
program.
2.8. Lagrange criterion
The Lagrange criterionw5,16x was used fordetermination of the critical point of the second-order equation and is based on the calculation ofthe Hessian determination ofY:
2 2 2 2H(A,B)s(d YydA )(d YydB )2 2y(d YydAdB) (2)
The critical point (a ,b ) is maximum ifo o
H(a ,b ))0 and d YydA (a ,b )-0, and it is2 2o o o o
minimum if H(a ,b ))0 and d YydA (a ,b ))2 2o o o o
0. A saddle point exists ifH(a ,b )-0. If theo o
response surface has a maximum, this point iscalculated by solving the equation systemsd Yy2
dA s0 andd YydB s0.2 2 2
3. Results and discussion
3.1. Factorial design
The procedure proposed is based on the solidphase extraction of vanadium(IV), vanadium(V)and copper(II) ions as PAN complexes usingactive carbon. The following factors were evalu-ated: PAN mass, pH, active carbon mass andshaking time. A two-level full factorial of 2 with4
16 runs was carried out in order to determine themain factors of the extraction process. Table 2 listthe maximum and minimum values given to eachfactor and Tables 3 and 4 show the experimentaldesign matrix and the results derived from eachrun in duplicate for vanadium and copper, respec-tively. The significance of the effects was checkedby analysis of the variance(ANOVA) and usingP-value significance levels.
The ANOVA results for vanadium produced thePareto chartw32,33x of main effects shown in Fig.1. Bar lengths are proportional to the absolutevalue of the estimated effects, which helps incomparing the relative importance of effects. Theinterpretation of this chart demonstrates that thefactors pH and active carbon mass are highlysignificant. An increase in pH and in active carbon

1943S.L. Ferreira et al. / Spectrochimica Acta Part B 57 (2002) 1939–1950
Table 4Design matrix and the results of copper extraction
No PAN pH Active Shaking Coppermass carbon time extraction
mass (%)
1 q q q q 96.7y1022 q q q y 107y1073 q q y q 97.7y1014 q q y y 92y945 q y q q 97.8y1026 q y q y 99.2y1047 q y y q 96.3y998 q y y y 97y1019 y q q q 97y95.4
10 y q q y 92.1y90.211 y q y q 80y8312 y q y y 80y7913 y y q q 75.6y7314 y y q y 70y69.715 y y y q 71y72.516 y y y y 71.5y68.9
Fig. 1. Pareto chart of standardized effects for variables in the vanadium extraction.
mass increases the extraction efficiency. The shak-ing time is a less significant factor. The interaction(pH=active carbon mass) is also statistically sig-nificant. The factor PAN mass has an insignificanteffect.
The Pareto chart in Fig. 2 demonstrates thatPAN mass provides a more significant effect forcopper extraction. An increase in this complexingagent leads to higher extraction efficiency. Thefactors pH and active carbon mass also producesignificant effects. The interactions(PANmass=pH) and(pH=active carbon mass) are alsostatistically significant. The shaking time in therange 10–50 min has no significant effect on theextraction.
3.2. Final optimization by Doehlert design
The factorial design demonstrated that the vari-ables at the levels studied need final optimization,for which the Doehlert designs were used. Firstly,designs were developed for the optimization of pH

1944 S.L. Ferreira et al. / Spectrochimica Acta Part B 57 (2002) 1939–1950
Table 5Doehlert matrix for design 1
Experiment pH PAN mass Vanadium recovery(%)(mg)
Experimental Expected
1 3.75 1250 90 902 3.75 12500 90 853 4.75 7500 105 1024 8.00 7500 85 825 2.50 7500 70 666 5.75 12500 100 947 5.75 1250 110 109
R s0.9781.2
Fig. 2. Pareto chart of standardized effects for variables in the copper extraction.
and PAN mass and then designs for the optimiza-tion of active carbon mass and shaking time.
3.2.1. Design 1—conditions of pH and PAN massfor vanadium extraction
In this design the optimized variables were pHand PAN mass, setting the active carbon mass andshaking time at 200 mg and 50 min, respectively.The seven experiments required by the Doehlertdesign are described in Table 5. The pH and PANmass varied from 2.5 to 8.0 and from 1250 to12 500mg, respectively.
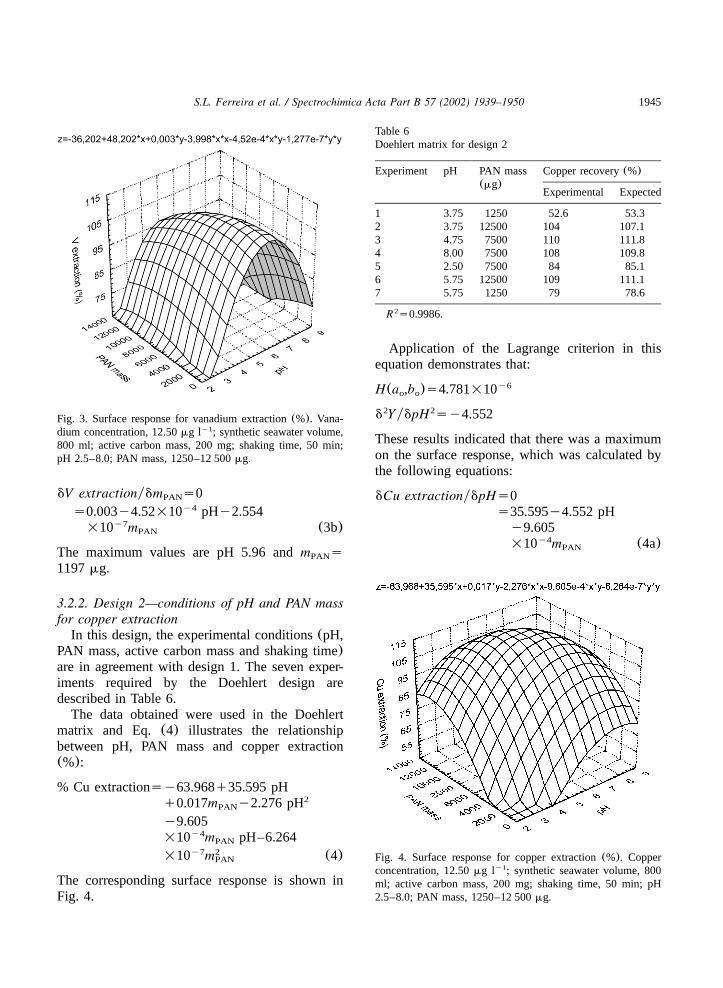
The data obtained were used in the Doehlertmatrix and Eq. (3) illustrates the relationshipbetween pH, PAN mass and vanadium extraction(%):
% V extractionsy36.202q48.202 pH2q0.003m y3.998 pHPAN
y4y4.52=10 m pHPANy7 2y1.277=10 m (3)PAN
The corresponding surface response is shown inFig. 3.
Application of the Lagrange criterion in thisequation demonstrates that:
y6H(a ,b )s1.838=10o o
2 2d YydpH sy7.996
These results indicated that there was a maximumon the surface response, which was calculated bythe following equations:
dV extractionydpHs0s48.202y7.996 pH
y4y4.52=10 m (3a)PAN
1945S.L. Ferreira et al. / Spectrochimica Acta Part B 57 (2002) 1939–1950
Fig. 3. Surface response for vanadium extraction(%). Vana-dium concentration, 12.50mg l ; synthetic seawater volume,y1
800 ml; active carbon mass, 200 mg; shaking time, 50 min;pH 2.5–8.0; PAN mass, 1250–12 500mg.
Table 6Doehlert matrix for design 2
Experiment pH PAN mass Copper recovery(%)(mg)
Experimental Expected
1 3.75 1250 52.6 53.32 3.75 12500 104 107.13 4.75 7500 110 111.84 8.00 7500 108 109.85 2.50 7500 84 85.16 5.75 12500 109 111.17 5.75 1250 79 78.6
R s0.9986.2
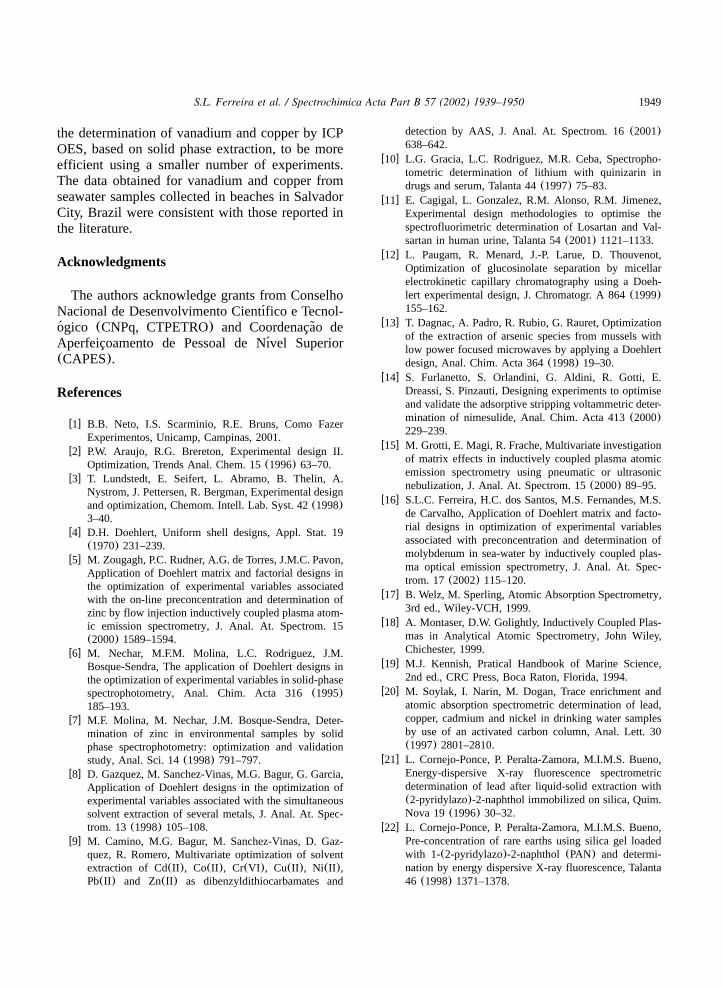
Fig. 4. Surface response for copper extraction(%). Copperconcentration, 12.50mg l ; synthetic seawater volume, 800y1
ml; active carbon mass, 200 mg; shaking time, 50 min; pH2.5–8.0; PAN mass, 1250–12 500mg.
dV extractionydm s0PANy4s0.003y4.52=10 pHy2.554
y7=10 m (3b)PAN
The maximum values are pH 5.96 andm sPAN
1197mg.
3.2.2. Design 2—conditions of pH and PAN massfor copper extraction
In this design, the experimental conditions(pH,PAN mass, active carbon mass and shaking time)are in agreement with design 1. The seven exper-iments required by the Doehlert design aredescribed in Table 6.
The data obtained were used in the Doehlertmatrix and Eq. (4) illustrates the relationshipbetween pH, PAN mass and copper extraction(%):
% Cu extractionsy63.968q35.595 pH2q0.017m y2.276 pHPAN
y9.605y4=10 m pH–6.264PANy7 2=10 m (4)PAN
The corresponding surface response is shown inFig. 4.
Application of the Lagrange criterion in thisequation demonstrates that:
y6H(a ,b )s4.781=10o o
2 2d YydpH sy4.552
These results indicated that there was a maximumon the surface response, which was calculated bythe following equations:
dCu extractionydpHs0s35.595y4.552 pH
y9.605y4=10 m (4a)PAN

1946 S.L. Ferreira et al. / Spectrochimica Acta Part B 57 (2002) 1939–1950
Table 7Doehlert matrix for design 3
Experiment Active Time Vanadium recovery(%)carbon (min)
Experimental Expectedmass(mg)
1 50 10 91 922 200 10 99.5 1003 125 30 101 1014 125 60 99 1005 125 5 99.5 98.56 200 50 100 1007 50 50 96 96CP 157 33 – 102.17RC 150 30 – 102.10
CP, critical point; RC, recommended conditions for this pro-cedure.R s0.9624.2
Fig. 5. Surface response for vanadium extraction(%). Vana-dium concentration, 12.50mg l ; synthetic seawater volume,y1
800 ml; pH 5.75; PAN mass, 12 500mg; active carbon mass,50–200 mg; shaking time, 5–60 min.
dCu extractionydm s0PANy4s0.017y9.605=10 pHy1.253
y6=10 m (4b)PAN
The maximum values are pH 5.91 andm sPAN
9035mg.
3.2.3. Design 3—conditions of active carbon massand shaking time for vanadium extraction
In this design, pH and PAN mass were fixed,and active carbon mass and shaking time werevaried. Considering the results obtained in designs1 and 2, pH was fixed at 5.75(maximum pHallowed for the acetate buffer) and PAN mass at12 500 mg. The seven experiments required forthe new Doehlert design are described in Table 7.Time and active carbon mass varied from 5 to 60min and from 50 to 200 mg, respectively.
The data obtained were used in the Doehlertmatrix and Eq. (5) illustrates the relationshipbetween active carbon mass, shaking time andvanadium extraction(%):
% V extractions79.741q0.219mAC
q0.316ty6.178y4 2=10 (m ) y7.5ACy4 2=10 m ty0.003t (5)AC
The corresponding surface response is shown inFig. 5.
Application of the Lagrange criterion in thisequation demonstrates that:
y6H(a ,b )s6.851=10o o
2 2 y3d Yydm sy1.236=10AC
These results indicated that there was a maximumon the surface response, which was calculated bythe following equations:
dV extractionydm s0AC
s0.219y1.236y3=10 m y7.5ACy4=10 t (5a)
dV extractionydts0s0.316y7.5y4=10 mAC
y0.006t (5b)
The maximum values arem s157 mg andtsAC
33 min.
3.2.4. Design 4—conditions of active carbon massand shaking time for copper extraction
In this design, the experimental conditions(pH,PAN mass, active carbon mass and shaking time)are in agreement with design 3. The seven exper-

1947S.L. Ferreira et al. / Spectrochimica Acta Part B 57 (2002) 1939–1950
Table 8Doehlert matrix for design 4
Experiment Active Time Copper recovery(%)carbon (min)
Experimental Expectedmass(mg)
1 50 10 94 942 200 10 99 993 125 30 102 1024 125 60 100 995 125 5 99 996 200 50 99 987 50 50 98 97CP 143 31 – 101.84RC 150 30 – 101.81
CP, critical point; RC, recommended conditions for this pro-cedure.R s0.9522.2
Fig. 6. Surface response for copper extraction(%). Copperconcentration, 12.50mg l ; synthetic seawater volume, 800y1
ml; pH 5.75; PAN mass, 12 500mg; active carbon mass, 50–200 mg; shaking time, 5–60 min.
iments required by the Doehlert design aredescribed in Table 8.
The data obtained were used in the Doehlertmatrix and Eq. (6) illustrates the relationshipbetween active carbon mass, shaking time andcopper extraction(%):
% Cu extractions83.826q0.18m q0.34tACy4 2y5.595=10 (m )ACy4y6.667=10 m ty4AC
y3 2=10 t (6)
The corresponding surface response is shown inFig. 6.
Application of the Lagrange criterion in thisequation demonstrates that:
y6H(a ,b )s8.508=10o o
2 2 y3d Yydm sy1.119=10AC
These results indicated that there was a maximumon the surface response, which was calculated bythe following equations:
dCu extractionydm s0ACy3s0.18y1.119=10 m y6.667AC
y4=10 t (6a)
dCu extractionydts0s0.34y6.667
y4=10 m y8ACy3=10 t (6b)
The maximum values arem s143 mg andtsAC
31 min.
3.3. Procedure for determination of vanadium andcopper in seawater
Considering the results obtained in the designs,the procedure for the determination of vanadiumand copper in seawater recommends the use of thegeneral procedure, described in the experimentalpart, using a PAN mass of 12 500mg, pH 5.75,active carbon mass of 150 mg and shaking timeof 30 min.
3.4. Analytical features
The precision calculated as the relative standarddeviation(RSD) for a series of 11 replicates was1.22 and 1.37% for 12.50mg l of vanadium andy1
copper, respectively, in synthetic seawater solution.The preconcentration factor was 80, considering
the sample volume of seawater(800 ml) and asolution volume for analysis of 10.0 ml.
The sensitivity w34x was studied by means ofthe limits of detection(LOD) and quantification(LOQ), defined as LODs(3s)yS and LOQs

1948 S.L. Ferreira et al. / Spectrochimica Acta Part B 57 (2002) 1939–1950
Table 9Determination of vanadium in unspiked and spiked seawatersamples(ns3)
Seawater sample Vanadium(mg l )y1 Recovery
Added Founda(%)
Synthetic 0 -LOD –12.50 12.26"0.10 98.112.50b 11.55"0.19 92.4
Jardim Alah 0 1.73"0.06 –12.50 14.16"0.17 99.4
Stella Mares 0 3.45"0.08 –12.50 15.38"0.14 95.4
Porto da Barra 0 3.13"0.09 –12.50 14.68"0.17 92
Corsario´ 0 3.05"0.08 –12.50 15.33"0.16 98.2
Ondina 0 1.77"0.04 –12.50 14.90"0.16 105
Sample volume, 800 ml.At 95% confidence level.a
Vanadium in the presence of several metal ions.b
Table 10Determination of copper in unspiked and spiked seawater sam-ples(ns3)
Seawater sample Copper(mg l )y1 Recovery
Added Founda(%)
Synthetic 0 -LOD –12.50 12.38"0.11 99.012.50b 11.78"0.18 94.2
Jardim Alah 0 -LOD –12.50 12.65"0.18 101.2
Stella Mares 0 0.94"0.02 –12.50 13.21"0.14 98
Porto da Barra 0 0.38"0.11 –12.50 13.51"0.17 105
Corsario´ 0 0.38"0.04 –12.50 12.56"0.06 97.4
Ondina 0 0.48"0.10 –12.50 12.25"0.16 94
Sample volume, 800 ml.At 95% confidence level.a
Copper in the presence of several metal ions.b
(10s)yS, where S is the slope of the analyticalcurve and s is the standard deviation of 10consecutive measurements of the blank. For vana-dium, LOD and LOQ were 73 and 243 ng l ,y1
and for copper, 94 and 313 ng l , respectively.y1
3.5. Effect of other metal ions on the procedureproposed
In order to check the effect of other metal ionson the method proposed, vanadium and copper(10.00 mg) and other metal ions(all 10.00 mg)were added to 800 ml of synthetic seawater andthe procedure was applied. The values measuredwere 9.24"0.16 mg (ns3) for vanadium and9.45"0.15 mg (ns3) for copper, with recoveryof 92.4 and 94.5%, respectively. This experimentwas carried out using a multi-elemental ICP OESsolution Quality Control Standards(QCS-19),which had arsenic, antimony, beryllium, cadmium,calcium, chromium, cobalt, iron, molybdenum,nickel, thallium, titanium, zinc, lead, magnesium,manganese and selenium at a concentration of 100mg l each.y1
3.6. Accuracy
In order to evaluate the accuracy of the proce-dure developed, vanadium and copper were deter-
mined in the CASS-4 Nearshore SeawaterReference Material for Trace Metals(NationalResearch Council Canada). For vanadium, theresult achieved was 1.16"0.18 mg l comparedy1
to the certified value of 1.18"0.16 mg l . Fory1
copper, the result achieved was 0.602"0.064 mgl compared to the certified value ofy1
0.592"0.055 mg l . This test was carried outy1
using 150 ml of solution.
3.7. Analytical application
The optimized methodology was applied to theanalysis of seawater samples collected during thewinter of 2001 from several beaches in SalvadorCity, Brazil. The results are shown in Tables 9 and10, together with recovery data for added vanadi-um and copper. The data found in this study wereconsistent with those reported in literaturew19x,including former data for the same city using adifferent procedure for copper determinationw35x.The recovery of vanadium and copper added tothe samples before application of the methodproposed demonstrates its efficiency.
4. Conclusions
Application of factorial designs and a Doehlertmatrix allowed the optimization of a procedure for
1949S.L. Ferreira et al. / Spectrochimica Acta Part B 57 (2002) 1939–1950
the determination of vanadium and copper by ICPOES, based on solid phase extraction, to be moreefficient using a smaller number of experiments.The data obtained for vanadium and copper fromseawater samples collected in beaches in SalvadorCity, Brazil were consistent with those reported inthe literature.
Acknowledgments
The authors acknowledge grants from ConselhoNacional de Desenvolvimento Cientıfico e Tecnol-´ogico (CNPq, CTPETRO) and Coordenacao de´ ˜¸Aperfeicoamento de Pessoal de Nıvel Superior´¸(CAPES).
References
w1x B.B. Neto, I.S. Scarminio, R.E. Bruns, Como FazerExperimentos, Unicamp, Campinas, 2001.
w2x P.W. Araujo, R.G. Brereton, Experimental design II.Optimization, Trends Anal. Chem. 15(1996) 63–70.
w3x T. Lundstedt, E. Seifert, L. Abramo, B. Thelin, A.Nystrom, J. Pettersen, R. Bergman, Experimental designand optimization, Chemom. Intell. Lab. Syst. 42(1998)3–40.
w4x D.H. Doehlert, Uniform shell designs, Appl. Stat. 19(1970) 231–239.
w5x M. Zougagh, P.C. Rudner, A.G. de Torres, J.M.C. Pavon,Application of Doehlert matrix and factorial designs inthe optimization of experimental variables associatedwith the on-line preconcentration and determination ofzinc by flow injection inductively coupled plasma atom-ic emission spectrometry, J. Anal. At. Spectrom. 15(2000) 1589–1594.
w6x M. Nechar, M.F.M. Molina, L.C. Rodriguez, J.M.Bosque-Sendra, The application of Doehlert designs inthe optimization of experimental variables in solid-phasespectrophotometry, Anal. Chim. Acta 316(1995)185–193.
w7x M.F. Molina, M. Nechar, J.M. Bosque-Sendra, Deter-mination of zinc in environmental samples by solidphase spectrophotometry: optimization and validationstudy, Anal. Sci. 14(1998) 791–797.
w8x D. Gazquez, M. Sanchez-Vinas, M.G. Bagur, G. Garcia,Application of Doehlert designs in the optimization ofexperimental variables associated with the simultaneoussolvent extraction of several metals, J. Anal. At. Spec-trom. 13(1998) 105–108.
w9x M. Camino, M.G. Bagur, M. Sanchez-Vinas, D. Gaz-quez, R. Romero, Multivariate optimization of solventextraction of Cd(II), Co(II), Cr(VI), Cu(II), Ni(II),Pb(II) and Zn(II) as dibenzyldithiocarbamates and
detection by AAS, J. Anal. At. Spectrom. 16(2001)638–642.
w10x L.G. Gracia, L.C. Rodriguez, M.R. Ceba, Spectropho-tometric determination of lithium with quinizarin indrugs and serum, Talanta 44(1997) 75–83.
w11x E. Cagigal, L. Gonzalez, R.M. Alonso, R.M. Jimenez,Experimental design methodologies to optimise thespectrofluorimetric determination of Losartan and Val-sartan in human urine, Talanta 54(2001) 1121–1133.
w12x L. Paugam, R. Menard, J.-P. Larue, D. Thouvenot,Optimization of glucosinolate separation by micellarelectrokinetic capillary chromatography using a Doeh-lert experimental design, J. Chromatogr. A 864(1999)155–162.
w13x T. Dagnac, A. Padro, R. Rubio, G. Rauret, Optimizationof the extraction of arsenic species from mussels withlow power focused microwaves by applying a Doehlertdesign, Anal. Chim. Acta 364(1998) 19–30.
w14x S. Furlanetto, S. Orlandini, G. Aldini, R. Gotti, E.Dreassi, S. Pinzauti, Designing experiments to optimiseand validate the adsorptive stripping voltammetric deter-mination of nimesulide, Anal. Chim. Acta 413(2000)229–239.
w15x M. Grotti, E. Magi, R. Frache, Multivariate investigationof matrix effects in inductively coupled plasma atomicemission spectrometry using pneumatic or ultrasonicnebulization, J. Anal. At. Spectrom. 15(2000) 89–95.
w16x S.L.C. Ferreira, H.C. dos Santos, M.S. Fernandes, M.S.de Carvalho, Application of Doehlert matrix and facto-rial designs in optimization of experimental variablesassociated with preconcentration and determination ofmolybdenum in sea-water by inductively coupled plas-ma optical emission spectrometry, J. Anal. At. Spec-trom. 17(2002) 115–120.
w17x B. Welz, M. Sperling, Atomic Absorption Spectrometry,3rd ed., Wiley-VCH, 1999.
w18x A. Montaser, D.W. Golightly, Inductively Coupled Plas-mas in Analytical Atomic Spectrometry, John Wiley,Chichester, 1999.
w19x M.J. Kennish, Pratical Handbook of Marine Science,2nd ed., CRC Press, Boca Raton, Florida, 1994.
w20x M. Soylak, I. Narin, M. Dogan, Trace enrichment andatomic absorption spectrometric determination of lead,copper, cadmium and nickel in drinking water samplesby use of an activated carbon column, Anal. Lett. 30(1997) 2801–2810.
w21x L. Cornejo-Ponce, P. Peralta-Zamora, M.I.M.S. Bueno,Energy-dispersive X-ray fluorescence spectrometricdetermination of lead after liquid-solid extraction with(2-pyridylazo)-2-naphthol immobilized on silica, Quim.Nova 19(1996) 30–32.
w22x L. Cornejo-Ponce, P. Peralta-Zamora, M.I.M.S. Bueno,Pre-concentration of rare earths using silica gel loadedwith 1-(2-pyridylazo)-2-naphthol(PAN) and determi-nation by energy dispersive X-ray fluorescence, Talanta46 (1998) 1371–1378.

1950 S.L. Ferreira et al. / Spectrochimica Acta Part B 57 (2002) 1939–1950
w23x M.A. Taher, S. Puri, R.K. Bansal, B.K. Puri, Derivativespectrophotometric determination of iridium after pre-concentration of its 1-(2-pyridylazo)-2-naphthol com-plex on microcrystalline naphthalene, Talanta 45(1997)411–416.
w24x I. Narin, M. Soylak, L Elci, M. Dogan, Separation andenrichment of chromium, copper, nickel and lead insurface seawater samples on a column filled withAmberlite XAD-2000, Anal. Lett. 34 (2001)1935–1947.
w25x F. Shemirani, B.T.S. Akhavi, Preconcentration and deter-mination of trace cadmium using 1-(2-pyridylazo)-2-naphthol (PAN) immobilized on surfactant-coatedalumina, Anal. Lett. 34(2001) 2179–2188.
w26x S.L.C. Ferreira, C.F. de Brito, A.F. Dantas, N.M.L.Araujo, A.C.S. Costa, Nickel determination in saline´matrices by ICP-AES after sorption on Amberlite XAD-2 loaded with PAN, Talanta 48(1999) 1173–1177.
w27x P. Bermejo-Barrera, N. Martinez-Afonso, A. Bermejo-Barrera, Separation of gallium and indium from oresmatrix by sorption on Amberlite XAD-2 coated withPAN, Fresenius J. Anal. Chem. 369(2001) 191–194.
w28x M.C. Yebra, N. Carro, M.F. Enriquez, A. Moreno-Cid,A. Garcia, Field sample preconcentration of copper insea water using chelating minicolumns subsequentlyincorporated on a flow-injection-flame atomic absorp-tion spectrometry system, Analyst 126(2001) 933–937.
w29x I.M.M. Kenawy, M.A.H. Hafez, M.A. Akl, R.R. Lash-ein, Determination by AAS of some trace heavy metalions in some natural and biological samples after theirpreconcentration using newly chemically modified chlo-romethylated polystyrene–PAN ion-exchanger, Anal.Sci. 16(2000) 493–500.
w30x C.G. Pinto, J.L.P. Pavon, B.M. Cordero, E.R. Beato,S.G. Sanchez, Cloud point preconcentration and flameatomic absorption spectrometry: application to the deter-mination of cadmium, J. Anal. At. Spectrom. 11(1996)37–41.
w31x M.C.C. Oliveros, O.J. de Blas, J.L.P. Pavon, Cloud pointpreconcentration and flame atomic absorption spectrom-etry: application to the determination of nickel and zinc,J. Anal. At. Spectrom. 13(1998) 547–550.
w32x P. Bermejo-Barrera, A. Moreda-Pineiro, A. Bermejo-˜Barrera, Factorial designs for Cd, Cr, Hg, Pb and Seultrasound-assisted acid leaching from human hair fol-lowed by atomic absorption spectrometric determina-tion, J. Anal. At. Spectrom. 15(2000) 121–130.
w33x P. Bermejo-Barrera, O. Muniz-Naveiro, A. Moreda-˜Pineiro, A. Bermejo-Barrera, The multivariate optimi-˜sation of ultrasonic bath-induced acid leaching for thedetermination of trace elements in seafood products byatomic absorption spectrometry, Anal. Chim. Acta 439(2001) 211–227.
w34x P. Bermejo-Barrera, A. Moreda-Pineiro, O. Muniz-Nav-˜ ˜eiro, A.M.J. Gomez-Fernandez, A. Bermejo-Barrera,´ ´Optimization of a microwave pseudo-digestion proce-dure by experimental designs for the determination oftrace elements in seafood products by atomic absorptionspectrometry, Spectrochim. Acta Part B 55(2000)1351–1371.
w35x S.L.C. Ferreira, H.C. Santos, J.R. Ferreira, N.M.L.Araujo, A.C.S. Costa, D.S. Jesus, Preconcentration and´determination of copper and zinc in natural watersamples by ICP-AES after complexation and sorptionon Amberlite XAD-2, J. Braz. Chem. Soc. 9(1998)525–530.