application of cross-plotting techniques for delineation...
TRANSCRIPT

Geomaterials, 2012, 2, 94-104 http://dx.doi.org/10.4236/gm.2012.24014 Published Online October 2012 (http://www.SciRP.org/journal/gm)
Application of Cross-Plotting Techniques for Delineation of Coal and Non-Coal Litho-Units from Well Logs in
Jharia Coalfield, India
Rima Chatterjee, Suman Paul Department of Applied Geophysics, Indian School of Mines, Dhanbad, India
Email: [email protected]
Received September 5, 2012; revised October 10, 2012; accepted October 20, 2012
ABSTRACT
Well log responses can be used to delineate coal and carbonaceous shale from other non-potential litho-units by cross-plotting technique. The cross-plotting between gamma ray and density had been carried out for 15 wells of Jharia coalfield, India. Through these different cross-plots across the study area, different litho-units like; coal, shaly coal, carbonaceous shale, shale, sand/sandstone, shaly sand, jhama and igneous intrusion (mica peridotite) have been identi-fied. Clustering of points for different lithologies in the above cross-plots indicate that the different trends with marginal overlap between carbonaceous shale/shaly coal and shale as well as shaly sand and shale. The coal horizons are mostly overlain and underlain by shale or sandstone. Cross-plot analysis indicates the various coal lithologies which will play important role in CBM exploration and exploitation strategy. Keywords: Jharia Coalfield; Cross-Plot; P-Wave Impedance; CBM Reservoir
1. Introduction
Well log responses can be used to delineate coal and car- bonaceous shale from other non-potential litho-units by cross-plotting technique. Identification of lithologies above and below coal seams is important to know the variation in permeability, velocity and elastic properties of rocks immediately overlying and underlying CBM reservoir for identification of the best targets for CBM exploration and production [1-5].
Cross-plotting or statistical techniques enable evalua-tion of lithology and pore fluid variations on both re-gional and detailed reservoir scale [6,7]. Anderson and Gray [8] as well as Gray and Andersen [9] had demon-strated that many different lithologies like coal, shale, sandstone, gas saturated sands and carbonates can be identified by cross-plots of λρ versus µρ (where λ is elas-tic parameter, µ is rigidity modulus and ρ is density).
The elastic properties, suh as velocity, density and impedance are of critical importance in characterization of CBM reservoir unconventional gas play [10,11]. The main objective of this paper are to identify of litho-units of coal bearing formation by cross-plotting technique between physical properties of formation such as: gamma ray versus density, gamma ray versus resistivity, gamma ray versus P-wave velocity and gamma ray versus P- wave acoustic impedance and to identify and classify major coal seams with the help of available well logs,
litho-logs and coal core samples.
2. Study Area
Present study area, consisting of Singra, Kapuria, Barki and Jarma blocks is located in the south-central part of Jharia coalfield (Figure 1). Table 1 is showing general-ised stratigraphic sequence of Jharia coalfield, India [12]. Available well logs, litho-logs and core samples of total 15 exploratory wells have been considered for present study. Figure 1 displays locations of 15 exploratory wells in the study area.
Out of the 15 exploratory wells, wells S1, S5, S8, S10 and S14 are located in Singra block; wells K1, K4, K8, K10 and J2 are located in Kapuria block; wells J1, J3 and J4 are located in Barki block and wells M1 and M2 are located in Jarma block (Extension of Moonidih block) of Jharia coalfield (Figure 1).
3. Identification of Litho-Units from Cross-Plots of Well Logs
A common practice in log interpretation is to cross-plot various porosity log readings in order to determine for-mation lithology and accurate porosity. The neutron logs and gamma ray logs complement each other and are of-ten used together. The natural gamma ray log tends to respond to changes in clay mineral content, while the
Copyright © 2012 SciRes. GM

R. CHATTERJEE, S. PAUL 95
Figure 1. Structural and stratigraphic map of Jharia coalfield, India (after Sengupta, 1980). Showing locations of 15 numbers of exploratory wells distributed in Singra, Kapuria, Jarma and Barki blocks of Jharia coalfield, India.
Table 1. Generalised stratigraphic sequence of Jharia Coalfield, India.
Age Group Formation Litho-Type Maximum Thickness
Recent & Sub-Recent
Weathered Alluvium, sandy soil, clay, gravel etc. 30 m
~~~~~~~~~~~~~~~~~~~~~~~~~~~~~~~~~~~~~~~~~~~~~ Unconformity ~~~~~~~~~~~~~~~~~~~~~~~~~~~~~~~~~~~~~~~~~~~~~
Jurassic Deccan Trap & Other
Igneous Intrusives
Dolerite dykes, Mica lamprophyre dyke & sills
~~~~~~~~~~~~~~~~~~~~~~~~~~~~~~~~~~~~~~~~~~~~~ Unconformity ~~~~~~~~~~~~~~~~~~~~~~~~~~~~~~~~~~~~~~~~~~~~~
Upper Permian Raniganj Fine grained feldspathic sandstones, shales with coal seam
800 m
Middle Permian Barren Measure Buff coloured sandstone, shales and carboneceous shales
730 m
Lower Permian Barakar Buff coloured coarse to medium grained feldspathic sandstones, grits, shales, carboneceous shales and coal seam
+1250 m
Upper Carboniferous
D A M U D A
Talchir Greenish shale and fine grained sandstones 245 m
~~~~~~~~~~~~~~~~~~~~~~~~~~~~~~~~~~~~~~~~~~~~~ Unconformity ~~~~~~~~~~~~~~~~~~~~~~~~~~~~~~~~~~~~~~~~~~~~~
Archaeans Metamorphics
Copyright © 2012 SciRes. GM

R. CHATTERJEE, S. PAUL 96
neutron log tends to respond to changes in porosity. Coal can be identified on neutron logs because it is rich in hydrogen and thus produces a very good porosity (very low count rate). Gamma ray logs show clear differences between carbonaceous shales and coal, which are poorly distinguished on neutron logs. Contacts between coal and clean sandstones, on the other hand are clear on neutron logs but difficult to distinguish on gamma ray logs. Neu-tron and other logs have been compared to identify the lithology of inter-seam strata. Carbonaceous shale is identified by high gamma ray response and low density values from low density coal [13].
In coal beds identification, the special acoustic proper-ties of the coal formation, e.g., low velocity and low den-sity, cause large impedance contrasts between coal seams and inter-seam sediments and is to be reflected in the gamma ray versus impedance cross-plots. Neutron logs are not useful for identification of waterfilled plies of coal seams. More information can be obtained by com-paring two logs than by using each log independently, so cross-plotting technique are used to quantitatively com-pare different logs of a given stratum.
Gamma ray, resistivity, density, sonic and neutron log data were available only for five wells (J1, J3 and J4). The most common logs like gamma ray, density and caliper log data were available for 15 wells (S1, S5, S8, S10, S14, K1, K4, K8, K1, J1, J2, J3, J4, M1 and M2).
The physical parameters like density, resistivity, P- wave velocity, P-wave impedance and neutron porosity have been plotted with gamma ray to identify different litho-units like coal, shaly coal, shaly sand and sand for the three wells, namely: J1, J3 and J4. The cross-plotting between gamma ray and density had been carried out for 15 wells. Through these different cross-plots across the study area, different litho-units like: coal, shaly coal, car- bonaceous shale, shale, sand/sandstone, shaly sand, jha- ma and igneous intrusion (mica peridotite) have been identified. Table 2 indicates the range of values of phy- sical parameters for each litho-unit estimated from well logs of 15 exploratory wells in Jharia coalfield.
4. Cross-Plot Analysis
Results of different cross-plot analysis have been dis-cussed for 10 wells, such as: J1, J2, J3, J4, S1, S10, S14, K4, K10 and M1. The physical parameters like density, resistivity, P-wave velocity and P-wave impedance have been plotted with gamma ray for well J1 for a selected depth interval of 249.92 m to 1052.62 m (Figure 2). The clustering of points could discriminate coal and mixed litho-units like coal and shaly coal as well as shaly sand from the gamma ray versus density, gamma ray versus resistivity, gamma ray versus P-wave velocity and gamma ray versus P-wave impedance cross-plots. Coal in this horizon in well J1 is characterized by low gamma ray
value (less than 40 cps), density ranging from 1.28 gm/cc to 1.55 gm/cc, resistivity ranging from 800 ohm-m to 2800 ohm-m, P-wave velocity ranging from 2400 m/sec to 3000 m/sec and P-wave impedance ranging from 3500 gm/cc*m/sec to 4500 gm/cc*m/sec. Shaly coal is char-acterized by density 1.6 gm/cc to 1.8 gm/cc with resistiv-ity 300 ohm-m to 700 ohm-m, velocity 3500 m/sec to 4000 m/sec and impedance 6000 gm/cc*m/sec to 8000 gm/cc*m/sec. Shaly sand is distinguishable by lowering of resistivity value about 80 ohm-m to 100 ohm-m, gamma ray of 50 cps, P-wave velocity of 4000 m/sec to 5000 m/sec and P-wave impedance of 7800 gm/cc*m/sec to 8000 gm/cc*m/sec.
The analysis of cross-plots between gamma ray versus density, gamma ray versus resistivity, gamma ray versus P-wave velocity, gamma ray versus P-wave impedance and gamma ray versus neutron porosity for depth interval of 249.95 to 1344.45 m for well J3 and similar cross- plots for depth intervals of 249.94 to 1372.24 m in well J4 manifests the lithology like coal, shaly coal, shaly sand-stone/shaly sand and sandstone/sand. Some coal seams are found to be heat affected. When igneous intrusive co- me into contact with a coal seam, coal is heated up and appeared as if baked or become low volatile coal. The completely baked devolatalised coal is called jhama. In these two wells (J3 and J4) jhama is found with coal.
The cross-plots between the gamma ray and density for wells J2, S1, S10, S14, K4, K10 and M1 have been displayed for depth interval 249.96 m to 1183.81 m, 499.98 m to 902.08 m, 519.97 m to 1220.67 m, 539.97 m to 786.02 m, 140.98 m to 849.78 m, 240.97 m to 903.67 m and 200.02 m to 1081.92 m respectively (Figure 3(a), Figure 3(b), Figure 3(d), Figure 3(e), Figure 4(a), Figure 4(c) and Figure 4(d) respectively). Density ver-sus resistivity cross-plots are also shown for wells S1 and K4 in Figures 3(c) and 4(b) respectively. Resistivity ver- sus gamma ray cross-plots for wells J1, J3, J4, S1 and K4 could not able to identify carbonaceous shale/ shale and shaly coal. It was difficult to identify coal and igneous intrusions from the resistivity versus gamma ray cross- plots.
For most of these wells it was easy to identify the coal, shaly coal, carbonaceous shale, shale, shaly sand and sand from the density versus gamma ray cross-plots. The high density values ranging from 2.8 gm/cc to 3.2 gm/cc and gamma ray value ranging from 50 cps to 280 cps have been observed in these wells. This may be due to the igneous intrusions in this area.
The density, gamma ray and resistivity values in coal for these wells (J2, S1, S10, S14, K4, K10 and M1) var-ies from 1.28 gm/cc to 1.55 gm/cc, 20 cps to 50 cps and 500 ohm-m to 1200 ohm-m; in alternation of coal and shaly coal from 1.4 gm/cc to 2.0 gm/cc, 100 cps to 150 cps and 100 ohm-m to 500 ohm-m; in carbonaceous
Copyright © 2012 SciRes. GM

R. CHATTERJEE, S. PAUL 97
Figure 2. Identification of litho-units from (a) Gamma ray versus density; (b) Gamma ray versus resistivity; (c) Gamma ray versus P-wave velocity; (d) Gamma ray versus P-wave impedance and (e) Gamma ray versus neutron porosity cross-plots for well J1 of Jharia coalfield, India.
Copyright © 2012 SciRes. GM

R. CHATTERJEE, S. PAUL 98
Figure 3. Identification of litho-units from (a) Gamma ray versus density cross-plot for well J2; (b) Gamma ray versus den-sity and (c) Gamma ray versus resistivity cross-plots for well S1; (d) Gamma ray versus density cross-plot for well S10 and (e) Gamma ray versus density cross-plot for well S14 of Jharia coalfield, India.
Copyright © 2012 SciRes. GM

R. CHATTERJEE, S. PAUL 99
Figure 4. Identification of litho-units from (a) Gamma ray versus density and (b) Gamma ray versus resistivity cross-plots for well K4; (c) Gamma ray versus density cross-plot for well K10 and (d) Gamma ray versus density cross-plot for well M1 of Jharia coalfield, India
Table 2. Well log derived physical parameters for coal bearing litho-units of Jharia coalfield, India.
Litho-unit Gamma Ray Log
(cps) Density Log
(gm/cc) Resistivity Log
(ohm-m) Neutron Porosity Log
(%) P-wave Velocity
(m/sec) P-wave Impedance
(gm/cc*m/sec)
Coal 20 - 70 1.32 - 1.60 500 - 4000 55 - 80 2200 - 3000 3000 - 4500
Shaly Coal 70 - 90 1.60 - 1.90 400 - 800 40 - 50 3000 - 4500 4500 - 10000
Carb. Shale 90 - 180 1.45 - 1.60 250 - 400 30 - 50 3200 - 4500 4800 - 10000
Shale 90 - 280 2.00 - 2.55 1 - 15 20 - 40 3000 - 5000 4500 - 11000
Sandstone 30 - 60 1.95 - 2.72 50 - 400 10 - 25 4000 - 5000 7800 - 14000
Jhama 20 - 50 1.70 - 2.00 20 - 60 60 - 80 2200 - 3000 3500 - 4500
Carb. = Carboneceous.
Copyright © 2012 SciRes. GM

R. CHATTERJEE, S. PAUL
Copyright © 2012 SciRes. GM
100
shale from 1.48 gm/cc to 1.6 gm/cc, 100 cps to 160 cps and 250 ohm-m to 400 ohm-m; in sand from 2.45 gm/cc to 2.62 gm/cc, 20cps to 80 cps and 10 ohm-m to 100 ohm-m; in shaly sand from 2.3 gm/cc to 2.4 gm/cc, 80 cps to 150 cps and 50 ohm-m to 80 ohm-m and in shale from 2.0 gm/cc to 2.44 gm/cc,150 cps to 300 cps and 1 ohm-m to 10 ohm-m respectively. It is observed that shaly coal and shaly sandstone may not be identified from the lone gamma ray versus resistivity cross-plot.
Though all the major and local coal seams of the study area are identified but for this present study only ma-jor/regionally persistent coal seams are considered. A total of 18 major coal seams, namely, seams A, B, C, D, E, F, G, H, I, J, K, L, M, N, O, P, Q and R are identified where seam A is the bottom most and seam R is the top most seam.
The bottom most seam A is identified only in well S10 from well log analysis. Due to the presence of thin non-coal units/partings between seams E and F and seams F and G throughout the study area, the seams E, F and G are always marked as a single seam (E/F/G combined seam) for this study area. To show the major seams as identified from well logs, a selected depth interval from 140.98 m to 849.78 m for well K4 and from 519.97 m
5. Identification of Coal Seams from Well Logs
All the coal seams of 15 exploratory wells, namely, S1, S5, S8, S10, S14, K1, K4, K8, K1, J1, J2, J3, J4, M1 and M2 have been identified from combined signatures of available gamma ray, resistivity and density logs against coal and non-coal litho-units whereas coal seams in well J5 are marked with the help of available litho-log.
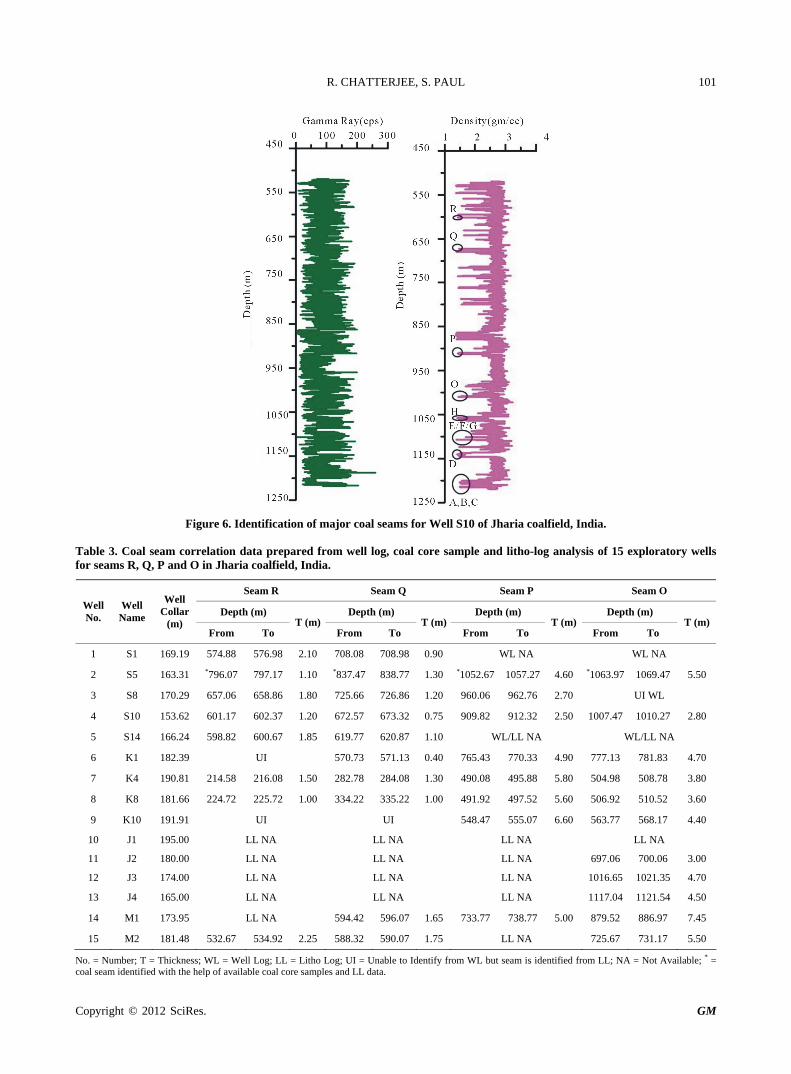
to 1220.77 m for well S10 is chosen out of the 15 wells. Figure 5 displays the signature of gamma ray, short normal resistivity and caliper corrected density log with identified major coal seams for wells K4 and Figure 6 displays the signature of gamma ray and caliper cor-rected density log for well S10.
The classification/nomenclature of identified coal seams have been carried out with the help of available litho-log data which were prepared considering the fol-lowing factors: a) thickness of coal and non-coal litho- units; b) litho-units occurring at the roof and floor of the coal seams with trend of litho-facies variation etc. It is to be mentioned here that for nomenclature of coal seams, available litho-logs played the most important role.
Tables 3-6 include particulars of the well number, seam name, depth and thickness of regional coal seam. The major persistent coal seams may act as a potential CBM reservoir under the study area.
Figure 5. Identification of major coal seams for Well K4 of Jharia coalfield, India.
R. CHATTERJEE, S. PAUL 101
Figure 6. Identification of major coal seams for Well S10 of Jharia coalfield, India.
Table 3. Coal seam correlation data prepared from well log, coal core sample and litho-log analysis of 15 exploratory wells for seams R, Q, P and O in Jharia coalfield, India.
Seam R Seam Q Seam P Seam O
Depth (m) Depth (m) Depth (m) Depth (m) Well No.
Well Name
Well Collar
(m) From To
T (m) From To
T (m)From To
T (m) From To
T (m)
1 S1 169.19 574.88 576.98 2.10 708.08 708.98 0.90 WL NA WL NA
2 S5 163.31 *796.07 797.17 1.10 *837.47 838.77 1.30 *1052.67 1057.27 4.60 *1063.97 1069.47 5.50
3 S8 170.29 657.06 658.86 1.80 725.66 726.86 1.20 960.06 962.76 2.70 UI WL
4 S10 153.62 601.17 602.37 1.20 672.57 673.32 0.75 909.82 912.32 2.50 1007.47 1010.27 2.80
5 S14 166.24 598.82 600.67 1.85 619.77 620.87 1.10 WL/LL NA WL/LL NA
6 K1 182.39 UI 570.73 571.13 0.40 765.43 770.33 4.90 777.13 781.83 4.70
7 K4 190.81 214.58 216.08 1.50 282.78 284.08 1.30 490.08 495.88 5.80 504.98 508.78 3.80
8 K8 181.66 224.72 225.72 1.00 334.22 335.22 1.00 491.92 497.52 5.60 506.92 510.52 3.60
9 K10 191.91 UI UI 548.47 555.07 6.60 563.77 568.17 4.40
10 J1 195.00 LL NA LL NA LL NA LL NA
11 J2 180.00 LL NA LL NA LL NA 697.06 700.06 3.00
12 J3 174.00 LL NA LL NA LL NA 1016.65 1021.35 4.70
13 J4 165.00 LL NA LL NA LL NA 1117.04 1121.54 4.50
14 M1 173.95 LL NA 594.42 596.07 1.65 733.77 738.77 5.00 879.52 886.97 7.45
15 M2 181.48 532.67 534.92 2.25 588.32 590.07 1.75 LL NA 725.67 731.17 5.50
No. = Number; T = Thickness; WL = Well Log; LL = Litho Log; UI = Unable to Identify from WL but seam is identified from LL; NA = Not Available; * = coal seam identified with the help of available coal core samples and LL data.
Copyright © 2012 SciRes. GM

R. CHATTERJEE, S. PAUL 102
Table 4. Coal seam correlation data prepared from well log, coal core sample and litho-log analysis of 15 exploratory wells for seams N, M, L and K in Jharia coalfield, India.
Seam N Seam M Seam L Seam K
Depth (m) Depth (m) Depth (m) Depth (m) Well No.
Well Name
Well Collar
(m) From To
T (m)From To
T (m)From To
T (m) From To
T (m)
1 S1 169.19 WL NA WL NA WL NA WL NA
2 S5 163.31 WL/CC/LL NA WL/CC/LL NA WL/CC/LL NA WL/CC/LL NA
3 S8 170.29 1019.46 1021.36 1.90 1043.96 1045.86 1.90 1098.46 1101.76 3.30 1102.86 1104.26 1.40
4 S10 153.62 Fault Fault Fault Fault
5 S14 166.24 WL/LL NA WL/LL NA WL/LL NA WL/LL NA
6 K1 182.39 WL NA WL NA WL NA WL NA
7 K4 190.81 542.08 543.68 1.60 561.28 563.28 2.00 631.48 634.38 2.90 639.88 641.08 1.20
8 K8 181.66 540.92 542.22 1.30 562.52 564.32 1.80 633.72 636.02 2.30 643.22 644.82 1.60
9 K10 191.91 604.57 605.77 1.20 624.07 626.17 2.10 702.97 705.97 3.00 712.47 715.77 3.30
10 J1 195.00 LL NA LL NA LL NA LL NA
11 J2 180.00 LL NA 791.26 794.96 3.70 LL NA LL NA
12 J3 174.00 LL NA 1100.95 1108.75 7.80 LL NA LL NA
13 J4 165.00 LL NA LL NA LL NA LL NA
14 M1 173.95 LL NA LL NA LL NA LL NA
15 M2 181.48 LL NA LL NA LL NA LL NA
No. = Number; T = Thickness; WL = Well Log; CC = Coal Core; LL = Litho Log; NA = Not Available; Fault = Fault marked in LL. Table 5. Coal seam correlation data prepared from well log, coal core sample and litho-log analysis of 15 exploratory wells for seams J, I, H and E/F/G in Jharia coalfield, India.
Seam J Seam I Seam H Seam E/F/G
Depth (m) Depth (m) Depth (m) Depth (m) Well No.
Well Name
Well Collar
(m) From To
T (m) From To
T (m)From To
T (m) From To
T (m)
1 S1 169.19 WL NA WL NA WL NA WL NA
2 S5 163.31 WL/CC/LL NA WL/CC/LL NA WL/CC/LL NA WL/CC/LL NA
3 S8 170.29 1128.76 1130.46 1.70 1188.36 1195.96 7.60 WL/LL NA WL/LL NA
4 S10 153.62 Fault Fault 1054.87 1059.62 4.75 1086.97 1094.47 7.50
5 S14 166.24 WL/LL NA WL/LL NA WL/LL NA WL/LL NA
6 K1 182.39 WL NA WL NA WL NA WL NA
7 K4 190.81 663.78 667.28 3.50 674.88 676.38 1.50 720.58 721.58 1.00 762.08 792.68 30.60
8 K8 181.66 WL NA WL NA WL NA WL NA
9 K10 191.91 735.47 738.07 2.60 746.47 748.07 1.60 788.07 790.77 2.70 831.17 860.17 29.00
10 J1 195.00 LL NA LL NA LL NA 946.42 976.62 30.20
11 J2 180.00 900.21 902.36 2.15 LL NA LL NA LL NA
12 J3 174.00 1223.75 1228.85 5.10 1244.05 1246.05 2.00 1327.05 1330.65 3.60 UI
13 J4 165.00 1345.04 1354.24 9.20 LL NA LL NA LL NA
14 M1 173.95 LL NA LL NA LL NA LL NA
15 M2 181.48 LL NA LL NA LL NA LL NA
No. = Number; T = Thickness; CC = Coal Core; WL = Well Log; LL = Litho Log; UI = Unable to Identify from WL but seam is identified from LL; NA = Not Available; Fault = Fault marked in LL.
Copyright © 2012 SciRes. GM

R. CHATTERJEE, S. PAUL
Copyright © 2012 SciRes. GM
103
Table 6. Coal seam correlation data prepared from well log, coal core sample and litho-log analysis of 15 exploratory wells for seams D, C, B and A in Jharia coalfield, India.
Seam D Seam C Seam B Seam A
Depth (m) Depth (m) Depth (m) Depth (m) Well No.
Well Name
Well Collar
(m) From To
T (m) From To
T (m)From To
T (m) From To
T (m)
1 S1 169.19 WL NA WL NA WL NA WL NA
2 S5 163.31 WL/CC/LL NA WL/CC/LL NA WL/CC/LL NA WL/CC/LL NA
3 S8 170.30 WL/LL NA WL/LL NA WL/LL NA WL/LL NA
4 S10 153.62 1137.17 1146.17 9.00 1185.22 1186.97 1.75 1200.77 1210.12 9.35 1214.52 1215.72 1.20
5 S14 166.24 WL/LL NA WL/LL NA WL/LL NA WL/LL NA
6 K1 182.39 WL NA WL NA WL NA WL NA
7 K4 190.81 802.28 808.08 5.80 831.18 833.48 2.30 842.28 846.38 4.10 WL NA
8 K8 181.66 WL NA WL NA WL NA WL NA
9 K10 191.91 865.35 869.37 4.02 884.77 888.57 3.80 *895.67 896.27 0.60 WL/CC/LL NA
10 J1 195.00 LL NA LL NA LL NA LL NA
11 J2 180.00 LL NA LL NA LL NA LL NA
12 J3 174.00 LL NA LL NA LL NA LL NA
13 J4 165.00 LL NA LL NA LL NA LL NA
14 M1 173.95 LL NA LL NA LL NA LL NA
15 M2 181.48 LL NA LL NA LL NA LL NA
No. = Number; T = Thickness; CC = Coal Core; WL = Well Log; LL = Litho Log; NA = Not Available; Fault = Fault marked in LL; * = coal seam identified with the help of available CC samples and LL data.
6. Conclusion
The cross-plots such as gamma ray versus density, gamma ray versus P-wave velocity and gamma ray ver- sus P-wave impedance show intersecting linear trends of coal and non-coal lithologies. Coal and sand litho-units are in two straight lines merging against shale. Clustering of points for different lithologies in the above cross-plots indicate that the different trends with marginal overlap between carbonaceous shale/shaly coal and shale as well as shaly sand and shale. These cross-plots clearly dem-onstrate that position of shale or sand on the cross-plot depends on sand: shale ratio of the given litho-unit. Hence sand-shale lithologies show distinctly different trend with respect to carbonaceous lithology. Gamma ray versus density cross-plots identifies coal, shaly coal, carbona-ceous shale, sand, shay sand and shale. It may be further noticed that coal, shaly coal/shale and sands are very well identified in gamma ray versus P-wave velocity cross-plot. The combination of density and P-wave velocity in gam- ma ray versus P-wave impedance cross-plots have been utilized for delineating coal and non-coal lithology. P- wave impedance for coal varies from 3000 gm/cc*m/sec to 4500 gm/cc*m/sec whereas P-wave impedance for
sand varies from 9000 gm/cc*m/sec to 12000 gm/cc*m/ sec. Gamma ray versus neutron porosity cross-plots in wells J3 and J4 identify sand and coal clearly because neutron porosity response against coal is more due to maximum hydrogen richness index in coal and compara-tively less hydrogen richness index in sand. The coal horizons are mostly overlain and underlain by shale or sandstone. Cross-plot analysis indicates the various coal lithologies which will play important role in CBM ex-ploration and exploitation strategy.
7. Acknowledgements
The authors express their sincere gratitude to Coal India Limited (CIL) and Central Mine Planning and Design Institute Limited (CMPDIL), Ranchi for the financial assistance under its R&D scheme. Supports extended by Mr. A. K. Singh, CMPDI Ranchi; Mr. A. N. Sahay, Di-rector (RD&T), CMPDI Ranchi; Chief General Manager (Exploration), CMPDI Ranchi; Mr. P. K. Hazra, General Manager (Geophysics), CMPDI Ranchi are gratefully acknowledged. Authors are thankful to Sri P. K. Pal, Ex-CGM (Exploration), CMPDI Ranchi for his kind support in editing the manuscript.
R. CHATTERJEE, S. PAUL 104
REFERENCES [1] W. B. Ayers Jr., “Coalbed Gas Systems, Resources, and
Production and a Review of Contrasting Cases from the San Juan and Powder River Basins,” AAPG Bulletin, Vol. 86, No. 11, 2002, pp. 1853-1890.
[2] S. Bachu and K. Michael, “Possible Controls of Hydroge- ological and Stress Regimes on the Producibility of Coal-bed Methane in Upper Cretaceous—Tertiary Strata of the Alberta Basin, Canada,” AAPG Bulletin, Vol. 87, No. 11, 2003, pp. 1729-1754. doi:10.1306/06030302015
[3] J. S. Bell and S. Bachu, “In Situ Stress Magnitude and Orientation Estimates for Cretaceous Coal-Bearing Strata Beneath the Plains Area of Central and Southern Alberta,” Bulletin of Canadian Petroleum Geology, Vol. 51, No. 1, 2003, pp. 1-28. doi:10.2113/gscpgbull.51.1.1
[4] T. Gentzis, “Review of Mannville Coal Geomechanical Properties: Application to Coalbed Methane Drilling in the Central Alberta Plains, Canada,” Energy Sources, Part A: Recovery, Utilization, and Environmental Effects, Vol. 32, No. 4, 2009, pp. 355-369. doi:10.1080/15567030802466110
[5] H. E. Ross and M. D. Zoback, “Sub-Hydrostatic Pore Pres- sure in Coalbed and Sand Aquifers of the Powder River Basin, Wyoming and Montana, and Implications for Dis- posal of Coalbed-Methane-Produced Water through In- jection,” Rocky Mountain Geology, Vol. 43, No. 2, 2008, pp. 155-169. doi:10.2113/gsrocky.43.2.155
[6] S. Hunze and T. Wonik, “Lithological and Structural Cha-
racteristics of the Lake Bosumtwi Impact Crater, Ghana: Interpretation of Acoustic Televierwe Images,” Meteorit- ics & Planetary Science, Vol. 42, No. 4-5, 2007, pp. 779- 792. doi:10.1111/j.1945-5100.2007.tb01074.x
[7] M. G. Lamont, T. A. Thompson and C. Bevilacqua, “Dril- ling Success as a Result of Probabilistic Lithology and Fluid Prediction: A Case Study in the Carnarvon Basin, WA,” APPEA, 2008, pp. 1-12.
[8] P. F. Anderson and F. D. Gray, “Using LMR for Dual Attribute Lithology Identification,” Expanded Abstracts, SEG, San Antonio, 2001.
[9] F. D. Gray and E. C. Andersen, “Case Histories: Inver- sion for Rock Properties,” EAGE 62nd Conference and Technical Exposition, 2000.
[10] X. G. Chi and D. H. Han, “Lithology and Fluid Differen- tiation Using a Rock Physics Template,” The Leading Edge, Vol. 28, No. 1, 2009, pp. 60-65. doi:10.1190/1.3064147
[11] L. M. Gochioco, “Recent Role of Geophysics in US Coal and CBM Development,” The Leading Edge, Vol. 21, No. 5, 2002, pp. 452-455. doi:10.1190/1.1885502
[12] D. Chandra, “Jharia Coalfield,” Mineral Resources of India, Geological Society of India, Bangalore, 1992.
[13] Y. Yang, T. A. Cloud and C. W. Van Kirk, “New Appli- cations of Well Log Parameters in Coalbed Methane (CBM) Reservoir Evaluation at the Drunkards Wash Unit, Uinta Basin, Utah,” SPE Eastern Regional Meeting, Mor- gantown, 14-16 September 2005, Paper ID: SPE 97988.
Copyright © 2012 SciRes. GM