application of artificial intelligence and data mining … · 2017-11-29 · solutions. artificial...
TRANSCRIPT
ActA všfs, 1/2012, vol. 6062
Application of Artificial Intelligence and Data Mining Techniques to Financial Markets
Využití technik umělé inteligence a dolování dat na finančních trzích
KATARÍNA HIĽOVSKÁ, PETER KONCZ
Abstractthe aim of artificial intelligence is to discover mechanisms of adaptation in a changing environment with utilisation of intelligence, for instance in the ability to exclude unlikely solutions. artificial intelligence methods have extensive application in different fields such as medicine, games, transportation, or heavy industry. this paper deals with interdisci-plinary issues – interconnection of artificial intelligence and finance. the paper briefly describes techniques of data mining, expert systems and agent based computation in-telligence and specifies the types of tasks solved by these techniques in the context of financial tasks. it provides deeper insight into potential usage of intelligent systems on financial markets.
Keywordsartificial intelligence, data mining, financial markets, forecasting, stock exchange
AbstraktCílem umělé inteligence je objevit mechanismy adaptace v měnícím se prostředí s použitím inteligence, například ve schopnosti odmítnout nepravděpodobná řešení. Metody umělé inteligence mají rozsáhlé využití v nejrůznějších oblastech jako medicína, hry, doprava a těžký průmysl. tato práce pojednává o interdisciplinární problematice - propojení umělé inteligence a financí. Práce ve zkratce popisuje techniky dolování dat, expertní systémy a výpočetní inteligenci založenou na agentech a specifikuje typy úkolů řešené pomocí těchto technik v kontextu finančních problémů. Přináší hlubší pohled na možné využití inteligentních systémů na finančních trzích.
Klíčová slovaumělá inteligence, dolování dat, finanční trhy, prognózování, burza cenných papírů
Introduction
Current economics requires a prompt and accurate decision-making process in a constant-ly changing market environment. there is an increasing tendency in the usage of informa-tion technologies in the decisions of economic subjects. traditional statistic methods are in recent times often complemented by methods of machine learning. the potential of applied machine learning rests not only in prompt and reliable performance but also in its ability to discover hidden knowledge in huge amounts of data. decision making with artificial intelligence support can partly eliminate the bounded rationality of a decision maker to make better decision with more relevant data and information.
063ActA všfs, 1/2012, vol. 6
artificial intelligence deals with problems of classification, prediction and optimization incorporating processes that can be called intelligent in decision making etc. where the problems cannot be simply formalised. these problems are typical also for economics and therefore there is a potential in usage of artificial intelligence techniques in this field.
the main goal of this paper is to point out the artificial intelligence techniques that can be utilised in financial application and to provide an overview of research undertaken in this field. the paper is aimed toward an economic audience unfamiliar with artifi-cial intelligence techniques and may consider utilization of these techniques in further research.
1 Data Mining and Artificial Intelligence
data mining is defined as the process of extracting valid, previously unknown, compre-hensible, and actionable information from large databases and using it to make crucial business decisions (Simoudis, 1996). data mining is considered as the key process of knowledge discovery in databases (kdd) (Seifert, 2004). the main data mining techniques are Classification and Clustering analysis, time-series mining, and association rules min-ing (Johnson, 2011).
data mining techniques are mostly based on statistics, as well as machine learning while the patterns may be inferred from different types of data. Methods used in data mining, such as machine learning, belong to the field of artificial intelligence.
artificial intelligence (ai) systems are designed to adapt and learn. the first definition of ai is based on the turing test. alan turing undertook a test of a machine‘s ability to demon-strate intelligence. it proceeds as follows: a human judge engages in a natural language conversation with one human and one machine, each of which tries to appear human. the aim of the judge is to distinguish human from machine, only on the basis of conversation (without visual or other help). when the judge cannot distinguish between human and machine, than the machine may be considered as intelligent.
the ai approach can be split into two main approaches – Symbolic (Conventional) ai and Sub symbolic ai (Computational intelligence). Conventional ai uses logic and rules to make decisions. Examples of conventional ai techniques are expert systems and Bayesian networks. it is a top-down approach. Computational intelligence (soft computing) takes inspiration from biological mechanisms and uses a bottom-up approach. Examples of computational intelligence techniques used in economic application are neural networks, genetic algorithms, fuzzy systems etc. (Johnson, 2011).
2 Application of Data mining on Financial Markets
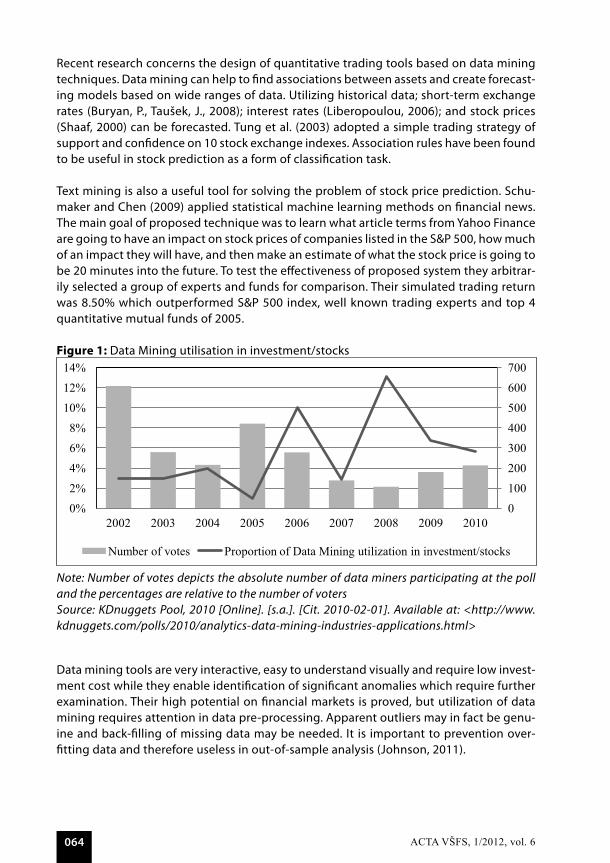
according to a poll undertaken by kd nuggets in 2010 (Figure 1) there was an increasing trend in utilizing data mining techniques in investment until 2008.
ActA všfs, 1/2012, vol. 6064
recent research concerns the design of quantitative trading tools based on data mining techniques. data mining can help to find associations between assets and create forecast-ing models based on wide ranges of data. utilizing historical data; short-term exchange rates (Buryan, P., taušek, J., 2008); interest rates (liberopoulou, 2006); and stock prices (Shaaf, 2000) can be forecasted. tung et al. (2003) adopted a simple trading strategy of support and confidence on 10 stock exchange indexes. association rules have been found to be useful in stock prediction as a form of classification task.
text mining is also a useful tool for solving the problem of stock price prediction. Schu-maker and Chen (2009) applied statistical machine learning methods on financial news. the main goal of proposed technique was to learn what article terms from yahoo Finance are going to have an impact on stock prices of companies listed in the S&P 500, how much of an impact they will have, and then make an estimate of what the stock price is going to be 20 minutes into the future. to test the effectiveness of proposed system they arbitrar-ily selected a group of experts and funds for comparison. their simulated trading return was 8.50% which outperformed S&P 500 index, well known trading experts and top 4 quantitative mutual funds of 2005.
Figure 1: data Mining utilisation in investment/stocks
Text mining is also a useful tool for solving the problem of stock price prediction. Schumaker and Chen (2009) applied statistical machine learning methods on financial news. The main goal of proposed technique was to learn what article terms from Yahoo Finance are going to have an impact on stock prices of companies listed in the S&P 500, how much of an impact they will have, and then make an estimate of what the stock price is going to be 20 minutes into the future. To test the effectiveness of proposed system they arbitrarily selected a group of experts and funds for comparison. Their simulated trading return was 8.50% which outperformed S&P 500 index, well known trading experts and top 4 quantitative mutual funds of 2005. Picture 1: Data Mining utilisation in investment/stocks
Note: Number of votes depicts the absolute number of data miners participating at the poll and the percentages are relative to the number of voters Source: KDnuggets Pool, 2010 [Online]. [s.a.]. [Cit. 2010-02-01]. Available at: <http://www.kdnuggets.com/polls/2010/analytics-data-mining-industries-applications.html>
Data mining tools are very interactive, easy to understand visually and require low investment cost while they enable identification of significant anomalies which require further examination. Their high potential on financial markets is proved, but utilization of data mining requires attention in data pre-processing. Apparent outliers may in fact be genuine and back-filling of missing data may be needed. It is important to prevention over-fitting data and therefore useless in out-of-sample analysis (Johnson, 2011). 3 Application of artificial intelligence on financial markets
3.1 Expert (knowledge) systems (ES)
An expert system is a computer-based system with artificial intelligence that emulates the reasoning process of a human expert within a specific domain of knowledge. Expert systems are based on explicitly formulated special knowledge obtained from experts to achieve decision on the expert level (Feigenbaum et al., 1988). The aim of an expert system is not modelling the mental processes of human experts during a decision process but achievement of high quality decision. Expert systems have to provide recommendation even when part of the required data is not available. This requires databases with multiple or alternative inferences. In addition these partial conclusions may be explained by expert system and appropriate additional question may be provided (Mařík et al., 1997).
0
100
200
300
400
500
600
700
0%
2%
4%
6%
8%
10%
12%
14%
2002 2003 2004 2005 2006 2007 2008 2009 2010
Number of votes Proportion of Data Mining utilization in investment/stocks
Note: Number of votes depicts the absolute number of data miners participating at the poll and the percentages are relative to the number of votersSource: KDnuggets Pool, 2010 [Online]. [s.a.]. [Cit. 2010-02-01]. Available at: <http://www.kdnuggets.com/polls/2010/analytics-data-mining-industries-applications.html>
data mining tools are very interactive, easy to understand visually and require low invest-ment cost while they enable identification of significant anomalies which require further examination. their high potential on financial markets is proved, but utilization of data mining requires attention in data pre-processing. apparent outliers may in fact be genu-ine and back-filling of missing data may be needed. it is important to prevention over-fitting data and therefore useless in out-of-sample analysis (Johnson, 2011).
065ActA všfs, 1/2012, vol. 6
3 Application of Artificial Intelligence on Financial Markets
3.1 Expert (knowledge) Systems (ES)
an expert system is a computer-based system with artificial intelligence that emulates the reasoning process of a human expert within a specific domain of knowledge. Expert systems are based on explicitly formulated special knowledge obtained from experts to achieve decision on the expert level (Feigenbaum et al., 1988). the aim of an expert system is not modelling the mental processes of human experts during a decision process but achievement of high quality decision. Expert systems have to provide recommendation even when part of the required data is not available. this requires databases with multiple or alternative inferences. in addition these partial conclusions may be explained by expert system and appropriate additional question may be provided (Mařík et al., 1997).
the study by Collopy and armstrong (1992), developed a rule base to make annual ex-trapolation forecasts for economic and demographic time series on M-competition data. their rule-based expert system produced more accurate forecasts than the random walk and equal-weights combined. they performed better, particularly in long term periods for series with significant trends, low uncertainty, stability and good domain knowledge. korczak and lipinsky (2004) compared two real time trading systems using Stochastic oscillators, relative Strength index and Ease of Movement. the first system was based on 350 trading rules and the second on 150 trading rules created by linear combination of the first system. the experiment was realized on Paris Stock Exchange and they found out that reducing the trading rules reduced the computation time without considerable influence on expertise quality.
one of the main advantages of expert systems is that they allow combination of different knowledge sources. the expert system is able to provide permanent documentation of decision making process and overview of all steps.
on the other hand in comparison to human experts the expert system must be explicitly updated and can´t draw analogies from other sources to solve newly encountered prob-lems (liberopoulou, 2006).
3.2 Artificial Neural Networks (ANNs)
artificial neural networks are composed of simple elements operating in parallel. likened to a biological nervous system the function of ann is determined largely by the connections between elements. with explicit knowledge about target values the network is able to “learn” by adjusting the values between connections (weights between elements). anns are widely used to solve problems of classification, prediction, and control (Hlaváček et al., 2005).
the main advantage in utilizing anns is their ability to capture nonlinearity without prior knowledge about functional relationships between variables. anns operate as „universal approximation systems“ with the ability to mimic almost any function dependency. they are resistant to outliers and do not require a specific distribution. in comparison to econo-metric models ann give results in a shorter time period. By employing ann the weight
ActA všfs, 1/2012, vol. 6066
and parametric system are adjustable and it is possible to work with a given degree of accuracy (Fanta, 2001).
the drawback in ann application is the absence of a standard paradigm to design the network. For anns, the main disadvantage in utilization is described by the concept of the “black box”. it is difficult to identify the influence of a selected input variable upon the output (Fanta, 2001). when using anns a data set of sufficient length is required to prevent overfitting the network during a learning phase (Gonzalez, 2000).
neural networks have been successfully applied to solve problems of generalization in prediction of corporate bond rating, where traditional mathematical modelling tech-niques performed weakly (dutta et al., 1988); (Chaveesuk et al., 1999); (Manzoni, 2004).
kim et al. (2009) modelled a system evaluating the current time series against the past stable time series by stationary autoregressive model via artificial neural networks. the potential of the proposed model was demonstrated on the korean stock market.
anns are widely used by central banks to forecast the interest rates and the monetary policy of governments (Hlaváček et al., 2005). utilization of anns is common in research regarding inflation forecasting (Haider, 2009); (Choudhary et al., 2008); (Mc nelis, 2004); (Moshiri et al., 2000); (nakamura, 2005); and they are mostly focused on prediction accu-racy comparison with econometric models (Haider, 2009); (Hlaváček et al., 2005); (Choud-hary et al., 2008); (Mc nelis, 2004); (Moshiri et al., 2000).
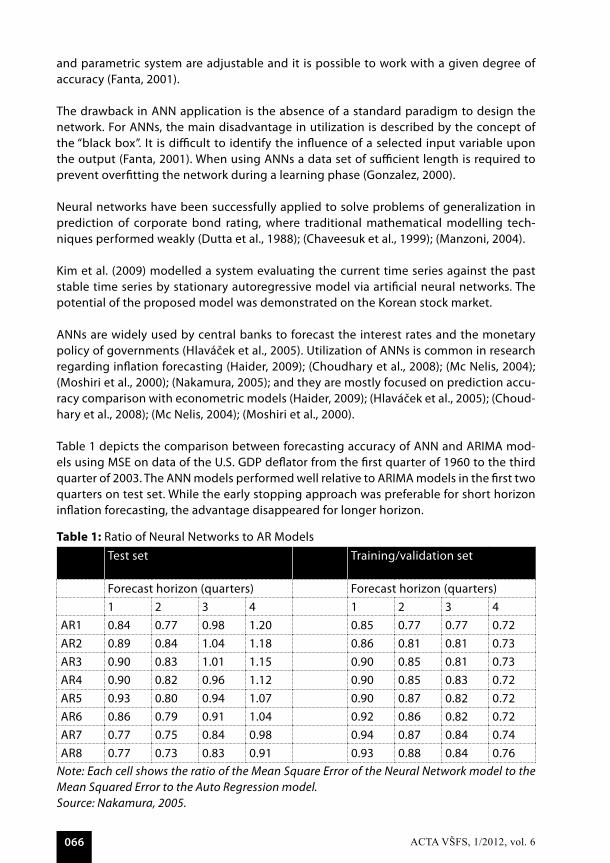
table 1 depicts the comparison between forecasting accuracy of ann and ariMa mod-els using MSE on data of the u.S. GdP deflator from the first quarter of 1960 to the third quarter of 2003. the ann models performed well relative to ariMa models in the first two quarters on test set. while the early stopping approach was preferable for short horizon inflation forecasting, the advantage disappeared for longer horizon.
Table 1: ratio of neural networks to ar Models test set
training/validation set
Forecast horizon (quarters) Forecast horizon (quarters)1 2 3 4 1 2 3 4
ar1 0.84 0.77 0.98 1.20 0.85 0.77 0.77 0.72ar2 0.89 0.84 1.04 1.18 0.86 0.81 0.81 0.73ar3 0.90 0.83 1.01 1.15 0.90 0.85 0.81 0.73ar4 0.90 0.82 0.96 1.12 0.90 0.85 0.83 0.72ar5 0.93 0.80 0.94 1.07 0.90 0.87 0.82 0.72ar6 0.86 0.79 0.91 1.04 0.92 0.86 0.82 0.72ar7 0.77 0.75 0.84 0.98 0.94 0.87 0.84 0.74ar8 0.77 0.73 0.83 0.91 0.93 0.88 0.84 0.76
Note: Each cell shows the ratio of the Mean Square Error of the Neural Network model to the Mean Squared Error to the Auto Regression model.Source: Nakamura, 2005.
067ActA všfs, 1/2012, vol. 6
other research proves that neural networks perform better particularly in long term peri-ods (Moshiri et al., 2000). Higher accuracy in long-term periods was proven also on fore-casting of GdP (tkatz et al., 1999), GnP and unemployment rate (Feinbaum et al., 1988) in comparison to nonlinear regression models. the suitability of anns is examined also on time series of financial markets. the researchers are mostly focused on Forex (Gabbi et al., 2000); (Chen et al., 2008); (kiani et al., 2008); (nagarajan et al., 2005).
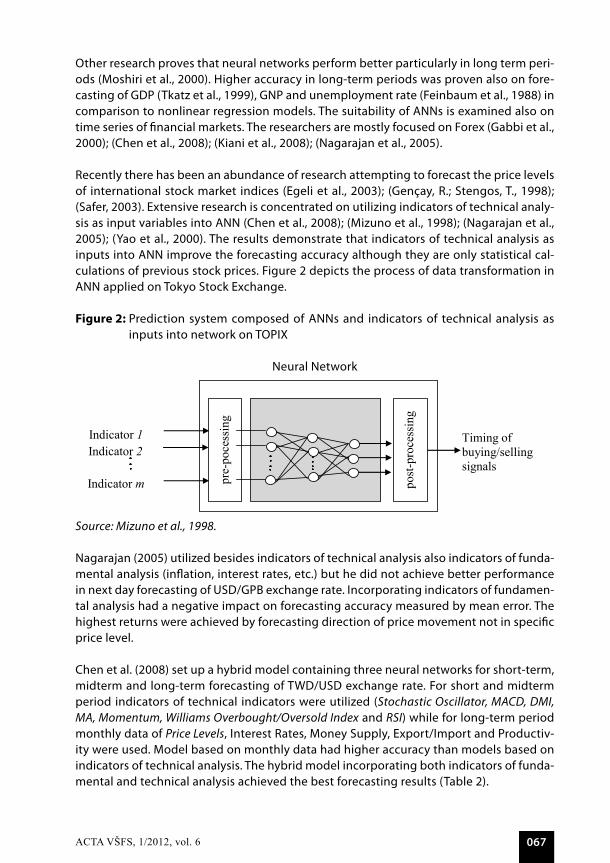
recently there has been an abundance of research attempting to forecast the price levels of international stock market indices (Egeli et al., 2003); (Gençay, r.; Stengos, t., 1998); (Safer, 2003). Extensive research is concentrated on utilizing indicators of technical analy-sis as input variables into ann (Chen et al., 2008); (Mizuno et al., 1998); (nagarajan et al., 2005); (yao et al., 2000). the results demonstrate that indicators of technical analysis as inputs into ann improve the forecasting accuracy although they are only statistical cal-culations of previous stock prices. Figure 2 depicts the process of data transformation in ann applied on tokyo Stock Exchange.
Figure 2: Prediction system composed of anns and indicators of technical analysis as inputs into network on toPiX
neural network
Source: (Mizuno et al., 1998)
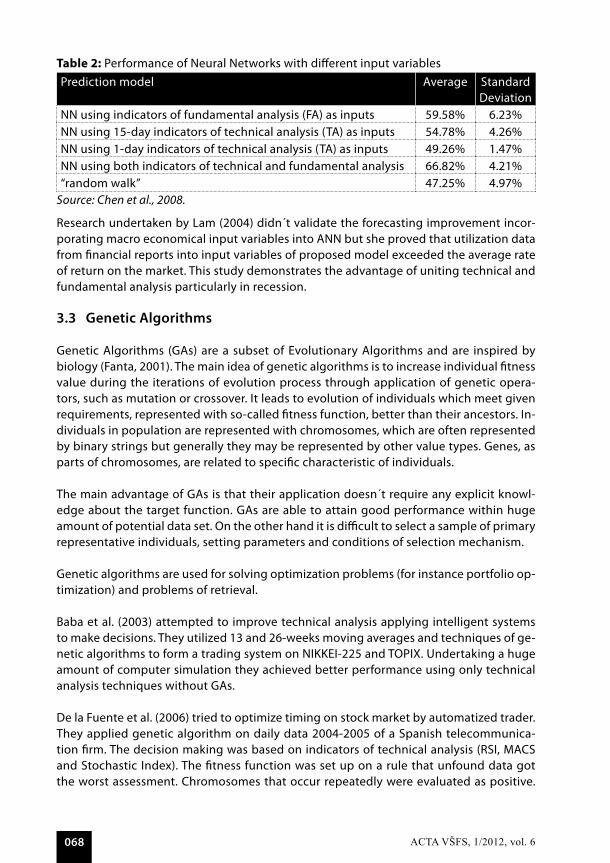
Nagarajan (2005) utilized besides indicators of technical analysis also indicators of fundamental analysis (inflation, interest rates, etc.) but he did not achieve better performance in next day forecasting of USD/GPB exchange rate. Incorporating indicators of fundamental analysis had a negative impact on forecasting accuracy measured by mean error. The highest returns were achieved by forecasting direction of price movement not in specific price level. Chen et al. (2008) set up a hybrid model containing three neural networks for short-term, midterm and long-term forecasting of TWD/USD exchange rate. For short and midterm period indicators of technical indicators were utilized (Stochastic Oscillator, MACD, DMI, MA, Momentum, Williams Overbought/Oversold Index and RSI) while for long-term period monthly data of Price Levels, Interest Rates, Money Supply, Export/Import and Productivity were used. Model based on monthly data had higher accuracy than models based on indicators of technical analysis. The hybrid model incorporating both indicators of fundamental and technical analysis achieved the best forecasting results (Table 2: Performance of Neural Networks with different input variables
Prediction model Average Standard Deviation
NN using indicators of fundamental analysis (FA) as inputs 59.58% 6.23% NN using 15-day indicators of technical analysis (TA) as inputs 54.78% 4.26% NN using 1-day indicators of technical analysis (TA) as inputs 49.26% 1.47% NN using both indicators of technical and fundamental analysis 66.82% 4.21% "random walk” 47.25% 4.97% Source:
Research undertaken by Lam didn´t validate the forecasting improvement incorporating macro economical input variables into ANN but she proved that utilization data from financial reports into input variables of proposed model exceeded the average rate of return on the market. This study demonstrates the advantage of uniting technical and fundamental analysis particularly in recession. ). Table 2: Performance of Neural Networks with different input variables
Prediction model Average Standard Deviation
NN using indicators of fundamental analysis (FA) as inputs 59.58% 6.23% NN using 15-day indicators of technical analysis (TA) as inputs 54.78% 4.26% NN using 1-day indicators of technical analysis (TA) as inputs 49.26% 1.47% NN using both indicators of technical and fundamental analysis 66.82% 4.21%
Výstupná vrstva
Skrytá vrstva
Vstupná vrstva
post
-pro
cess
ing
Indicator 1
pre-
poce
ssin
g
Indicator 2 Timing of buying/selling signals
Indicator m
Source: Mizuno et al., 1998.
nagarajan (2005) utilized besides indicators of technical analysis also indicators of funda-mental analysis (inflation, interest rates, etc.) but he did not achieve better performance in next day forecasting of uSd/GPB exchange rate. incorporating indicators of fundamen-tal analysis had a negative impact on forecasting accuracy measured by mean error. the highest returns were achieved by forecasting direction of price movement not in specific price level.
Chen et al. (2008) set up a hybrid model containing three neural networks for short-term, midterm and long-term forecasting of twd/uSd exchange rate. For short and midterm period indicators of technical indicators were utilized (Stochastic Oscillator, MACD, DMI, MA, Momentum, Williams Overbought/Oversold Index and RSI) while for long-term period monthly data of Price Levels, interest rates, Money Supply, Export/import and Productiv-ity were used. Model based on monthly data had higher accuracy than models based on indicators of technical analysis. the hybrid model incorporating both indicators of funda-mental and technical analysis achieved the best forecasting results (table 2).
Source: (Mizuno et al., 1998)
Nagarajan (2005) utilized besides indicators of technical analysis also indicators of fundamental analysis (inflation, interest rates, etc.) but he did not achieve better performance in next day forecasting of USD/GPB exchange rate. Incorporating indicators of fundamental analysis had a negative impact on forecasting accuracy measured by mean error. The highest returns were achieved by forecasting direction of price movement not in specific price level. Chen et al. (2008) set up a hybrid model containing three neural networks for short-term, midterm and long-term forecasting of TWD/USD exchange rate. For short and midterm period indicators of technical indicators were utilized (Stochastic Oscillator, MACD, DMI, MA, Momentum, Williams Overbought/Oversold Index and RSI) while for long-term period monthly data of Price Levels, Interest Rates, Money Supply, Export/Import and Productivity were used. Model based on monthly data had higher accuracy than models based on indicators of technical analysis. The hybrid model incorporating both indicators of fundamental and technical analysis achieved the best forecasting results (Table 2: Performance of Neural Networks with different input variables
Prediction model Average Standard Deviation
NN using indicators of fundamental analysis (FA) as inputs 59.58% 6.23% NN using 15-day indicators of technical analysis (TA) as inputs 54.78% 4.26% NN using 1-day indicators of technical analysis (TA) as inputs 49.26% 1.47% NN using both indicators of technical and fundamental analysis 66.82% 4.21% "random walk” 47.25% 4.97% Source:
Research undertaken by Lam didn´t validate the forecasting improvement incorporating macro economical input variables into ANN but she proved that utilization data from financial reports into input variables of proposed model exceeded the average rate of return on the market. This study demonstrates the advantage of uniting technical and fundamental analysis particularly in recession. ). Table 2: Performance of Neural Networks with different input variables
Prediction model Average Standard Deviation
NN using indicators of fundamental analysis (FA) as inputs 59.58% 6.23% NN using 15-day indicators of technical analysis (TA) as inputs 54.78% 4.26% NN using 1-day indicators of technical analysis (TA) as inputs 49.26% 1.47% NN using both indicators of technical and fundamental analysis 66.82% 4.21%
Výstupná vrstva
Skrytá vrstva
Vstupná vrstva
post
-pro
cess
ing
Indicator 1
pre-
poce
ssin
g
Indicator 2 Timing of buying/selling signals
Indicator m
ActA všfs, 1/2012, vol. 6068
Table 2: Performance of neural networks with different input variablesPrediction model average Standard
deviationnn using indicators of fundamental analysis (Fa) as inputs 59.58% 6.23%nn using 15-day indicators of technical analysis (ta) as inputs 54.78% 4.26%nn using 1-day indicators of technical analysis (ta) as inputs 49.26% 1.47%nn using both indicators of technical and fundamental analysis 66.82% 4.21%“random walk” 47.25% 4.97%
Source: Chen et al., 2008.
research undertaken by lam (2004) didn´t validate the forecasting improvement incor-porating macro economical input variables into ann but she proved that utilization data from financial reports into input variables of proposed model exceeded the average rate of return on the market. this study demonstrates the advantage of uniting technical and fundamental analysis particularly in recession.
3.3 Genetic Algorithms
Genetic algorithms (Gas) are a subset of Evolutionary algorithms and are inspired by biology (Fanta, 2001). the main idea of genetic algorithms is to increase individual fitness value during the iterations of evolution process through application of genetic opera-tors, such as mutation or crossover. it leads to evolution of individuals which meet given requirements, represented with so-called fitness function, better than their ancestors. in-dividuals in population are represented with chromosomes, which are often represented by binary strings but generally they may be represented by other value types. Genes, as parts of chromosomes, are related to specific characteristic of individuals.
the main advantage of Gas is that their application doesn´t require any explicit knowl-edge about the target function. Gas are able to attain good performance within huge amount of potential data set. on the other hand it is difficult to select a sample of primary representative individuals, setting parameters and conditions of selection mechanism.
Genetic algorithms are used for solving optimization problems (for instance portfolio op-timization) and problems of retrieval.
Baba et al. (2003) attempted to improve technical analysis applying intelligent systems to make decisions. they utilized 13 and 26-weeks moving averages and techniques of ge-netic algorithms to form a trading system on nikkEi-225 and toPiX. undertaking a huge amount of computer simulation they achieved better performance using only technical analysis techniques without Gas.
de la Fuente et al. (2006) tried to optimize timing on stock market by automatized trader. they applied genetic algorithm on daily data 2004-2005 of a Spanish telecommunica-tion firm. the decision making was based on indicators of technical analysis (rSi, MaCS and Stochastic index). the fitness function was set up on a rule that unfound data got the worst assessment. Chromosomes that occur repeatedly were evaluated as positive.
069ActA všfs, 1/2012, vol. 6
this study evidences the possibility of beating the market by application of genetic al-gorithms.
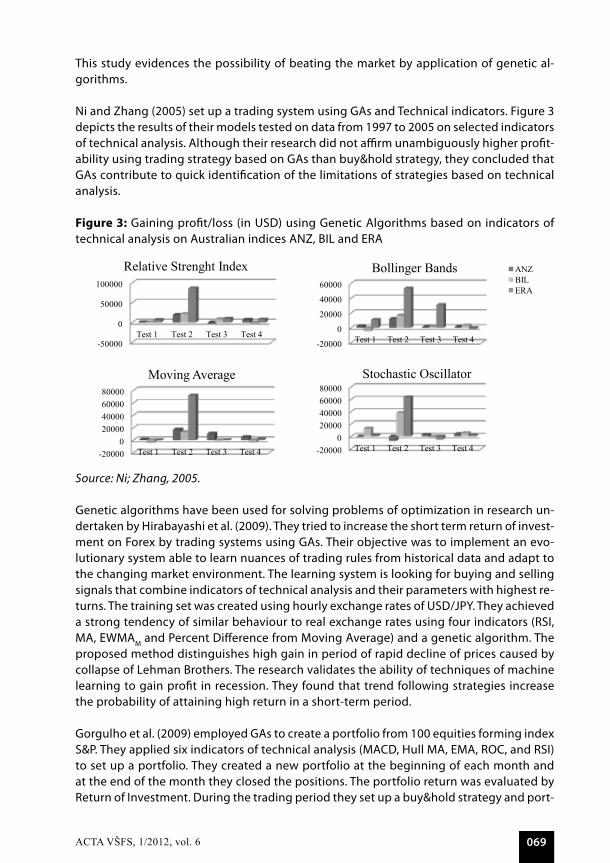
ni and zhang (2005) set up a trading system using Gas and technical indicators. Figure 3 depicts the results of their models tested on data from 1997 to 2005 on selected indicators of technical analysis. although their research did not affirm unambiguously higher profit-ability using trading strategy based on Gas than buy&hold strategy, they concluded that Gas contribute to quick identification of the limitations of strategies based on technical analysis.
Figure 3: Gaining profit/loss (in uSd) using Genetic algorithms based on indicators of technical analysis on australian indices anz, Bil and Era
Source: (Ni; Zhang, 2005)
Genetic algorithms have been used for solving problems of optimization in research undertaken by Hirabayashi et al. (2009). They tried to increase the short term return of investment on Forex by trading systems using GAs. Their objective was to implement an evolutionary system able to learn nuances of trading rules from historical data and adapt to the changing market environment. The learning system is looking for buying and selling signals that combine indicators of technical analysis and their parameters with highest returns. The training set was created using hourly exchange rates of USD/JPY. They achieved a strong tendency of similar behaviour to real exchange rates using four indicators (RSI, MA, EWMAM and Percent Difference from Moving Average) and a genetic algorithm. The proposed method distinguishes high gain in period of rapid decline of prices caused by collapse of Lehman Brothers. The research validates the ability of techniques of machine learning to gain profit in recession. They found that trend following strategies increase the probability of attaining high return in a short-term period. Gorgulho et al. (2009) employed GAs to create a portfolio from 100 equities forming index S&P. They applied six indicators of technical analysis (MACD, Hull MA, EMA, ROC, and RSI) to set up a portfolio. They created a new portfolio at the beginning of each month and at the end of the month they closed the positions. The portfolio return was evaluated by Return of Investment. During the trading period they set up a buy&hold strategy and portfolio based on random selection of stocks into a portfolio during the period 02/01/2005 – 02/01/2005 to compare the performance of the proposed models. The portfolio forms’ highest return was achieved by GA. GAs have been successfully applied for timing the trading position in combination with candle sticks analysis (Belford, 2006). The result of the proposed system was compared with return of agent designed to make random investment strategies. 3.4 Fuzzy systems
Fuzzy systems are expert systems coming out from fuzzy logic. Fuzzy logic measures uncertainty from membership values in the range <0.0, 1.0> with 0.0 representing absolute Falseness and 1.0 representing absolute Truth. In comparison to probability theory the fuzzy logic does not assume that the sum of occurrences is equal 1. The degree of membership is not
-50000
0
50000
100000
Test 1 Test 2 Test 3 Test 4
Relative Strenght Index
-20000
0
20000
40000
60000
Test 1 Test 2 Test 3 Test 4
Bollinger Bands ANZ BIL ERA
-20000 0
20000 40000 60000 80000
Test 1 Test 2 Test 3 Test 4
Moving Average
-20000 0
20000 40000 60000 80000
Test 1 Test 2 Test 3 Test 4
Stochastic Oscillator
Source: Ni; Zhang, 2005.
Genetic algorithms have been used for solving problems of optimization in research un-dertaken by Hirabayashi et al. (2009). they tried to increase the short term return of invest-ment on Forex by trading systems using Gas. their objective was to implement an evo-lutionary system able to learn nuances of trading rules from historical data and adapt to the changing market environment. the learning system is looking for buying and selling signals that combine indicators of technical analysis and their parameters with highest re-turns. the training set was created using hourly exchange rates of uSd/JPy. they achieved a strong tendency of similar behaviour to real exchange rates using four indicators (rSi, Ma, EwMaM and Percent difference from Moving average) and a genetic algorithm. the proposed method distinguishes high gain in period of rapid decline of prices caused by collapse of lehman Brothers. the research validates the ability of techniques of machine learning to gain profit in recession. they found that trend following strategies increase the probability of attaining high return in a short-term period.
Gorgulho et al. (2009) employed Gas to create a portfolio from 100 equities forming index S&P. they applied six indicators of technical analysis (MaCd, Hull Ma, EMa, roC, and rSi) to set up a portfolio. they created a new portfolio at the beginning of each month and at the end of the month they closed the positions. the portfolio return was evaluated by return of investment. during the trading period they set up a buy&hold strategy and port-
ActA všfs, 1/2012, vol. 6070
folio based on random selection of stocks into a portfolio during the period 02/01/2005 – 02/01/2005 to compare the performance of the proposed models. the portfolio forms’ highest return was achieved by Ga.
Gas have been successfully applied for timing the trading position in combination with candle sticks analysis (Belford, 2006). the result of the proposed system was compared with return of agent designed to make random investment strategies.
3.4 Fuzzy Systems
Fuzzy systems are expert systems coming out from fuzzy logic. Fuzzy logic measures un-certainty from membership values in the range <0.0, 1.0> with 0.0 representing absolute Falseness and 1.0 representing absolute truth. in comparison to probability theory the fuzzy logic does not assume that the sum of occurrences is equal 1. the degree of mem-bership is not explicitly defined and fuzzy set enable work with linguistic variables like probably, maybe and enough.
the scheme of the fuzzy system consists of three steps – fuzzification, fuzzy inference and deffuzification. the whole process starts with fuzzification which is the transformation of real data to fuzzy data. then the fuzzy logic system is used to make fuzzy inference, usually based on IF…THEN rules, and then the fuzzy data are transformed back to real data.
Fuzzy systems are well suited for decision making tasks characterized by uncertainty and therefore they are well suited for application in financial markets when decisions about volume of buying/selling of underlying assets are undertaken. Fuzzy systems used to be utilized in combination with other artificial intelligence techniques. For instance the ge-netic algorithm based on fuzzy neural networks was applied to form a database for in-vestigating quantitative effects of different events (e.g. political events) on stock markets (kuo et al., 2001). romahi and Shen (2000) built an expert system based on evolutionary rules for financial forecasting. they put together fuzzy logic with inductive rules to create a system with the ability of generalization.
neural networks based on fuzzy rules have been applied to forecast stock market returns many times in research. ang and Quek (2006) proposed a trading system based on moving average rules which achieved higher paper return than a random trading system. Similar approach of Fuzzy neural network (Fnn) based on trading rules utilizing fundamental data of 32 companies employed wong et al. (1992). kuo (1998) applied a Fnn utilizing both quantitative and qualitative factors to set up a decision support system on the tai-wan stock market and achieved better results than single anns.
Gil-aluje et al. (2011) proposed a new framework of portfolio management based on some topological axioms to select the titles of a portfolio. Homogeneity according to some at-tributes was established to extract one or several titles of each subset in order to get the desired properties. the designed system generalized previous algorithms for portfolio selection.
071ActA všfs, 1/2012, vol. 6
the main advantage of fuzzy systems is their capability to solve problems with absten-tion of strict boundaries, vaguely defined concepts and without strict. Every rule within a fuzzy system is easy to understand and revise (for instance IF the costs are high THEN the manufacturing process in inefficient and vice versa) (Pathak et al., 2003). the disadvantage of fuzzy systems is that they require knowledge about the problem solved.
3.5 Agent-based Computational Economics (ACE)
the economy can be described as a complex adaptive system with the capability to adapt to the external environment. the agents operating in the economy adjust their behaviour to the system without realizing this adaptation. Economic agents’ are thinking about their actions and about the consequences of their actions and they adjust their behaviour with concern for these aspects. they form the notion of the system they belong to (umpleby, 2007) and their behaviour influences the whole system.
From the notion of economy as a complex adaptive system emerges agent-based Com-putational Economics (aCE). aCE is a bottom up system forming models of agents and interaction rules which lead to setting up the whole system using simulations (Bruun, 2006). within this modelling approach the structure evolves without forcing any presump-tions upon it. the resulting aCE models must be dynamically complete - the modelled economic system must be able to develop over time solely on the basis of agents’ interac-tions without further intervention from the modeller.
aCE is based on bottom-up approach and requires specific features. therefore financial markets are a challenging field for aCE application due to high data accessibility and clearly specified goals of agents.
Early researches of artificial agents are based on zero intelligent agents. le Baron (2000) investigated the efficiency of zero intelligence traders on artificial foreign exchange mar-kets and he found that budget allocation of these agents was similar to human agents. in other studies simulations with more sophisticated agents have evolved. raberto et al. (2003) set up a model where trading strategies of agents were based on technical trading rules and fundamental values. kendall and Su (2003) utilized agent based approach on five selected stocks from london Stock Exchange. trading behaviour of artificial agents was based on indicators of technical analysis. this study demonstrated stable and satisfactory learning abilities of artificial traders. different learning behaviour related to the different stock price patterns was discovered; an important finding for further research in portfolio selection. kumar and Bhattacharya (2009) used multi agent approach for portfolio selec-tion and they achieved higher average returns across one month, two months and three months out-of-sample period than the FtSE 100 index.
Viewing markets as very large aggregations of agents with heterogeneous beliefs and goals often reveals very different perspective on traditional theoretical thinking. the main advantage of aCE modelling is the ability of a system to create autonomous agents with more realistic capabilities – they are able to communicate, adapt to an external environ-ment according to previous experiences, mimic, create and maintain patterns of social behaviour etc. these features are based on internal processes which are hidden from
ActA všfs, 1/2012, vol. 6072
other agent from the external environment. it leads to unpredictable and uncontrolled behaviour of the agents in relation to their external environment. aCE models increase the transparency and clarity of the modelling process and complement analytical and statistical modelling approaches.
the relative disadvantage of aCE modelling is that it requires detailed specification for agent data and methods determining structural attributes, institutional arrangements, and behavioural dispositions. if the agent interactions induce sufficiently strong positive feedbacks, small changes in initial specifications could radically affect the types of out-comes that result. (tesfatsion, 2005). it is also difficult to get empirical evidence of results obtained by simulation.
Conclusions
Studies offers supportive evidence for suitability of use artificial intelligence methods in various economic applications according to their ability to process nonlinear relationships, ability to learn and evolve in time and also ability to make decisions at expert level.
Genetic algorithms are used for optimization problems – optimization of stock market timing and portfolio creation. when solving prediction problems, genetic algorithms are used in combination with other methods of artificial intelligence. data mining tools can be used for creation of quantitative tools for short-time prediction of exchange and inter-est rates. Expert systems try to make decisions on the expert level and they are applied in analysis of securities as well as in company assessment. if we have an uncertain notion of the methods leading to a decision (what is typical for human decision makers), fuzzy systems could be the appropriate solution. Fuzzy systems are used mainly in insurance. in recent years the agent-based Computational Economics has emerged. Current aCE concentrates on financial market modelling. the approach of artificial neural networks is put into effect thanks to their ability to study the nonlinear relation between variables and their ability to work with uncertainty. they are frequently used for solving prediction problems – forecasting macroeconomic indicators and time series prediction on financial markets.
in following research we would like to focus on analysis of the dependency between fun-damental and technical analysis of securities using artificial intelligence.
Acknowledgment
this is created in support of project oCoPoMo cofounded By European Committee within 7th Framework Program; subject iCt-2009.7.3, contract number 248128.
073ActA všfs, 1/2012, vol. 6
ReferencesANG, K. K.; QUEK, C. (2006). Stock trading using rSPoP: a novel rough Set-Based neu-ron-Fuzzy approach. Neural Networks, IEEE Transactions on. Vol. 17, no. 5, pp. 1301-1315. iSSn1045-9227.BABA, N.; YAAI, W.; KAWACHI, T.; XU LIMA; ZHENGLONG, D. (2003). an intelligent dSS which improves the traditional technical analysis. SiCCE 2003: Annual Conference. Fukui. pp. 3216-3219. iSBn 0-7803-8352-4.BELFORD, P. (2006). Candlestick Stock analysis with Genetic algorithms. GECCo´06: Pro-ceedings of the 8th Annual conference on Genetic and evolutionary computation. Seattle : aCM. pp. 1851-1852. iSBn 1-59593-186-4.BRUUN, CH. (2006). agent-Based Computational Economics: an introduction. 1. Edition. Handbook of Research on Nature-Inspired Computing for Economics and Management. pp. 183-197. iSBn 1-59140-984-5.BURYAN, P.; TAUŠER, J. (2008). Strojové učení a modelování měnových kurzů v praxi finančního řízení. Ekonomický časopis. Vol. 56, no. 8, pp. 781-799. iSSn 0013-3035.COLLOPY, F.; ARMSTRONG, J. S. (1992). rule-Based Forecasting: development and Vali-dation of an Expert Systems approach to Combining time Series Extrapolations. INFORMS. Vol. 38, no. 10, pp. 1394-1414. iSSn 0025-1909.DE LA FUENTE, D.; GARRIDO, A.; LAVIADA, J.; GóMEZ, A. (2006). Genetic algorithms to optimize the time to make stock market investment. in GECCO´06: Proceedings of the 8th Annual conference on Genetic and evolutionary computation. Seattle. pp. 1857-1858. iSBn 1-59593-186-4.DUTTA, S.; SHEKHAR, S. (1988). Bond rating: a non-conservative application of neural networks. IEEE International Conference on Neural Networks. San diego : iEEE. Vol. 2, pp. 443-450. iSSn 1098-7576.EGELI, B.; OZTURAN, M.; BADUR, B. (2003). Stock market prediction using artificial neu-ral networks. Proceedings of the 3rd Hawaii International Conference on Business. pp. 1–8. iSSn 1172-6024.FANTA, J. (2001). Psychologie, algoritmy a umělá inteligence na kapitálových trzích. 1. Edi-tion. Praha : Grada publishing. 168 p. iSBn 80-247-0024-7.FEIGENBAUM, E. A.; MC CORDUCK; P; NII, H. P. (1988). The Rise of the Expert Company. london: times Books. 336 p. iSBn 0333496590.GABBI, G.; COLOMBO, R.; BRAMANTE, R.; VIOLA, M. P.; DEVITO, P.; TUMETTO, A. (2000). Predicting the Exchange rate: a comparison of Econometric Models, neural net-works and trading Systems. IFTA Journal. [online]. [Cit. 2010-01-03]. available at: http://www.ifta.org/public/files/journal/738a05eeb7b0d28535bd78f82da09536.pdf.GENçAY ,R.; STENGOS, T. (1998). Moving average rules, volume and the predictability of security returns with feedforward networks. Journal of Forecasting. Vol. 17, no. 5-6, pp. 401–414. iSSn 1099-131X.GIL-ALUJE, J.; GIL-LAFUENTE, A.; MERIGó, J. M. (2011). using homogeneous group-ings in portfolio management. Expert systems with applications. Vol. 38, no. 9, pp. 10950 -10958. iSSn 0957-4174.GORGULHO, A.; NEVES, A.; HORTA, N. (2009). using Gas to Balance technical indicators on Stock Picking for Financial Portfolio Composition. in GECCo´09: Proceedings of the 11th annual conference on Genetic and evolutionary computation. Montreal : aCM. pp. 2041-2046. iSBn 1-60558-325-9.
ActA všfs, 1/2012, vol. 6074
GONZALEZ, S. (2000). Neural Networks for Macroeconomic Forecasting: A Complementary Approach to Linear Regression Models. Finance Canada working Paper [online]. [Cit. 2010-03-01]. available at: http://dsp-psd.pwgsc.gc.ca/Collection/F21-8-2000-7E.pdf.HAIDER, A.; HANIF, M. N. (2009). Inflation forecasting in Pakistan using Artificial Neural Ne-tworks. MPra Paper [online]. [Cit. 2009-11-26]. available at: http://mpra.ub.uni-muenchen.de/14645/1/MPra_paper_14645.pdf.HIRABAYASHI, A.; ARANBA, C.; IBA, H. (2009). optimization of the trading rule using genetic algorithm. GECCo´09: Proceedings of the 11th Annual conference on Genetic and evolutionary computation. Montreal. pp. 1529-1536. iSBn 978-1-60558-325-9.HLAVÁČEK, M.; KOŇÁK, M.; ČADA, J. (2005). The application of structured feed forward neural networks to the modeling of daily series of currency in circulation. Czech national Bank working Paper. [online]. [Cit. 2010-01-03]. available at: http://www.cnb.cz/m2export/sites/www.cnb.cz/en/research/research_publications/cnb_wp/download/cnbwp_2005_11.pdf.CHAVEESUK, R.; SRIVAREE; RATANA, CH.; SMITH, A. E. (1999). alternative neural net-work approaches to Corporate Bond rating. Journal of Engineering Valuation and Cost Analysis [online]. [Cit. 2010-01-03]. available at: http://www.eng.auburn.edu/~aesmith/publications/journal/value.pdf.CHEN, A.; HSU, Y.; Hu, K. A (2008). Hybrid Forecasting Model for Foreign Exchange rate Based on a Multi-neural network. iCNC´08: Fourth International Conference on Natural Com-putation. Jinan : iEEE. pp. 293-298. iSBn 978-0-7695-3304-9.CHOUDHARY, A.; HAIDER, A. (2008). neural network Models for inflation Forecasting: an appraisal. Department of Economics Discussion Papers. [online]. [Cit. 2010-01-01]. available at: http://ideas.repec.org/p/sur/surrec/0808.html.JOHNSON, B. (2011). Algorithmic Trading & DMA: An introduction to direct access trading strategies. 1. Edition. london : 4Myeloma Press. 574 p. iSBn 80-956-3992-05.KENDALL, G.; SU, Y. (2003). a Multi-agent Based Simulated Stock Market – testing on different types of Stocks. CEC ´03. The 2003 Congress on Evolutionaty Computation. iSBn 0-7803-7804-0.KIANI, K. M.; KASTENS, T. L. (2008). testing Forecast accuracy of Foreign Exchange rates: Predictions from Feed Forward and Various recurrent neural network architec-tures. Computational Economics. Vol. 32, no. 4, pp. 383-406. iSSn 0927-7099.KIM, D. H.; LEE, S. J.; OH, K. J. (2009). an early warning system for financial crisis using a stock market instability index. Expert systems. Vol. 26, no. 3, pp. 260 -273. iSSn 1468-0394.KORCZAK, J. J.; LIPINSKI, P. (2004). Evolutionary building of stock trading experts in real-time series. Proceeding of the 2004 Congress on Evolutionary Computation. Portland : iEEE. pp. 940-947. iSBn 0-7803-8515-2.KUMAR, R.; BHATTACHARYA, S. (2009). agent Based Model for Cardinality Constrained Portfolio Selection Problem: Preliminary results. 42nd Hawaii International Conference on System Sciences. HiCSS ‘09. pp. 1-10. iSBn 978-0-7695-3450-3.KUO, R. J. (1998). a decision Support System for the Stock Market through integration of Fuzzy neural networks and Fuzzy delphi. Applied Artificial Intelligence. Vol. 12, no. 6, pp. 501-520.LAM, M. (2004). neural network techniques for financial performance prediction: inte-grating fundamental and technical analysis. Decision Support Systems. Vol. 37, no. 4, pp. 567-581. iSSn 0167-9236.
075ActA všfs, 1/2012, vol. 6
LE BARON, B. agent Based Computationa Finance: Suggestive readings and Early re-search. Journal of Economic Dynamics and Control. Vol. 24, pp. 679-702. iSSn 0165-1889.LIBEROPOULOU, L. (2006). The Use of Expert Systems in Conservation. [online]. [cit. 2010-03-15] available at: http://radio-weblogs.com/0101842/stories/2003/06/01/theuseofEx-pertSystemsinConservation.html.MANZONI, K. (2004). Modeling Eurobond credit ratings and forecasting downgrade prob-ability. International Review of Financial Analysis. Vol. 13, no. 3, pp. 277-300. iSSn 1057-5219.MAŘÍK, V.; ŠTEPÁNKOVÁ, O.; LAŽANSKÝ J. (1997). Umělá inteligence (1). 1. Edition. Praha : academia. 264 pp. iSBn 80-200-0496-3.MC NELIS, P. (2004). Neural Networks in Finance. Elsevier. 256 p. iSBn 0-12-485967-4.MIZUNO, H.; KOSAKA, M.; YAJIMA, H. (1998). application of neural network to techni-cal analysis of Stock Market Prediction. in Studies in Informatics and Control. Vol. 7. pp. 111-120.MOSHIRI, S.; CAMERON, N. (2000). neural network versus Econometric Models in Fore-casting inflation. Journal of Forecasting. [online]. [Cit. 2009-10-19]. available at: http://cs.uni-muenster.de/Professoren/lippe/diplomarbeiten/html/eisenbach/untersuchte%20artikel/MoCa00.pdf.NAGARAJAN, V.; WU, Y.; LIU, M.; WANG, Q. (2005). Forecast studies for financial markets using technical analysis. iCCa´05: International Conference on Control and Automation. Bu-dapest. pp. 259-264. iSBn 0-7803-9137-3.NAKAMURA, E. (2005) inflation forecasting using a neural network. Economics letters. [online]. [Cit. 2009-12-31]. available at: <http://www.columbia.edu/~en2198/papers/nn_new.pdf> iSSn 0165-1765.NI, J.; ZHANG, CH. (2005). Mining Better technical trading Strategies with Genetic algo-rithms. aidM´06: International Workshop on Integrating AI and Data Mining. Hobart : iEEE. pp. 26-33. iSBn 0-7695-2730-2.PATHAK, J.; VIDYARTHI, N.; SUMMERS, S. L. (2005). a fuzzy-based algorithm for auditors to detect elements offraud in settled insurance claims. Managerial Auditing Journal. Vol. 20, no. 6, pp. 632-644. iSSn 0268-6902.RABERTO, M.; CINCOTTI, S., FOCARDI, S. H.; MARCHESI, M. (2003). traders´ long-run wealth in an artificial Financial Market. Journal of Computational Economics. Vol. 22, no. 2-3, pp. 319-327. iSSn 0927-7099.ROMAHI, Y.; SHEN, Q. (2000). dynamic financial forecasting with automatically induced fuzzy associations. Proceedings of the 9th iEEE international Conference on Fuzzy Systems. San antonio. Vol. 2, pp. 493-498. iSBn 0-7803-5877-5.SAFER, M. (2003). a comparison of two data mining techniques to predict abnormal stock market returns. Intelligent Data Analysis. Vol. 7, no. 1, pp. 3–13. iSSn 1088-467X.SHAAF, M. (2000). Predicting recession using the yield Curve: an artificial intelligence and Econometric Comparison. Eastern Economic Journal. [online]. [Cit. 2009-10-15]. avail-able at: http://ideas.repec.org/a/eej/eeconj/v26y2000i2p171-190.html#provider.SCHUMAKER, P.; CHEN, H. (2009). a quantitative stock prediction system based on fin-anciel news. Information Processign&Management. Vol. 45, no. 5, pp. 571-583. iSSn 0306-4573.SEIFERT, J. W. (2004). data Mining: an overview. CRS report for Congress.SIMOUDIS, E. (1996). reality Check for data Mining. IEEE EXPERT. Vol. 11, no. 5. iSSn 0885-9000.
ActA všfs, 1/2012, vol. 6076
TESFATSION, L. (2005). agent-based Computational Economics: a Constructive approach to Economic theory. Handbook of Computational Economics [online]. [Cit. 2010-01-16]. available at: < http://www2.econ.iastate.edu/tesfatsi/hbintlt.pdf>.TKACZ, G.; HU, S. (1999). Forecasting GDP growth using Artificial Neural Networks. Bank of Canada working Paper 99-3. Canada. iSBn 1192-5434.TUNG, A. K. H.; HONGJUN L.; JIAWEI H.; LING F. (2003). Efficient mining of intertransac-tion association rules. Knowledge and Data Engineering, IEEE Transactions on. Vol. 15, no. 1, pp. 43- 56. iSSn 1041-4347 .UMPLEBY, S. A. (2007). reflexivity in social systems: the theories of George Soros. in Sys-tems Research and Behavioral Science [online]. Vol. 24, no. 5. [cit. 2010-01-06]. available at: <http://api.ning.com/files/2aoF3uepEH*u54zVj1xccx5p0tJkuf2qVM81sE6-EyGd43f8xyjf-HqpwajknyS9ab0jwqvPzpFtydd8avzalteiB6s9uFSfQ/2007_SrBS_reflexivity_theory.pdf >. iSSn 1092-7026.WONG, F. S.; WONG, P. Z.; GOH, T. H.; QUEK, B. K. (1992). Fuzzy neural Systems for Stock Selection. Financial Analysts Journal. Vol. 48, no 1, pp. 47-54. iSSn 0015-198X.YAO, J.; TAN, CH. L. (2000). a case study on using neural networks to perform technical forecasting of forex neurocomputing [online]. [Cit. 2010-03-17]. available at: <http://seal.tst.adfa.edu.au/~ruhul/Sarker-FX.pdf > iSSn 0925-2312.KDnuggets [online]. [s.a.]. [Cit. 2010-02-01]. available at: <http://www.kdnuggets.com/polls/2010/analytics-data-mining-industries-applications.html>.
Contact adress / Kontaktní adresa:Katarína Hiľovskádepartment of Banking and investment, Faculty of Economics, technical university of košice / katedra bankovníctva a investovania, Ekonomická fakulta, technická univerzita v košiciach([email protected])
Peter Konczdepartment of Cybernetics and artificial intelligence, Faculty of Electrical Engineering and informatics, technical university of košice / katedra kybernetiky a umelej inteligencie, Fakulta elektrotechniky a informatiky, technická univerzita v košiciach([email protected])