application of a new software tool for the automated test of
TRANSCRIPT

Institutionen för systemteknikDepartment of Electrical Engineering
Examensarbete
Application of a New Software Tool for theAutomated Test of Automotive Electronic Control
Unit Software
Examensarbete utfört i Reglerteknikvid Tekniska högskolan i Linköping
av
Hanna Amlinger
LITH-ISY-EX--09/4204--SE
Linköping 2009
Department of Electrical Engineering Linköpings tekniska högskolaLinköpings universitet Linköpings universitetSE-581 83 Linköping, Sweden 581 83 Linköping

Application of a New Software Tool for theAutomated Test of Automotive Electronic Control
Unit Software
Examensarbete utfört i Reglerteknikvid Tekniska högskolan i Linköping
av
Hanna Amlinger
LITH-ISY-EX--09/4204--SE
Handledare: Christian Lundquistisy, Linköpings universitet
Dr. Martin NeumannZF Friedrichshafen AG
Dipl. Ing. Carsten PaulusZF Friedrichshafen AG
Examinator: Dr. Inger Kleinisy, Linköpings universitet
Linköping, 10 February, 2009

Avdelning, InstitutionDivision, Department
Division of Automatic ControlDepartment of Electrical EngineeringLinköpings universitetSE-581 83 Linköping, Sweden
DatumDate
2009-02-10
SpråkLanguage
� Svenska/Swedish� Engelska/English
�
�
RapporttypReport category
� Licentiatavhandling� Examensarbete� C-uppsats� D-uppsats� Övrig rapport�
�
URL för elektronisk versionhttp://www.control.isy.liu.sehttp://urn.kb.se/resolve?urn=urn:nbn:se:liu:diva-16785
ISBN—
ISRNLITH-ISY-EX--09/4204--SE
Serietitel och serienummerTitle of series, numbering
ISSN—
TitelTitle Application of a New Software Tool for the Automated Test of Automotive Elec-
tronic Control Unit Software
FörfattareAuthor
Hanna Amlinger
SammanfattningAbstract
Testing plays a very important role for assuring the quality of developed soft-ware. In a modern vehicle, more and more of the functionality is controlled bysoftware and the complexity of the software always increases. The expectationson automating the testing process are to save time and to reach an even higherquality.
In this thesis, which was performed at ZF Friedrichshafen AG, a new tool forautomated tests is studied. The tool is used for software in the loop simulationbased system tests. The user specifies which outputs that shall be observed andwhich inputs that can be controlled. Based on these prerequisites, test cases aregenerated.
It has been studied how to apply the tool, how the test case generation canbe influenced, on which systems it successfully could be used and which resultsthat could be reached with the tool. The tool has been evaluated on the hand oftwo real-life examples; the software of an automatic transmission and of a pressurecontroller, a module of this software. It was found that there are many interestingpossibilities to apply the tool in order to support the present testing process.
NyckelordKeywords Test automation, Software in the loop, System testing


AbstractTesting plays a very important role for assuring the quality of developed soft-ware. In a modern vehicle, more and more of the functionality is controlled bysoftware and the complexity of the software always increases. The expectationson automating the testing process are to save time and to reach an even higherquality.
In this thesis, which was performed at ZF Friedrichshafen AG, a new tool forautomated tests is studied. The tool is used for software in the loop simulationbased system tests. The user specifies which outputs that shall be observed andwhich inputs that can be controlled. Based on these prerequisites, test cases aregenerated.
It has been studied how to apply the tool, how the test case generation canbe influenced, on which systems it successfully could be used and which resultsthat could be reached with the tool. The tool has been evaluated on the hand oftwo real-life examples; the software of an automatic transmission and of a pressurecontroller, a module of this software. It was found that there are many interestingpossibilities to apply the tool in order to support the present testing process.
v


Acknowledgments
This master thesis was preformed at ZF Friedrichshafen AG in the department ofHybrid Drives (TE-H) during the summer and autumn of 2008. Firstly, I wouldlike to thank ZF Friedrichshafen AG for the opportunity to write this thesis. Aspecial thanks to my supervisors at ZF Friedrichshafen AG, Dr. Martin Neumannand Carsten Paulus for all their support and encouragement, for many interestingdiscussions and for coming with suggestions to improve my work.
I would like to express my thanks to my supervisor Christian Lundquist andexaminer Dr. Inger Klein at Linköping University, especially for all the help withimproving my writing.
The department TE-NL was very kind to provide me with a real-life exampleto work with, which helped me very much. Also, a special thanks to QTronicGmbH, in particular Dr. Andreas Junghanns and Dr. Mugur Tatar, for answeringall my questions and for supporting me in many ways. I am also very grateful toall my colleagues at TE-H for welcoming me, making me a part of the team andfor making my time at ZF Friedrichshafen AG a great experience.
Thank you all!
vii


Contents
1 Introduction 11.1 Background . . . . . . . . . . . . . . . . . . . . . . . . . . . . . . . 11.2 Problem Description . . . . . . . . . . . . . . . . . . . . . . . . . . 11.3 Purpose . . . . . . . . . . . . . . . . . . . . . . . . . . . . . . . . . 11.4 Goal . . . . . . . . . . . . . . . . . . . . . . . . . . . . . . . . . . . 21.5 Thesis Outline . . . . . . . . . . . . . . . . . . . . . . . . . . . . . 2
2 Software Testing 32.1 Software Development . . . . . . . . . . . . . . . . . . . . . . . . . 32.2 Test Levels . . . . . . . . . . . . . . . . . . . . . . . . . . . . . . . 5
2.2.1 Unit Testing . . . . . . . . . . . . . . . . . . . . . . . . . . 52.2.2 Integration Testing . . . . . . . . . . . . . . . . . . . . . . . 52.2.3 System Testing . . . . . . . . . . . . . . . . . . . . . . . . . 62.2.4 Acceptance Testing . . . . . . . . . . . . . . . . . . . . . . . 6
2.3 Testing Methods . . . . . . . . . . . . . . . . . . . . . . . . . . . . 62.3.1 Static Testing . . . . . . . . . . . . . . . . . . . . . . . . . . 62.3.2 Dynamic Testing . . . . . . . . . . . . . . . . . . . . . . . . 7
2.4 Black-Box Testing Techniques . . . . . . . . . . . . . . . . . . . . . 72.4.1 Equivalence Class Testing . . . . . . . . . . . . . . . . . . . 72.4.2 Boundary Value Testing . . . . . . . . . . . . . . . . . . . . 82.4.3 State Transition Testing . . . . . . . . . . . . . . . . . . . . 9
2.5 Code Coverage . . . . . . . . . . . . . . . . . . . . . . . . . . . . . 102.5.1 Statement Coverage . . . . . . . . . . . . . . . . . . . . . . 102.5.2 Decision Coverage . . . . . . . . . . . . . . . . . . . . . . . 122.5.3 Condition Coverage . . . . . . . . . . . . . . . . . . . . . . 122.5.4 Decision/Condition Coverage . . . . . . . . . . . . . . . . . 132.5.5 Multiple Condition Coverage . . . . . . . . . . . . . . . . . 13
3 Test Environment 153.1 System Overview . . . . . . . . . . . . . . . . . . . . . . . . . . . . 153.2 Instruments . . . . . . . . . . . . . . . . . . . . . . . . . . . . . . . 163.3 Method . . . . . . . . . . . . . . . . . . . . . . . . . . . . . . . . . 183.4 Test Focus . . . . . . . . . . . . . . . . . . . . . . . . . . . . . . . . 21
3.4.1 Coverage Report . . . . . . . . . . . . . . . . . . . . . . . . 21
ix

x Contents
3.4.2 Constraints . . . . . . . . . . . . . . . . . . . . . . . . . . . 213.4.3 Instrumentation . . . . . . . . . . . . . . . . . . . . . . . . 22
3.5 Classification of the Method . . . . . . . . . . . . . . . . . . . . . . 22
4 Application 234.1 Automatic Transmission - EcoLife . . . . . . . . . . . . . . . . . . 234.2 Pressure Controller . . . . . . . . . . . . . . . . . . . . . . . . . . . 254.3 Instrumentation Set Up . . . . . . . . . . . . . . . . . . . . . . . . 26
5 Tests 295.1 General Test . . . . . . . . . . . . . . . . . . . . . . . . . . . . . . 29
5.1.1 Input Instruments - Chooser . . . . . . . . . . . . . . . . . 295.1.2 Output Instruments - Reporter . . . . . . . . . . . . . . . . 305.1.3 Test Focus . . . . . . . . . . . . . . . . . . . . . . . . . . . 315.1.4 Results . . . . . . . . . . . . . . . . . . . . . . . . . . . . . 31
5.2 Fault Finding . . . . . . . . . . . . . . . . . . . . . . . . . . . . . . 325.2.1 Instrumentation and Test Focus . . . . . . . . . . . . . . . 325.2.2 Results . . . . . . . . . . . . . . . . . . . . . . . . . . . . . 32
5.3 Code Coverage Test . . . . . . . . . . . . . . . . . . . . . . . . . . 335.3.1 Input Instruments - Chooser . . . . . . . . . . . . . . . . . 335.3.2 Output Instruments - Reporter . . . . . . . . . . . . . . . . 345.3.3 Test Set Up and Test Focus . . . . . . . . . . . . . . . . . . 345.3.4 Results . . . . . . . . . . . . . . . . . . . . . . . . . . . . . 34
5.4 Time Consumption . . . . . . . . . . . . . . . . . . . . . . . . . . . 35
6 Conclusions 37
Bibliography 41
Chapter 1
Introduction
1.1 BackgroundTesting is one of the most important actions to ensure the quality within the devel-opment of software for vehicle controllers. As the number of controllers in a vehiclejust increases and the software constantly is getting more complex, automaticallytesting is essential.
In a modern motor vehicle, more than 85% of the functionality is controlledby software. Moreover, project schedules are getting shorter and the pressure onsoftware development increases [1]. This means, more software has to be tested ina shorter time. With these conditions, an effective and reliable testing process isof great importance.
Today a lot of tests are implemented and evaluated by hand. The expectationon automatic or partly automatic tests are that they could increase the quality ofthe software even more and make the testing process simpler and faster.
1.2 Problem DescriptionAt ZF Friedrichshafen AG, in the following referred to as ZF, a new softwaretesting tool which systematically simulates a co-simulation of an environment andan application-software model shall be evaluated. The aim is to gain experiencewith the tool environment, analyse for which system configurations the procedureis purposeful and what kind of faults can be found.
1.3 PurposeZF is interested in new testing methods, which can make the testing process at ZFmore efficient, more reliable and ensure a higher quality of the software comparedto the testing methods that are used today.
1

2 Introduction
1.4 GoalThe goal with this thesis is to be able to make a conclusion whether this newsoftware testing tool could be useful for the software testing process within ZFand in that case how the tool should be used.
1.5 Thesis OutlineAfter the introduction with the background of the problem and the problem for-mulation in Chapter 1, an introduction to software testing is given in Chapter 2.Chapter 3 gives an overview of the test environment and describes the consideredtesting method. Further, Chapter 4 describes two examples studied to evaluatethe tool and in Chapter 5, the implemented tests and their results are presented.Finally, in Chapter 6, the conclusions of this master thesis are presented.

Chapter 2
Software Testing
In this chapter, an introduction to software testing is given. In Section 2.1, thesoftware development process and the corresponding test process are described.An overview of different standards used during the development process is givenas well. The different test phases in the test process are described more in detailin Section 2.2. In Section 2.3, an overview of different testing methods is given.A more detailed description of different black-box testing techniques follows inSection 2.4. Lastly, a white-box testing technique is presented in Section 2.5.
2.1 Software DevelopmentThe software development process can be described by the V-model shown inFigure 2.1.
Figure 2.1. The V-model is a commonly used way to describe the software developmentprocess.
The descending left-hand arm of the V shows how the task is divided intosmaller and smaller parts. On the top are the requirements from the customer andthe lowest level is the implementation of the actual software. The ascending right-
3

4 Software Testing
hand of the V shows how, step by step, the project is tested. First single modules,then integrated groups of modules (components) and finally the whole system.The model also describes the connection between each level of the requirementsand its corresponding test phase [19].
StandardsVarious standards have a very important role in the software development. Thereexist many different types of standards, on the one hand there are various processstandards and on the other hand there are different product standards. Standardsconveys the uniformity of processes and products and are an important tool for thesuccessful planning of processes, raised quality, lower costs and shorter develop-ment time (time to market). Process standards involve evaluation, improvementand determination of the capability of the process. Product standards are forexample industry-specific standards regarding safety issues [18].
The comprehensive process standard used within ZF for the software devel-opment is Automotive SPICE (Software Process Improvement and CapabilityDetermination) which is a variant of the standard SPICE adjusted for the automo-tive industry. SPICE is also known as the ISO/IEC 15504 [6] standard where ISOis the International Organization for Standardization and IEC the InternationalElectrotechnical Commission. Automotive SPICE consists of two components: theprocess reference model (PRM) and the process assessment model (PAM). PRMmainly consists of general explanations of the model and descriptions of singleprocesses and their purposes and outcomes [9, 8]. PAM is an elaboration of PRMand consists of categorisations of the processes from the PRM but also assessmentof the processes. The processes are divided into groups depending on when in thelife cycle they are performed and what type of activity they address. For examplethere are processes used when a supplier delivers products to a customer and organ-isational processes that help the organisation to reach its business goals. Further,each process is assigned an assessment level describing the capability to performthat certain process. There are six different levels from incomplete processes thatare not implemented over established processes to optimizing processes [14, 7].
Another widespread process model is CMMI (Capability Maturity ModelIntegration) [10]. Automotive SPICE focuses much on the software whereas thepractices in CMMI are formulated more generally and therefore applicable onmany application domains.
An important safety standard which is used in the software development pro-cess at ZF is IEC 61508: Functional safety of electrical/electronic/ programmableelectronic safety-related systems. This standard describes how to classify systemsin different “Safety Integrity Levels” (SIL) based on the probability that a poten-tial hazardous state occurs. It also contains detailed directions which methodsand documents that should be used for the different SIL [14].
There exist several other standards within ZF as well. These are for instanceMISRA (Motor Industry Software Reliability Association) which is guidelines forthe use of the C language in critical systems [9], ZF intern standards and standardsof the customers.

2.2 Test Levels 5
2.2 Test LevelsAs described in the V-model, see Section 2.1, it is common to divide the test processinto the following four test phases: unit testing, integration testing, system testingand acceptance testing.
To illustrate the different levels, the software for an automatic transmissioncontrol unit will be studied as an example. The main functionality of this controlunit is to control the gear changes. Thereby, the software consists of different unitsfor different tasks, see Figure 2.2. Amongst others, there are pressure controllersfor controlling the pressure for different actuators which control the clutches toshift gears. Further, there also exist units for the CAN (Controller Area Net-work) communication. The communication with other control units takes placeby sending messages over CAN.
Figure 2.2. The software of a transmission control unit consists of several units, forexample pressure controller and CAN communication.
2.2.1 Unit TestingUnit testing is also called module testing and refers to the testing of single unitsor modules [17]. The units should be isolated as far as possible and the aim withthe tests is to test the basic functionality defined in, for example, the requirementspecification [19]. Due to the isolation, found errors can be directly connected tothe current unit. It is also desirable to test the robustness, for example the errorhandling, since the module will be integrated with several other modules. Typicalfaults that are found at this level are for instance calculational errors or missingor incorrect program paths [17].
For the example in Figure 2.2, unit tests would be tests of the pressure con-troller separately.
2.2.2 Integration TestingThe next level in the test process is the integration testing where several modulesare tested together as a component [19]. The objectives of the tests are the in-terfacing, integration and interaction of the modules in the component. Typicalfaults found at this level of testing are for instance errors in the data exchange orin the communication between the different modules in the component [17].

6 Software Testing
For the example in Figure 2.2, integration tests would be tests of the pressurecontroller and the CAN communication together. For example the communicationbetween the two units would be tested.
2.2.3 System Testing
The third phase is the system test where the whole system is tested. The testenvironment should be as similar to the real system environment as possible. Thetests can be divided into functional and non-functional tests. The functional testsverify the functionality against the specifications of the system at a high level. Thegoal of the non-functional tests is to test properties like performance, reliability,flexibility and robustness [17].
For the example in Figure 2.2, system tests would be tests of the completesoftware for the transmission control software.
2.2.4 Acceptance Testing
The fourth and last level in the test process is the acceptance testing. The mainaim with these tests is not to find errors but to provide confidence that the systemworks correctly from the customer’s point of view. Thereby, tests are carried outto validate that the system meets the prescribed requirements. Further, the useracceptance is tested, i.e. if the final user finds the system convenient to use. Thetests are often carried out by or together with the customer in the real environmentof the customer [17].
For the example in Figure 2.2, acceptance tests would be tests performed to-gether with the customer of the automatic transmission. It would be tested if thecustomer thinks that the transmission changes the gear at the right moments andif the gears are changed in a comfortable way.
2.3 Testing MethodsThere are many methods to test the developed software. Two comprehensivegroups of testing are static and dynamic testing respectively.
2.3.1 Static Testing
Static testing is an analysis done without actually executing the software undertest. The goal is to find faults and violations of the existing specifications, stan-dards that should be complied or the project planning. This can for example bedone by carrying out reviews of the existing documents where these are carefullystudied to find such violations. The test can also be to compile the code or lettinga person carefully study the code in order to check, for example, the data flow andtry to find errors as uninitialized variables, out-of-bounds array access etc [17].

2.4 Black-Box Testing Techniques 7
2.3.2 Dynamic TestingIn dynamic testing the software is executed and the outputs are analysed. Dynamictesting can be divided into black-box, white-box and grey-box testing.
Black-box testing: the actual code is not really considered or not accessible forthe tester. Instead, only the inputs and the outputs of the system under testare studied. Black-box testing is most appropriate for higher levels of testinglike system testing but can also be successfully applied on lower levels likeunit testing.
White-box testing: the code is considered as well and the internal flow is alsostudied during the execution of the test cases. White-box testing methodsare most appropriate for the lower levels of testing like for example unittesting and integration testing [17].
Grey-box testing: a combination of black-box and white-box testing, for in-stance a module structure can be known but not each module in detail [13].
2.4 Black-Box Testing TechniquesIn black-box testing where the system under test is considered as a black boxwith unknown content it would be optimally to create a test for every possiblecombination of every possible value of the inputs. Of course this is impossiblesince the number of test cases would be vast, therefore there are several techniquesfor trying to reduce the number of test cases while maintaining appropriate testcoverage.
There exist a great number of different black-box testing techniques and allof them cannot be presented here. In this section, three of the most commonmethods will be described in more detail [17].
2.4.1 Equivalence Class TestingInstead of testing all possible input values, the inputs can be divided into equiv-alence classes. All values which are treated the same way of the system undertest belong to the same equivalence class. It is assumed that all test cases in anequivalence class produce the same result. That is, if a test case of an equivalenceclass results in a fault then every other test case in the same equivalence class alsowill result in a fault. On the other hand, if the test case is faultless then all othertest cases in the equivalence class are assumed to be faultless as well [4]. Thereforeit is sufficient to test only one test case of every equivalence class. Not only thevalid but also the invalid values should be divided into equivalence classes. Anexample to illustrate equivalence classes is given in Example 2.1.
The outputs can be divided into equivalence classes as well. However, it is abit more complicated to determine the test cases since in addition it also has tobe considered which input values cause the different outputs [17].

8 Software Testing
Example 2.1: Example to illustrate equivalence classes.
if (x>0 && x <=3) {a = a+1; }
elseif (x>3 && x <=5) {a = a -1; }
Here, && means logical AND. For this example, the values of x can be divided intofour equivalence classes:
x <= 00 < x <= 33 < x <= 5x > 5
For this small example, it would be enough to create the test cases x=-1, x=1, x=4and x=6.
This technique with equivalence classes is most suitable for systems where thevariables can be divided into ranges or sets. The advantage of this method is thatthe test cases can be reduced in an efficient way [4]. A disadvantage is that onlysingle input or output conditions are considered. It is very difficult to take depen-dencies or interactions between variables into consideration. It would be possibleby a further classification of equivalence classes where possible dependencies areconsidered but it would need a great deal of effort [17].
2.4.2 Boundary Value TestingBoundary value testing is a very good complement to the equivalence class test-ing. This technique focuses on the boundaries of the equivalence classes simplybecause experience has shown that problems in most cases arise at the bound-aries. For example conditions might be inaccurate programmed. In the examplein Example 2.1, the first condition possibly should be x < 0 [4].
Boundary value testing is implemented as follows. First of all, the equivalenceclasses and their boundaries have to be determined. Secondly test cases are cre-ated for the value on the boundary, just below the boundary and just above theboundary. In this manner the smallest possible increment should be used in bothdirections. Exactly what this is depends on the circumstances, for example thedata type. If the value just above the boundary coincides with the value just be-low another boundary, this value naturally results in only one test case. For theexample in Example 2.1, the interesting values, assuming x is an integer, would be
x = MIN_INT, x = MIN_INT+1, x= -1, x = 0 x = 1, x = 2, x = 3,x = 4, x = 5, x = 6, x = MAX_INT-1 and x = MAX_INT,
where MIN_INT and MAX_INT are the smallest and largest integer value avail-able on the computer.
A common assumption is that test cases with values in the middle of an equiv-alence class do not lead to any other results than the test cases with the boundaryvalues of the equivalence class and therefore they can be omitted.
2.4 Black-Box Testing Techniques 9
At the first glance, the technique with equivalence classes and boundary valueanalysis might seem simple. However, in reality the determination of equivalenceclasses and the proper test values at the boundaries can be rather complex. If thedetermination is carried out successfully, the combination of equivalence class andboundary value testing is a very effective testing method [17].
2.4.3 State Transition TestingA disadvantage of the equivalence class and boundary value testing is that variabledependencies are disregarded. A method which takes this in consideration is statetransition testing. Often, not only the current inputs but also the previous eventsin the system are decisive for the current output and the systems behaviour. Con-sider for example a stack of elements with a specified maximal number of elements.If a new element is put onto the stack, the state can change from empty to partlyfilled, the state can remain partly filled or the state can change from partly filledto full. Which transition that is taken depends on the previous states, i.e. howmany elements that previously have been added to or removed from the stack.
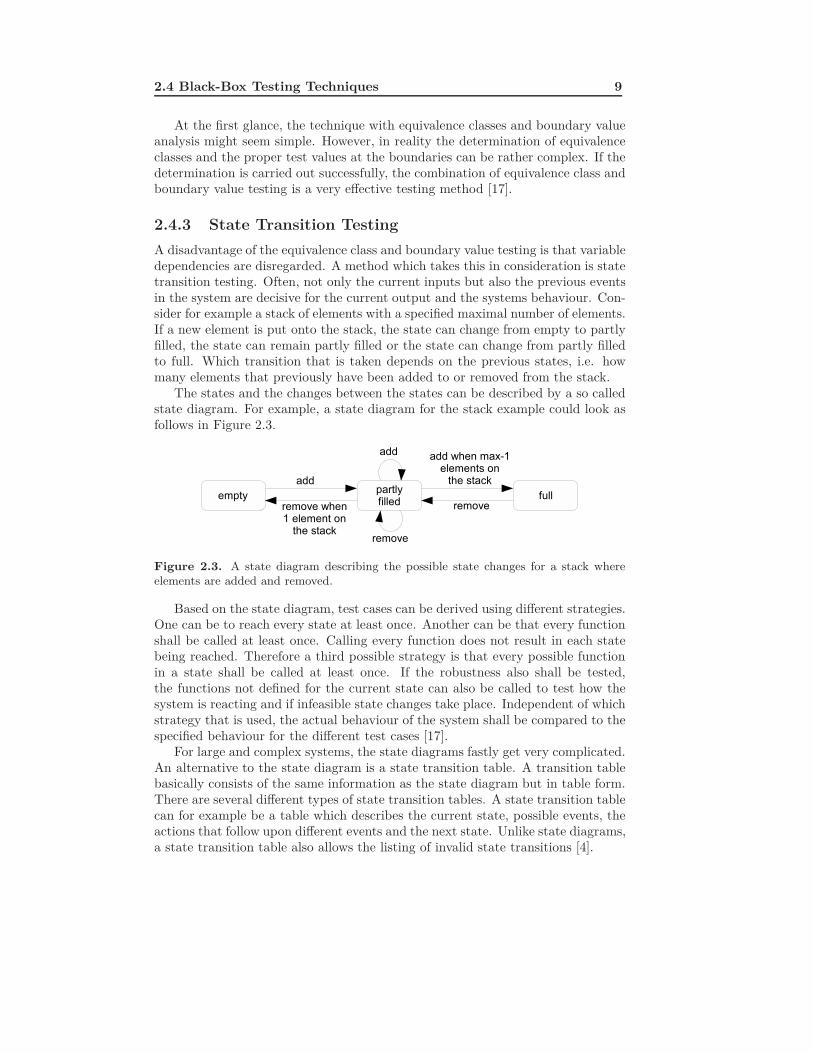
The states and the changes between the states can be described by a so calledstate diagram. For example, a state diagram for the stack example could look asfollows in Figure 2.3.
Figure 2.3. A state diagram describing the possible state changes for a stack whereelements are added and removed.
Based on the state diagram, test cases can be derived using different strategies.One can be to reach every state at least once. Another can be that every functionshall be called at least once. Calling every function does not result in each statebeing reached. Therefore a third possible strategy is that every possible functionin a state shall be called at least once. If the robustness also shall be tested,the functions not defined for the current state can also be called to test how thesystem is reacting and if infeasible state changes take place. Independent of whichstrategy that is used, the actual behaviour of the system shall be compared to thespecified behaviour for the different test cases [17].
For large and complex systems, the state diagrams fastly get very complicated.An alternative to the state diagram is a state transition table. A transition tablebasically consists of the same information as the state diagram but in table form.There are several different types of state transition tables. A state transition tablecan for example be a table which describes the current state, possible events, theactions that follow upon different events and the next state. Unlike state diagrams,a state transition table also allows the listing of invalid state transitions [4].

10 Software Testing
This method is, of course, most suitable for systems where different statesplay an important role and a state diagram is an adequate way to describe thesystem [17].
2.5 Code CoverageCode coverage is a white-box testing technique where the goal is that every partof the code shall be executed at least once. It is common to give the code coverageas a percentage and this number can be used as a type of quality measure of theimplemented tests. At the same time as test cases are designed to cover as muchas possible of the code, it is also studied if the outputs of the tests agree with theexpected outputs and thereby faults can be detected [17].
With code coverage tests it is possible to discover if some parts of the codehave not been executed at all. It can be difficult to achieve 100% code coveragesince some parts of the code might be error handling for instance. It can be veryhard and expensive, or even impossible, to reach every line of code during the testphase [4].
Code coverage is measured by so called instrumentation of the code wheremeasure statements are inserted at proper places in the code. These statementscan for example be counters which are incremented every time the certain code isexecuted. It would be very time-consuming to carry out this instrumentation byhand and therefore there are many different software tools on the market doingthis automatically when the code is compiled [17].
There are several different well known levels of coverage measurements. State-ment coverage, decision coverage, condition coverage, decision/condition coverageand multiple condition coverage are some of the most common coverage criteria.
The code segment in Example 2.2 will be used to illustrate the different cover-age criteria [4].
Example 2.2: Example to illustrate different coverage criteria.
if (a>0 && c==1) {x = x+1; }
if (b==3 || d <0) {y = 0; }
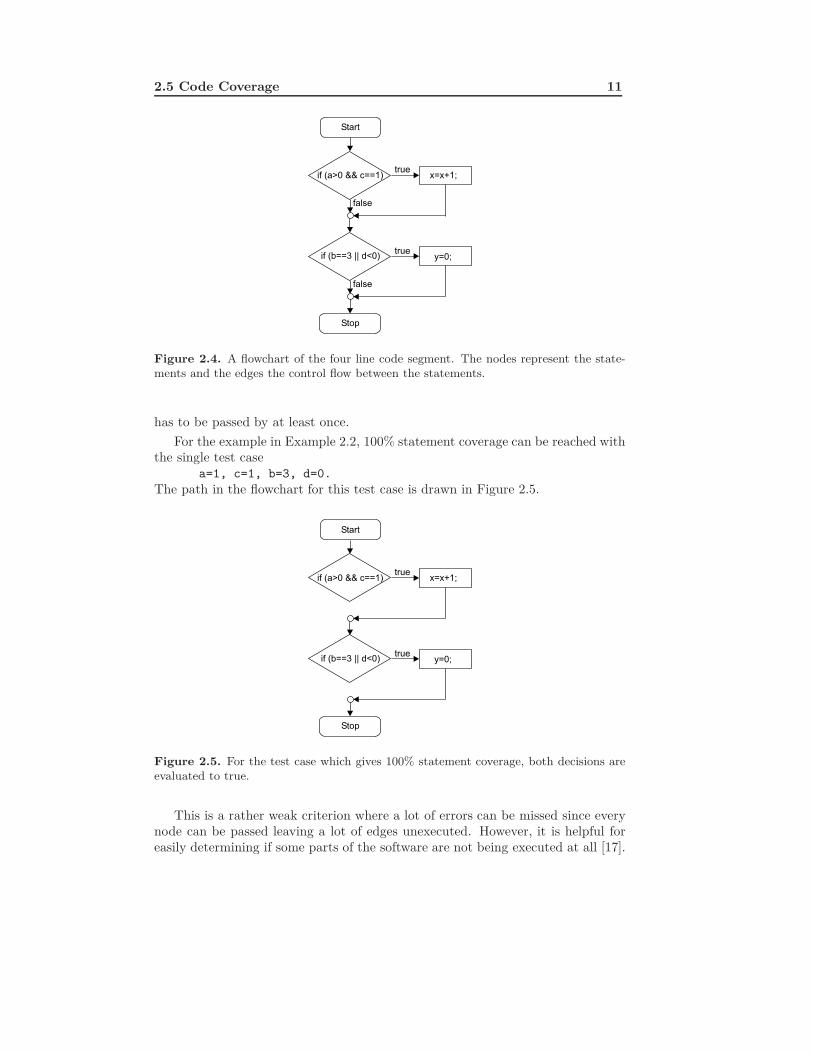
Here, && means logical AND and || means logical OR. This code segment can alsobe illustrated as a flowchart. The statements are represented by nodes and thecontrol flow between the statements is represented by edges, see Figure 2.4. Thetwo diamond shaped nodes represent a decision consisting of two conditions.
2.5.1 Statement CoverageStatement coverage is a coverage criterion which only requires that each statementis executed at least once. In terms of the flowchart this means that every node
2.5 Code Coverage 11
Figure 2.4. A flowchart of the four line code segment. The nodes represent the state-ments and the edges the control flow between the statements.
has to be passed by at least once.For the example in Example 2.2, 100% statement coverage can be reached with
the single test casea=1, c=1, b=3, d=0.
The path in the flowchart for this test case is drawn in Figure 2.5.
Figure 2.5. For the test case which gives 100% statement coverage, both decisions areevaluated to true.
This is a rather weak criterion where a lot of errors can be missed since everynode can be passed leaving a lot of edges unexecuted. However, it is helpful foreasily determining if some parts of the software are not being executed at all [17].

12 Software Testing
2.5.2 Decision CoverageDecision coverage is also called branch coverage and the criterion is that everydecision is evaluated both to true and false at least once. For case-statements itis required that all exits should be taken. In terms of the flowchart this meansthat every edge has to be passed by at least once [17].
For the example in Example 2.2, 100% decision coverage can be reached withthe two test cases
a=1, c=1, b=3, d=0 anda=1, c=0, b=0, d=0.
In the first test case, both decisions are evaluated to true and in the second testcase, both are evaluated to false. The paths in the flowchart for the both test casesare drawn in Figure 2.6.
Figure 2.6. In the first test case, both decisions are evaluated to true and in the secondtest case, both are evaluated to false. These two test cases lead to 100% decision coverage.
2.5.3 Condition CoverageFor condition coverage the criterion is that each condition with a true or falseresult in a decision is evaluated both to true and false at least once.
For the example in Example 2.2, 100% condition coverage can be reached withthe two test cases
a=1, c=0, b=0, d=-1 anda=0, c=1, b=3, d=0.
The results of the logical expressions for the both test cases are presented inTable 2.1.
Notice that decision coverage does not follow from condition coverage. For thetwo test cases above, the first decision is never evaluated to true and the secondone is never evaluated to false.

2.5 Code Coverage 13
Table 2.1. The results of the logical expressions for the four test cases leading to 100%condition coverage.
a>0 c==1 a>0 && c==1 b==3 d<0 b==3 || d<0true false false false true truefalse true false true false true
Condition coverage is usually a stronger criterion than decision coverage sinceevery condition is evaluated at least once whereas 100% decision coverage can bereached without evaluating each condition to true and false [4].
2.5.4 Decision/Condition CoverageAn even more complete coverage level is the decision/condition coverage wheredecision coverage and condition coverage are combined. That is, test cases arecreated so that every decision in a condition as well as every condition is evaluatedto both true and false.
For the example in Example 2.2, 100% decision/condition coverage can bereached with the two test cases
a=1, c=1, b=3, d=-1 anda=0, c=0, b=0, d=0.
The results of the logical expressions for the both test cases are presented inTable 2.2.
Obviously, both decision coverage and condition coverage follows from decision/condition coverage [4].
Table 2.2. The results of the logical expressions for the four test cases leading to 100%decision/condition coverage.
a>0 c==1 a>0 && c==1 b==3 d<0 b==3 || d<0true true true true true truefalse false false false false false
2.5.5 Multiple Condition CoverageMultiple condition coverage resembles condition coverage with the difference thatevery combination of outcomes from decisions in a condition is tested as well.
For the example in Example 2.2, 100% multiple condition coverage can bereached with the four test cases
a=1, c=1, b=3, d=-1,a=0, c=0, b=0, d=0,a=0, c=1, b=3, d=0 anda=1, c=0, b=0, d=-1.
The results of the logical expressions for the four test cases are presented in Ta-ble 2.3.

14 Software Testing
Table 2.3. The results of the logical expressions for the four test cases leading to 100%multiple condition coverage.
a>0 c==1 a>0 && c==1 b==3 d<0 b==3 || d<0true true true true true truefalse false false false false falsefalse true false true false truetrue false false false true true
Achieving 100% multiple condition coverage, also means achieving decision/condition coverage, condition coverage and decision coverage. This is an extensivecriterion but it is also very intricate since the possible combinations of n conditionsare 2n in total and hence the number of test cases increases fast with the numberof conditions in a decision [17].

Chapter 3
Test Environment
In this Chapter, an overview of the test environment and a description of theconsidered testing tool are given. In Section 3.1, the structure of the system undertest is described. The instruments that are needed for the communication betweenthe test tool and the system under test are described in Section 3.2. In Section 3.3,the testing method used by the considered testing tool is described. How the testfocus can be influenced is discussed in Section 3.4. Lastly, in Section 3.5, thetesting method is classified in terms of the different testing methods described inChapter 2.
Unless anything else is said, the information in this chapter is taken from theuser guide of the considered testing tool TestWeaver1.
3.1 System Overview
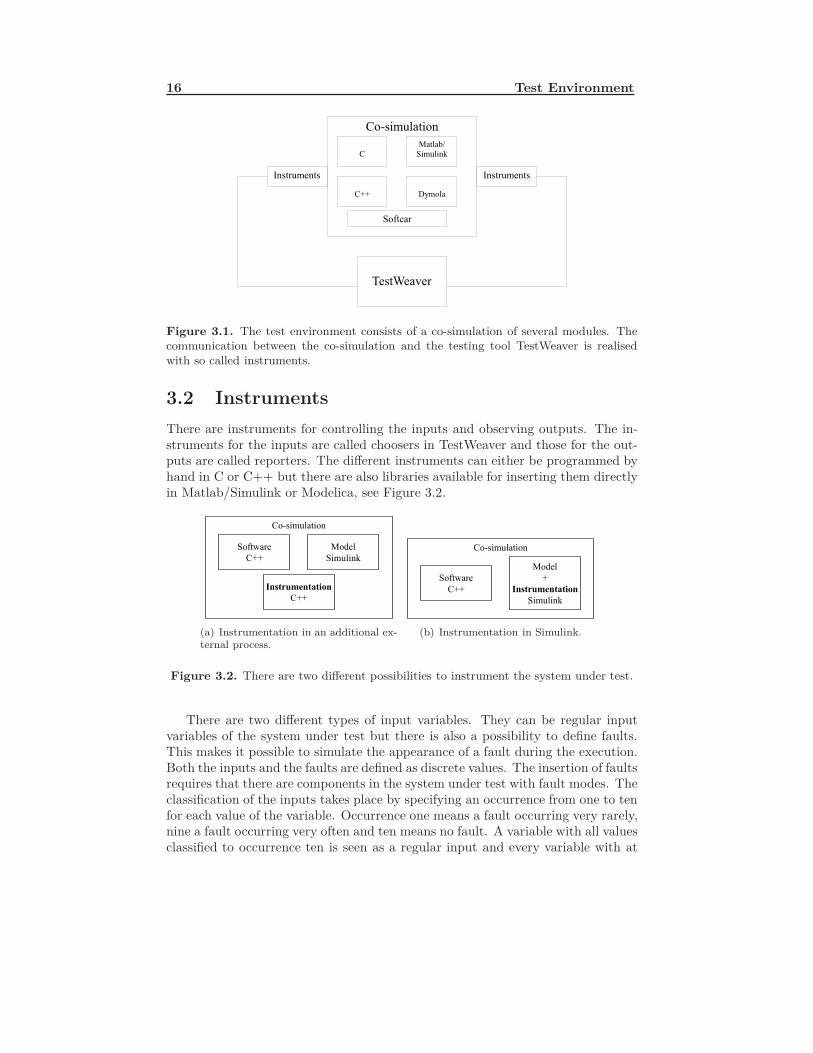
TestWeaver is the testing tool to be considered in this thesis. It systematicallysimulates a co-simulation and thereby automatically generates test cases. A co-simulation is a system consisting of several different modules which are simulatedtogether. These modules can consist of C++-code, C-code, Matlab/Simulink mod-els and Dymola models, see Figure 3.1. For an automatic transmission the modulescan for example be the software of the automatic transmission, a model describ-ing the vehicle and the environment respectively. For the co-simulation, the toolSoftcar is used. This is a tool developed and used within ZF. A simulation ofthis type is called software in the loop since the software is run on a computerand not on the real control unit and the vehicle and the rest of the environmentis also simulated on the computer. The communication between TestWeaver andthe co-simulation is realised with so called instruments specifying the inputs andoutputs for TestWeaver.
1TestWeaver 1.0 User Guide, QTronic GmbH.
15
16 Test Environment
Figure 3.1. The test environment consists of a co-simulation of several modules. Thecommunication between the co-simulation and the testing tool TestWeaver is realisedwith so called instruments.
3.2 InstrumentsThere are instruments for controlling the inputs and observing outputs. The in-struments for the inputs are called choosers in TestWeaver and those for the out-puts are called reporters. The different instruments can either be programmed byhand in C or C++ but there are also libraries available for inserting them directlyin Matlab/Simulink or Modelica, see Figure 3.2.
(a) Instrumentation in an additional ex-ternal process.
(b) Instrumentation in Simulink.
Figure 3.2. There are two different possibilities to instrument the system under test.
There are two different types of input variables. They can be regular inputvariables of the system under test but there is also a possibility to define faults.This makes it possible to simulate the appearance of a fault during the execution.Both the inputs and the faults are defined as discrete values. The insertion of faultsrequires that there are components in the system under test with fault modes. Theclassification of the inputs takes place by specifying an occurrence from one to tenfor each value of the variable. Occurrence one means a fault occurring very rarely,nine a fault occurring very often and ten means no fault. A variable with all valuesclassified to occurrence ten is seen as a regular input and every variable with at
3.2 Instruments 17
least one value with an occurrence smaller then ten is seen as a fault. For bothtypes of inputs, one of the discrete values is defined to be the default value of thatvariable. Every input is also associated with a trigger determining when an inputor a fault can be changed. The trigger can for example be a periodically signalenabling a change of the variable twice every second.
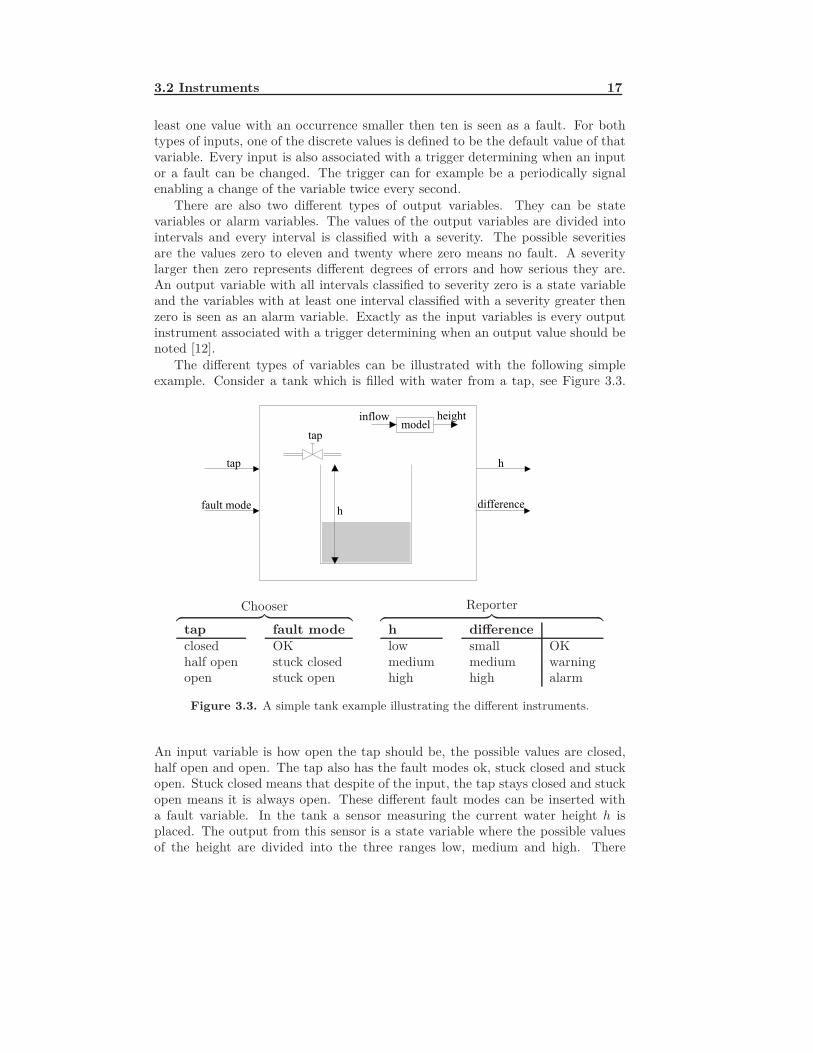
There are also two different types of output variables. They can be statevariables or alarm variables. The values of the output variables are divided intointervals and every interval is classified with a severity. The possible severitiesare the values zero to eleven and twenty where zero means no fault. A severitylarger then zero represents different degrees of errors and how serious they are.An output variable with all intervals classified to severity zero is a state variableand the variables with at least one interval classified with a severity greater thenzero is seen as an alarm variable. Exactly as the input variables is every outputinstrument associated with a trigger determining when an output value should benoted [12].
The different types of variables can be illustrated with the following simpleexample. Consider a tank which is filled with water from a tap, see Figure 3.3.
Chooser︷ ︸︸ ︷
tapclosedhalf openopen
fault modeOKstuck closedstuck open
Reporter︷ ︸︸ ︷
hlowmediumhigh
differencesmall OKmedium warninghigh alarm
Figure 3.3. A simple tank example illustrating the different instruments.
An input variable is how open the tap should be, the possible values are closed,half open and open. The tap also has the fault modes ok, stuck closed and stuckopen. Stuck closed means that despite of the input, the tap stays closed and stuckopen means it is always open. These different fault modes can be inserted witha fault variable. In the tank a sensor measuring the current water height h isplaced. The output from this sensor is a state variable where the possible valuesof the height are divided into the three ranges low, medium and high. There

18 Test Environment
is also a model calculating the height out of the required inflow into the tank.The difference between the measured value and the calculated value is an errorvariable. A difference means that the tap is stuck open or stuck closed or thesensor is defective. The possible values of the difference are also divided into threeranges. A very small difference is no problem and has the severity zero; a bit largerdifference is set to a warning and large differences report an error.
3.3 MethodThe goal of TestWeaver is to reach a faulty state, that is a state where a variablewith severity greater then zero is reported. This is done by a strategic varia-tion of the variables. The inputs and outputs and their discrete values span ann-dimensional discrete state space. In two dimensions the state space can be visu-alized as a grid where each square represents a state. In the discrete state space,some states have been reached and some have not and out of the reached states,some have caused an alarm, see Figure 3.4. TestWeaver tries to maximize the cov-erage of this discrete state space, i.e. to maximize the number of reached squares.
Figure 3.4. A discrete state space in two dimensions. Reached states are marked withan X and alarm states with an A.
The different generated test cases are called scenarios. All test cases havethe same length (in time), predefined by the user. There are two strategies forgenerating scenarios: a default strategy and a random strategy. In the randomstrategy, the inputs are set to the different possible values randomly and the valuesare changed very often. The default strategy on the other hand is a strategicallyand systematically way of generating scenarios. In the first scenario, all inputsare set to their default values and kept to these values the whole scenario. Statechanges, i.e. when the outputs changes are noted as interesting points. Thestrategy is to change the inputs at these points where a state change takes place.First, only one input is changed to another value and one by one are all inputschanged to all their possible values. The scenario generation can now continuewith either changing one input at another state change or generating scenarios
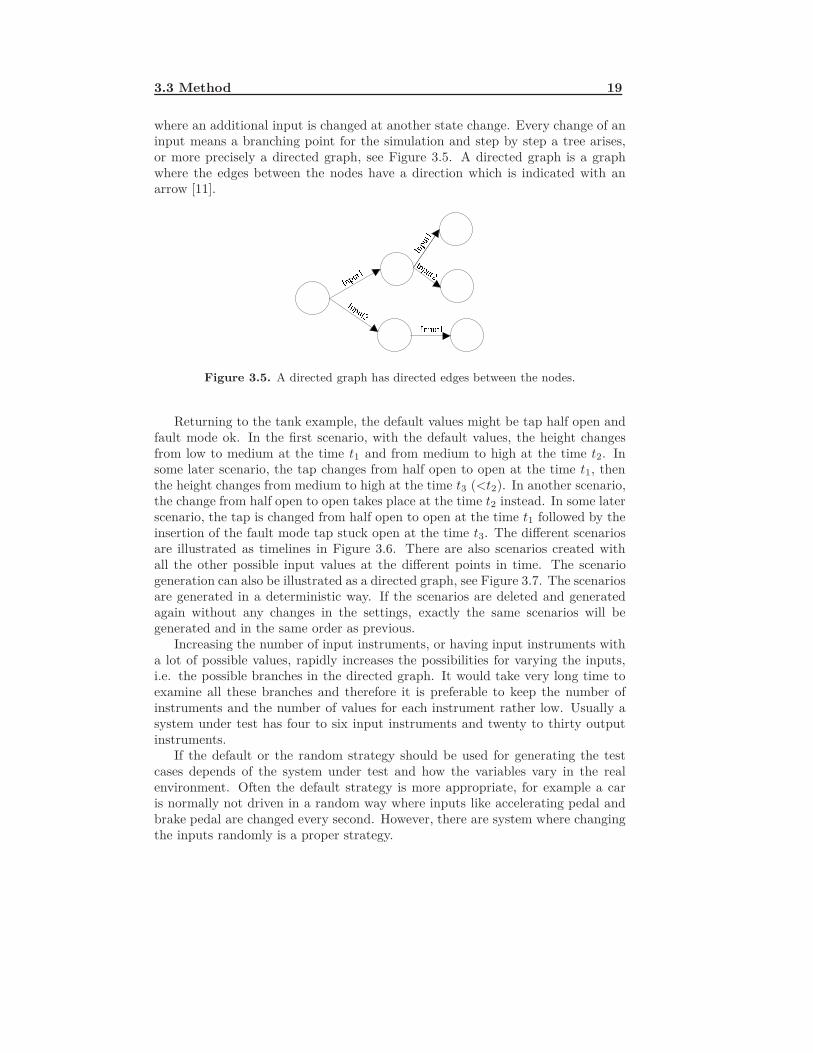
3.3 Method 19
where an additional input is changed at another state change. Every change of aninput means a branching point for the simulation and step by step a tree arises,or more precisely a directed graph, see Figure 3.5. A directed graph is a graphwhere the edges between the nodes have a direction which is indicated with anarrow [11].
Figure 3.5. A directed graph has directed edges between the nodes.
Returning to the tank example, the default values might be tap half open andfault mode ok. In the first scenario, with the default values, the height changesfrom low to medium at the time t1 and from medium to high at the time t2. Insome later scenario, the tap changes from half open to open at the time t1, thenthe height changes from medium to high at the time t3 (<t2). In another scenario,the change from half open to open takes place at the time t2 instead. In some laterscenario, the tap is changed from half open to open at the time t1 followed by theinsertion of the fault mode tap stuck open at the time t3. The different scenariosare illustrated as timelines in Figure 3.6. There are also scenarios created withall the other possible input values at the different points in time. The scenariogeneration can also be illustrated as a directed graph, see Figure 3.7. The scenariosare generated in a deterministic way. If the scenarios are deleted and generatedagain without any changes in the settings, exactly the same scenarios will begenerated and in the same order as previous.
Increasing the number of input instruments, or having input instruments witha lot of possible values, rapidly increases the possibilities for varying the inputs,i.e. the possible branches in the directed graph. It would take very long time toexamine all these branches and therefore it is preferable to keep the number ofinstruments and the number of values for each instrument rather low. Usually asystem under test has four to six input instruments and twenty to thirty outputinstruments.
If the default or the random strategy should be used for generating the testcases depends of the system under test and how the variables vary in the realenvironment. Often the default strategy is more appropriate, for example a caris normally not driven in a random way where inputs like accelerating pedal andbrake pedal are changed every second. However, there are system where changingthe inputs randomly is a proper strategy.

20 Test Environment
Figure 3.6. Each timeline represents one scenario. The inputs at the beginning of thescenario can be seen at the top of the timeline. Changes in a reported variable stands tothe left of the line and changes in the inputs to the right. It can be seen that the inputsare changed when a state change, i.e. a change in a reported variable, takes place.

3.4 Test Focus 21
Figure 3.7. The scenario generation for the tank example as a directed graph. Eachnode represents a state and the changes in the inputs can be seen at the edges.
3.4 Test FocusThe test focus can be influenced in several ways. Which these are and what impactthey have on the generated scenarios will be described in this section.
3.4.1 Coverage ReportThe so called coverage reports are state tables defined by the tester. Each columnin the table represents a state variable and the table itself describes which stateshave been reached in which test cases. This state table defines which state changesthat shall be considered as important. That is, at which state changes the inputsshall be varied. TestWeaver changes the inputs at the state changes that arerepresented in the coverage report. Consider the tank example in Figure 3.3 oncemore. If the coverage report for this example only consist of one column; theheight, the inputs will be changed when the height switches range, e.g. from lowto medium. If, instead, the coverage report would have the column “difference”,the inputs will be changed when the difference switches range, e.g. from smallto medium. Lastly, if the coverage report consists of two columns; height anddifference, the inputs will be changed when a state change takes place either inthe height or in the difference.
TestWeaver also considers these state tables as a sort of priority list and triesto drive the system under test into states that are reported in the coverage report.Thereby the first column has the highest priority and TestWeaver foremost triesto maximize the number of entries in this column, the second column has the nexthighest priority and so on.
3.4.2 ConstraintsThere is the possibility to add constraints in the form of logical expressions tothe system under test in order to limit the permissible state space. For example

22 Test Environment
futile or unrealistic test cases or certain states which cannot be handled by themodel can be omitted. An unrealistic scenario which is desirable to avoid couldbe accelerating and braking simultaneously in a car. Scenarios that violate theconstraints are either terminated or not generated at all, depending on how goodTestWeaver can handle the constraints. However, sometimes it can also be ofinterest to study what happens in these futile or unrealistic test cases.
3.4.3 InstrumentationWhen the instruments are programmed in C/C++, also the instrument sequencein the file can have an impact on the scenario generation. If the function forchanging the inflow in the tank is programmed before the function for changingthe fault mode, scenarios where the inflow is varied are generated before scenarioswhere the fault mode is varied. However, the order of the instruments does notmatter if the test runs long enough because in the long run, the coverage reportsand constraints are more important.
3.5 Classification of the MethodSince the system under test is executed when generating the test cases, dynamictesting is performed with TestWeaver. The instrumented variables are the onlyinformation TestWeaver has about the system, i.e. the actual code is unknown,and therefore the method is a black-box testing method, see Section 2.3.2.
Both input and output variables are divided into equivalence classes. A numberof representatives (discrete values) are chosen for each input variable. The outputvariables are divided into different ranges but it is not really necessary to considerwhich input values lead to which output values when the partitioning is performed.It is definitely possible to choose the discrete values for the inputs and the partitionof the output variables without considering equivalence classes. There is also thepossibility to do the instrumentation in a more formal manner where equivalenceclasses are determined and based on the outcome; the discrete inputs and theoutput partitions are chosen. Thereby, the boundary values can be considered aswell and boundary value testing can be carried out by choosing the discrete inputsto the boundary values.
The method is also a type of testing based on state transitions since statechanges are considered and the progress in the state space is recorded and remem-bered by TestWeaver. However, it should be noticed that the states consideredby TestWeaver are a little different than the states in a state diagram or a statetransition table. The state changes considered by TestWeaver can be discrete statechanges (for example from partly filled to full in Figure 2.3) but it can also bechanges of physical values; that the number of elements on the stack changes fromthree to four (but the stack is still partly filled). The goal of the method is tocover as much of the state space defined by the instrumented variables as possible,especially the parts of the state space specified in the so called coverage reports.

Chapter 4
Application
To evaluate the testing tool TestWeaver, mainly two different examples were stud-ied: the software of an automatic transmission control unit and a module of thisautomatic transmission. This module is responsible for the pressure control of theactuators inside the transmission. In this chapter, an introduction to these two ex-amples is given. Firstly, in Section 4.1, the example of the automatic transmissioncontrol unit is described. A short introduction to gear changes in an automatictransmission is given as well. In Section 4.2, a description of the pressure con-troller and its functionality follows. Lastly, in Section 4.3, the different possibilitesto instrument these both examples are discussed and the chosen alternative isjustified.
Unless anything else is said, the information in this chapter is taken from [5].
4.1 Automatic Transmission - EcoLife
The example studied to evaluate TestWeaver is a real life example of a ZF six gearautomatic transmission for buses called EcoLife, see Figure 4.1. The test object isthe software of the transmission control unit (TCU) which has the main task todecide how and when to change the gear.
The system under test consists of three external processes running under theZF co-simulation tool Softcar: the software for the automatic transmission, themodel of the vehicle and the shift lever. The software is the real software whichis used in the TCU. The model describes the rest of the vehicle, for example themotor and the hydraulic. The shift lever is a separate process since there arevarious shift levers for different buses. There is also a graphical user interface inSoftcar belonging to the example in order to visualize the variables and simplifythe understanding of the progress of the test.
The simulation is software in the loop simulation and the preformed tests aresystem tests since the automatic transmission is considered as whole and not onlysingle components of the system.
23

24 Application
Figure 4.1. The ZF six gear automatic transmission EcoLife, [3].
Gear Changes in an Automatic TransmissionIn an automatic transmission, the different gears are realised with a planetarygear set which consists of a sun gear (1), a planet carrier (2) with planet gears(3) and a ring gear (4), see Figure 4.2. By holding one of these three parts fixed,different gear ratios can be realised. Thereby, one of the remaining two parts isdriven by an input torque and the third part of the planetary gear provides theoutput torque. For example, a large reduction in torque is obtained by holdingthe ring gear fix and using the sun gear as input and the planet carrier as output.To provide four, five or six forward gears and one reverse gear, one planetary gearset is not enough. Instead, two, three or four planetary gear sets are connected toeach other to enable several different gear ratios.
Figure 4.2. A planetary gear with a sun gear (1), a planet carrier (2) with planet gears(3) and a ring gear (4) [5].

4.2 Pressure Controller 25
One main difference between manual and automatic transmissions is that thegears are changed without interruption of the force flow in automatic transmis-sions. This is achieved by electronic-hydraulic actuated clutches and bands whichconnect different transmission elements (different parts in the planetary gear sets).Thereby, the torque is transferred between the elements and the engine speed isautomatically adjusted to the new gear. Hence, a gear change can take place with-out disconnecting the motor from the transmission and without that the driverhas to release the accelerating pedal.
The gear changes are controlled by the TCU which also makes sure that thegear changes take place in a comfortable way. Input signals to the control unitare, among others, the vehicle speed, engine speed, engine torque, throttle po-sition, wheel speeds and shift lever position. Output signals from the TCU aresignals for the electronic-hydraulic actuators mentioned above to control the gearchanges, signals for the instrument panel (current gear, shift lever position etc.)and signals with information for the diagnostic system which saves possible errorsin a memory, see Figure 4.3. More information about automatic transmissions andtheir functionality can be found in [5].
Figure 4.3. The TCU takes several inputs and depending on these decides whether agear change should take place or not.
4.2 Pressure ControllerSince the automatic transmission EcoLife is a very large and complex example,it is not appropriate for all type of tests. Therefore, a module of the softwareresponsible for handling the pressure control, was taken as another example. Theclutches and bands that control the transmission elements are actuated with ahydraulic pressure. The pressure in turn is changed by an electronic actuatedvalve. For the comfortable gear change it is very important that the pressure isadjusted in an accurate way. Therefore, the pressure for the clutches and bands iscontrolled. The input to the pressure controller module of the software is a targetpressure from the rest of the controller software. The pressure controller moduletransforms this target pressure into a current which is forwarded to the actuatorsby the control unit. The actuators are the valves that adjusts the pressure of theclutches and bands.

26 Application
The software of the pressure controller is the implementation of a finite statemachine. This state machine describes the different states of the pressure controllerand which events that are required for a state change, the principle is shown inFigure 4.4. This figure only shows some of the states of the pressure controller.The controller can be switched on and off and it can be changed between openand closed loop control. There is also a state where the pressure is limited to anupper or lower limit [5, 16].
Figure 4.4. The software of the pressure controller is the implementation of a statemachine. Notice that this figure does not show all states of the controller.
This simulation is software in the loop simulation as well but the preformedtests are unit tests since the pressure controller does not represent a whole systembut a module of the automatic transmission software.
4.3 Instrumentation Set UpThe instrumentation defines the communication between the co-simulation envi-ronment and TestWeaver. It can take place either in an additional external processprogrammed in C or C++ or the instruments can be added directly in the Simulinkmodel, see Section 3.2. For the two considered examples, the instruments wereprogrammed in C++ in an additional external process.
One advantage with the chosen method is that no changes have to be doneto the actual project since an additional process is created independently. Theoriginal files do not have to be changed or rebuild, only the new C++ projectwith the instruments and the communication between TestWeaver and the co-simulation tool Softcar has to be rebuild. This project is rather small and easyand fast to rebuild. Another advantage is that the same instrumentation can beused on different models and software versions (as long as the variable names arethe same) without any changes to the file. One disadvantage is that the tester hasto program the instruments by hand while in Simulink, assistance is given by a

4.3 Instrumentation Set Up 27
graphical user interface. However, there are not particularly many functions thathave to be added and when the structure is known it is not that complicated.
An additional argument to choose the first variant with the instruments inC/C++ is that since the software is the object to test, the interesting variables toreport are not model variables but software variables, see Figure 4.5. These arenot available in the model and the reporters therefore have to be designed directlyin C/C++.
Figure 4.5. It is an advantage to program the instruments in an additional externalprocess since this allows the instrumenation of variables of the software as well.
The variables that are desirable to report can mainly be of two kinds. Theycan be the values of a signal directly, but a common case is when not the variablesdirectly are of interest but logical conditions based on the values of the variables.For example, a difference of two variables can be of interest (as in the tank example,see Section 3.2). Another example is that an output variable can be an error ornot, depending on the current input variables. Such conditions can easily beprogrammed in the C/C++ project and it is also possible to program them inMatlab/Simulink. A variable depending on the result of these conditions can thenbe reported. However, the alternative with Matlab/Simulink is only possible if allneeded variables are available in the model and no variables that are only accessiblein the software are required for the logical condition. If a C/C++ project is neededfor the reporters anyhow, the choosers might be designed there as well.
For the two considered examples, variables of the software were of interest andit was desirable not to have to change the present environment model. Therefore,the alternative with the additional external process was chosen.


Chapter 5
Tests
In this chapter, the performed tests on the both examples are described. Mainly,three different tests were carried out. In Section 5.1 a general test performed onthe EcoLife example is described. The aim with this test is to see if any knownor unknown errors could be found. In Section 5.2 a test on a faulty version of thesoftware for the EcoLife transmission is presented. The goal with this test is toexamine if and how fast TestWeaver could find this fault. The last test is describedin Section 5.3. This test is performed on the pressure controller with the aim tolook into the reached code coverage when testing with TestWeaver. For each test,the instrumentation, test focus and results of the test are presented. Finally, inSection 5.4 the time needed for performing the tests with TestWeaver is discussed.
5.1 General TestA general test was preformed on the EcoLife example, see Section 4.1, with thegoal to see if any errors (known or unknown) could be found.
5.1.1 Input Instruments - ChooserThe natural inputs of this system are the variables that the driver can changesuch as the accelerator pedal, the brake pedal and the shift lever. Besides these,it is also possible to specify the road inclination during the simulation. The inputvariables chosen for this system are the following variables which all are inputs tothe model:
shift lever with the values R, N and D, where R means reverse gear, N is neutralwith no gear selected and D is drive which is the mode where the vehiclecan move forward and the gear can be changed. The shift lever also hasthe possible modes D1, D2 and D3 where the gear is restricted to gear 1,2 and 3 respectively. These modes are omitted to limit the state space, seeSection 3.3.
29

30 Tests
accelerator pedal with the values 0%, 50% and 100%. With 0% the pedal isnot actuated at all and 100% means that the pedal is depressed maximally.
brake pedal with the values 0 N, 10000 N and 20000 N. These forces can beillustrated on the hand of Example 5.1.
Example 5.1
Consider a bus with the weight 21000 kg (Mercedes CapaCity with the fore-runner transmission of EcoLife has an empty weight of about 18500 kg [2])and the velocity 50 km/h. With the formulas F = ma, v = at and s = 0.5at2,it can be calculated that a braking force of 10000 N ideally and very simpli-fied (neglecting rolling resistance and air resistance) corresponds to a brakingdistance of about 200 metres for this bus. In the same way it can be calcu-lated that a braking force of 20000 N corresponds to a braking distance ofabout 100 metres.In the formulas above, the notation stands for a: acceleration [m/s2], F :force [N ], m: mass [kg], s: distance [m], t: time [s] and v: velocity [m/s].
road inclination with the values -10%, 0% and 10%. The road inclination a inpercent is the ratio of the height x to the distance y, see Figure 5.1. That is,an inclination of 10% is for example reached with the height 10 meter andthe distance 100 meter.
Figure 5.1. The road inclination a in percent is the ratio of the height x to the distancey.
The reason for only defining three discrete values for each input variable is, again,for limiting the state space. The values where chosen to be one extreme low value,one extreme high value and one value in between.
5.1.2 Output Instruments - ReporterSince the system under test is the software for an automatic transmission, naturalimportant courses of events are the gear changes. The gear changes can be observedby studying the current and the target gear. If these are different, a gear change isabout to take place. It can also be of interest to consider the gear change type andthe current velocity. Exactly these four variables are chosen to be state reporters:
current gear which is a discrete variable that reports the current gear, for in-stance neutral, gear one, gear two etc.

5.1 General Test 31
target gear which is a discrete variable that reports the target gear, for instanceneutral, gear one, gear two etc.
gear change type which for example can be increasing or decreasing the gear.The gear can also be changed in different ways depending on how the pres-sures actuating the clutches and bands proceeds. Either the pressure canbe changed as a step or as a ramp. The gear change type is described as adiscrete variable as well.
vehicle velocity which is divided into intervals of 20 km/h, i.e. the velocity isreported to be 0-20 km/h, 20-40 km/h etc.
As alarm reporters, two diagnosis variables are chosen:
error number which is an integer value set in every cycle to describe the currenterror, the value 0 means no error.
error type which is an integer value as well and contains additional informationabout the error and again the value 0 means no error.
5.1.3 Test FocusSince the gear changes are of interest, this has to be told TestWeaver and it is doneby a coverage report, see Section 3.4.1. If the report contains one column for thecurrent gear and one for the target gear, TestWeaver tries to maximize the numberof entries in the table, i.e. tries to reach as many combinations of current andtarget gears as possible which means as many gear changes as possible. Anotherconsequence of defining the coverage report as just described is that the inputswill be changed just as gear changes take place.
5.1.4 ResultsThe default strategy was chosen for generating the test cases since this resemblesthe normal operation of a bus. It is not normal to drive a bus in a randomly wayand constantly changing the chosen inputs.
It was early found that a too inclined road brought an error since the busgradually went arbitrary fast. This was a known error and depends on instabilityin the model; the model cannot handle very steep roads. As a result of this, thediscrete values defined for the road inclination were changed to -5%, 0% and 5%.
With the new values for the road inclination, TestWeaver was run for a longtime and generated numerous test cases. An error was reported and it turned outthat it was a parameterisation error. The software contains several parametersthat enable the adaptation of the software to many different vehicles, engines etc.The tests are carried out with a standard set of parameters and one of these wasset to an incorrect value. Parameterisation errors are not as serious as errors inthe actual code of the software. However, the parameterisation is important aswell and if an error of this type is found, the parameter is normally adjusted. Thisproblem had been noticed and was already adjusted.
32 Tests
The tested software was known to be of very good quality and no serious errorswere expected. This test confirms the quality of the software since no unknownproblems were found and the test also shows that TestWeaver is able to detectsmall problems, like parameterisation errors, in a software of good quality.
5.2 Fault FindingTo test the fault finding properties of TestWeaver, the EcoLife example but witha software version known to be faulty was instrumented and tested.
5.2.1 Instrumentation and Test FocusThe fault was inserted by software developers and was not known when testingthe example. However, it was given which variables had to be changed to enterthe faulty state. Exactly these variables were set to be the input variables:
shift lever with the values R, N and D.
accelerator pedal with the values 0%, 50% and 100%.
brake pedal with the values 0 N, 10000 N and 20000 N.
ABS (antilock braking system) with the values 0 and 1 where 0 means deac-tivated and 1 activated.
The output instruments, both those reporting states and those reporting alarms,were chosen exactly in the same way as in the test described in Section 5.1. Alsothe coverage report, i.e. the test focus, was exactly the same and again, the defaultgeneration strategy was used.
5.2.2 ResultsThe faulty state was reached by accelerating to the fourth gear with ABS deac-tivated. When in the fourth gear, the accelerator pedal was completely released(accelerator pedal = 0%). Finally, during the gearshift from the fourth to thethird gear, the ABS was activated. The error was found already after about onehour of testing and about 100 test cases.
There are two main reasons for finding this error at all. The first reason is thatit was known that the ABS should be one of the input variables that are variedby TestWeaver. It is not trivial to conclude that the ABS should be activated anddeactivated to trigger the fault and without this information, it would probablyhave been very difficult to find the inserted fault. The second reason is that thetest focus was chosen to be the gearshifts. Since the coverage report consists of thecurrent and the target gear, the input variables were changed when the current orthe target gear changed. This fault only occurs when the variables are changedexactly as described above and the ABS has to be activated during the gear changeand this is achieved with the chosen test focus. Since the system under test is anautomatic transmission, it is natural to include the gearshifts in the test focus.

5.3 Code Coverage Test 33
5.3 Code Coverage TestWith the aim to be able to make a statement according to how much of the soft-ware is actually tested when TestWeaver is used, a code coverage test was carriedout. Since the EcoLife example is rather big and complex the decision to onlyconsider a smaller part of the example was made. The chosen part is the pressurecontroller described in Section 4.2. One advantage with choosing this example isthat code coverage tests for different testing methods have been implemented onthis controller. Therefore, the pressure controller example provides the possibilityto compare TestWeaver to other testing methods.
The code coverage test was implemented through the tool Testwell CTC++, inthe following referred to as CTC. The tool instruments the code by adding someadditional statements to the source files and thereby enables CTC to recognize ifand how often different parts of the code have been executed. The test coverage canbe chosen to be measured according to different criteria like for example functioncoverage (tests if all functions have been called at least once), decision coverageand condition coverage. For this code coverage test, the decision coverage optionwas chosen, see Section 2.5.2. In addition to measure if all decisions have beenevaluated to both true and false, CTC also considers if all functions have beenentered at least once, if all branches in switch-statements and each explicit controltransfer (goto, break, continue, return etc.) has been taken [15]. The decisioncoverage option was chosen because this criterion had been used for measuring thecode coverage when using other testing methods.
CTC provides the user with a report describing the coverage of each functionexpressed as a percentage and there is also the possibility to study exactly whichparts of the functions have been executed and which have not.
The difficulty with applying TestWeaver to a system like the pressure controlleris that there is no simple external stimulation of just a few variables that makes thecontroller to enter almost every possible state which would give large code coverage.It is not enough to switch the controller on and vary the target pressure. This onlyleads to that the states ON and OFF are reached, see Figure 4.4, but it does notmean that the other states within ON are automatically reached. Consequently,only a code coverage of 35% is acheived and as mentioned, several states are notreached at all. This in turn means that many parts of the code are not executed. Inorder to increase the percentage of executed code the user has to give TestWeaverthe possibility to vary several variables.
5.3.1 Input Instruments - ChooserAs mentioned above, the possibility to change several variables has to be provided.Therefore, the following variables were chosen as input instruments:
active with the values 0 and 1 where 1 means that the controller is activated and0 that it is deactivated.
mode with the values 0 and 1 where 0 means open loop control and 1 closed loopcontrol.

34 Tests
reference pressure with the values 10000 mbar, 20000 mbar and 30000 mbar.This is the input to the controller and is the desired pressure for the clutchor the band belonging to the current pressure controller.
main pressure which is the available pressure and consequently this pressure alsodefines an upper limit for the pressure controlled by the pressure controller.The values 18000 mbar and 25000 mbar are defined for the main pressure.
As in the example with the automatic transmission, the number of values for eachvariable is kept low to limit the state space.
5.3.2 Output Instruments - ReporterTwo state reporters have been chosen for this example:
state which is a discrete variable describing the current state of the pressurecontroller. Different states are, among others, deactivated, open loop control,closed loop control and pressure limited by main pressure.
actual pressure which should have the same value as the reference pressure.However, the pressure can be limited by a defined minimal value, a definedmaximal value or the main pressure and in these cases; the actual valuetakes the limited value as current value. The values of the actual pressureare divided into three ranges and these ranges are reported.
5.3.3 Test Set Up and Test FocusTests with two different set ups were carried out. In both cases, the pressurecontroller was initialized with a defined minimal pressure and with a limitation onthe gradient of the pressure change activated. In one set up, a maximal pressurewas defined as well. In the other set up this upper limit was omitted.
The two available state reporters were chosen for the coverage report.
5.3.4 ResultsAfter just about 200 generated test cases for each test set up, a coverage that is4 percentage points under the coverage reached with a testing method developedwithin ZF, has been reached. This method in turn reaches a coverage that is7 percentage points under the coverage obtained when the pressure controllerwas tested manually. One reason that the coverage obtained when testing withTestWeaver is lower then the coverage reached with the other two methods is thatwith the instrumentation described above, not even all states are reached. Forexample there is a state where the pressure controller is deactivated automaticallybecause the pressure has had a very low value for a long time. However, this stateis never reached when a minimal pressure is defined for the controller. There isalso a possibility to insert an error in the controller which leads to other states.

5.4 Time Consumption 35
With no doubt, the code coverage when testing the pressure controller withTestWeaver could be increased by adding more choosers or by changing the ba-sic conditions, for example by removing the minimum pressure limit. The onlyinformation that TestWeaver has about the system under test is the informationgiven in the instruments and therefore the degree of coverage depends very muchon the instrumentation. TestWeaver can only test the regions of the software thatare made accessible, i.e. that are covered by the chosen instrumentation. To beable to increase the code coverage, very good knowledge of the system under test isrequired since only then it is possible to change the instrumentation in a successfulway.
It can be seen that a very good coverage is reached for the parts of the systemthat is defined to TestWeaver, i.e. instrumented. Therefore, it can be assumedthat tests with TestWeaver have a good coverage of the state space defined in thetest focus, i.e. the coverage report.
This example also shows that TestWeaver is more suitable for system tests thanfor unit tests. One difficulty by unit tests is, like previous mentioned, that it isdifficult to choose just a few input instruments that excite the whole system undertest sufficiently. It is as shown, possible to carry out unit tests with TestWeaveras well but the recommended area of application is system testing.
5.4 Time ConsumptionThe time needed for the test mainly depends on how fast or slow the originalsetup without the instrumentation is. It does not make any particular differenceif just a few or several instruments are added or if a number of constraints aredefined or if the test runs completely without constraints. The only differencethat the constraints could make is that if a scenario violates the constraints it canbe terminated. This results in that it takes a longer time to generate the samenumber of complete scenarios since the start and stop of a scenario take some time.
Obviously, more instruments or more intervals for each instrument make thecurrent state space, that shall be searched, larger. This might lead to that it takesa longer time for TestWeaver to reach a part of the state space where errors occur.
It is impossible to make a statement about how long it takes for TestWeaver tofind an error. It depends on the current system under test, the instrumentation,the test focus and other settings of the test and of course, the error itself. However,if tests are executed on the same type of system several times, experience can begained about which coverage that can be reached with a particular instrumentationin which time. This gives information about which type of faults that could beexpected to be found in a certain time; the faults in the set of reached states.


Chapter 6
Conclusions
TestWeaver is a tool for automated software in the loop tests. The greatest ad-vantage of the tool compared to other testing methods is that the test cases aregenerated automatically. However, to succeed with the tests, the instrumentationand test focus must be considered carefully. The tool can only find faults in re-gions where it is allowed to influence the system under test, i.e. in regions that areaffected by changes made by the input instruments. This is the challenge whenusing the tool; to learn how to instrument the system under test and how to choosethe test focus in order to achieve the desired results. It will probably take sometime and experience needs to be gained in order to reach this point. For example,the inserted fault in the TCU software was only found because of the knowledgethat the ABS had to be varied (activated and deactivated) to trigger the fault.In a vehicle, there are many variables that could be varied and since the numberof input instruments ought to be kept low, the challenge is to choose the rightselection and number of input variables to instrument.
When the tool is well-known, it can be used in a very time efficient way. Thetime needed until it is possible to start generating test cases is considerably shorterthan when writing test cases by hand. The only actions that have to be performedare the instrumentation and defining the test focus. The test case generation isautonomous and can be performed over night or over a whole weekend. Whenthe instrumentation has been carried out, many different test cases are createdin a rather short time. Just by changing the test focus it is also possible to testdifferent parts of the system still using the same instrumentation.
Another advantage of the tool is that it does test everything it is allowed totest. A human tester often omits test cases which are considered to be unrealisticor unimportant. TestWeaver does not have any such valuations but varies theinputs in order to increase the covered state space. Thereby, faults that normallywould have been missed might be found.
The aim with the tool is not to replace the existing testing methods but tocomplement them in the testing process. Commonly performed tests are testscripts which are written by hand to test of fault reactions. The system undertest is driven into a certain mode, in this mode a fault is inserted and afterwards
37
38 Conclusions
it is examined if the correct fault reaction has been triggered. Tests of this typeare rather difficult to perform in a simple and direct way with TestWeaver. It isnot especially complicated to insert the faults; this can be done by defining aninput instrument for the fault of interest. However, the results of the test cannotreally be evaluated in a convenient way. It is desirable to check if a fault reactionis triggered even if the system is fault free, if a fault reaction is triggered when afault exists and if this fault reaction is the correct one. Since the input instrumentsand output instruments are not connected, i.e. there is no easy way to determineif an output is the expected one depending of the input; it is complicated todo these checks with TestWeaver. The checks could be programmed by hand inC/C++ but for a complex system with many possible errors and several faultreactions this would mean a great deal of effort and take rather long time. If theinstrumentation, despite the extra effort, would be carried out, it would give thebenefit that many more test cases easily could be carried out compared to the testcases programmed by hand where normally only a few test cases for each fault andcorresponding fault reaction are programmed.
Area of ApplicationThe tool is most appropriate for system testing. By unit testing of a single module,it is difficult to find just a few variables that excite the whole system under testsufficiently. The same problem occurs by integration testing where the systemunder test consists of several modules integrated into a component. The difficultyto choose just a few inputs that stimulate large parts of the considered componentis still the same.
It is possible to use TestWeaver for testing at an early phase of the softwaredevelopment process. As soon as the software can be run in a co-simulation thetesting can begin. The results at this point can make it possible to find many faultsat an early stage in the development process which is always aimed for. Often,the costs for correcting an error increases the later in the development process theerror is found. In addition, the results can support the generation of test casesthat are written by hand. It may be desirable to further test some of the foundproblems in regular test scripts as well.
Another appropriate area of application for TestWeaver is testing at the endof the regular test phase. Tests could be carried out with the aim to find prob-lems that have not been found up to that point due to, for example, omitted orinsufficient test cases.
Since the tool generates many different test cases and it has been shown that thecoverage of the instrumented and considered parts of the code is high. TestWeavercan also be used for confidence-building purposes: the more tests are run, thehigher the confidence in the system under test can be seen.
When a found fault is believed to have been eliminated, the tool could be usedfor testing if it really has ceased to occur. It would also be possible to test thesurroundings of the state where the fault has occurred to study if it arises in someother states as well.
It would be very interesting to be able to use TestWeaver for hardware in

39
the loop tests as well. By hardware in the loop, the software is run on the realelectronic control unit while the rest of the environment still is simulated on acomputer. Such tests are carried out in real time which leads to completely otherrequirements on the tool. A version of TestWeaver that can be used for hardwarein the loop simulations is planned.

Bibliography
[1] http://www.automotivespice.com/web/introduction.html. Visited on 2008-12-11.
[2] http://www.mercedes-benz.de/content/germany/mpc/mpc_germany_website/de/home_mpc/bus/home/new_buses/models/regular_service_busses/capacity/technical_data.html. Visited on 2008-11-22.
[3] http://www.zf.com/media/media/img/corporate/press/presse/fachpk_2008/064-1_zf-eoclife_lg.jpg. Visited on 2008-09-18.
[4] Lee Copeland. A Practiotioner’s Guide to Software Test Design. Artec House,Incorporated, 2003.
[5] Hansjörg Dach, Wolf-Dieter Gruhle, and Peter Köpf. Pkw-Automatgetriebe,Sicher, komfortabel und wirtschaftlich fahren. Verlag moderne Industrie, 2ndedition, 2001.
[6] International Organization for Standardization. ISO/IEC 15504 InformationTechnology - Process Assessment, 2004-2008.
[7] Automotive Special Interest Group. Automotive SPICE Process AssessmentModel, release v2.3, 2007.
[8] Automotive Special Interest Group. Automotive SPICE Process ReferenceModel, release v4.3, 2007.
[9] Klaus Hörmann, Lars Dittmann, Bernd Hindel, and Markus Müller. SPICE inder Praxis, Interpretationshilfe für Anwender und Assessoren. dpunkt.verlagGmbH, 1st edition, 2006.
[10] Software Engineering Institute. CMMI for Development, version 1.2, 2006.
[11] Andreas Junghanns, Jakob Mauss, and Mugur Tatar. TestWeaver - Funktion-stest nach dem Schachspielerprinzip. 2. Fachkonferenz zum Thema Test vonHard- und Software in der Automobilindustrie, FKFS, Stuttgart, Germany,2008.
41

42 Bibliography
[12] Andreas Junghanns, Jakob Mauss, and Mugur Tatar. TestWeaver - Tes-tautomation based on Computer Chess Principles. 7th International CTISymposium Innovative Automotive Transmissions, Berlin, Germany, 2008.
[13] Scott Loveland, Geoffery Miller, Richard Prewitt Jr, and Michael Shannon.Software Testing Techniques : Finding the Defects That Matter. CharlesRiver Media, Inc, 2004.
[14] Markus Müller, Klaus Hörmann, Lars Dittmann, and Jörg Zimmer. Automo-tive SPICE in der Praxis, Interpretationshilfe für Anwender und Assessoren.dpunkt.verlag GmbH, 1st edition, 2007.
[15] Testwell Oy. CTC++ Test Coverage Analyzer for C/C++, User’s Gudie,Version 6.1.1, 2005.
[16] Carsten Paulus, Michael Wolff, Peter Feulner, and Hans-Christian Reuss. Einneues Framwork zum Testen von Kfz-Steuergräte-Software. 2. Fachkonferenzzum Thema Test von Hard- und Software in der Automobilindustrie, FKFS,Stuttgart, Germany, 2008.
[17] Andreas Spillner and Tilo Linz. Basiswissen Softwaretest, Aus- und Weiter-bildung zum Certified Tester. dpunkt.verlag GmbH, 2nd edition, 2004.
[18] Andreas Spillner, Thomas Roßner, Mario Winter, and Tilo Linz. PraxiswissenSoftwaretest, Testmanagement. dpunkt.verlag GmbH, 1st edition, 2006.
[19] John Watkins. Testing IT: An Off-the-Shelf Software Testing Handbook.Cambridge University Press, 2001.
UpphovsrättDetta dokument hålls tillgängligt på Internet — eller dess framtida ersättare —under 25 år från publiceringsdatum under förutsättning att inga extraordinäraomständigheter uppstår.
Tillgång till dokumentet innebär tillstånd för var och en att läsa, ladda ner,skriva ut enstaka kopior för enskilt bruk och att använda det oförändrat för icke-kommersiell forskning och för undervisning. Överföring av upphovsrätten vid ensenare tidpunkt kan inte upphäva detta tillstånd. All annan användning av doku-mentet kräver upphovsmannens medgivande. För att garantera äktheten, säkerhe-ten och tillgängligheten finns det lösningar av teknisk och administrativ art.
Upphovsmannens ideella rätt innefattar rätt att bli nämnd som upphovsmani den omfattning som god sed kräver vid användning av dokumentet på ovan be-skrivna sätt samt skydd mot att dokumentet ändras eller presenteras i sådan formeller i sådant sammanhang som är kränkande för upphovsmannens litterära ellerkonstnärliga anseende eller egenart.
För ytterligare information om Linköping University Electronic Press se förla-gets hemsida http://www.ep.liu.se/
CopyrightThe publishers will keep this document online on the Internet — or its possi-ble replacement — for a period of 25 years from the date of publication barringexceptional circumstances.
The online availability of the document implies a permanent permission foranyone to read, to download, to print out single copies for his/her own use andto use it unchanged for any non-commercial research and educational purpose.Subsequent transfers of copyright cannot revoke this permission. All other uses ofthe document are conditional on the consent of the copyright owner. The publisherhas taken technical and administrative measures to assure authenticity, securityand accessibility.
According to intellectual property law the author has the right to be mentionedwhen his/her work is accessed as described above and to be protected againstinfringement.
For additional information about the Linköping University Electronic Pressand its procedures for publication and for assurance of document integrity, pleaserefer to its www home page: http://www.ep.liu.se/
c© Hanna Amlinger