application note rke/tps measurement · application note rke/tps measurement system measurement for...
TRANSCRIPT
Application Note
RKE/TPS Measurement System Measurement for Automotive Applications MS269xA Signal Analyzer
Introduction Remote Keyless Entry (RKE) systems or immobilizers are embedded in modules that control electromechanical drivers for door locks, windshield wipers, interior lighting and other such functionalities – and in some cases to prevent vehicle theft. Tire Pressure Monitoring Systems (TPMS) and other auto sensor applications measure pressure, temperature, and acceleration. Testing for these automotive applications is essential. For example, testing TPMS is crucial because its and sensors are subjected to harsh environments, as well as chemicals and fluids. Testing measures the reliability, system security and integrity of TMPS, as well as RKE and immobilizers. Because of its combined Spectrum Analyzer, Signal Analyzer and Digitizing Function, the MS269xA is well suited for measuring these wireless Automotive Applications. As a Spectrum Analyzer, the MS269xA demonstrates world-class dynamic range and total level accuracy. When in Signal Analyzer mode, it features analysis bandwidths up to 125 MHz and fast FFT measurements. The standard Digitizer features 128M sample memory, which is capable of capturing an entire 125 MHz bandwidth. It can capture any waveform. The maximum capture time varies according to the frequency span. This application note provides directions for measuring RKE/TPS with MS269xA. Its instructions outline the procedures necessary for these measurements. The procedures should be performed in the order that they are given:

Freq. Span Sampling Rate Max. Capture
Time Capture Time
Setting Resolution 1 kHz 2 kHz 50 ms - 2000 s 500µs
2.5 kHz 5 kHz 20 ms - 2000 s 200µs 5 kHz 10 kHz 10 ms - 2000 s 100µs
10 kHz 20 kHz 5 ms - 2000 s 50µs 25 kHz 50 kHz 2 ms - 2000 s 20µs 50 kHz 100 kHz 1 ms - 1000 s 10µs
100 kHz 200 kHz 500µs - 500 s 5µs 250 kHz 500 kHz 200µs - 200 s 2µs 500 kHz 1 MHz 100µs - 100 s 1µs
1 MHz 2 MHz 50µs - 50 s 500ns 2.5 MHz 5 MHz 20µs - 20 s 200ns
5 MHz 10 MHz 10µs - 10 s 100ns 10 MHz 20 MHz 5µs - 5 s 50ns 25 MHz 50 MHz 2µs - 2 s 20ns
31.25 MHz 50 MHz 2µs - 2 s 20ns 50 MHz*1 100 MHz 1µs - 500 ms 10ns
100 MHz*1 200 MHz 500ns - 500 ms 5ns 125 MHz*1 200 MHz 500ns - 500 ms 5ns
*1 : Up to 6GHz
TABLE 1.
Frequency Span Vs. Maximum Capture Time.
1. CAPTURE OF RKE・TPMS TRANSMITTER SIGNAL. In the first step, the MS269xA captures and analyzes the signal coming from an RKE transmitter. This signal is either ASK or FSK modulation. Use the “Power vs. Time” function to analyze ASK modulated signal, and “Frequency vs. Time” function to analyze FSK signal. Both functions are supported by VSA mode.
FIGURE 1.
Capture Of RKE Transmitter Signal.
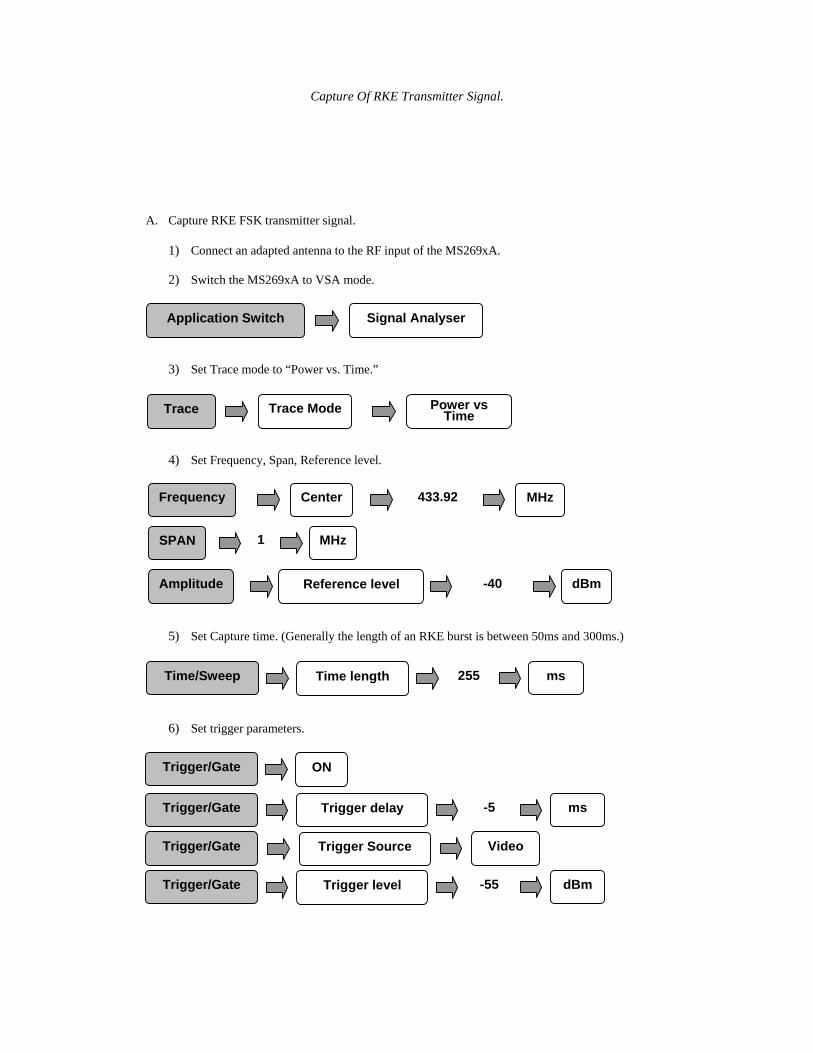
A. Capture RKE FSK transmitter signal.
1) Connect an adapted antenna to the RF input of the MS269xA.
2) Switch the MS269xA to VSA mode.
3) Set Trace mode to “Power vs. Time.”
4) Set Frequency, Span, Reference level.
5) Set Capture time. (Generally the length of an RKE burst is between 50ms and 300ms.)
6) Set trigger parameters.
Amplitude Reference level -40 dBm
SPAN 1 MHz
Frequency Center 433.92 MHz
Application Switch Signal Analyser
Trace Trace Mode Power vsTime
Time length 255 msTime/Sweep
ONTrigger/Gate
Trigger delay -5 ms Trigger/Gate
Trigger Source VideoTrigger/Gate
Trigger level -55 dBm Trigger/Gate

7) With all settings in place, begin transmitting from the RKE transmitter. The transmitted burst will
appear as shown in Figure 2.
FIGURE 2.
225 Ms FSK Burst Capture From RKE Transmitter Seen By The S269XA.
8) Make the following settings in the Signal Analyzer mode to examine the modulated RF signal produced by the RKE transmitter.
FIGURE 3.
Spectrum Display Of RKE Transmitter Signal.
Trace Trace Mode Spectrum
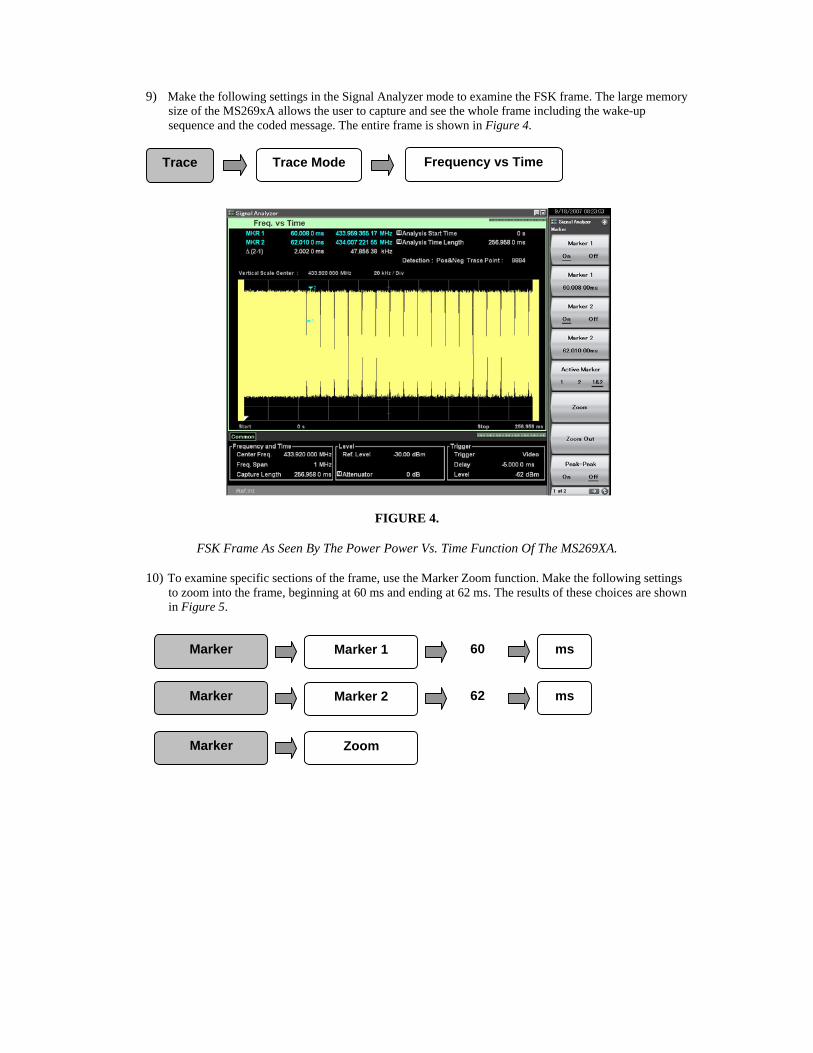
9) Make the following settings in the Signal Analyzer mode to examine the FSK frame. The large memory size of the MS269xA allows the user to capture and see the whole frame including the wake-up sequence and the coded message. The entire frame is shown in Figure 4.
FIGURE 4.
FSK Frame As Seen By The Power Power Vs. Time Function Of The MS269XA.
10) To examine specific sections of the frame, use the Marker Zoom function. Make the following settings to zoom into the frame, beginning at 60 ms and ending at 62 ms. The results of these choices are shown in Figure 5.
Trace Trace Mode Frequency vs Time
Marker 1 60 ms Marker
Marker 2 62 ms Marker
ZoomMarker
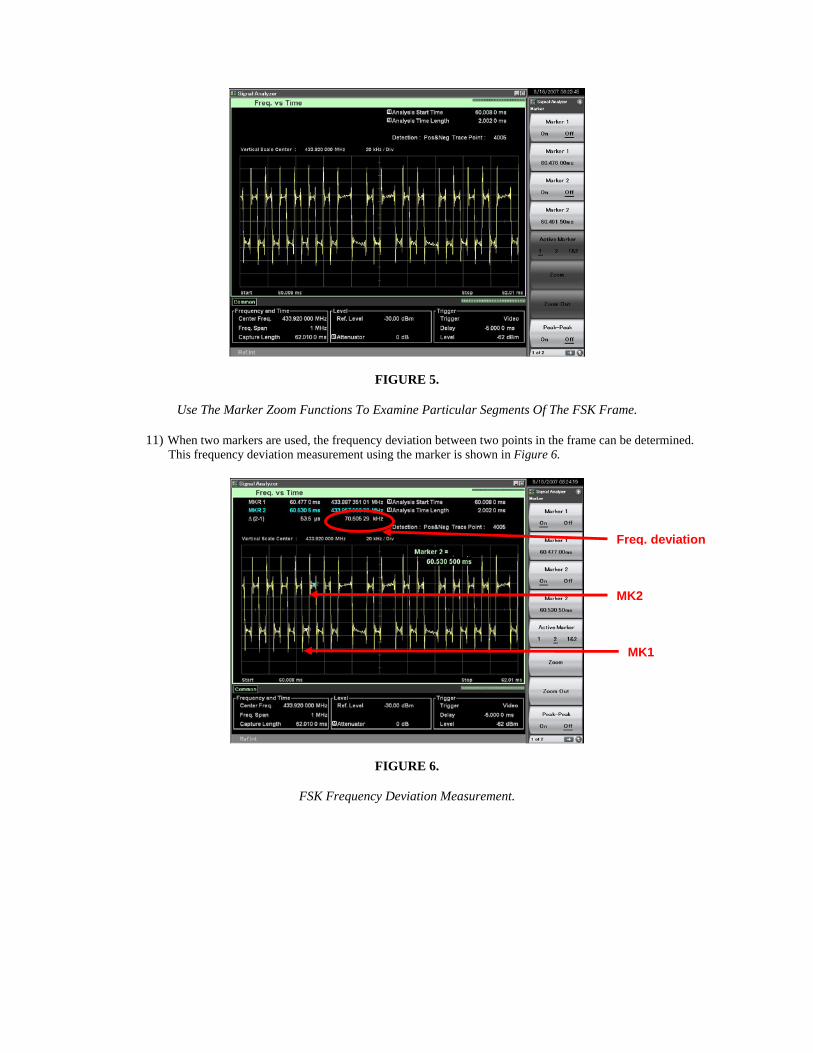
FIGURE 5.
Use The Marker Zoom Functions To Examine Particular Segments Of The FSK Frame.
11) When two markers are used, the frequency deviation between two points in the frame can be determined. This frequency deviation measurement using the marker is shown in Figure 6.
FIGURE 6.
FSK Frequency Deviation Measurement.
MK1
MK2
Freq. deviation

B. Capture an RKE ASK transmitter signal. The process to capture the ASK signal is similar to the process described for the FSK signal. Follow Steps 1 – 11 in the preceding section. Transmit the ASK signal as indicated to the FSK signal. The ASK frame is shown in Figure 7.
FIGURE 7.
ASK Frame As Seen By The Power Vs. Time Function Of The MS269XA.
1) The ASK spectrum can be displayed by using the Spectrum function of the Signal Analyzer Trace Mode.
FIGURE 8.
Spectrum Display Of ASK Signal.
Trace Trace Mode Spectrum

2) Change the time base to see more details of the ASK frame using the selections shown below. The results of these choices are shown in Figure 9.
FIGURE 9.
Details Of The ASK Signal Are Shown By Changing The Time Base.
2. SAVE CAPTURED I/Q DATA. Using the signals captured in Step 1, the signal will now be digitized and saved for analysis by simulation tools (like MATLAB®). The digitized data can also be converted to a pattern file for MS269xA-020 Vector Signal Generator (VSG). The procedure assumes you are in the Signal Analyzer mode. The Digitizer function does not operate while the measurement is in progress. Use the SINGLE button to capture the data and stop the measurement process. Make the following menu choices to digitize the signal. The file name is created by default. Record the file name when it is displayed.
Capture Exec. Digitize
Menu Key
Save Captured Data
Time length 10 msTime/Sweep
Start time 5 msTime/Sweep

3. CONVERT I/Q DATA USING IQPRODUCER. IQproducer™ is a software tool integrated in the MS269xA that allows the user to convert the I/Q data captured with the MS269xA to a pattern file that can be used in VSG mode.
NOTE: IQproducer can also build waveforms that can be played by the MS269xA signal generator using patterns generated by simulation tools such as MATLAB. (Simulation files must also be converted to the Signal Generator's format using IQproducer.)
A. Go to the desktop of the MS269XA. B. On the Start menu, choose the IQproducer icon.
IQproducer.lnk C. Select “MS269x” on the following window:
D. The IQproducer banner appears. Select the File Generation menu, then “Convert.”
E. Select the file type “MS269x Digitizer.”
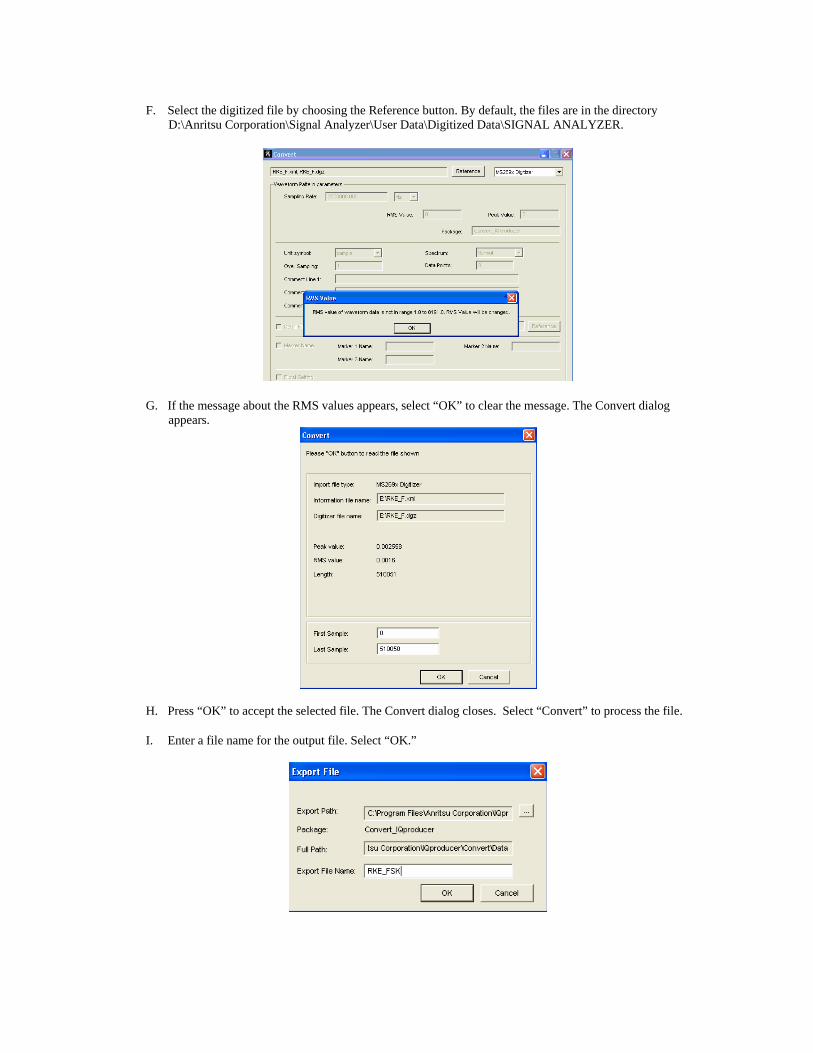
F. Select the digitized file by choosing the Reference button. By default, the files are in the directory
D:\Anritsu Corporation\Signal Analyzer\User Data\Digitized Data\SIGNAL ANALYZER.
G. If the message about the RMS values appears, select “OK” to clear the message. The Convert dialog
appears.
H. Press “OK” to accept the selected file. The Convert dialog closes. Select “Convert” to process the file. I. Enter a file name for the output file. Select “OK.”
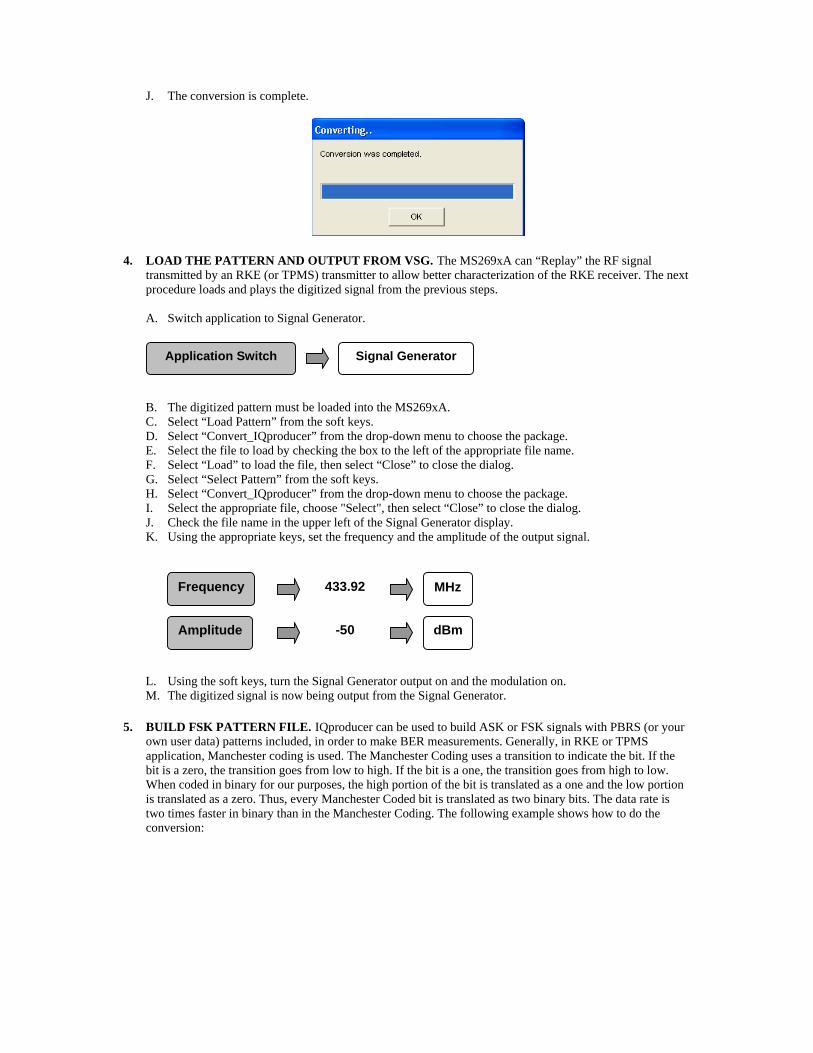
J. The conversion is complete.
4. LOAD THE PATTERN AND OUTPUT FROM VSG. The MS269xA can “Replay” the RF signal transmitted by an RKE (or TPMS) transmitter to allow better characterization of the RKE receiver. The next procedure loads and plays the digitized signal from the previous steps. A. Switch application to Signal Generator.
B. The digitized pattern must be loaded into the MS269xA. C. Select “Load Pattern” from the soft keys. D. Select “Convert_IQproducer” from the drop-down menu to choose the package. E. Select the file to load by checking the box to the left of the appropriate file name. F. Select “Load” to load the file, then select “Close” to close the dialog. G. Select “Select Pattern” from the soft keys. H. Select “Convert_IQproducer” from the drop-down menu to choose the package. I. Select the appropriate file, choose "Select", then select “Close” to close the dialog. J. Check the file name in the upper left of the Signal Generator display. K. Using the appropriate keys, set the frequency and the amplitude of the output signal.
L. Using the soft keys, turn the Signal Generator output on and the modulation on. M. The digitized signal is now being output from the Signal Generator.
5. BUILD FSK PATTERN FILE. IQproducer can be used to build ASK or FSK signals with PBRS (or your own user data) patterns included, in order to make BER measurements. Generally, in RKE or TPMS application, Manchester coding is used. The Manchester Coding uses a transition to indicate the bit. If the bit is a zero, the transition goes from low to high. If the bit is a one, the transition goes from high to low. When coded in binary for our purposes, the high portion of the bit is translated as a one and the low portion is translated as a zero. Thus, every Manchester Coded bit is translated as two binary bits. The data rate is two times faster in binary than in the Manchester Coding. The following example shows how to do the conversion:
Amplitude -50 dBm
Frequency 433.92 MHz
Application Switch Signal Generator
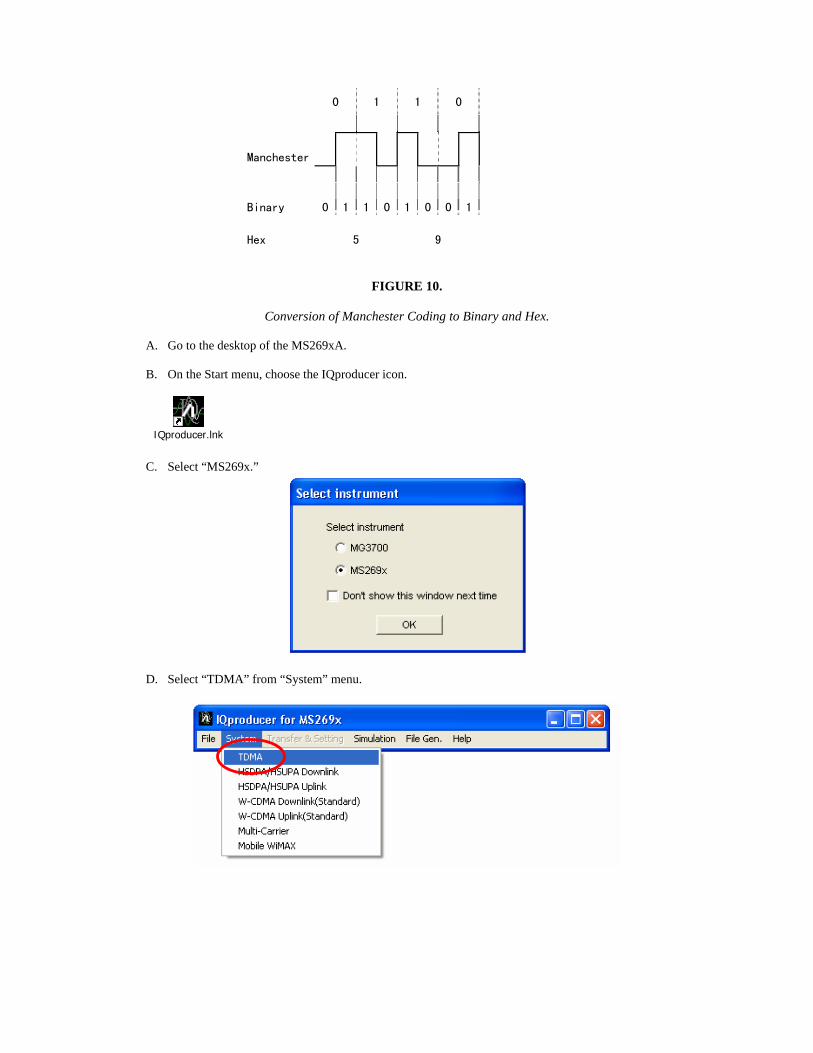
0 1 1 0
Manchester
Binary 0 1 1 0 1 0 0 1
Hex 5 9
FIGURE 10.
Conversion of Manchester Coding to Binary and Hex.
A. Go to the desktop of the MS269xA. B. On the Start menu, choose the IQproducer icon.
IQproducer.lnk C. Select “MS269x.”
D. Select “TDMA” from “System” menu.
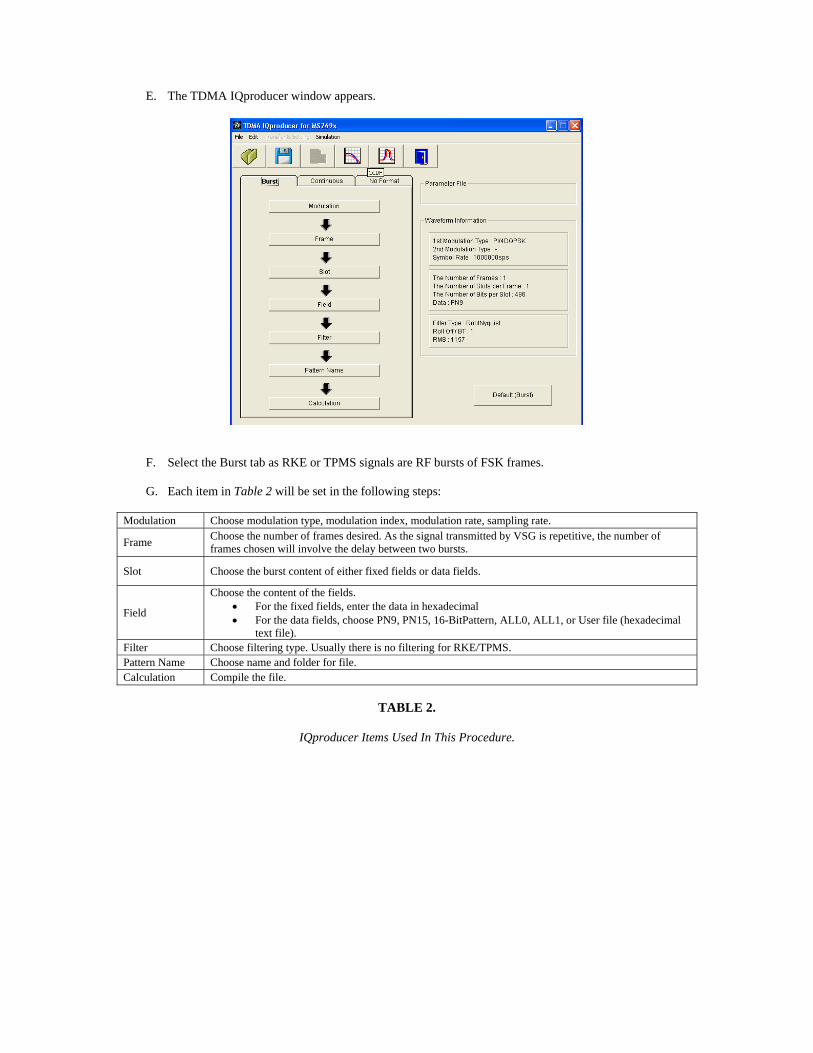
E. The TDMA IQproducer window appears.
F. Select the Burst tab as RKE or TPMS signals are RF bursts of FSK frames. G. Each item in Table 2 will be set in the following steps:
Modulation Choose modulation type, modulation index, modulation rate, sampling rate.
Frame Choose the number of frames desired. As the signal transmitted by VSG is repetitive, the number of frames chosen will involve the delay between two bursts.
Slot Choose the burst content of either fixed fields or data fields.
Field
Choose the content of the fields. • For the fixed fields, enter the data in hexadecimal • For the data fields, choose PN9, PN15, 16-BitPattern, ALL0, ALL1, or User file (hexadecimal
text file). Filter Choose filtering type. Usually there is no filtering for RKE/TPMS. Pattern Name Choose name and folder for file. Calculation Compile the file.
TABLE 2.
IQproducer Items Used In This Procedure.
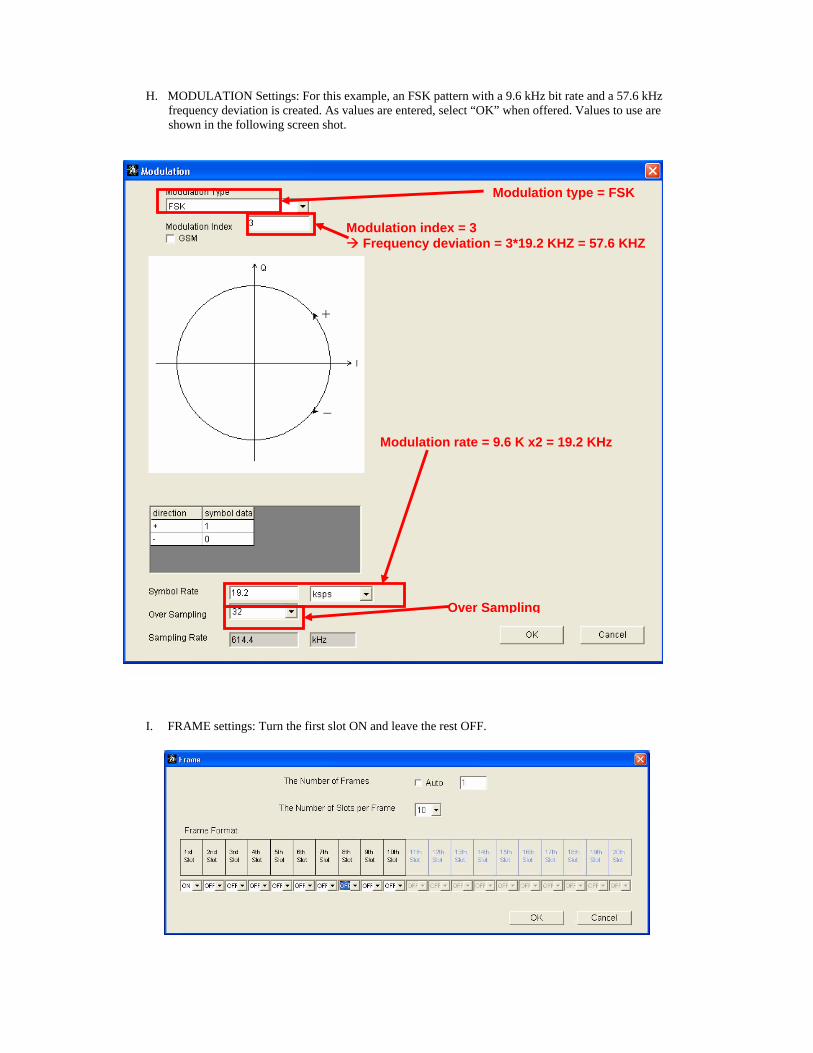
H. MODULATION Settings: For this example, an FSK pattern with a 9.6 kHz bit rate and a 57.6 kHz frequency deviation is created. As values are entered, select “OK” when offered. Values to use are shown in the following screen shot.
I. FRAME settings: Turn the first slot ON and leave the rest OFF.
Modulation type = FSK
Modulation rate = 9.6 K x2 = 19.2 KHz
Modulation index = 3 Frequency deviation = 3*19.2 KHZ = 57.6 KHZ
Over Sampling

J. SLOT settings: Field 1: Guard = 0 Field 2: Ramp = 1 bit (Required) Field 3 and 4 Fixed = 128 bits Field 5: Fixed = 8 bits Field 6: Data = 1024 bits Field 7: Fixed = 8 bits
K. FIELD settings: Field 2 and 3 will contain 00000… in Manchester coding which will be coded at
55555… in hex. Field 4 contains 8 bits for synchronization before the data. Field 6 contains 8 bits to indicate the end of the message. The data filed contains 1024 bits of PN9 data.
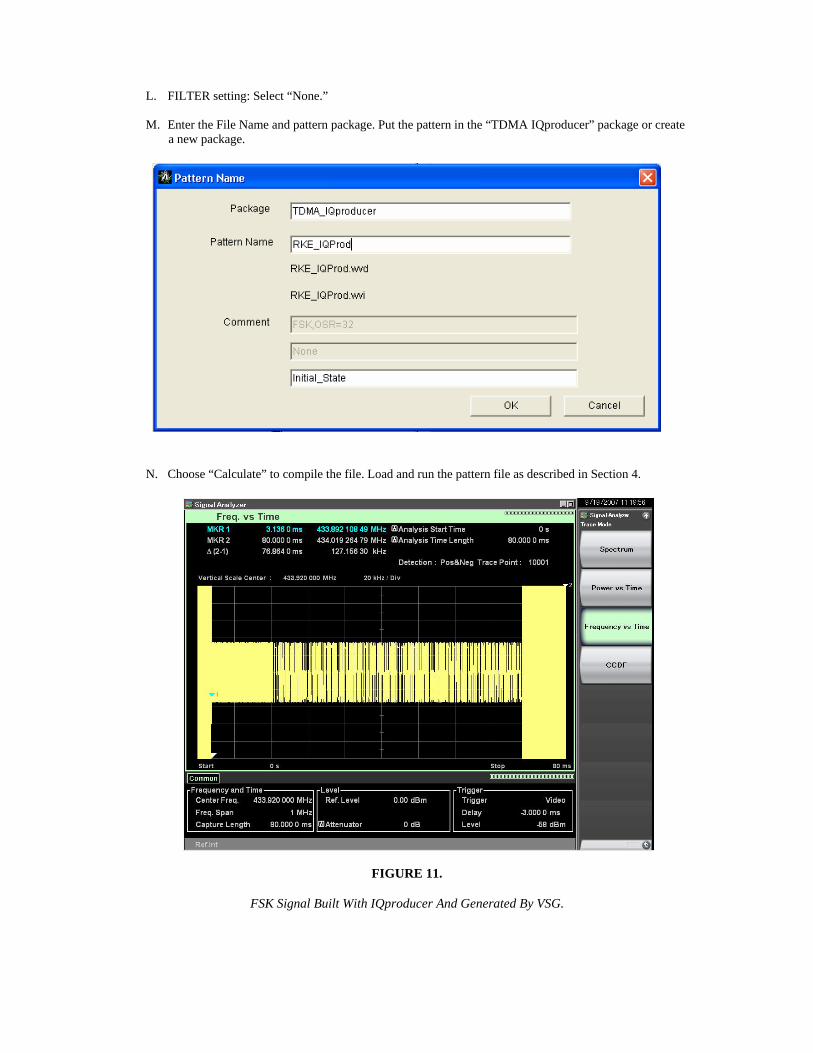
L. FILTER setting: Select “None.” M. Enter the File Name and pattern package. Put the pattern in the “TDMA IQproducer” package or create
a new package.
N. Choose “Calculate” to compile the file. Load and run the pattern file as described in Section 4.
FIGURE 11.
FSK Signal Built With IQproducer And Generated By VSG.

6. MAKE BER MEASUREMENT. The MS269xA includes a bit error rate tester. Connect the data and
clock outputs of the receiver to the connectors at the rear of the MS269xA and activate the BER application. The bit error rate is then computed on the Data patterns.
Conclusion
This application note provides directions for measuring Remote Keyless Entry (RKE) and Tire Pressure Monitoring Systems (TPS) with MS269xA and outlines the procedures necessary for these measurements. The MS269xA is useful for measuring automotive applications such as RKE and TPMS because of its combined Spectrum Analyzer, Signal Analyzer and Digitize Functions. As a Spectrum Analyzer, the MS269xA demonstrates world-class dynamic range and total level accuracy. When in Signal Analyzer mode, it features analysis bandwidths up to 125 MHz and fast FFT measurements. The standard Digitizer features 128M sample memory, which is capable of capturing an entire 125 MHz bandwidth. It can capture any waveform. The maximum capture time varies according to the frequency span.
©Anritsu RKE/TPMS Measurement MS269xA Applications_2008-0409