application, direct testimony and exhibits ofvirginia ... · application, direct testimony and...
TRANSCRIPT

Application, DirectTestimony and Exhibitsof Virginia Electricand Power Company
Before the State CorporationCommission of Virginia
Application of Virginia Electricand Power Company to revise itsfuel factor pursuant to Va. Code§ 56-249.6
Case No. PUE-2015-00022
Filed: February 27, 2015
PUBLIC VERSION

DIRECT TESTIMONY AND EXHIBITS
OF
STEVEN A. ROGERS
ROBERT G. THOMAS
GLENN A. KELLY
GREGORY A. WORKMAN
TOM A. BROOKMIRE
ALAN L. MEEKINS
JOHN C. INGRAM
EDWARD J. ANDERSON


COMMONWEALTH OF VIRGINIA
STATE CORPORATION COMMISSION
APPLICATION OF ))
VIRGINIA ELECTRIC AND POWER COMPANY ))
To revise its fuel factor pursuant to Va. Code )§ 56-249.6 )
Case No. PUE-2015-00022
APPLICATION AND REQUEST FOR PARTIAL WAIVER
Pursuant to § 56-249.6 of the Code of Virginia ("Va. Code"), Virginia Electric and Power
Company ("Dominion Virginia Power" or the "Company"), by counsel, files this Application to
revise its fuel factor effective April 1, 2015 ("Application"). In support of its Application,
Dominion Virginia Power respectfully states the following;
1. Dominion Virginia Power is a public service corporation organized under the
laws of the Commonwealth of Virginia furnishing electric service to the public within its
certificated service territory. The Company also supplies electric service to nonjurisdictional
customers in Virginia and to the public in portions of North Carolina. Dominion Virginia
Power's electric system, consisting of facilities for generation, transmission and distribution of
electric energy, as well as associated facilities, is interconnected with the electric systems of
neighboring utilities and is part of the interconnected network of electric systems serving the
continental United States. By reason of its operations in Virginia and North Carolina and its
interconnections with other electric utilities, the Company engages in interstate commerce. The
post office address of Dominion Virginia Power is P.O. Box 26666, Richmond, Virginia 23261.
2. The facts supporting this Application are set forth in the accompanying testimony
and exhibits of Steven A. Rogers, Robert G. Thomas, Glenn A. Kelly, Gregory A. Workman,
Tom A. Brookmire, Alan L. Meekins, John C. Ingram, and Edward J. Anderson.

3. The testimony and exhibits demonstrate that a revision to Dominion Virginia
Power's existing fuel factor rate is necessary to provide the Company with the appropriate level
of fuel cost recovery pursuant to Va. Code § 56-249.6 over the period beginning April 1, 2015
through June 30, 2016.
4. Dominion Virginia Power is requesting in this Application a total fuel factor of
2.406 cents per kilowatt-hour ("¢/kWh"), which represents a 0.612¢/kWh decrease from the total
fuel factor currently in effect of3.018¢/kWh, and results in a fuel revenue decrease of
approximately $512.3 million when applied to the projected current period kWh sales over the
period April 1,2015 - June 30, 2016.
5. The Company is requesting that the Commission implement the proposed fuel
rate reduction effective for usage on and after April 1, 2015, on an interim basis, with such
further proceedings in this docket after that time as the Commission deems appropriate,
consistent with the directives of Senate Bill 1349, which was recently enacted by the General
Assembly of Virginia during its 2015 Regular Session and signed into law by Governor
McAuliffe on February 24, 2015 ("Senate Bill 1349" or the "Legislation").' Under the
Legislation, the Company is required to forgo recovery of 50% of the Company's prior period
deferred fuel expense recovery balance on its books and records as of December 31, 2014 - or
approximately $85 million - from customers. In addition, the Legislation directs the
Commission to implement reductions in the Company's fuel factor rate "as soon as practicable"
to reflect this non-recovery, as well as any reduction in the fuel factor associated with the
Company's current period forecasted fuel expense over-recovery for the 2014-2015 fuel year,
and the projected fuel expense for the 2015-2016 fuel year. To facilitate the accelerated
implementation of a fuel rate reduction, the Company is filing its Application, testimony and
12015 Virginia Acts of Assembly, Ch. 6, Enactment Clause 2 (approved February 24, 2015; effective July 1,2015).
2

schedules supporting a revision to the fuel factor approximately two months ahead of the typical
early May filing date, and requests that the Commission implement the lower fuel rate, on an
interim basis, for the fifteen-month period commencing April 1, 2015 and ending June 30, 2016.
6. The Company's total fuel factor, reflected in Fuel Charge Rider A, consists of
both a current and prior period factor. As discussed by Company Witness Anderson, for the July
1,2015 through June 30, 2016 fuel year (the "current period"), the Company projects Virginia
jurisdictional fuel expenses, including purchased power expenses, of approximately $1.6 billion,
resulting in a current period fuel factor rate of2.374¢/kWh. Fuel Charge Rider A's prior period
fuel factor rate of 0.032¢/kWh is designed to recover approximately $21.9 million, which
represents the net of two projected June 30, 2015 fuel deferral balances. The first balance is the
projected June 30, 2015 over-recovery balance of approximately $24.0 million associated with
recovery of the July 2014 through June 2015 period expense. The second balance is the
projected June 30, 2015 under-recovery balance of approximately $45.9 million associated with
recovery of the remaining portion of the January 31, 2015 prior period expense to be recovered
through June 30, 2015. This prior period factor also reflects the 50% reduction to the deferral
balance as of December 31, 2014 of approximately $85 million, as discussed by Company
Witness Ingram.t
7. In connection with this Application, the Company is also proposing a
modification to the Commission's Definitional Framework of Fuel Expenses for Virginia
Electric and Power Company, as described in the accompanying testimony and exhibits of
Company Witnesses Rogers and Ingram.
8. Rule 80.A of the Commission's Rules Governing Utility Rate Applications and
2 As Company Witness Anderson explains, this is a savings to customers of $0.00 102/kWh per month, or$1.02/MWh, based on projected sales for the period April 2015 - June 2016.
3

Annual Informational Filings ("Rate Case Rules"), 20 VAC 50-201-80.A, requires that "[i]n the
event that an electric utility files an application to change the fuel factor, fuel factor projections
shall be filed at least six weeks prior to the proposed effective date."
9. As noted, the Company's annual application to revise its fuel factor is typically
filed with the Commission around May 1 of each year, with a requested implementation date of
July 1. Given the directive of Senate Bill 1349 to implement a fuel rate reduction "as soon as
practicable," the Company is filing its Application to change its fuel factor approximately two
months ahead of the typical filing date and is requesting the lower fuel rate be implemented for
usage on and after April 1,2015, on an interim basis, with such further proceedings in this
docket following that time which the Commission deems appropriate. Under this accelerated
schedule, the Company's fuel factor projections are being filed approximately four weeks prior
to the proposed effective date, rather than six weeks prior as prescribed by Rule 80.A.
10. Rule 10.E of the Rate Case Rules, 20 VAC 5-201-10.E, provides the Commission
with the discretion to "waive any or all parts of this chapter for good cause shown." For these
reasons and for good cause shown, the Company requests that the Commission grant a partial
waiver of the requirements of Rule 80.A and permit a shortened period between the filing of the
fuel factor projections and the proposed effective date of the fuel factor change.
WHEREFORE, Dominion Virginia Power respectfully files the proposed fuel factor of
2.406¢/kWh, as set out herein, on an interim basis, effective for usage on and after April 1,2015,
and requests the Commission grant the Company a partial waiver of Rule 80.A.
4

Respectfully submitted,
VIRGINIA ELECTRIC AND POWER COMPANY
By:_.:::::::.:::::::=====-=-~+::::::::===-__Counsel
William H. Baxter IIDominion Resources Services, Inc.120 Tredegar Street, Riverside 2Richmond, Virginia 23219(804) 819-2458 (telephone)(804) 819-2183 (facsimile)william. [email protected]
Joseph K. Reid, IIIElaine S. RyanMcGuireWoods LLPOne James Center901 E. Cary StreetRichmond, Virginia 23219(804) 775-1198 (JKR telephone)(804) 775-1090 (ESR telephone)(804) 698-2146 (facsimile)[email protected]@mcguirewoods.com
Counselfor Virginia Electric and Power Company
February 27, 2015
5

AIo(j)mAIen

1 Q.
2 A.
3
4
5
6 Q.
7
8 A.
9
10
11 Q.
12 A.
13
14
15
16
17
18
DIRECT TESTIMONYOF
STEVEN A. ROGERSON BEHALF OF
VIRGINIA ELECTRIC AND POWER COMPANYBEFORE THE
STATE CORPORATION COMMISSION OF VIRGINIACASE NO. PUE-2015-00022
Please state your name, business address, and position of employment.
My name is Steven A. Rogers and my business address is 120 Tredegar Street,
Richmond, Virginia 23219. I am Senior Vice President - Financial Management for
Dominion Generation. A statement of my background and qualifications is attached as
Appendix A.
What are your management responsibilities with respect to Virginia Electric and
Power Company ("Dominion Virginia Power" or the "Company")?
I am responsible for the financial management of Dominion's generating business. This
includes responsibility for financial analysis, forecasting and budgeting functions, fuel
procurement, and generation system planning.
What is the purpose of your testimony in this proceeding?
I will describe the calculation of fuel costs that are recoverable by the Company over the
period beginning April 1, 2015 through June 30, 2016 and briefly discuss the elements
that are responsible for the significant decrease in the Company's fuel factor rate. In
addition, I will address the Company's request to implement the proposed fuel rate
reduction on April 1, 2015, on an interim basis, consistent with the directives of Senate
Bill 1349, which was recently enacted by the General Assembly of Virginia during its
2015 Regular Session and signed into law by Governor McAuliffe on February 24, 2015

1
2
3
4 Q.
5
6 A.
7
8
9
10
11
12
13
14
15
16
17
18
19
20
21
22
("Senate Bill 1349" or "the legislation"). I My testimony also discusses certain
operational performance metrics and our ongoing initiatives to reduce fuel costs on behalf
of our customers.
You mentioned Senate Bill 1349. How does this legislation impact the Company's
2015 fuel factor proceeding?
Two key elements of the legislation are relevant to this proceeding. First, the legislation
requires that 50% of the Company's prior period deferred fuel expense recovery balance
on its books and records as of December 31, 2014 - representing approximately $85
million - not be recovered from customers. In addition, the legislation directs the State
Corporation Commission of Virginia ("Commission") to implement reductions in the
Company's fuel factor rate "as soon as practicable" to reflect this non-recovery, as well
as any reduction in the fuel factor associated with the Company's current period
forecasted fuel expense over-recovery for the 2014-2015 fuel year, and the projected fuel
expense for the 2015-2016 fuel year. These three components contribute to a significant
fuel rate reduction for the benefit of our customers.
To facilitate the accelerated implementation of a fuel rate reduction, the Company is
filing its application, testimony and schedules supporting a revision to the fuel factor
approximately two months ahead of the typical early May filing date, and requests that
the Commission implement the lower fuel rate, on an interim basis, effective for usage on
and after April 1, 2015. Given the General Assembly's directive, the Company has
calculated a fuel factor rate which combines the effect of the three components described
above and which would remain in effect, with Commission approval, for the fifteen-
12015 Virginia Acts of Assembly, Ch. 6, Enactment Clause 2 (approved February 24,2015; effective July 1,2015).
2

2
3
4 Q.
5 A.
6
7
8
9
10
11
12
13
14
15
16
17
18
19
20
21
22
month period commencing April 1, 2015 and ending June 30, 2016, thereby accelerating
the rate reduction and avoiding any volatility in the fuel rate which might be associated
with a second change on the typical implementation date of July 1.
What fuel factor does the Company propose in this case?
The Company is proposing a fuel rate reduction of approximately 20% from the 3.018
¢/kWh rate previously approved by this Commission in Case No. PUE-2014-00033 (the
"2014 Fuel Factor").
The proposed Virginia jurisdictional fuel rate is comprised of two elements. First, for the
July 1,2015 through June 30, 2016 fuel year (the "current period"), the Company
projects Virginia jurisdictional fuel expenses, including purchased power expenses, of
approximately $1.6 billion, translating into a current period fuel factor rate of
2.374¢/kWh, as Company Witness Edward J. Anderson discusses. Second, the
Company's projected June 30, 2015 fuel deferral balance (the "prior period") is
approximately $21.9 million, representing the net of the projected June 30, 2015 over
recovery of expenses during the July 1,2014 - June 30, 2015 fuel period, and the
projected June 30, 2015 under-recovery of expenses associated with the remaining
January 31, 2015 prior period expense, resulting in a prior period factor of 0.032¢/kWho
This prior period factor also reflects a 50% reduction to the deferral balance as of
December 31, 2014 of approximately $85 million as discussed by Company Witness John
C. Ingram. Together, these components translate into a total proposed fuel factor rate of
2.406¢/kWh for the period April 1,2015 - June 30, 2016, as Company Witness Anderson
explains.
3

1
2
3
4
5 Q.
6
7 A.
8
9
10
11
12
13
14
15
16
17
18
19
20
21
22
As Company Witness Anderson also details in his testimony, this fuel rate reduction will
result in a decrease to the typical residential customer's monthly electric bill of
approximately $6.12. For our higher volume energy consumers in the commercial and
industrial classes, the savings will be significantly higher.
What are the major factors underlying the Company's ability to reduce the fuel
factor rate in this proceeding?
The over-recovery during the 2014-2015 fuel year was driven principally by lower than
expected commodity and power prices, particularly those for natural gas, as well as
milder than normal weather in the summer and fall. In addition, our investment in
highly-efficient generation resources like the Bear Garden Power Station and the new
Warren County Power Station ("Warren") have strengthened our fuel diversity and
allowed us to leverage these low gas prices for the benefit of customers. These trends
helped to reduce our fuel costs in the 2014-2015 fuel year, and are projected to continue
during the 2015-2016 fuel year.
The significant decline in natural gas prices compared to forecast is addressed on page 10
of Company Witness Kelly's testimony. Natural gas prices have dropped as much as
38% since last year's filing, from a forecasted $5.03 per one million British thermal units
("MMBtu") for the July 2014 - June 2015 fuel year to $3. 12/MMBtu through January
2015, as Mr. Kelly's testimony demonstrates.
Company Witness Kelly's testimony also illustrates the significant decline in power
prices, which correlate to low gas costs when gas units drive the marginal pricing in the
PJM Interconnection, L.L.C. ("PJM") marketplace. He shows that on-peak power prices
4

1
2 Q.
3 A.
4
5
6
7
8
9
10
11 Q.
12
13 A.
14
15
16
17
18
19
20 Q.
21
22 A.
for the PJM Western Hub have fallen by 20% since last year's filing.
Are there any changes in generation capacity during this upcoming fuel year?
Yes, the Brunswick County Power Station ("Brunswick"), a 1,358 MW (nominal)
natural-gas fired combined-cycle generation facility, is expected to become operational in
May 2016. Employing state-of-the-art 3xl gas combined-cycle technology, Brunswick
will further strengthen the mix of fuels and generation resources now available to the
Company and enhance our existing operational efficiencies to the benefit of our
customers. Like Warren, the facility's heat rate will be among the best in the nation when
it enters service, resulting in reduced fuel costs and lower emissions. Possum Point Unit
6, a combined-cycle 559 MW unit, will be uprated by 27 MW in May 2015.
While not directly at issue in this proceeding, how is the Company's generation fuel
mix expected to change over the next several years?
As discussed in the Company's Fuel Procurement Strategy Report ("Report") filed on
January 30, 2015 in the 2014 Fuel Factor, the Company's natural gas-fired units now
provide baseload, intermediate, and peaking services, and in 2014 met approximately
15% of the Company's annual energy requirements. By 2019, the natural gas percentage
of energy production is expected to increase to as much as 40%, with corresponding
decreases in the percentage of system energy derived from coal and purchased power, as
new, efficient gas-fired generation resources like Brunswick come on-line.
How does this increase in natural gas as a percentage of system energy impact the
Company's gas procurement strategy?
The Company's approach to natural gas procurement continues to involve two primary
5

2
3
4
5
6
7
8
9
10
11
12
13 Q.
14 A.
15
16
17
18
19
20
21
22
23
goals: (1) ensuring adequate supply to provide reliable and cost-effective service, and (2)
reasonably mitigating price volatility for customers. As discussed in the Report, in order
to support the growing need for physical supplies of natural gas, the Company believes
that it is prudent to modify its existing gas procurement practices to include more firm
transportation agreements sourced from diverse locations and longer-term (terms greater
than day ahead or intra-day) gas supply contracts as compared to our current approach
(day ahead or intra-day). Using a greater percentage of longer-term natural gas supply
arrangements sourced directly from diverse locations will promote greater certainty of
supply. This longer-term gas procurement approach is also consistent with the
Company's multiyear contracting approach for procuring coal supplies. Additionally, the
Company will continue to use financial hedging instruments to mitigate price volatility
for this historically volatile commodity.
Does the Company intend to make any changes to its price hedging practices?
Yes. Given the projected increase in the volume of natural gas purchases over the next
several years, the Company plans to expand its forward price hedging activity from one
year to three years. In addition, the Company intends to increase price hedging levels to a
target range of 20% to 50% of forecasted volumes to be purchased in the first year of a
three-year period. These new natural gas price hedging targets are expected to be
achieved via the pricing associated with the gas supply and transportation procurement
activities described above, as well as the continued use of derivative instruments to
financially hedge a portion of these volumes.
The Company's forecasted energy requirements and fuel expense for the 2015-2016 fuel
year presented by Company Witness Kelly reflect a movement toward these new targets,
6

1
2
3
4
5 Q.
6
7
8 A.
9
10
11
12
13
14
15
16
17
18
19
20
21
22
23
which are addressed in more detail in the Report. The Company also anticipates that
purchased power volumes will gradually decrease, but we will continue to use derivative
instruments to financially hedge a portion of these volumes when such instruments are
available and beneficial for our customers.
Is the Company proposing any changes in this proceeding to its Definitional
Framework of Fuel Expenses (the "Definitional Framework") in connection with
these plans?
Yes. As Company Witness Ingram notes, in order to support the expansion of its
financial hedging activities, the Company is proposing to add a new Paragraph (d) to the
existing Definitional Framework to explicitly reaffirm that gains and losses, including
option premiums, arising from the use of derivative instruments to financially hedge fuel
and purchased power are recoverable through the Company's fuel factor. The proposed
change is shown in Company Exhibit No. _, lCI, Schedule 4.
As Company Witness Ingram explains, it is possible that derivatives employed in future
financial hedging transactions for natural gas and purchased power may not meet or
maintain the strict requirements for "hedge accounting treatment." These types of
transactions, referred to as "economic hedges," are undertaken with the objective of
promoting rate stability and mitigating price volatility for customers under the
Company's hedging program. To accommodate these circumstances, the Company
believes that a modification to the text of the Definitional Framework to explicitly
reaffirm that gains and losses, including option premiums, arising from the use of
derivative instruments are recoverable through the fuel factor, regardless of whether they
qualify for "hedge accounting treatment," is necessary and appropriate. These
7

1
2
3
4
5
6
7 Q.
8
9
10 A.
11
12
13 Q.
14
15 A.
16
17
18
19
20
21
22
23
transactions provide an important tool and this change would allow for these activities to
continue to provide benefits for our customers in the future, particularly as the Company
moves toward the new price hedging targets for gas. Importantly though, as Company
Witness Ingram explains, the Company will not seek to recover through the fuel factor
any costs arising from the use of derivative instruments that are currently recovered
through base rates.
As measured by Equivalent Forced Outage Rate on demand ("EFORd"), how did
the Company's generation fleet perform in 2014 compared to that of other units
within PJM?
For the period January through September 2014, the Company had a fleet EFORd of
3.24%, which compares very favorably to the PJM pool-wide average of9.7% over the
same period.
In closing, can you summarize the key aspects of the Company's generation, fuel
procurement, and purchased power acquisition practices?
Yes. The Company employs a comprehensive strategy to meet our customers' needs and
demands for power at the lowest reasonable cost utilizing its diverse mix of reliable,
efficient self-generation and non-utility generation resources as well as economy
purchases from the wholesale power markets. The Company will continue to act
prudently in its fuel procurement practices to minimize costs for the coal, oil, natural gas,
wood and nuclear fuel that we must purchase to run our power plants. We will also
continue to buy in the PJM spot energy market when doing so is cost-advantageous
relative to the costs of self-generation. Company Witness Alan L. Meekins discusses the
savings that access to these markets provided for our customers in 2014.
8

1
2
3
4
5
6
7
8
9
10
11
12
13
14
15
16
17
18
19
20 Q.
21 A.
22
Fuel costs are a significant component of overall rates for all classes of our customers,
and they are influenced in many respects by conditions that are external to the Company
and beyond its control - including extreme weather and market price fluctuations. The
availability of a diverse fleet of generation assets, using a variety of fuels and
technologies, is a primary tool in protecting our customers from the effects of commodity
price volatility, commodity delivery disruptions, and other external factors. The addition
of new, efficient resources such as Warren and Brunswick will enhance these efforts for
the benefit of customers.
Ensuring reliable and sufficient access to fuel supply and transport is another significant
component of the Company's fuel procurement strategy. To achieve this objective with
respect to natural gas, the Company follows a disciplined protocol of purchasing both
supply and transport from a diverse portfolio of suppliers and supply regions, with
various contract terms and prices.
As noted, uncertainty in future commodity prices exposes the Company and its customers
to unpredictable changes in fuel costs. To help mitigate this risk, the Company also
transacts physical and financial instruments in the marketplace to hedge against potential
fuel price changes in the future. Together, these three components of the Company's
comprehensive fuel procurement strategy help to ensure that fuel costs remain as
reasonable as possible for our customers, both now and in the future.
What Company witnesses are filing testimony in this case?
The Company is presenting the following additional witnesses, several of whom I have
already mentioned in my testimony:
9

123
456
78
91011
121314
15161718
192021
22 Q.
23 A.
III Mr. Robert G. Thomas, Director of Energy Market Analysis and IntegratedResource Planning, discusses the development of the projected commodity pricesfor fossil fuels, emissions allowances, and PJM economy power purchases;
III Mr. Glenn A. Kelly, Director of Generation System Planning, providesinformation on the forecast of the current period fuel costs, as well as themethodology and models used to project total system energy and fuel costs;
III Mr. Gregory A. Workman, Director of Fuels, discusses the Company's fossil fuelprocurement practices;
III Mr. Tom A. Brookmire, Supervisor of Nuclear Fuel Procurement, discusses thecomponents of the Company's nuclear fuel cost and the Company's projectednuclear fuel expense rate;
III Mr. Alan L. Meekins, Director of Electric Market Operations, explains theCompany's interface with PJM, as well as customer savings realized from PJMeconomy energy purchases;
III Mr. John C. Ingram, Director of Generation Accounting, presents the prior periodaccounting balances for the Company's proposed fuel factor, the proposed changeto the Company's Definitional Framework, an update on the status of theCompany's judgment against the DOE, and other accounting-related matters; and
III Mr. Edward J. Anderson, Regulatory Advisor, presents the calculations of thecurrent period and prior period components for the Company's proposed fuelfactor, along with the impact on typical customer bills.
Does this conclude your pre-filed direct testimony?
Yes, it does.
10

APPENDIX A
BACKGROUND AND QUALIFICATIONSOF
STEVEN A. ROGERS
Steven A. Rogers graduated from the College of the Holy Cross with a degree in
Economics/Accounting and started his career with the accounting firm Deloitte. He is currently
Senior Vice President - Financial Management, Dominion Generation. In this role, he is
responsible for financial analysis, forecasting, budgeting functions, fuel procurement, and
generation system planning.
Mr. Rogers joined Dominion in 1996 as manager-Internal Audit and has held controller
positions with several Dominion companies. He was named vice president and controller of
Dominion Resources Inc. in June 2000 and promoted to senior vice president and controller in
April 2006. He became senior vice president and chief accounting officer in January 2007.
In October, 2007, Mr. Rogers was named president and chief administrative officer of
Dominion Resources Services Inc. He became senior vice president and chief information
Officer in January 2013, and assumed his current post in January 2014.
From 2006 to 2009, Mr. Rogers was a member of the Financial Accounting Standards
Advisory Council - an advisory body to the Financial Accounting Standards Board. He has
served with several industry groups while in his accounting and Information Technology roles.
In the Richmond community, he serves on the board of directors of CenterStage Foundation,
serves as Treasurer of the Library of Virginia Foundation Board, and as Treasurer of MSR2020.
Mr. Rogers has previously testified before the State Corporation Commission of
Virginia.

-I:I:o:s:»en

1 Q.
2 A.
3
4
5
6
7
8
9 Q.
10 A.
11
12 Q.
13 A.
14
15
16 Q.
17 A.
18
DIRECT TESTIMONYOF
ROBERT G. THOMASON BEHALF OF
VIRGINIA ELECTRIC AND POWER COMPANYBEFORE THE
STATE CORPORATION COMMISSION OF VIRGINIACASE NO. PUE-2015-00022
Please state your name, business address, and position of employment.
My name is Robert G. Thomas and my business address is 120 Tredegar Street,
Richmond, Virginia 23219. I am the Director of Energy Market Analysis and Integrated
Resource Planning in the Budgeting, Business Planning & Market Analysis Department.
In my current position, I am responsible for various analytic activities, including the
development of commodity price projections used by Virginia Electric and Power
Company ("Dominion Virginia Power" or the "Company"). A statement of my
background and qualifications is attached as Appendix A.
What is the purpose of your testimony in this proceeding?
My testimony will explain the sources and development of the commodity price
projections used to support the Company's fuel expense projections.
During the course of your testimony, will you introduce an exhibit?
Yes. Company Exhibit No. _, RGT, consisting of Schedules 1 through 3, was prepared
under my supervision and direction, and is accurate and complete to the best of my
knowledge and belief.
Please describe the Company's overall process for projecting commodity prices.
Commodity price projections are compiled from market data sources for the Company's
planning horizon. The availability and transparency of forward commodity markets over

1
2
3
4
5
6
7 Q.
8
9 A.
10
11
12
13 Q.
14
15 A.
16
17
18
19
20
21 Q.
22 A.
the last several years have eliminated the need to produce forecasts for short-term time
horizons. Each month, a comprehensive set of market-based projected commodity prices
for natural gas, gas basis, crude oil, No.6 fuel oil, No.2 fuel oil, Central and Northern
Appalachian coal, emissions allowance costs, and power is compiled. Schedule 1 shows
prices as of January 31, 2015 for the fuel factor period beginning April 1, 2015 through
June 30, 2016.
Please describe the source data and method for developing the natural gas price
projections.
Natural gas price projections are based on New York Mercantile Exchange Clearport
("NYMEX") Henry Hub futures prices. Henry Hub, located in Louisiana, is a pooling
point of several pipelines from various supply regions in the Gulf of Mexico. Henry Hub
is widely used throughout the industry as a benchmark for natural gas prices.
Please describe the source data and method for developing the natural gas basis
price projections.
Natural gas basis price projections are based on Intercontinental Exchange ("ICE")
futures prices and Platts postings. Natural gas for the Company's fleet is primarily
purchased at several different market points: Transco Zone 5 and Zone 6 Non-New York
("NNY"), TCO Pool (Columbia Gas Transmission), and Dominion South Point. Gas
basis at Transco Zone 6NNY, Dominion South Point, and TCO Pool are all traded on
ICE. Gas basis at Transco Zone 5 is based on Platts postings.
Please describe the source data and method for developing oil price projections.
Projections for crude oil and No.2 fuel oil are based on NYMEX Clearport futures
2

1
2
3
4
5
6
7
8
9
10 Q.
11 A.
12
13
14
15
16
17
18
19
20
21 Q.
22
23 A.
products. West Texas Intermediate ("WTI") crude oil is a light sweet product delivered
to Cushing, Oklahoma that is priced in terms of $/barrel. This forward contract is a
widely used benchmark throughout the industry. For No.2 fuel oil, futures contracts
with a delivery point at New York Harbor are used. Prices are stated in $/gallon, and
converted to $/MMBtu using a conversion factor of 7.2 gallons/MMBtu. Because there
is no No.6 fuel oil product traded on NYMEX, a commonly used broker source, A.E.
Bruggemann & Co. Energy Brokers, is employed. The product is defined as 1% sulfur
residual oil (quoted in $/bbl), and then converted to $/MMBtu by dividing the quote by a
6.3 MMBtu/bbl conversion factor.
Please describe the source data and method for developing coal price projections.
For projection purposes, three distinct product prices based on market quotes are
compiled. Specifically, coal price data are obtained from United Power, a division of
ICAP United, Inc., which is the primary source for coal pricing in the industry. The first
product quote is a Central Appalachian coal with a 12,500 Btu/lb heating value and 1.6
Ib/MMBtu sulfur dioxide (S02) content obtained using the CSX Corporation railway
system. The second product quote has the same specifications, but is delivered using the
Norfolk Southern Corporation railway system. The final product quote is a Northern
Appalachian coal with a 13,000 Btu/lb heating value and 3.8-4.2Ib/MMBtu S02 content.
All three of these coals have the potential to be burned in the Company's generating units
depending upon commodity and transportation pricing, and specific unit characteristics.
Please describe the source data and method for developing emissions price
projections.
On October 23,2014, the U.S. Court of Appeals for the D.C. Circuit lifted the stay on the
3
1
2
3
4
5
6
7
8
9
10
11
12
13
14
15
16
17 Q.
18
19
20 A.
21
22
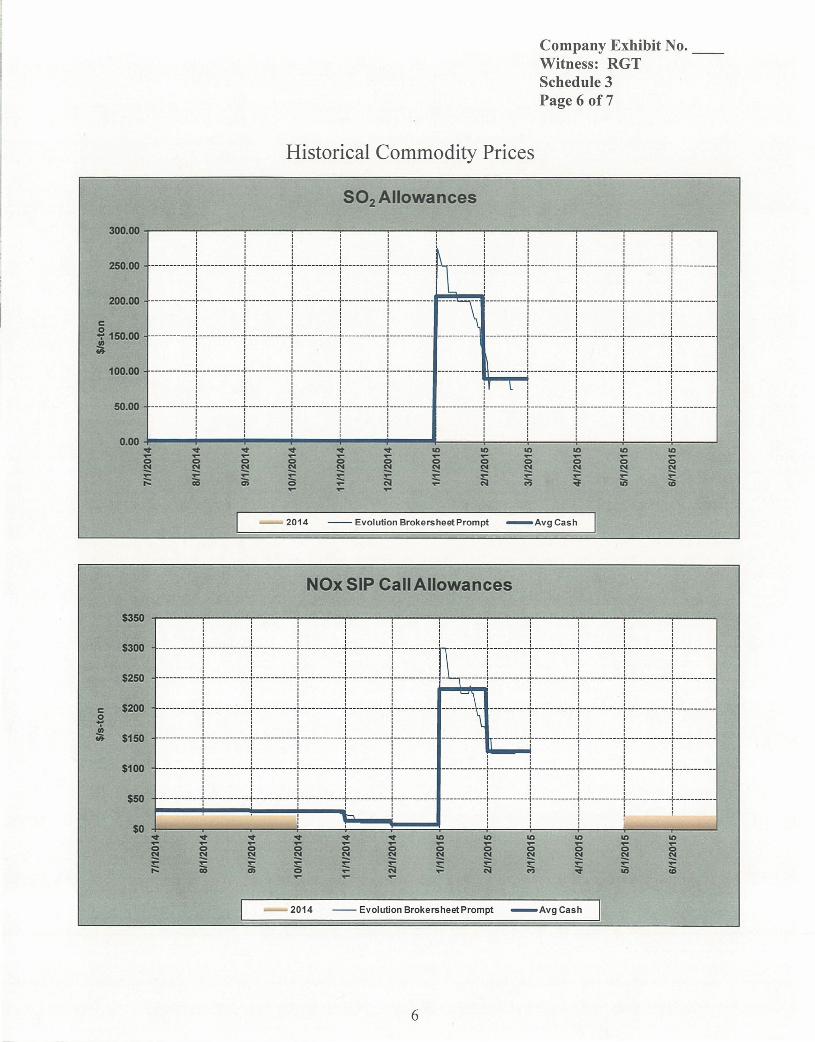
Cross State Air Pollution Rule ("CSAPR"), allowing implementation of Phase 1 on
January 1,2015. CSAPR replaces the Clean Air Interstate Rule ("CAIR"). CSAPR
requires states to improve air quality by limiting power plant emissions that cross state
lines. The rule covers 23 states, requiring reductions in both nitrogen oxide ("NOx") and
sulfur dioxide ("S02") emissions. States in Group 1 (including Virginia) will be required
to make additional reductions to S02 emissions when Phase 2 is implemented in 2017.
CSAPR is an emissions allowance-based "cap-and-trade" program. The allowances
originally issued in 2011 for 2012 and 2013 have been re-vintaged for 2015 and 2016.
Under CSAPR, environmental S02 and NOx allowance pricing is obtained from
Evolution Markets, Inc., a commonly used industry source for environmental pricing
data. The price quotes contained in my Schedules are given in dollars per short ton of
S02 or NOx allowances available in the market.
There are two "cap-and-trade" markets for NOx. The first applies throughout the entire
year, and includes the 23 states mandated by CSAPR to reduce emissions, including
Virginia. The second is a seasonal ozone program and applies to 25 states, also including
Virginia. This program creates a five-month ozone season (May-September).
Describe the source data and method for developing power price ($/MWh)
projections, including an explanation and determination of locational power price
differences.
Price projections for the PJM Interconnection, L.L.C. ("PJM") Dominion Zone ("Dom
Zone") region are developed using forward price quotes for the PJM Western Hub
("PJM- W"), along with a locational adjustment to reflect delivery to Dom Zone. This is
4

1
2
3
4
5
6
7 Q.
8
9 A.
10
11
12 Q.
13
14 A.
15
16 Q.
17 A.
necessary because forward PJM Dom Zone quotes are not readily available. The PJM-W
forward price projections are based on ICE-reported forward over-the-counter settlement
prices. The locational difference is based on historical average differentials for both
congestion and losses dating back to February 1,2013 between the PJM-W Hub region
and the PJM Dom Zone delivery point. This locational differential is then applied to the
PJM-W forward market price to develop a proxy for the Dom Zone price.
Please provide a summary of the commodity price sources that are used and
indicate where additional information can be obtained.
This information is shown on Schedule 2. In addition, Schedule 3 provides historical
price information for certain commodity price sources relative to the prior period fuel
factor (July 1,2014 to June 30, 2015) through January 31, 2015.
Please describe any changes in market assumptions between the Company's 2014
Fuel Factor and this year's filing.
The only change is the transition discussed above from the CAIR emissions program to
CSAPR.
Does this conclude your pre-filed direct testimony?
Yes, it does.
5
APPENDIX A
BACKGROUND AND QUALIFICATIONSOF
ROBERT G. THOMAS
Robert G. Thomas received a Bachelor of Science degree in Mining Engineering from the
University of Pittsburgh in 1981, and holds a Master of Materials Science degree from the
University of Virginia in 1988 and a Master of Business Administration from the University of
Richmond in 2000.
Mr. Thomas started his career with the Company in 1981 as an Engineer in the
Procurement Services Department and has held various positions in the Fuel Procurement
Department, the Capacity Acquisition Department, and the Dominion Energy Clearinghouse. He
has also held management positions in the Dominion Energy Clearinghouse and Business
Planning and Market Analysis Department.
Currently, Mr. Thomas is the Director, Energy Market Analysis & Integrated Resource
Planning within the Budgeting, Business Planning and Market Analysis Department. His
responsibilities include energy commodity price forecasting, Dominion Virginia Power load and
sales forecasting, and demand-side and integrated resource planning. He is also a certified Six
Sigma Green Belt.
Mr. Thomas has previously presented testimony before the State Corporation
Commission of Virginia.

Company Exhibit No. __Witness: RGTSchedule 1
Commodity Price Projections
January Outlook CaseCommodity Fuel and Market Price AssumptionsMarket as of 1/31/2015
$/MMBtu $/MMBtu $/MMBtu $/MMBtu $/MMBtu $/bbl $/MMBtu $/bbl $/ton $/ton $/tonZone 6 Transco Coal- Coal- Coal-
NYMEX NNY Zone 5 Dominion TCO Pool #GOil Crude CAPP CAPP NS NAPPYear Month NG Basis' Basis* SP Basis' Basis' (1%S) #2 Oil (WTI) 1.6# 1.6# 3.2#2015 April 2.69 -0.17 0.01 -0.78 -0.11 44.65 12.10 48.99 45.50 48.00 51.752015 May 2.71 -0.31 -0.02 -0.87 -0.12 44.70 12.11 50.07 45.50 48.00 51.752015 June 2.76 -0.58 -0.04 -1.01 -0.16 45.00 12.19 51.22 45.50 48.00 51.752015 July 2.81 -0.38 -0.04 -0.78 -0.19 45.40 12.33 52.37 46.05 48.00 52.002015 August 2.82 -0.49 -0.04 -0.99 -0.23 45.85 12.49 53.44 46.05 48.00 52.002015 September 2.81 -0.73 -0.04 -1.23 -0.27 46.35 12.65 54.40 46.05 48.00 52.002015 October 2.85 -0.69 -0.03 -1.15 -0.25 46.85 12.81 55.25 46.45 48.00 52.252015 Novsmber 2.96 -0.35 0.08 -1.03 -0.27 47.35 12.94 56.03 46.45 48.00 52.252015 December 3.15 0.47 0.81 -1.05 -0.28 47.85 13.07 56.79 46.45 48.00 52.252016 January 3.29 3.72 3.28 -1.09 -0.28 49.00 13.19 57.41 46.85 48.50 53.002016 February 3.29 2.72 2.20 -1.07 -0.25 49.00 13.25 58.00 46.85 48.50 53.002016 March 3.25 -0.53 0.12 -1.04 -0.29 49.00 13.27 58.56 46.85 48.50 53.002016 April 3.14 -0.53 -0.06 -0.99 -0.18 52.02 13.24 59.09 47.40 48.60 53.402016 May 3.15 -0.83 -0.08 -1.14 -0.24 52.02 13.28 59.59 47.40 48.60 53.402016 June 3.19 -0.91 -0.11 -1.24 -0.26 52.02 13.40 60.10 47.40 48.60 53.40
January Outlook CaseCommodity Fuel and Market Price AssumptionsMarket as of 1/31/2015
PJM Western Hub (PJM-W) PJM-W Basis to DOM Zone PJM DOM Zone Emmissions$/MWh $/MWh $/MWh $/MWh $/MWh $/MWh $/MWh $/MWh $/MWh $/ton $/ton
NOx(SIP Call
Year Month 5x16 5x8,2x24 7x24 5x16 5x8,2x24 7x24 5x16 5x8,2x24 7x24 S02 + Annual)
2015 April 37.95 27.15 32.43 1.06 0.65 0.85 39.01 27.80 33.28 175.00 250.002015 May 38.95 25.95 31.54 2.26 0.90 1.49 41.21 26.85 33.03 175.00 425.002015 June 41.50 25.90 33.53 0.86 0.39 0.62 42.36 26.29 34.15 175.00 425.002015 July 55.45 29.45 42.31 0.13 0.62 0.38 55.58 30.07 42.69 175.00 425.002015 August 47.40 27.90 36.71 1.09 1.37 1.24 48.49 29.27 37.95 175.00 425.002015 September 38.10 26.35 31.83 3.17 2.24 2.67 41.27 28.59 34.51 175.00 425.002015 October 36.00 26.20 30.84 1.63 1.37 1.49 37.63 27.57 32.33 175.00 250.002015 Novarnber 36.70 26.85 31.23 0.33 1.21 0.82 37.03 28.06 32.05 175.00 250.002015 December 40.15 30.20 34.91 -0.07 0.81 0.39 40.08 31.01 35.30 175.00 250.002016 January 56.15 44.55 49.54 3.71 7.32 5.76 59.86 51.87 55.30 175.34 250.482016 February 51.85 40.75 46.11 0.83 1.41 1.13 52.68 42.16 47.24 175.67 250.962016 March 41.45 32.40 36.88 4.61 3.07 3.83 46.06 35.47 40.71 176.01 251.452016 April 38.10 30.60 34.10 1.07 0.68 0.86 39.17 31.28 34.96 176.35 251.932016 May 39.35 26.95 32.55 2.27 0.90 1.52 41.62 27.85 34.07 176.69 429.112016 June 41.65 26.30 33.80 0.86 0.39 0.62 42.51 26.69 34.42 177.03 429.93
'Basis is the price differential between Henry Hub and the specific trading point noted. The purchase price for gas at Zone 6 NNY, for example. is equal toHenry Hub NG + Zone 6NNY Basis.

Company Exhibit No. __Witness: RGTSchedule 2Page 1 of3
Commodity Price Data Sources
a. Natural GasSource: New York Mercantile Exchange (NYMEX) ClearportProduct: Natural Gas .Trade Symbol: NGDelivery Point: Henry Hub, LouisianaContract Size: 10,000 MMBtu (million British thermal units)Additional Information: ~~.&!]1.Si;[Ql@.,~n
b. Natural Gas BasisSource: Intercontinental ExchangeProducts: Transco Zone 6NNY, Dominion South Point, TCO Pool BasisTrade Symbol:Delivery Point: Financial onlyContract Size:Additional Information: www.theice.com
Source: PlattsProduct: Transco Zone 5Trade Symbol: NIADelivery Point: Transco Zone 5Contract Size: NIAAdditional Information: www.platts.com/products/m2ms-gas
b. Crude Oil (WTI)Source: New York Mercantile Exchange (NYMEX) ClearportProduct: Light Sweet Crude OilTrade Symbol: CLDelivery Point: Cushing, OklahomaContract Size: 1,000 barrels (42,000 gallons)Additional Information: www.cmegroup.com
c. #2 Fuel OilSource: New York Mercantile Exchange (NYMEX) ClearportProduct: Ultra-Low Sulfur DieselTrade Symbol: LHDelivery Point: New York HarborContract Size: 1,000 barrels (42,000 gallons)Additional Information: www.cmegroup.com
1

Company Exhibit No. __Witness: RGTSchedule 2Page 2 of3
d. #6 Fuel OilSource: A.E. Bruggemann & Co. Energy BrokersProduct: Residual Fuel Oil, 1% SulfurTrade Symbol: N/ADelivery Point: New York HarborContract Size: 1,000 barrels (42,000 gallons)Additional Information: ~"!.YY..~Qn~&rr@!~Qm
e. Coal- CSX (CSX Corp.), Central AppalachiaSource: United Power (division of ICAP United, Inc.)Product: Coal- 12,500 Btu/lb, 1.6 lb/MMBtu S02Trade Symbol: N/ADelivery Point: Central Appalachia via CSX (Big Sandy River or Kanawha River)Contract Size: 10,000 short tons (approximate size of one train)Additional Information: www.icapenergy.com/US/markets/coal.aspx
f. Coal- NS (Norfolk Southern), Central AppalachiaSource: United Power (division ofICAP United, Inc.)Product: Coal- 12,500 Btu/lb, 1.6lb/MMBtu S02Trade Symbol: N/ADelivery Point: Central Appalachia via NS (Thacker or Kenova)Contract Size: 10,000 short tons (approximate size of one train)Additional Information: www.icapenergy.com/US/markets/coal.aspx
g. Coal- MGA (Monongahela Railway), Northern AppalachiaSource: United Power (division ofICAP United, Inc.)Product: Coal- 13,000 Btu/lb, 3.8-4.2lb/MMBtu S02Trade Symbol: N/ADelivery Point: Northern Appalachia via MGAContract Size: 10,000 short tons (approximate size of one train)Additional Information: www.icapenergy.com/US/markets/coal.aspx
h. SOz AllowancesSource: Evolution Markets, Inc.Trade Symbol: N/ADelivery Point: United States (nationwide)Quoted Units: $/ton of S02 emittedAdditional Information: http://new.evomarkets.com/index.php?page=Emissions_Markets
2

Company Exhibit No.Witness: RGTSchedule 2Page 3 of3
Commodity Price Data Sources
i. NO x Allowances (SIP Call Period and Annual)Source: Evolution Markets, Inc.Trade Symbol: N/ADelivery Point: United States (SIP Call region)Quoted Units: $/ton ofNOx emittedAdditional Information: http://new.evomarkets.com/index.php?page=Emissions_Markets
j. PJM-W Power PricesSource: Intercontinental ExchangeProduct: On-peak, Off-peak PowerTrade Symbol: N/ADelivery Point: PJM Western HubContract Size: 50 MWAdditional Information: www.theice.com/homepage.jhtml
3

Company Exhibit No. _ _Witness: RGTSchedule 3Page 1 of7
Historical Commodity Prices
HenryHub
$5.00
$4.50
$4.00
$3.50
$3.00
$2.50
$2.00
$1.50
$1.00
$0.50
$0.00
,,,I , I I
-----------+------ -------l------------t-- ----------'-------
,,,, , ,
r---------r ---------r---------
"l' "l' "l' "l' It) It) It) It) It) It).... .... .... .... .... .... .... .... 0 ....0 0 0 0 0 0 0 0 0~ ~ ~ ~ ~ ~ ~ ~ ~ !:!.... .... .... .... :!: .... .... .... .... :!:(j; 0 - N N M ~ in.... .... co.... ....
2014 -- ICE Indices - Avg Cas h
50.00
45.00
40.00
35.00
~ 30.00-IlJ:E 25.00~~ 20.00
15.00
10.00
5.00
Transco Zone 6NNY Delivered
! ! ! ! ! ! ! ! [ ! :I I , , I I I I I I I
----- ----- --t-- ----- - ---~--- -- - -- - -- - t - - - -- --- -- --I---- - -- --- - - -t-- - - --- - ----t------ -- ---- t ---- -- ---~------------~--- ---------:--- -- ---- - ---I--------- ---
: : : : I : : : : : :I I , , I I I I I I I___________~------ --_-- J t L J l L______ __L J L L _: : : : : : : : : : :I I I , I I I I I I ,I I I I I I I I I I I
-----------t-----------i------------t------------r-----------1------------t------------t------ ---i-------------i------------r------------r-----------, , , , , , , , I , ,, , , , , , , , I I I, , , , , , , I I , I
-- - --- -- ---7-- - - - - -- ---~----- -------t---------- --r----- - - ----~-- -- -- - -- -- -t --- -- --- --- -t - -- - -- - - -~- - - - - -- --- - - ~-- - - -- - - --- -r- - - - - ---- -- -r - ---- -- - - --, I , , I , I , I , I
: : : : : : : : : : :___________ ...:... J t L J l t_____ ___L J L L _, , , , I , I I I I II I I I I , , I I I I
: : : : : : : : : : :-- ---------~--- - -- -- - ---:---- ------ --~ -- ----------~ -- -- - - - -- - -~ -- ----- - - ---~ ----- --- --- - ~----- -- -+------ --- - --:-- - ---------~---- --------~ ---------- -
I , I I I I I I I I I
: : : : : : : : : : II , , , , , , , I I I
---- - ------+---- -- - - ---..:------------}------------~----- ---- --{ -- ----- ---- -} ----- --- ----}---- -- -- - ..:- - - - - -- -----..:-- - ---------~-- ----- - ----~ ---- - --- -- -: : : : : : :: II , I , I I I I I I____ _______...:... J t L J l _ _ L J L L _
--- -- - -- - - -L------- - -~- - --- - -- - -- -~- - -- -- --- --L---L-- i : 01 i - - - - - - - - - - --L---- - - - -~-- - - - ----- -~--- - - - --- --'-J ,
0.00"l' "l' "l' "l' "l' "l' It) It) It) It) It) It).... .... 0 .... .... .... .... .... .... .... 0 ...0 0 0 0 0 0 0 0 0 0~ ~ ~ s ~ ~ ~ !:! ~ !:! !:! !:!.... .... .... .... .... :!: .... :!: .... .... :!:;:: co (j; 0 - N N ~ in.... .... M co.... ....
201 4 -- Platts GO - Avg Cas h
1

$45.00
$40.00
$35.00
$30.00
~
$25.00iii::i:~ $20.00~
$15.00
$10.00
$5.00
$0.00
$4.50
$4.00
$3.50
$3.00
~
$2.50-m::i:
~ $2.00
$1.50
$1.00
$0.50
Company Exhibit No. __Witness: RGTSchedule 3Page 2 of 7
Transco Zone 5 Delivered
, , , , , 0 , 0 , , ,, , , , 0 , , , 0 ,, , , , , 0 , 0 , , ,, , 0 , ,I I I I , I , I I I I-----------T-----------1------------r------------r-----------,------------r------------r------ ---.,------------..,------------,..------------,.-----------
I I I I
: : : : : : : I I I 1I I I I
I I I I I I I I t I II I I I I I , I r I I
-----------7-------- - - - -:- -----------t------------~------------t------------t------------t - -- - -___ .J _____ _ ____ _ _ .J _ _ _ _ __ _ _ ____ L _ _ _ ___ _ __ ___L._ _ ______ _ _ _
I I I I
: : : : : : : I I , II t I I
I I I , I I I I I I II I I I I I , I I I I
-------- ---+-- ----- - - --..:---- -- ------ ~------ -- - ---l_----- ------~------- - ----~- -----------~---- -
::r::::::-::l::::--::r::~:::-~r~::~::~I I I I I I ,I I , I I I I
: : : : : : :I I I I I , ,-----------T-----------1------------r------------r-----------1------------r------------r-----: : : : : : :I I I I I I II I I I I I I
- -- - - -- --- -7-----------~------------t---------- --l- -- --- ----- - -t- - -- --- - - - - -t --- -- -- - - -- - t ---- -I I I I I I II I I I I I II I I I I I II I I I I I I
------- ----+------ - - --- -l--- -- - ---- - - ~ -- -- - --- ----~-- --- ------~-- --- -------~-------- --- -~ --- -
:::::E~~::-E::-::~E:::=E~:-~, , , , , 'k !
~~~~~~~~~~~l~~~~~~~~~~~j~~~~~~~~~~~~t~~~~~~~~~~~l~~~~~A-~~~i------------f- - - -- - - -~J --- -C-J YI
''It ''It ''It ''It ''It ''It It) It) It) It) It) It).... .... .... .... .... .... .... Q Q Q Q ...0 0 0 0 0 0 0 0!::! !::! !::! !::! !::! !::! !::! !::! !::! !::! !::! !::!....
~ ~ ~ :!:: .... :!:: .... .... .... .... iii~ .... N .... N M ~ iO.... ....
2014 --Platts GD - Avg Cas h
Dominion SP Delivered
,,,I I I r I I I I I I I------------r-----------"1------------t-------------t-------------t------------t-------------t-----------T-----------"1------------t-------------,.-----------I : : : : I : :: I! i ! l ' I ! i !
: - -----------~ -- ------ --- - . :------------r-----------
$0.00''It ''It ''It ''It ''It It) It) It) It) It) It)~ .... .... .... .... .... .... .... .... .... Q0 0 0 0 0 0 0 0 0 0~ !::! !::! !::! !::! !::! !::! !::! !::! !::! !::!~ ~ s :!:: .... :!:: .... :!:: ~
.... :!::.... N .... N .., iO lD.... ....
2014 --Platts GD - Avg Cas h
2

$5.00
$4.50
$4.00
$3.50
~ $3.00m
$2.50;:i;
~ $2.00
$1.50
$1.00
$0.50
Company Exhibit No. _ _Witness: RGTSchedule 3Page 3 of 7
Teo Pool Delivered
,,,I I I , I I I I I I I
-- - --- -- ----t--- - - - -- - - - ~- --- - - --- --- ~ - - -- - - -- - - --~- -- - -- - ---i------------~--------- - - - t---- ------+------ - ----_i------------~------------~--- - - ------
! i i : ' j ~----------+----------
$0.00'Ot 'Ot 'Ot 'Ot 'Ot 'Ot U) U) U) U) U) U).... .... .... .... .... .... .... .... .... .... .... ....0 0 0 0 0 0 0 0 0 0 0 0~ ~ ~ ~ ~ ~ ~ ~ ~ ~ ~ ~.... :!: ai s :!: .... :!: .... ....
~.... ....
j::: 00 .... N .... N M ;;; co.... ....
2014 --Platts GO - Avg Cash
No.6 Oil (1 %5)
$18.00
$16.00
$14.00
~ $12.00m;:i;;:i;
$10.00V.
$8.00
$6.00
$4.00
,,,,,,---- - - ---- --:- --- - - - -- - ---:- -- -- - --- --- ~- -------- - --~ -- --- - --- - - ~ -- - - - -- - --- -~ --- -------- - ~ --- -- --- -- ..:- -- -- - - --- -- ..: -- - - -- -- --- -~ - - - ---- -- ---~ -----------
~ ! : i ! i ! ! ! j i i
r
'Ot 'Ot 'Ot 'Ot U) U) U) U) U) U)
0 0 0 .... 0 0 0 .... .... ....0 0 0 0
~ ~ ~ ~ ~ ~ ~ ~ ~ ~
ai .... .... .... .... .... .... .... iii :!:Q - N - N M ~.... .... <0.... ....
2014 --AE Brugg Prompt - Avg Cas h
3

Company Exhibit No. _ _Witness: RGTSchedule 3Page 4 of7
Historical Commodity Prices
No.2 Oil
$25.00
$20.00 ........
$15.00 'l~ r-em -"!-~ r
~ $10.00
$5.00
$0.00~ ~ ~ ~ ~ ~ III III III III III III.... .... 0 .... .... .... .... .... 0 0 0 ....0 0 0 0 0 0 0 0~ ~ ~ ~ ~ ~ ~ ~ ~ ~ ~ ~.... .... a; ~ :!:: .... :!:: ~
....~ liS :!::i::: G3 .... N .... M (Q.... ....
20 14 -- NYMEX Heating Oil Prompt - Avg Cash
Crude Oil (WTI)
$110.00
$100.00
$90.00
$80.00
:c $70.00.aiit $60.00
$50.00
$40.00
$30.00
,A I "' ! I I I I I I I I
--------""'I:;:----------1-----------i------------1-----------i------------t------------1----------1------------t----------t ----------1-----------t\
$20.00~ ~ ~ ~ ~ ~ III III III III III III
0 0 0 0 0 .... .... .... .... .... .... 00 0 0 0 0 0~ ~ ~ ~ ~ ~ ~ ~ ~ ~ ~ ~.... .... a; .... :!:: .... :!:: .... :!:: ~
.... ....i::: G3 ;:; .... N .... N C'> in CD.... ....
201 4 - - NYMEX WTI Prompt - Av g Cas h
4

Company Exhibit No. _ _Witness: RGTSchedule 3Page 5 of7
Historical Commodity Prices
CAPP Coal (12500 Btu/lb, 1.6 Ib/MMBtu S02)
$65.00
$60.00 --$55.00 -,
.....
$50.00\.J ~c
~ LJ,",.!11... $45.00
$40.00
$35.00
$30.00~ ~ ~ ~ ~ ~ II) II) II) II) II) II)
0 0 ... 0 0 0 0 ... ... ... ... ...0 0 0 0 0 0
s::! s::! s::! s::! s::! s::! s::! s::! s s::! s::! !::!... ... ... ...~ ... ~ ~ ~ ~ :!:r::: co ;;; 0 ... N ... M co... ...
2014 --United Brokersheet Prompt - Avg Cas h
NAPP Coal (13,000 Btu/lb, 3.8/4.2Ib/MMBtu S02)
$65.00
$60.00 -----------
$55.00
c $50.00
~.!11
$45.00...$40.00
$35.00
,,,,,,, ,----------- ----------- ------------ ~
$30.00~ ~ ~ ~ ~ ~ II) II) II) II) II) II)... 0 ... 0 ... ... ... ... ... ... ... ...0 0 0 0 0 0 0 0 0 0s::! s::! s::! !::! s::! s::! s::! s::! s::! ~ s::! !::!s ... iii ...
~ ~ ~ ~... ... :!:co 0 ... ... M ~ in co... ...
201 4 --United Brokersheet Prompt - Avg Cash
5
Company Exhibit No. __Witness: RGTSchedule 3Page 6 of7
Historical Commodity Prices
502 Allowances
I I I I I I I I I I
: : : : ! I : : ! :I I I , I I I II I I I I I I I I I
------------r------------r-----------i------------i------------i------------Il --------i-----------t------------t------------t------------t-----------I I I ' I I I I , I, I I I I I I I I II I I I I I I I I II I I ' I I I , ,------------r------------r-----------l------------l------------1------------ ---- \ - -----------r------------r------------r------------r-----------I I I I ' I I I ,
I : : : : ::: :_______ __ ___~----- - - -- - _-L J J 1___________ _ t t L L _I I I I I I, . I
: : : : : : : : :: : : t : :: ::I I I I I I I I I
: : : : I : : : :------------~---------- --~---------- - ~- - ----------4- -----------~-- - - --- ---- ------------ - --- - ---- -~- - --- ---- -- -~----------- -:.- - -- -- ----- -;.. ---- -------
I I I I I I I I
: : : : : : : :! J ! !! I,' l ! ! ! !I I I I I I I I I, , I I I I I I I I___ _________... ..&.. .1 .1 .1. ___________ _ L L L ..&.. ..L. _
I I I I I I I I I II I I I I I I I I I
! ! ! !! ! ! ! ! !I I I I I I I I I II I I I I I I I I II I I I I : : :: :
50.00
250.00
200.00
300.00 -r----r----,----.,..---.,.--......---,..---...---,..---...---.......----r---...,
100.00
c~ 150.00~
"It "It "It "It "It Il) Il) Il) Il) Il) Il)... ... ... ;; ;; s ... ... .... .... ....0 0 0 0 0 0 0 0£:! £:! £:! £:! £:! £:! £:! £:! £:! £:! £:!.... .... .... :!:: ~ :!:: .... :!:: .... .... :!::co en <3 .... .... N M ~ in CD.... ....
201 4 -- Evoluti on Brokers heet Prompt - Avg Cash
NOx SIP Call Allowances
$350
$300
$250
c $200
~.!!!
$150~
$100
$50
$0
! : : ! ! : ! ! ! ! :I I I I I I I I I I I
-----------r ---------r --------r----------r-----------r-----------'~--.------r--------r---------r---------r - - - - -- - - - -- -r -- - - - -- -- --I 1 I I I I I I I I-----------T-----------'1------------r------------r-----------,------------ - -------r----------T-----------i------------r------------r-----------: : : : : I: :: :I I I I I -\ I I I II : : : : : ~ : :
-----------t-----------1------------t-----------t-----------1----------- --------- - ----------t-----------1-----------t---------t ---------I I I I I I I I I___________~------- ----J t L 1___________ _ J.. J L L _I I I I I I I I II I I I I I I I 1I I I I I I I I
! ! ! ! ! : :!!!I I I I I I I I I I-----------t -----------1------------:------------:------------1----------- ------------t----------t-----------1------------:-------------:------------I I I I I I I I I I
: : : :: : : :: :I I I I I I I I I I
-----------+-----------1------------~-----------t-- -- - - - --- - t--------- -- - ------ -- --- ~- ---------i------------ i -- ----- -- --t-------- -- -t----------I : :: : :!: ! ! ! r
"It "It "It "It "It "It Il) Il) Il) Il) Il) It)
;; .... .... .... .... .... .... .... .... .... .... ..0 0 0 0 0 0 0 0 0 0 0
£:! £:! £:! £:! £:! £:! £:! £:! £:! £:! £:! £:!.... s ai 2i :!:: .... :!:: .... ....~ ~
....;:: ... N .... N M iii.... ...
2014 -- Evolution BrokersheetPrompt - Avg Cash
6

$350
$300
$250
c $2000~
.!!!$150~
$100
$50
Company Exhibit No. __Witness: RGTSchedule 3Pa ge 7 of7
NOx Annual Allowances
I I I I I I I I I II I I I I I I I I I II I I : I I : I I : :I I I I "I I I II I I I I I I I I I II I I I I I I I I I I
::---~::::~=-_:::::T-~-:-=f-=-:~-::r-:::-~:l::::::::::~=::T:::::::::r-=::::-T:---:~l---=-l- :-:::::------- ----+-----------~--- ------ - - -~---------- - -~- ------ ----j - - -- ----- - - --------\- ----------+-----------~------------~------------~------- ----
: : : :: :: ::: : : :: : : : :I I I I I I I I II I I I ' I I I I-----------:-----------1------------:------------:------------1----------- ----------- If---------r -----------1------------:-------------r-----------I I I I I I I I
! ! ! ! ! : \ : ! ! !I I I I I I I I I I
- - -- --- - --- -t- - - ---- - -- -- -:- - - ----- - --- t- --- ------- -~ -- --------- ot --- --- -- - -- ------------t-----------:-------------:------------l-------------l------------I , I I I ' I t I II I I I I I I 1 I I
: ! ! ! J !!!!!___ _ ____ ___ I I -----------1----------- ------------L----------.J------------.J-----------l -----------.1.----------
H$0
"l3' "l3' "l3' "l3' "l3' "l3' II) II) II) II) II) II).... .... .... .... .... .... .... 0 .... .... .... ....0 0 0 0 0 0 0 0 0 0 0!:::! !:::! !:::! !:::! !:::! !:::! !:::! !:::! !:::! !:::! !:::! !:::!.... .... s ?3 :!: .... :!: .... :!: ~
.... ....j:: co .... N .... N C'> in iD.... ....
2014 -- Evolution BrokersheetPrompt - Avg Cash
DOM Zone LMP (7x24)
$410.00
$310.00
$210.00
$110.00
,,oooo,,oo
I I I I I I I I I I I--- - -------"'T'" -----------~-- ---------r_---------- -.,- ----- - -- ---r- -- ----- - - - -r_ -- -- ----- -- -r_- -- -- - ---~- - - - - - - - -- --r-- -- -- -- - - - .,- --- -- -- -- -- .,.-- -- ---- -- -
I I : I I I I I : I ~
i i i iii i i i i iI I : I : : I : : : ~I : : I : I I I : I ~______ _____ ..:... L L J L L L l L J l _I I I I I I I I I I I
I I I I I I I I I I I- -- ------ --~------ -- - -- - ~-- -- - ------+-- ---------~------------~ - - ---------+-----------+--- - - ---t---- -- -- -- -- ~ ------ - -- -- ~ - - ----- -- -- - t-----------
I I I I I I A I I I I I! ! ! ! ! ! I I ! ! [v" !_ ...". j i i f\ i i-v v ,IJ _ ! ! !
$10.00"l3' "l3' "l3' "l3' "l3' "l3' II) II) II) II) II) II).... .... .... .... .... .... .... .... .... .... .... ....0 0 0 0 0 0 0 0 0 0 0 0!:::! !:::! !:::! !:::! !:::! !:::! !:::! !:::! !:::! !:::! !:::! !:::!.... .... .... .... :!: ~ s .... .... .... .... ....j:: co en <5 .... N M ~ in iD.... .... ....
2014 --DOM Zone LMP - Avg Cash
7


1 Q.
2 A.
3
4
5
6
7
8 Q.
9 A.
10
11
12
13
14
15
16
17 Q.
18 A.
DIRECT TESTIMONYOF
GLENN A. KELLYON BEHALF OF
VIRGINIA ELECTRIC AND POWER COMPANYBEFORE THE
STATE CORPORATION COMMISSION OF VIRGINIACASE NO. PUE-2015-00022
Please state your name, business address, and position of employment.
My name is Glenn A. Kelly, and my business address is 5000 Dominion Boulevard, Glen
Allen, Virginia 23060. I am the Director of Generation System Planning for Virginia
Electric and Power Company ("Dominion Virginia Power" or the "Company"). I am
responsible for forecasting total system fuel and purchased power expenses, and for
conducting the Company's long-term generation supply planning. A statement of my
background and qualifications is attached as Appendix A.
What is the purpose of your testimony in this proceeding?
I will review the methodology and models that the Company used to project total system
energy requirements and fuel expenses from July 1,2015 through June 30, 2016 (the
"current period"). In doing so, I will also describe the load forecast, unit operating
parameters, and electric market interface assumptions used to develop these projections.
Finally, I will discuss the Company's actual energy requirements and fuel expenses for
the 12-month historical period of February 1, 2014 through January 31, 2015, as required
by Rule 80 ofthe Commission's Rules Governing Utility Rate Applications and Annual
Informational Filings, 20 VAC 5-201-80.
During the course of your testimony, will you introduce an exhibit?
Yes. Company Exhibit No. _, GAK, consisting of Schedules 1 through 15, was

1
2
3 Q.
4
5 A.
6
7
8
9
10
11
12
13
14
15
16
17
18 Q.
19 A.
20
21 Q.
22 A.
prepared under my supervision and direction, and is accurate and complete to the best of
my knowledge and belief.
Please describe the Company's process for projecting total system energy
requirements and fuel expenses for the current period.
Projected system energy and fuel expenses are developed through a four-phase planning
process that simulates the expected economic dispatch of the Company's system. First,
the Company develops a load forecast (retail and wholesale) for its entire service
territory. Second, the Nuclear and Power Generation business units provide projections
of the generating unit operational parameters, including unit capacities, heat rates,
planned outages, and forced outage rates. The Power Contracts Department also provides
the contract parameters for non-utility generators ("NUGs") under contract with the
Company. Third, the Budgeting, Business Planning & Market Analysis Department
provides the commodity and power price forecasts, while the Fuels Department provides
the fuel contracts and associated transportation arrangements. Finally, the data is
compiled into models that provide a simulation of the Company's system dispatch. The
result of this simulation is a projection of the system fuel expense, which the Rates
Department then uses to develop the Company's Virginia jurisdictional fuel factor rate.
What models were used to develop the energy and fuel expense projections?
The Company utilizes the FuelPlan and PROMOD models to calculate expected fuel
expense.
What is the FuelPlan model?
The FuelPlan model is a PC-based model that consists of two different modules - the
2

1
2
3
4
5
6
7 Q.
8 A.
9
10
11
12
13
14
15
16
17 Q.
18 A.
19
20
21
22
23
dispatch module and the expense module. The dispatch module develops the unit
dispatch rates (in ¢/MBtu) that are used by PRO MOD to simulate the economic dispatch
of the Company's generating units. The expense module develops the unit expense rates
that are used in PROMOD to calculate the cost of the units' projected generation based
on the weighted average value of the fuel inventory at each unit (which changes over
time due to the monthly fuel deliveries and consumption at the Company's stations).
How are unit dispatch rates developed?
The dispatch module of FuelPlan utilizes the forward commodity price forecast, which is
described by Company Witness Robert G. Thomas, along with a transportation adder for
each unit to develop a unit dispatch rate. This dispatch rate reflects the marginal or
replacement delivered fuel cost of the incremental generation from a particular unit. The
unit dispatch rates (in ¢/MBtu) are passed to the PROMOD model as inputs for the
Company's system to simulate the economic dispatch to meet the Company's projected
load requirements. The PROMOD model is run using the unit dispatch rates, and the
resulting unit Btu requirements are then passed back from PRO MOD to FuelPlan to
develop the unit expense rates.
How are unit expense rates developed?
The expense module of FuelPlan develops a projection of the monthly average inventory
cost for each generating unit. The model downloads the beginning inventory cost for
each unit from the Company's accounting system, and calculates a forecasted monthly
average inventory cost based on beginning inventory cost and the cost of the projected
fuel deliveries. For example, for the Company's coal units, the model incorporates both
contract and spot market purchases based on the projected Btu requirements, which
3

2 Q.
3 A.
4
5
6
7
8
9
10
11
12
13
14 Q.
15 A.
16
17
18
19
20
21
22
results in an average of spot and contract delivered prices weighted by tons.
What is the PROMOD model?
PROMOD is a production costing model leased from Ventyx LLC that the Company has
used for many years to forecast its system operations and fuel costs. The model utilizes
the dispatch rates developed in FuelPlan along with the forward power price curve to
simulate the dispatch of the Company's system to meet projected load requirements. The
model logic dispatches resources in least-cost order (from either the Company's
generating units or purchases through PJM Interconnection, L.L.C. ("PJM")) to meet the
Company's total demand requirements. If during any given hour the load requirement is
met, and the Company's marginal generating unit dispatch cost is below the market price
of energy, PROMOD will simulate an interchange sales transaction. The PROMOD
dispatch logic takes into account the operational parameters of the generating units and
the Company's NUG contracts when determining the least cost solution.
How are the respective units' dispatch costs determined in PROMOD?
Unit dispatch cost is based on the marginal or replacement energy cost specific to the
unit. The energy cost components include the marginal fuel expense (the unit dispatch
rate from the FuelPlan model), the marginal allowance expense for both sulfur dioxide
("S02") and nitrogen oxide ("NOx") emissions, and the variable operations and
maintenance ("O&M") expense. The marginal allowance expense is based on a unit's
S02 and NOx emission rates (lbs/MBtu) and the market value or replacement cost of
allowances ($/ton). The variable O&M expense component includes both consumables
(water, limestone, ammonia, etc.) and the variable portion of maintenance expense.
4

2
3
4
5
6
7 Q.
8 A.
9
10
11
12 Q.
13
14 A.
15
The $/MWh dispatch cost of the unit is developed by multiplying the delivered fuel cost
(in $/MBtu) times the unit heat rate (in MBtulMWh), and then adding the $/MWh costs
of emissions adders and variable O&M. These unit dispatch costs are calculated by the
model to determine the total variable cost of dispatching the unit ($/MWh) at various
levels of output, including the impact of start-up costs and environmental regulations.
I. CURRENT PERIOD DISCUSSION
What kWh sales forecast is used to develop the projected load requirements?
Schedule 1 shows the Company's total energy requirement at the generator output level,
and the sales forecast for both total system and Virginia jurisdictional customers for the
current period. The effects of energy efficiency and demand-side management programs
are included in the system sales forecast.
How have forward commodity prices changed since the Company's fuel factor filing
last year in Case No. PUE-2014-00033 (the '"2014 Fuel Factor")?
As the table below demonstrates, natural gas, coal, oil and power prices have decreased
since last year's fuel filing.
FORWARD PRICES
16
COMMODITY
Coal (CAPP-FOB) ($/ton)
Oil (Crude-WTI) ($/bbl)
Gas (Henry Hub) ($/mmbtu)
Gas (Zone 5) ($/mmbtu)
Gas (Z6NNY) ($/mmbtu)
Power (7 x 24 PJM West Hub) ($/MWh)
Nuclear (expense basis) ($/MWh)
3/31/2014
JULY 14-JUNE 15
62.13
95.04
4.40
5.05
4.92
43.43
6.80
5
1/30/2015
JULY 15-JUNE 16
46.69
56.75
3.06
3.78
3.54
36.73
6.87
-25%
-40%
-30%
-25%
-28%
-15%
1%

1 Q.
2
3 A.
4
5
6
7
8
9 Q.
10
11 A.
12
13
14 Q.
15 A.
16
17
18
19 Q.
20 A.
21
22
What is the Company's projection of system fuel and purchased power expenses for
the current period?
The Company's projected system fuel expense for the current period is $2,026 million.
Schedule 2 shows supply volumes (MWh), supply costs ($000), and average cost
($/MWh), by supply type, for the current period. The total monthly system energy and
fuel expense on my Schedule 2 is included in Company Exhibit No. _, EJA, Schedule
1, sponsored by Company Witness Edward J. Anderson, to determine the Company's
Virginia jurisdictional fuel expense.
The Company's projected system fuel expense is lower than in its 2014 Fuel Factor.
What are the drivers for this decrease?
As I will discuss later in my testimony, the primary drivers to the decrease in the system
fuel expense are the decreases in the commodity prices for natural gas, coal, oil and
power.
What unit operating assumptions and results are included in this filing?
Confidential Schedule 3 provides the projected equivalent availability rates, confidential
planned outage dates, and capacity factors by generating unit (for non-peaking units) for
the current period. Confidential Schedule 4 shows the assumed monthly unit equivalent
forced outage rates.
How does PROMOD account for the Company's participation in PJM?
PROMOD dispatches the Company's generating units against an hourly market price that
is reflective of the PJM Dominion Zone ("Dom Zone") price. Company Witness Thomas
discusses this forecast in greater detail. In the model, the Company's system is
6
1
2
3
4
5
6
7
8 Q.
9 A.
10
11
12
13
14
15
16 Q.
17
18 A.
19
20
interconnected with the PJM energy market. For economy energy purchases, if the
market price of energy is lower than our cost to generate, then imports will occur until the
marginal cost of the last unit dispatched equals the market price of energy (with the
imports not allowed to exceed the transmission tie limit). For off-system sales, if the
market price of energy is higher than our cost to generate, then exports will occur until
the marginal cost of the last unit dispatched equals the market price of energy (with the
exports not allowed to exceed the transmission tie limit).
Are there any off-system sales included in this filing for the current period?
The Company is projecting that it will sell 479,390 MWh, with an associated sales
margin of $9.0 million, for the current period. Therefore, $6.8 million for energy sales
margins is reflected as a reduction to the system fuel expense pursuant to the statutory
75%-25% sharing mechanism of such margins under Va. Code § 56-249.6 D 1. Schedule
5 shows the expected off-system sales margins by month. The total reduction to the
system fuel expense is $27.7 million. These values are also included in the system total
fuel expense shown on Schedule 2.
Does the Company's system fuel expense include the impacts of financial
transmission rights ("FTRs")?
Yes. Schedule 2, page 2 of 3 shows a reduction of $6.7 million, which reflects a 100%
credit of excess FTRs as previously agreed by the Company in prior Virginia fuel factor
cases.
7

1 Q.
2 A.
3
4 Q.
5
6 A.
7
8
9 Q.
10
11 A.
12
13
14
15
16
17
18
19
20
21 Q.
22 A.
Are interim nuclear spent fuel storage costs reflected in total system fuel expense?
Yes. System nuclear fuel expense includes interim spent fuel storage costs of$13.2
million.
Are natural gas storage and pipeline firm transportation expenses reflected in total
system fuel expense?
Yes. System gas fuel expense includes natural gas storage and pipeline transportation
expenses and contract costs. For the current period, these projected fixed gas expenses
are $85.1 million.
What is the status of the Company's recovery from the U.S. Department of Energy
("DOE") for spent nuclear fuel storage mentioned in the 2014 Fuel Factor?
In the 2014 Fuel Factor, the Company included approximately $21 million on a Virginia
jurisdictional basis of expected settlement payments as a reduction to projected system
fuel expense. Through January 2015, the Company has received approximately $16
million of the $21 million noted above, and expects to receive the remaining $5 million
during the 2015 2016 fuel year. For the upcoming current period, the Company is
including projected settlement payments totaling approximately $11 million on a Virginia
jurisdictional basis by June 2016, as Company Witness John C. Ingram discusses. These
additional fuel-related payments from the DOE during the current period are for
additional claims related to storage of spent nuclear fuel at the Company's North Anna
and Surry Power Stations.
Do you have any other schedules relating to the current period?
Yes. Confidential Schedule 6 shows the forecasted fuel consumption (in MBtu), by
8

1
2
3
4
5 Q.
6
7 A.
8
9
10
11
12
13
14 Q.
15
16 A.
17
18 Q.
19 A.
20
21
month and by unit. Confidential Schedule 7 shows the forecasted heat rates for the
thermal generating units, also by month and by unit. Finally, Schedule 8 shows the
projected fuel cost information for February to June 2015 - i.e., the remainder of the prior
period (July 1,2014 to June 30, 2015) - for which there are not yet actual results.
Is there any new capacity that will become available during the remainder of the
prior period or during the current period?
Yes. The 1,329 MW Warren County combined-cycle unit was brought online in
December 2014 as scheduled. The 1,358 MW Brunswick County gas-fired combined
cycle station is expected to be operational in May 2016. This plant will employ state-of
the-art technology and will further strengthen the fuel diversity of the Company's
generation fleet. In addition, the Possum Point Unit 6 gas-fired combined-cycle will be
uprated by 27 MW in May 2015.
U. HISTORICAL PERIOD DISCUSSION
What were the Company's monthly energy requirements and sales volumes for the
most recent 12-month historical period?
System energy requirements and sales volumes for that period are shown on Schedule 9,
which provides data for the period February 2014 January 2015.
Please explain the Company's fuel expense for the historical period.
Schedule 10 shows a system level monthly summary of the actual supply volumes
(MWh), supply costs ($000), and average cost ($/MWh), by supply type, for the period
February 2014 - January 2015.
9

1 Q.
2 A.
3
4
5
6 Q.
7
8 A.
9
10
11
12
Please explain the Company's fuel recovery position for the prior period.
As shown by Company Witness Anderson, the year-end fuel recovery through June 30,
2015 is expected to be an under-recovery of approximately $21.9 million. This value
includes a write-off of $85.4 million which is one-half of the deferral balance as of
December 31,2014.
What are the main factors that contributed to the fuel expense recovery position
during the prior period?
After March 2014, the weather was milder and commodity prices were lower than
expected. This resulted in an over-recovery of$84 million through January, 2015 which
includes the impact of the $85 million fuel deferral write-off as described by Company
Witness Ingram. The actual change in these commodity prices are shown in the table
below.
13
COMMODITY
Coal (CAPP-FOB) ($/ton)
Oil (Crude-WTI) ($/bbl)
Gas (Zone 5) ($/mmbtu)
Gas (Z6NNY) ($/mmbtu)
Gas (Henry Hub) ($/mmbtu)
Power (7 x 24 PJM West Hub) ($/MWh)
3/31/2014 forecast
JULY 14 - JAN 15
61.50
97.11
5.14
5.03
4.50
45.27
Actual
JULY 14 - JAN 15
53.50
79.72
4.07
3.12
3.72
36.36
-13%
-18%
-21%
-38%
-17%
-20%
14
15
16
17
However, during February 2015, the weather became abnormally cold, driving both gas
and power prices higher as demand increased in the Mid-Atlantic region. Thus, when
taking into account current weather and the accelerated implementation of the proposed
reduced fuel rate, the June 30, 2015 deferral balance is forecasted to be an under-recovery
10

2
3 Q.
4 A.
5
6
7
8
9
10 Q.
11 A.
of$21.9 million. This includes an estimated $83.5 million fuel impact for the cold
weather in February 2015.
Do you have any other schedules relating to the historical period?
Yes. Confidential Schedule 11 shows unit availability information, planned outage dates,
and capacity factors of the thermal generating units over the historical period. Confidential
Schedule 12 shows the actual fuel (in MBtu) consumed by month and by unit, and
Confidential Schedule 13 shows monthly unit equivalent forced outage rates. Confidential
Schedule 14 shows monthly unit heat rates, while Confidential Schedule 15 contains
information about abnormal operating events that occurred during the historical period.
Does this conclude your pre-filed direct testimony?
Yes, it does.
11

APPENDIX A
BACKGROUND AND QUALIFICATIONSOF
GLENN A. KELLY
Glenn A. Kelly joined Dominion Virginia Power in 1986 as an engineer after graduating
from Virginia Tech with a Bachelor of Science degree in Mechanical Engineering. He received
a Master of Business Administration degree from Averett University in 1998.
After working eleven years as a performance and project engineer at the Chesapeake
Energy Center and the Yorktown Power Station, Mr. Kelly transferred to the Company's Power
Generation Technical Services Department in Richmond as a Generation Performance Specialist.
Following a series of positions supporting Power Generation operations, he earned his Six Sigma
Master Black Belt and became Manager of Planning and Analysis in 2004. His responsibilities
included Energy Supply PJM support, fuel expense and variance reporting, generation
forecasting, and project financial analysis.
In September 2007, Mr. Kelly was promoted to Director - Generation System Planning
for Dominion Virginia Power, where he is currently responsible for developing generation
portfolio plans to serve customers' future energy and capacity requirements. His group also
monitors fuel expenses and provides forecasted operational data to various groups within the
Company.
Mr. Kelly has previously submitted testimony before the State Corporation Commission
of Virginia and the North Carolina Utilities Commission.

VIRGINIA ELECTRIC AND POWER COMPANYJULY 2015 - JUNE 2016
LOAD AND SALES FORECAST (MWH)
Company Exhibit No,_Witness: GAKSchedule 1Page 1 of 1
Jul-15Aug-15Sep-15Oct-15Nov-15Dec-15Jan-16Feb-16Mar-16Apr-16May-16Jun-16
Total
SystemEnergy
Requirement
8,802,7808,594,9277,277,0696,579,2746,584,4448,255,0028,732,5397,550,0257,287,8076,524,4797,197,7728,109,093
91,495,212
TotalSystemSales
8,267,9308,047,5236,762,8856,060,3436,016,1657,762,2808,261,6107,148,3686,793,6586,105,5696,598,9537,614,203
85,439,487
VirginiaJurisdictional
Sales
6,633,7626,436,7515,292,4594,697,3254,719,6386,271,4746,716,6055,784,1815,393,2064,787,8145,179,0676,060,468
67,972,749

VIR
GIN
IAE
LE
CT
RIC
AN
DP
OW
ER
CO
MP
AN
YJU
LY
2015
-JU
NE
2016
FO
RE
CA
ST
ED
SY
ST
EM
EN
ER
GY
(MW
H)
Co
mb
ine
dC
om
bu
stio
nH
ydro
&P
ow
er
Nu
cle
ar
Coa
lB
iom
ass
He
avy
Oil
Ste
amG
asC
ycle
Tu
rbin
eB
ath
Co.
So
lar
NU
GP
urc
ha
ses
Sal
esF
TR
sT
ota
lJu
l-1
52
,44
1,4
80
2,3
09
,27
613
1,50
11
08
,76
71
22
,43
32
,18
3,5
12
34
8,6
23
(26
,07
0)
1,53
69
08
,84
63
20
,76
7(4
7,8
91
)8
,80
2,7
80
Au
g-1
52
,44
1,4
80
2,2
32
,21
51
29
,76
31
20
,74
87
9,0
10
2,1
95
,66
93
97
,39
2(2
5,9
01
)1,
534
80
5,8
84
29
0,2
63
(73
,12
9)
8,5
94
,92
7S
ep
-15
2,37
2,06
11
,20
6,4
98
11
0,4
43
59,9
812
,17
2,0
32
28
0,5
88
(27
,44
9)
1,6
32
72
9,0
28
42
3,6
78
(51
,42
4)
7,2
77
,06
9O
cl-1
52
,10
5,7
92
1,1
80
,36
67
5,8
46
47
,78
82
,37
6,2
99
87
,79
2(8
,43
5)
1,50
04
70
,52
23
26
,73
8(8
4,9
32
)6
,57
9,2
74
Nov
-15
1,8
59
,28
21
,57
7,4
93
98
,98
63
8,1
57
1,4
20
,72
57
3,5
52
(11
,90
8)
1,20
97
21
,84
98
46
,50
0(4
1,4
01
)6
,58
4,4
44
Dec
-15
2,5
37
,97
22,
124,
851
13
9,1
63
33
,00
81
,38
9,1
53
54
,73
81
1,2
44
1,4
22
86
0,2
00
1,1
04
,74
3(1
,491
)8
,25
5,0
02
Jan
-16
2,5
37
,97
22
,85
7,5
20
18
2,8
03
54,9
241
,34
2,1
21
74
,20
52
9,1
84
1,52
01
,00
2,8
48
66
7,4
78
(18
,03
7)
8,7
32
,53
9F
eb
-16
2,3
71
,69
52
,60
5,2
39
15
3,0
86
27
,85
51
,37
1,4
87
31
,91
03
4,9
63
1,66
887
6,06
11
02
,76
8(2
6,7
06
)7
,55
0,0
25
Ma
r-1
62
,00
8,0
18
1,5
78
,46
91
25
,97
45
6,2
20
2,29
7,18
18
1,7
89
27
,26
92,
123
87
4,3
99
25
4,9
09
(18
,54
2)
7,2
87
,80
7A
pr-
16
2,3
38
,18
88
37
,14
26
4,1
75
84
,05
41
,33
5,7
92
13
5,3
05
18
,57
22,
335
76
0,9
00
96
6,6
94
(18
,67
8)
6,5
24
,47
9M
ay-
16
2,4
41
,48
08
89
,99
01
20
,77
31
8,0
42
29
,91
62
,74
7,3
10
70
,74
61
4,3
62
2,39
27
10
,36
22
07
,11
6(5
4,7
17
)7
,19
7,7
72
Jun
-16
2,3
62
,72
31
,83
6,6
10
12
4,5
94
11
9,4
82
23
,25
42
,61
1,6
66
12
9,7
30
12
,77
62,
393
67
3,5
30
25
4,7
78
(42
,44
2)
8,1
09
,09
3
Tot
al2
7,8
18
,14
32
1,2
35
,66
81
,45
7,1
07
36
7,0
38
65
6,5
98
23
,44
2,9
49
1,7
66
,37
04
8,6
06
21
,26
39
,39
4,4
30
5,76
6,43
1(4
79
,39
0)
91
,49
5,2
12
NO
TE
S:
Hyd
ro&
Bat
hC
o.ar
ene
tof
pu
mp
ing
en
erg
y
o o 3 "0 ill
::J '<; m
~~
"1J(
J)S
O:
wn
eD
::::
+:
<O
:Tu
>z
CD~~o
~s..
(j)1'
_CD
»W
N7
'

VIR
GIN
IAE
LE
CT
RIC
AN
DP
OW
ER
CO
MP
AN
YJU
LY
2015
-JU
NE
2016
FO
RE
CA
ST
ED
SY
ST
EM
FU
EL
EX
PE
NS
E($
000)
Com
bine
dC
om
bu
stio
nH
ydro
&P
ow
er
Nu
cle
ar
Coa
lB
iom
ass
Hea
vyO
ilS
team
Gas
Cyc
leT
urbi
neB
ath
Co.
Sol
arN
UG
Pu
rch
ase
sS
ales
FT
Rs
Tot
alJu
l-15
16,4
7870
,553
5,69
213
,008
3,55
748
,031
11,3
0726
,051
12,7
65(2
,525
)(5
63)
204,
354
Aug
-15
17,0
6567
,961
5,61
513
,605
2,35
347
,476
10,5
5521
,575
10,6
63(3
,492
)(4
79)
192,
896
Sep
-15
16,1
6637
,080
4,92
21,
839
44,2
266,
090
18,7
0914
,164
(2,8
36)
(528
)13
9,83
3O
ct-1
514
,323
36,2
323,
377
1,51
246
,999
1,89
413
,573
10,1
25(3
,973
)(3
24)
123,
739
Nov
-15
13,0
1747
,973
4,38
91,
286
34,9
542,
077
18,4
7226
,676
(2,3
43)
(562
)14
5,93
9D
ec-1
517
,213
63,7
656,
142
1,38
641
,032
2,26
322
,164
38,6
53(6
4)(7
23)
191,
830
Jan-
1617
,202
86,4
898,
341
3,88
360
,974
8,53
928
,017
36,7
55(4
,205
)(1
,182
)24
4,81
4F
eb-1
616
,318
77,7
506,
911
1,61
753
,203
2,26
723
,849
4,77
3(1
,342
)(9
13)
184,
434
Mar
-16
13,6
9747
,176
5,74
01,
871
53,0
974,
305
23,3
4610
,054
(1,1
72)
(414
)15
7,70
1A
pr-1
615
,858
25,8
863,
006
2,77
532
,900
4,09
021
,483
33,6
31(9
16)
(332
)13
8,38
2M
ay-1
616
,851
27,4
355,
468
2,22
91,
024
59,6
691,
899
19,3
956,
948
(2,6
75)
(283
)13
7,96
0Ju
n-16
17,0
2957
,100
5,44
813
,528
794
56,4
363,
408
18,4
718,
574
(2,1
95)
(395
)17
8,19
8
Tot
al19
1,21
664
5,40
165
,051
42,3
7123
,896
578,
998
58,6
9625
5,10
621
3,78
1(2
7,73
7)(6
,698
)2,
040,
080
DO
EA
dju
stm
en
ts(1
4,21
6)
Sys
tem
Fue
lE
xpen
se2,
025,
864
NO
TE
S:
'Com
bine
dC
ycle
'in
clud
esga
spi
pelin
ean
dst
orag
efix
ede
xpe
nse
s'P
ow
er
Sal
es'
incl
ude
75%
mar
gins
for
appl
icab
leof
f-sy
stem
sale
sN
ucl
ea
rex
pens
ein
clud
esin
terim
stor
age
cost
s
o o :3 '0 '"::l '<; m
~~
-o
CJ)::
l",
m()
CD
r-+
<
.a::
icn
z~~~~
o~
(;)1...
.,(0»
wtv
A

VIR
GIN
IAE
LE
CT
RIC
AN
DP
OW
ER
CO
MP
AN
YJ
UL
Y20
15.
JUN
E20
16
FO
RE
CA
ST
ED
AV
ER
AG
EC
OS
T($
PE
RM
WH
)
Co
mb
ine
dC
om
bu
stio
nH
ydro
&P
ower
Nu
cle
ar
Coa
lB
iom
ass
Hea
vyO
ilS
team
Gas
Cyc
leT
urbi
neB
ath
Co.
Sol
arN
UG
Pu
rch
ase
sS
ales
FT
Rs
Tot
alJu
l-15
6.75
30.5
543
.29
119.
6029
.05
22.0
032
.43
28.6
639
.79
52.7
223
.21
Au
g-1
56.
9930
.45
43.2
711
2.67
29.7
821
.62
26.5
626
.77
36.7
447
.75
22.4
4S
ep-1
56.
8230
.73
44.5
730
.65
20.3
621
.71
25.6
633
.43
55.1
519
.22
Oct
-15
6.80
30.7
044
.53
31.6
319
.78
21.5
728
.85
30.9
946
.77
18.8
1N
ov-1
57.
0030
.41
44.3
433
.70
24.6
028
.24
25.5
931
.51
56.5
922
.16
Dec
-15
6.78
30.0
144
.13
41.9
929
.54
41.3
525
.77
34.9
942
.92
23.2
4Ja
n-16
6.78
30.2
745
.63
70.6
945
.43
115.
0827
.94
55.0
723
3.12
28.0
3F
eb-1
66.
8829
.84
45.1
458
.05
38.7
971
.05
27.2
246
.45
50.2
324
.43
Mar
-16
6.82
29.8
945
.57
33.2
823
.11
52.6
426
.70
39.4
463
.22
21.6
4A
pr-1
66.
7830
.92
46.8
433
.02
24.6
330
.23
28.2
334
.79
49.0
621
.21
May
-16
6.90
30.8
345
.28
123.
5734
.24
21.7
226
.84
27.3
033
.55
48.8
919
.17
Jun-
167.
2131
.09
43.7
311
3.23
34.1
421
.61
26.2
727
.42
33.6
551
.71
21.9
8
Tot
al6.
8730
.39
44.6
411
5.44
36.3
924
.70
33.2
327
.15
37.0
757
.86
22.3
0
Sys
tem
fuel
cost
incl
udin
gD
OE
ad
just
me
nt
22.1
4
NO
TE
S:
'Com
bine
dC
ycle
'in
clud
esga
spi
pelin
ean
dst
orag
efix
ede
xpe
nse
s'P
ower
Sal
es'
incl
ude
75%
ma
rgin
sfo
rap
plic
able
off
-sys
tem
sale
sN
ucl
ea
rex
pens
ein
clu
de
sin
terim
stor
age
cost
s
o o 3 "0 '":::J -c m~~
\)U
J::
:JQ
:O
lOC
D....
....(Q
::T(J
)Z
~~~~
o£;
.wI
...,C
D»
WN
A

Confidential Information Redacted
VIRGINIA ELECTRIC AND POWER COMPANYJULY 2015 - JUNE 2016
Fossil & Hydro and Nuclear Unit Performance Forecast
Company Exhibit No._Witness: GAKSchedule 3Page 1 of 1
EquivalentAvailability Capacity
Unit Rate Factor(%) (%)
North Anna 1 98.0 99.8North Anna 2 90.8 92.2
Surry 1 98.0 100.2Surry 2 84.6 86.2
Altavista-Biomass 87.7 87.7
Bear Garden 90.2 78.8
Bellemeade 87.0 36.2
Bremo 3 - Gas 82.7 1.5
Bremo 4 - Gas 88.5 3004
Brunswick 87.7 81.7
Chesterfeld 3 90.8 17.8
Chesterfeld 4 83.9 45.8
Chesterfeld 5 83.7 63.1
Chesterfeld 6 88.8 73.7
Chesterfeld 7 96.2 94.3
Chesterfeld 8 81.5 8504
Clover 1 93.8 84.3
Clover 2 93.8 86.3
Gordonsville 1 90.7 56.1
Gordonsville 2 83.9 50.3
Hopewell-Biomass 87.7 87.7
Mecklenburg 1 9504 25.8
Mecklenburg 2 9504 23.6
MtStorm 1 83.3 59.6
Mt Storm 2 87.2 65.9
Mt Storm 3 67.2 41.9
Pittsylvania/Multi 93.3 19.8
Possum Point 3 90.5 3.7
Possum Point 4 90.5 10.3
Possum Point 5 7804 2.7
Possum Point 6 88.1 68.8
Rosemary 88.8 6.7
Southampton-Biomass 87.7 87.7
VCHEC 76.7 49.7
Warren 89.2 77.0
Yorktown 1 80.7 204
Yorktown 2 83.7 4.1
Yorktown 3 65.3 2.7
Planned Outage Period ;,O,-,u!-"ta"lg",e,-D~e",sc"lr.!!ip<!.tl!-,,·o~n _
Refueling
Refueling
RefuelingRefueling
BoHer maintenanceBoilermaintenance, turbine valve maintenance
Borescope inspection, balanceof plantmaintenance, turbine valvemaintenanceBorescope inspection, balanceof plantmaintenance
Borescope inspection, balanceof plantmaintenance
Generatorinspection, balanceof plantmaintenanceBalanceofplantmaintenance
Catalystreplacement
BoHer maintenance, catalyst replacement
Boilermaintenance, balanceof plantmaintenance,catalystreplacement
Hotgas pathinspectionHotgas path inspection, turbine valve maintenance
BoHer maintenanceBoiler maintenance
Turbinevalve maintenance, catalyst replacement
Hot gas path inspection
BoilermaintenanceBoilermaintenance
Boilermaintenance, turbine valve maintenance
Boilermaintenance, catalystreplacement
BoHer maintenance, turbine valve maintenance
Boilermaintenance
Boilermaintenance, turbine valve maintenance
Borescope inspectionBorescope inspection, catalystreplacement
Borescope inspection
BoilermaintenanceBoilermaintenance
BoilermaintenanceBoilermaintenance
Borescope inspection
Borescope inspection, balanceof plantmaintenance,turbinevalve maintenance(seriesof derates)
Boiler maintenanceBoilermaintenanceBoilermaintenance, turbine valve maintenance

Co
nfi
de
nti
alI
nfo
rma
tio
nR
edac
ted
VIR
GIN
IAE
LEC
TR
ICA
ND
PO
WE
RC
OM
PA
NY
JUL
Y20
15-J
UN
E20
16E
QU
IVA
LEN
TF
OR
CE
DO
UT
AG
ER
AT
E(%
)
P~M
UnK
ALT
AV
IST
A1
BE
AR
GR
DN
1
BE
LLM
EA
D1
BR
EM
O3
BR
EM
O4
BR
UN
SW
ICK
1C
HE
ST
FLD
3C
HE
ST
FLD
4C
HE
ST
FLD
5C
HE
ST
FLD
6C
HE
ST
FLD
7C
HE
ST
FLD
8C
LOV
ER
1C
LOV
ER
2G
OR
DO
N1
GO
RD
ON
2
HO
PE
WE
LL1
ME
CK
BU
RG
1
ME
CK
BU
RG
2
MT
ST
OR
M1
MT
ST
OR
M2
MT
ST
OR
M3
NA
NN
A1
NA
NN
A2
PIT
TS
YlIM
UL
TI
1
PO
SS
UM
3
PO
SS
UM
4
PO
SS
UM
5
PO
SS
UM
6
RO
SE
MA
RY
1
SO
UT
HA
MP
TO
N1
SU
RR
Y1
SU
RR
Y2
VC
HE
C1
WA
RR
EN
1
YO
RK
TW
N1
YO
RK
TW
N2
YO
RK
TW
N3
Not
e:In
the
mod
el,
eq
uiv
ale
ntf
orce
dou
tage
rate
incl
ud
es
both
eq
uiv
ale
nt
forc
edan
dm
ain
ten
an
ceou
tage
hour
s.
o o 3 <:J '":::> '< m
§~
-0(/
):::
>'2
:Q
)()
(l)
......
.<
0zr
(I)
ZCD~
~0
;:::[;.
G"l,'
...,C
D»
~~A

VIR
GIN
IAE
LE
CT
RIC
AN
DP
OW
ER
CO
MP
AN
YJU
LY
2015
-JU
NE
2016
FO
RE
CA
ST
ED
OF
F-S
YS
TE
MS
ALE
SM
AR
GIN
S
Jul-
15
Au
g-1
5S
ep-1
5O
ct-1
5N
ov-
15
Dec
-15
Jan
-16
Feb
-16
Mar
-16
Ap
r-1
6M
ay-1
6Ju
n-1
6T
OT
AL
Sal
esV
olu
me
(MW
h)47
,891
73,1
2951
,424
84,9
3241
,401
1,49
118
,037
26,7
0618
,542
18,6
7854
,717
42,4
4247
9,39
0S
ales
Re
ven
ue
($)
2,69
5,54
83,
734,
867
3,04
0,47
44,
282,
095
2,54
6,84
967
,700
4,72
6,37
91,
417,
695
1,31
4,96
397
8,15
52,
849,
740
2,33
4,44
129
,988
,905
Co
stof
Sal
es($
)2,
012,
651
2,76
2,92
12,
223,
519
3,04
3,94
91,
731,
289
52,9
422,
639,
431
1,11
2,92
674
3,80
573
1,05
02,
151,
579
1,77
5,73
120
,981
,791
Ma
rgin
($)
682,
897
971,
946
816,
955
1,23
8,14
681
5,56
114
,758
2,08
6,94
830
4,76
957
1,15
824
7,10
469
8,16
255
8,71
09,
007,
114
Ma
rgin
(75%
)($
)51
2,17
372
8,96
061
2,71
692
8,61
061
1,67
011
,069
1,56
5,21
122
8,57
742
8,36
918
5,32
852
3,62
141
9,03
26,
755,
335
Co
stof
Sal
esp
lus
75%
Ma
rgin
($)
2,52
4,82
43,
491,
881
2,83
6,23
53,
972,
558
2,34
2,95
964
,010
4,20
4,64
21,
341,
502
1,17
2,17
491
6,37
92,
675,
200
2,19
4,76
327
,737
,127
o o 3 "D ill
:::J
'< m
~~
-0(f
):::
J__
OJ
(')CD
...-
(0
:::re
nZ
CD~~!=,
~cG)
8,10
»1~<.nA

Co
nfi
de
nti
alI
nfo
rma
tio
nR
edac
ted
VIR
GIN
IAE
LEC
TR
ICA
ND
PO
WE
RC
OM
PA
NY
JUL
Y20
15-J
UN
E20
16F
OR
EC
AS
TE
DF
UE
LR
EQ
UIR
EM
EN
TS
(MB
TU
)
Pla
nt
AL
TA
VIS
TA
BE
AR
GR
DN
BE
LLM
EA
DB
RE
MO
BR
EM
OB
RU
NS
WIC
KC
HE
ST
FL
DC
HE
ST
FL
DC
HE
ST
FL
DC
HE
ST
FLD
CH
ES
TF
LDC
HE
ST
FLD
CLO
VE
RC
LOV
ER
GO
RD
ON
GO
RD
ON
HO
PE
WE
LL
ME
CK
BU
RG
ME
CK
BU
RG
MT
ST
OR
MM
TS
TO
RM
MT
ST
OR
MN
AN
NA
NA
NN
AP
ITT
SY
UM
ULT
IP
OS
SU
MP
OS
SU
MP
OS
SU
MP
OS
SU
MR
OS
EM
AR
YS
OU
TH
AM
PT
ON
SU
RR
YS
UR
RY
VC
HE
CW
AR
RE
NY
OR
KT
WN
YO
RK
TW
NY
OR
KT
WN
Un
it1 1 1 3 4 1 3 4 5 6 7 8 1 2 1 2 1 1 2 1 2 3 1 2 1 3 4 5 6 1 1 1 2 1 1 1 2 3
Jul-
15
Oct
-15
No
v-1
5D
ec-1
5Ja
n-1
6F
eb-1
6M
ar-1
6Ju
n-1
6T
OT
AL
o o 3 "0 Q.) ::J '<; m
~~
~~~g
(Q::
:rcn
zCD~~O
;;S
oGl,
'...
,CD
»~O)A

Pla
nt
ALT
AV
IST
AB
EA
RG
RD
NB
ELL
ME
AD
BR
EM
OB
RE
MO
BR
UN
SW
IKC
HE
ST
FLD
CH
ES
TF
LDC
HE
ST
FLD
CH
ES
TF
LDC
HE
ST
FLD
CH
ES
TF
LDC
LOV
ER
CLO
VE
RG
OR
DO
NG
OR
DO
NH
OP
EW
EL
LM
EC
KB
UR
GM
EC
KB
UR
GM
TS
TO
RM
MT
ST
OR
MM
TS
TO
RM
NA
NN
AN
AN
NA
PIT
TS
YLI
MU
LT
IP
OS
SU
MP
OS
SU
MP
OS
SU
MP
OS
SU
MR
OS
EM
AR
YS
OU
TH
AM
PT
ON
SU
RR
YS
UR
RY
VC
HE
CW
AR
RE
NY
OR
KT
WN
YO
RK
TW
NY
OR
KT
WN
Un
it1 1 1 3 4 1 3 4 5 6 7 8 1 2 1 2 1 1 2 1 2 3 1 2 1 3 4 5 6 1 1 1 2 1 1 1 2 3
Co
nfi
de
nti
alI
nfo
rma
tio
nR
edac
ted
VIR
GIN
IAE
LE
CT
RIC
AN
DP
OW
ER
CO
MP
AN
YJ
UL
Y20
15-
JUN
E20
16F
OR
EC
AS
TE
DH
EA
TR
AT
ES
(BT
UI
KW
H)
o o 3 1:l OJ
:::J
'< m~~
"UU
J:::
J2
:w
Oco
........
<O
:Tcn
z(1)~~9
~c(j)
s'iD
J>1
~-.JA

VIR
GIN
IAE
LE
CT
RIC
AN
DP
OW
ER
CO
MP
AN
YF
EB
2015
-JU
N20
15
SY
ST
EM
EN
ER
GY
(MW
H)
Co
mb
ine
dC
om
bu
stio
nH
ydro
&P
ow
er
Nu
cle
ar
Coa
lB
iom
ass
He
avy
Oil
Ste
amG
asC
ycle
Tu
rbin
eB
ath
Co.
So
lar
NU
GP
urc
ha
ses
Sal
esF
TR
sT
otal
Fe
b-1
52
,29
2,3
62
2,4
72
,52
91
31
,78
835
,871
1,3
75
,44
54
4,6
07
24
,14
668
91
,16
2,7
46
71,6
01(1
68
,30
5)
7,4
43
,47
7M
ar-
15
2,0
76
,35
61
,63
3,4
30
73
,22
712
5,09
11,
579,
841
15
0,1
03
30,9
1387
68
26
,53
59
79
,20
6(7
3,3
44
)7
,40
2,2
34
Ap
r-1
52,
112,
701
49
7,0
72
66
,95
61
68
,13
79
07
,67
83
86
,32
93
7,6
74
964
50
3,3
26
1,8
96
,68
76
,57
7,5
24
Ma
y-1
51
,83
0,4
78
1,3
24
,82
59
6,2
08
64,1
212
,07
4,9
40
23
0,8
67
1,43
598
85
17
,55
69
13
,07
9(1
2,8
49
)7
,04
1,6
47
Jun
-15
2,3
43
,01
32
,08
5,7
49
11
4,9
45
141,
611
63
,56
62
,00
8,1
04
20
3,9
67
(18
,86
9)
1,48
67
97
,50
83
19
,65
5(8
3,2
29
)7
,97
7,5
06
To
tal
10
,65
4,9
09
8,0
13
,60
64
83
,12
214
1,61
14
56
,78
57
,94
6,0
08
1,0
15
,87
375
,300
3,80
7,67
14
,18
0,2
28
(33
7,7
28
)3
6,4
42
,38
9
SY
ST
EM
FU
EL
EX
PE
NS
E($
000)
Co
mb
ine
dC
om
bu
stio
nH
ydro
&P
ow
er
Nu
cle
ar
Coa
lB
iom
ass
He
avy
Oil
Ste
amG
asC
ycle
Tu
rbin
eB
ath
Co.
So
lar
NU
GP
urc
ha
ses
Sal
esF
TR
sT
otal
Fe
b-1
515
,100
75
,47
75,
952
01,
772
56,5
193,
387
32,3
033,
345
(7,8
34
)(1
,02
5)
18
4,9
97
Ma
r-1
513
,629
50
,00
63,
301
04
,05
648
,361
7,22
72
5,0
08
38,6
21(3
,78
2)
(629
)1
85
,80
0A
pr-
15
14,7
821
5,9
69
3,03
30
4,9
16
32
,35
212
,321
16
,67
96
3,7
07
(170
)1
63
,58
8M
ay-
15
12,9
2541
,041
4,33
20
1,83
35
3,0
59
7,49
71
7,3
29
29
,90
0(6
64)
(399
)1
66
,85
3Ju
n-1
516
,739
64
,03
95,
069
17
,83
71,
863
50
,59
95,
967
21
,73
21
0,6
90
(3,6
36
)(7
14)
19
0,1
84
To
tal
73,1
7524
6,53
12
1,6
87
17,8
381
4,4
39
24
0,8
90
36
,40
01
13
,05
21
46
,26
3(1
5,9
17
)(2
,93
7)
891,
421
Fe
bru
ary
Ad
just
me
nt
83
,50
0
AV
ER
AG
EC
OS
T($
PE
RM
WH
)
Co
mb
ine
dC
om
bu
stio
nH
ydro
&P
ow
er
Nu
cle
ar
Coa
lB
iom
ass
He
avy
Oil
Ste
am
Gas
Cyc
leT
urb
ine
Bat
hC
o.S
ola
rN
UG
Pu
rch
ase
sS
ales
FT
Rs
To
tal
Feb
-15
6.59
30.5
34
5.1
7N/
A49
.39
41
.09
75.9
20.
000.
0027
.78
46.7
24
6.5
524
.85
Ma
r-1
56.
5630
.61
45
.09
N/A
32.4
330
.61
48.1
50.
000.
0030
.26
39.4
451
.56
25.1
0A
pr-
15
7.00
32.1
34
5.2
9N
/A29
.24
35.6
431
.89
0.00
0.00
33.1
433
.59
N/A
24.8
7M
ay-
15
7.06
30.9
845
.02
N/A
28.5
825
.57
32.4
733
.48
32.7
551
.71
23.7
0Ju
n-1
57.
1430
.70
44
.10
125.
9629
.30
25.2
029
.26
27
.25
33.4
44
3.6
923
.84
0 0T
ota
l6.
8730
.76
44
.89
125.
9731
.61
30.3
235
.83
29.6
934
.99
47.1
324
.46
3 '0 0> ::J -cS
yste
mfu
elco
stin
clu
din
gD
OE
ad
just
me
nt
26.7
5m
~~
NO
TE
S:
Hyd
ro&
Bat
hC
o.M
Wh
are
net
ofp
um
pin
ge
ne
rgy
;?W~g
~~
~z
'Co
mb
ine
dC
ycle
'Exp
en
sein
clu
de
sga
sp
ipe
line
fixed
exp
en
ses
~a.
...
0
'Po
we
rS
ale
s'E
xpe
nse
incl
ud
e75
%m
arg
ins
for
ap
plic
ab
leo
ff-s
yste
msa
les
os,
01'__
CD»
~O>A

Company Exhibit No,_Witness: GAK
VIRGINIA ELECTRIC AND POWER COMPANY Schedule 9FEB 2014 - JAN 2015 Page 1 of 1
LOAD AND SALES (MWH)
ACTUALS
System Total VirginiaEnergy System Jurisdictional
Requirement Sales SalesFeb-14 7,191,157 6,906,552 5,572,556Mar-14 7,338,494 7,107,876 5,664,511Apr-14 5,767,342 5,640,566 4,387,043May-14 6,343,762 6,234,799 4,857,503Jun-14 7,302,618 7,074,620 5,625,752Jul-14 7,800,658 7,655,579 6,112,948Aug-14 7,337,155 7,239,650 5,751,231Sep-14 6,578,998 6,506,842 5,099,123Oct-14 5,851,413 5,904,444 4,620,184Nov-14 6,452,389 6,449,725 5,167,762Dec-14 7,292,343 7,118,281 5,764,327Jan-15 8,126,235 7,815,019 6,351,820
Total 83,382,563 81,653,952 64,974,761
FORECASTED
System Total VirginiaEnergy System Jurisdictional
Requirement Sales SalesFeb-14 7,202,360 7,055,159 5,706,830Mar-14 7,227,282 6,959,859 5,608,759Apr-14 6,537,085 6,097,431 4,826,369May-14 6,971,141 6,623,088 5,253,980Jun-14 8,085,379 7,626,296 6,136,744Jul-14 8,513,885 8,175,268 6,500,827Aug-14 8,285,203 7,940,791 6,293,166Sep-14 7,027,000 6,717,159 5,208,752Oct-14 6,484,937 6,149,802 4,748,672Nov-14 6,516,652 6,213,734 4,857,730Dec-14 8,080,343 7,728,934 6,164,861Jan-15 8,579,302 8,193,087 6,594,163
Total 89,510,569 85,480,607 67,900,853
VARIANCE
System Total VirginiaEnergy System Jurisdictional
Requirement Sales SalesFeb-14 (11,203) (148,607) (134,274)Mar-14 111,212 148,017 55,752Apr-14 (769,742) (456,865) (439,326)May-14 (627,379) (388,290) (396,476)Jun-14 (782,761) (551,676) (510,992)Jul-14 (713,227) (519,689) (387,879)Aug-14 (948,048) (701,141) (541,935)Sep-14 (448,002) (210,317) (109,629)Oct-14 (633,524) (245,358) (128,488)Nov-14 (64,262) 235,991 310,032Dec-14 (788,001) (610,653) (400,534)Jan-15 (453,067) (378,068) (242,343)
Total (6,128,006) (3,826,655) (2,926,092)

Company Exhibit No._Witness: GAKSchedule 10Page 1 of 1
VIRGINIA ELECTRIC ANO POWER COMPANYFEB 2014 - JAN 2015
SYSTEM ENERGY (MWH)
Combined Combustion Hydro & PowerNuclear Coal Biomass Heavy Oil Steam Gas ~ Turbine Bath Co. Solar NUG Purchases Sales FTRs Total
Feb-14 2,297,732 2,683,504 69,276 870,892 30,678 63,447 1,052,757 196,717 (73,846) 7,191,157Mar-14 2,514,971 1,913,849 101,601 16,766 782,933 87,340 57,921 898,608 1,038,813 (74,309) 7,338,494
Apr-14 2,263,789 1,075,089 57,460 31,510 533,352 16,991 116,652 483,578 1,206,618 (17,695) 5,767,342May-14 2,109,033 1,644,799 48,162 27,829 950,551 132,351 83,195 604,021 823,977 (80,156) 6,343,762Jun-14 2,440,051 2,393,763 111,161 53,519 984,832 183,228 (17,573) 721,018 540,740 (108,121) 7,302,618Jul-14 2,509,619 2,359,258 105,756 71,302 72,356 1,003,221 267,412 (33,375) 41 669,404 865,056 (89,392) 7,800,658Aug-14 2,517,150 2,501,811 125,938 42,427 51,698 987,192 231,858 (44,553) 83 611,015 499,191 (186,654) 7,337,155
Sep-14 1,957,945 1,765,630 94,469 35,283 890,609 122,272 (7,204) 69 610,977 1,157,439 (48,490) 6,578,998
Oct-14 2,272,012 1,701,514 106,188 56,005 550,815 23,986 4,417 71 498,478 689,893 (51,966) 5,851,413Nov-14 2,504,469 2,184,020 101,203 27,744 1,296,647 13,037 (25,855) 47 587,584 (201,586) (34,921) 6,452,389Oec-14 2,398,356 2,317,608 112,368 206 33,571 1,635,684 32,154 53,865 37 726,517 63,814 (81,838) 7,292,343Jan-15 2,542,760 2,480,552 116,628 45,756 63,509 1,759,442 35,511 55,491 39 868,362 202,047 (43,863) 8,126,235
Total 28,327,887 25,021,398 1,150,209 159,691 469,790 12,246,171 1,176,818 306,428 386 8,332,319 7,082,719 (891,251) 83,382,563
SYSTEM FUEL EXPENSE ($000)
Combined Combustion Hydro & PowerNuclear Coal Biomass Heavy Oil SteamGas ~ Turbine Bath Co. Solar NUG Purchases Sales FTRs Total
Feb-14 16,998 90,770 4,337 16 (887) 56,099 4,550 47,868 4,338 (4,990) (59) 219,039Mar-14 18,705 66,215 5,868 13 856 40,132 9,417 38,306 96,444 (3,805) (6,044) 266,107Apr-14 16,639 34,988 3,893 418 20,991 930 27,170 46,992 (550) (957) 150,512May-14 14,967 49,930 2,832 762 35,717 3,704 29,292 46,313 (8,075) (24) 175,417Jun-14 17,104 80,266 5,747 2,327 37,534 8,177 28,821 24,002 (3,906) 8,270 208,343Jul-14 16,856 75,485 5,262 11,420 3,489 36,027 13,655 25,978 33,247 (2,689) (11) 218,720Aug-14 16,951 78,728 5,805 5,206 2,488 31,582 8,563 24,059 14,750 (6,079) (905) 181,148Sep-14 12,895 57,558 4,344 1,658 27,785 3,782 24,092 44,417 (1,419) (2,787) 172,325Oct-14 16,899 53,995 4,979 (752) 2,563 12,534 2,249 19,795 32,516 (1,441) (1,255) 142,083Nov-14 17,259 69,540 4,761 1,646 29,217 1,934 25,968 9,478 (1,278) (543) 157,982Oec-14 15,497 74,592 5,700 262 2,422 45,999 2,547 27,287 14,454 (2,986) 16 185,790Jan-15 16,809 77,663 6,281 9,088 3,301 79,159 3,880 34,490 15,876 (1,589) (32) 244,926
Total 197,579 809,729 59,807 25,252 21,043 452,775 63,388 353,127 382,828 (38,806) (4,331) 2,322,393
AVERAGE COST ($ PER MWH)
Combined Combustion Hydro & PowerNuclear Coal Biomass Heavy Oil Steam Gas ~ Turbine Bath Co. Solar NUG Purchases Sales FTRs Total
Feb-14 7.40 33.83 62.60 N/A N/A 64.42 148.33 45.47 22.05 67.57 30.46Mar-14 7.44 34.60 57.75 N/A 51.03 51.26 107.82 42.63 92.84 51.21 36.26Apr-14 7.35 32.54 67.75 N/A 13.28 39.36 54.72 56.18 38.95 31.09 26.10May-14 7.10 30.36 58.79 N/A 27.38 37.57 27.99 48.49 56.21 100.74 27.65Jun-14 7.01 33.53 51.70 N/A 43.48 38.11 44.63 39.97 44.39 36.13 28.53Jul-14 6.72 32.00 49.76 160.16 48.22 35.91 51.06 38.81 38.43 30.08 28.04Aug-14 6.73 31.47 46.09 122.70 48.13 31.99 36.93 39.38 29.55 32.57 24.69Sep-14 6.59 32.60 45.98 N/A 46.99 31.20 30.93 39.43 38.38 29.25 26.19Oct-14 7.44 31.73 46.88 N/A 45.77 22.76 93.78 39.71 47.13 27.72 24.28Nov-14 6.89 31.84 47.05 N/A 59.33 22.53 148.33 44.19 -47.02 36.60 24.48Oec-14 6.46 32.19 50.73 N/A 72.14 28.12 79.20 37.56 226.51 36.49 25.48Jan-15 6.61 31.31 53.85 198.63 51.98 44.99 109.26 39.72 78.57 36.24 30.14
Total 6.97 32.36 52.00 158.13 44.79 36.97 53.86 42.38 54.05 43.54 27.85
NOTES:Hydro& BathCo. MWh are net of pumpingenergy'CombinedCycle'Expenseincludes gas pipelinefixedexpenses'Combustion Turbine'actualexpensesincludegas pipeline fixedexpenses'PowerSales' Expenseincludes 75% marginsfor applicable Off-system salesData includes the impactof Warren testing (fuelexpensewenttocapitalproject)

Confidential Information Redacted
VIRGINIA ELECTRIC AND POWER COMPANYFEB 2014 - JAN 2015
Fossil & Hydro and Nuclear Unit Performance
EquivalentAvailability Capacity
Unit Rate Factor(%) (%)
NorthAnna 1 97.2 99.6North Anna 2 90.3 91.9Surry 1 100.0 103.1Surry 2 89.0 91.8
Altavista-Biomass 57.0 52.5
Bear Garden 80.5 63.0
Bellemeade 70.4 9.6
Bremo 3 - CoalBremo4 - Coal
Bremo 3- Gas 72.8 32.9Bremo4 - Gas 61.3 16.3
Chesapeake 1 90.6 18.7Chesapeake 2 83.6 17.6Chesapeake 3 81.3 34.5Chesapeake 4 89.3 25.7
Chesterfield 3 80.9 11.5
Chesterfield 4 91.6 65.5
Chesterfield 5 78.3 65.4
Chesterfield 6 73.3 58.9
Chesterfield 7 79.2 79.6
Chesterfield 6 60.5 63.2
Clover 1 92.7 80.3Clover2 80.1 67.6
Gordonsville 1 74.6 20.2
Gordonsville 2 66.3 42.8
Hopewell 70.6 59.1Hopewell-Biomass
Mecklenburg 1 94.6 38.1Mecklenburg 2 91.3 33.9
MtStorm 1 91.4 77.2
MtStorm 2 74.2 61.1
MtStorm 3 83.2 71.6
PiUsylvania 91.7 44.9
PossumPoint3 75.3 0.7
PossumPoint4 62.3 1.9
PossumPoint5 30.5 1.3
PossumPoint6 83.5 70.3
Rosemary 76.3 2.5
Southampton 71.4 56.4
VCHEC 74.1 66.0
Yorktown 1 67.2 27.5
Yorktown 2 72.6 30.8
Yorktown 3 28.4 1.1
Company Exhibit No._
Witness: GAKSchedule 11Page 1 of 1
Refueling Outage
Refueling Outage
BollermaintenanceBoilermaintenance, turbine overhaul
HotgaspathinspectionBorescope inspection
Borescope inspectionGeneratorrewind, borescopeInspection,HRSG maintenance, turbinevalve maintenance
Gas ConversionGas Conversion
BoilermaintenanceTurbinevalve maintenance
Boilermaintenance
BoilermaintenanceBoilermaintenanceBoilermaintenance
Hotgas path inspection, borescopeinspection,steamturbine valve maintenance, balanceof plantmaintenance
BoilermaintenanceTurbinevalve maintenanceBoilermaintenance
Hot gas pathinspectionGeneratorrewind
Electric transmission workHot gas pathinspection
Turbinevalve maintenanceBalanceof plantmaintenance, warranty workBoilermaintenance
Generatorinspection
Boilermaintenance
Boilermaintenance
Boilermaintenance
BoilermaintenanceBoilermaintenance
BoilermaintenanceBoilermaintenance, ductwork replacementBoilermaintenanceTurbinevalve maintenanceBalanceof plantmaintenanceDuctwork replacementBorescope inspectionBorescope inspection
Turbinevalve maintenanceHRSG maintenance
Turbinevalve maintenanceBoilermaintenance
BoilermaintenanceBoilermaintenance
BoilermaintenanceBoilermaintenanceBalanceof plantmaintenanceBalanceof plantmaintenanceGeneratorinspectionBoilermaintenance, controls upgrade

Pla
ntU
nit
ALT
AV
IST
1B
EA
RG
AR
DE
I1
BE
LLM
EA
D1
BR
EM
O3
BR
EM
O4
CH
ES
PE
AK
1C
HE
SP
EA
K2
CH
ES
PE
AK
3C
HE
SP
EA
K4
CH
ES
TF
LD3
CH
ES
TF
LD4
CH
ES
TF
LD5
CH
ES
TF
LD6
CH
ES
TF
LD7
CH
ES
TF
LD8
CLO
VE
R1
CLO
VE
R2
GO
RD
ON
1G
OR
DO
N2
HO
PE
WE
LL1
ME
CK
BU
RG
1M
EC
KB
UR
G2
MT
ST
OR
M1
MT
ST
OR
M2
MT
ST
OR
M3
PIT
TS
/MU
LTI
1N
AN
NA
1N
AN
NA
2P
OS
SU
M3
PO
SS
UM
4P
OS
SU
M5
PO
SS
UM
6R
OS
EM
AR
Y1
SO
UT
HA
MP
1S
UR
RY
1S
UR
RY
2V
CH
EC
1W
AR
RE
N1
YO
RK
TW
N1
YO
RK
TW
N2
YO
RK
TW
N3
Co
nfi
de
nti
alI
nfo
rma
tio
nR
edac
ted
VIR
GIN
IAE
LEC
TR
ICA
ND
PO
WE
RC
OM
PA
NY
FE
B20
14-
JAN
2015
AC
TU
AL
FU
EL
RE
QU
IRE
ME
NT
S(M
BT
U)
o o 3 "0 OJ
::J '< m(j)§~
~g.ffig
(Q
C1
>",z
CDg.~O
;CD° 1'
-~»
~t\.);:>;

Co
nfi
de
nti
alI
nfo
rma
tio
nR
edac
ted
FE
B20
14-
JAN
2015
EQ
UIV
AL
EN
TF
OR
CE
DO
UT
AG
ER
AT
E(%
)
Pla
nt
Un
itA
LTA
VIS
T1
BE
AR
GA
RD
EN
1B
ELL
ME
AD
1B
RE
MO
3B
RE
MO
4C
HE
SP
EA
K1
CH
ES
PE
AK
2C
HE
SP
EA
K3
CH
ES
PE
AK
4C
HE
ST
FLD
3C
HE
ST
FLD
4C
HE
ST
FLD
5C
HE
ST
FLD
6C
HE
ST
FLD
7C
HE
ST
FLD
8C
LOV
ER
1C
LOV
ER
2G
OR
DO
N1
GO
RD
ON
2H
OP
EW
ELL
1M
EC
KB
UR
G1
ME
CK
BU
RG
2M
TS
TO
RM
1M
TS
TO
RM
2M
TS
TO
RM
3P
ITT
S/M
ULT
I1
NA
NN
A1
NA
NN
A2
PO
SS
UM
3P
OS
SU
M4
PO
SS
UM
5P
OS
SU
M6
RO
SE
MA
RY
1S
OU
TH
AM
P1
SU
RR
Y1
SU
RR
Y2
VC
HE
C1
WA
RR
EN
1Y
OR
KT
WN
1Y
OR
KT
WN
2Y
OR
KT
WN
3
Feb
-14
Mar
-14
Jun
-14
Jul-
14O
ct-1
4N
ov-
14D
ec-1
4Ja
n-1
5P
erio
d
o o 3 "0 ill
:::l
-c m(J)§~
~g.ffig
<O
CD
u>
ZcPg-~o
~CD° 1"
....,~»
~WA
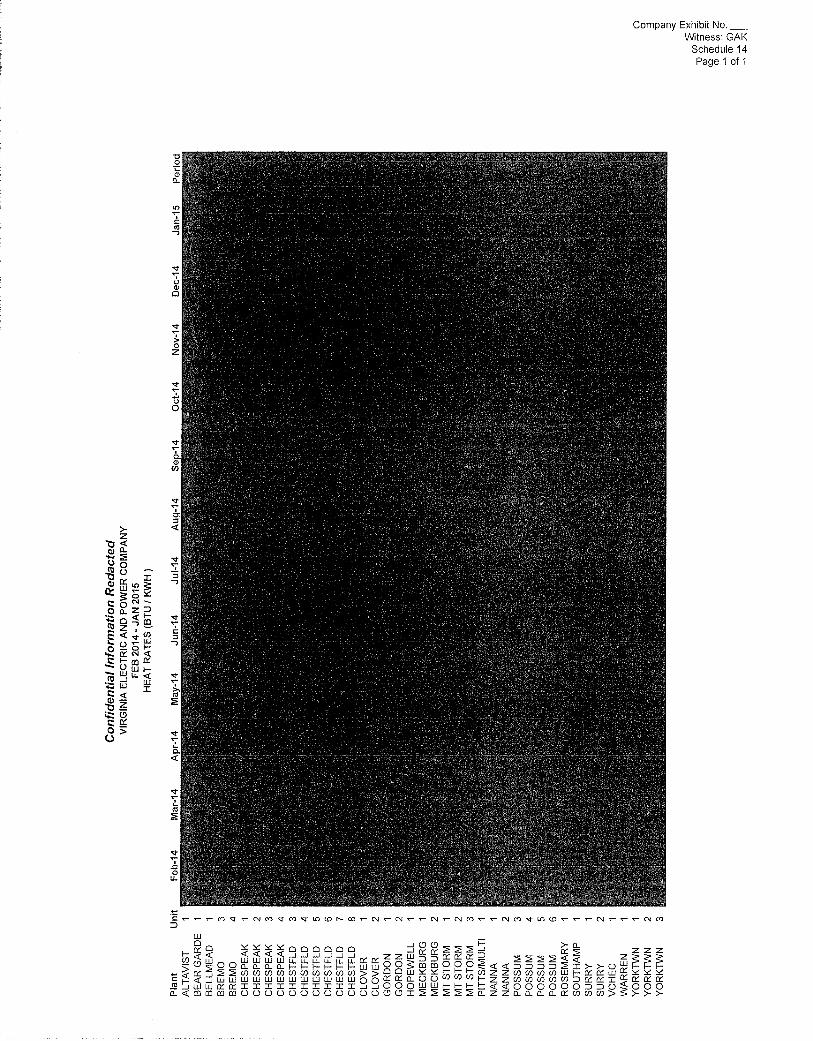
Pla
nt
Un
itA
LTA
VIS
T1
BE
AR
GA
RD
E1
BE
LLM
EA
D1
BR
EM
O3
BR
EM
O4
CH
ES
PE
AK
1C
HE
SP
EA
K2
CH
ES
PE
AK
3C
HE
SP
EA
K4
CH
ES
TF
LD3
CH
ES
TF
LD4
CH
ES
TF
LD5
CH
ES
TF
LD6
CH
ES
TF
LD7
CH
ES
TF
LD8
CLO
VE
R1
CLO
VE
R2
GO
RD
ON
1G
OR
DO
N2
HO
PE
WE
LL1
ME
CK
BU
RG
1M
EC
KB
UR
G2
MT
ST
OR
M1
MT
ST
OR
M2
MT
ST
OR
M3
PIT
TS
/MU
LTI
1N
AN
NA
1N
AN
NA
2P
OS
SU
M3
PO
SS
UM
4P
OS
SU
M5
PO
SS
UM
6R
OS
EM
AR
Y1
SO
UT
HA
MP
1S
UR
RY
1S
UR
RY
2V
CH
EC
1W
AR
RE
N1
YO
RK
TW
N1
YO
RK
TW
N2
YO
RK
TW
N3
Co
nfi
de
nti
alI
nfo
rma
tio
nR
edac
ted
VIR
GIN
IAE
LEC
TR
ICA
ND
PO
WE
RC
OM
PA
NY
FE
B20
14•
JAN
2015
HE
AT
RA
TE
S(B
TU
IK
WH
)
o o 3 "0 OJ
:::J
-c m-S
:x(j)~~
""O
o::
:JC
YO
,)::
:J"C
D;:
+(O
ro"'
zCDg~o
;;CD
GJ
1'-+>~»
~~A

North Anna Unit 1
Chesterfield 3
Chesterfield 7
Chesterfield 8
VIRGINIA ELECTRIC AND POWER COMPANYFEB 2014 -JAN 2015
Fossil & Hydro and Nuclear Unit Performance
ABNORMAL OPERATING EVENTSConfidential Information Redacted
Start Date End Date Duration (Days)
Company Exhibit No._Witness: GAKSchedule 15Page 1 of 1
Description
Manual Shutdown to repair RC leakage in containment sump level.
Offline due to a grounding issue in generator rotor
Offline due to a failure in the combustion zone centering around combustion lid #7. Thegas line as well as the lid's as flange failed.
Offline due to failure of atomizing air flexible metal hose, causing damage to thecombustion lids.

~o;;0
"s:»z

1 Q.
2 A.
3
4
5
6
7
8
9 Q.
10 A.
11
12
13
14
15
16
17
18
DIRECT TESTIMONYOF
GREGORY A. WORKMANON BEHALF OF
VIRGINIA ELECTRIC AND POWER COMPANYBEFORE THE
STATE CORPORATION COMMISSION OF VIRGINIACASE NO. PUE-2015-00022
Please state your name, business address, and position of employment.
My name is Gregory A. Workman, and my business address is 120 Tredegar Street,
Richmond, Virginia 23219. I am the Director-Fuels and have the responsibility of fuel
procurement for Virginia Electric and Power Company ("Dominion Virginia Power" or
the "Company"). The Dominion Fuels group handles the procurement, scheduling,
transportation, and inventory management for coal, natural gas, oil, and biomass
consumed at the Company's power stations. A statement of my background and
qualifications is attached as Appendix A.
What is the purpose of your testimony in this proceeding?
I will discuss the Company's fossil fuel procurement practices, as well as any recent
changes to those practices for delivery of fuels to the Company's fossil generation fleet.
Such procurement practices impact the forward calculation of the Company's system fuel
expenses, which Company Witness Glenn A. Kelly has incorporated in his fuel expense
projections for both the prior (July 1,2014 to June 30, 2015) and current (July 1,2015 to
June 30, 2016) fuel factor periods.
My testimony is divided into five sections. The first section will discuss the overall fuel
markets, and Section II will cover coal procurement and coal contracts. Section III will
address natural gas procurement and transportation, while Section IV will discuss the

2
34
5
6
Q.
Company's oil procurement methods. Finally, Section V will discuss the procurement of
biomass (i.e., wood chips) as fuel for consumption at the Company's power stations.
SECTION IFUEL MARKETS
Please discuss the trends that affected commodity markets during the period of July
2014 through January 2015.
7 A.
8
9
10
11
12
13
14
15
16
17
18
19
20
21
22
Coal prices continue to decline, despite power plant coal inventories being less than the
historical five-year average. Historically, lower inventories would tend to push coal
prices higher. However, coal markets have been fundamentally changed due to the
unprecedented productivity witnessed in the shale gas production regions. The abundant
availability of competitively priced shale gas provides economic incentive for utilities to
switch fuels from coal to natural gas. This phenomenon results in lower coal demand for
power generation. In addition, a weak export market for both thermal and metallurgical
coal has increased coal supplies for domestic power generation. The combination of
coal-to-gas fuel switching and weak export markets have driven coal supplies higher,
thereby reducing prices.
Natural gas prices have declined significantly. This is attributed to a continued increase
in gas production, particularly from the Marcellus shale region. Lower natural gas prices
will favor gas-fired power generation, putting downward pressure on coal prices.
The significant decline in No.2 and No.6 oil prices is the direct result of falling crude oil
prices in global markets. Increased production from domestic shale oil production as
well as OPEC's recent decisions not to reduce production have led to a worldwide
2

2
3456 Q.
7 A.
8
9
10
11
12
13
14
15
16 Q.
17 A.
18
19
20
21
22
oversupply of oil and petroleum products. As a result, West Texas Intermediate crude
prices have dropped to well below $50/bbl, a pricing level not seen since 2009.
SECTIONHCOAL PROCUREMENT
Please discuss the Company's coal procurement practices.
The Company employs a multi-year coal physical hedge procurement plan to ensure a
reliable supply of coal at competitive prices. This is accomplished by procuring the
Company's long-term coal requirements primarily under periodic solicitations and
secondarily on the open market for its short-term or spot needs. In addition to the
contracts executed as a result of normal solicitations, the Company continually evaluates
prevailing market conditions and may enter into other transactions if conditions are
favorable. The effect of procuring both long- and short-term provides a layering in of
contracts with staggered terms and blended prices. This ensures a reliable supply of fuel
with limited exposure to dramatic market price swings.
How is coal delivered to the Company's generating facilities?
The Company utilizes a combination of train and truck transportation to supply fuel to its
coal fired generating stations. The Clover Power Station, Mecklenburg Power Station,
Mt. Storm Power Station, Chesterfield Power Station, and Yorktown Power Station
receive coal via rail delivery. Mt. Storm also receives a portion of its coal deliveries via
truck, while truck coal comprises 100% of coal deliveries to the Virginia City Hybrid
Energy Center ("VCHEC").
3

12
3 Q.
4 A.
5
6
7
8
9
10
11
12
13
14
15
16
17 Q.
18 A.
19
20
21
22
23
SECTION IIIGAS PROCUREMENT
Please discuss the Company's gas procurement practices.
With the addition of Warren County Power Station and Bremo Power Station to the gas-
fired generation fleet in 2014, the Company transitioned from a predominantly day-ahead
procurement approach to a program that includes day-ahead, monthly, and seasonal
purchases. Similar to our coal procurement practices, the Company utilizes periodic
solicitations and the open market to procure physical gas to meet station requirements.
The Company also entertains and evaluates opportunities as market conditions change.
The Company evaluates its diverse portfolio of pipeline and storage contracts to
determine the most reliable and economical delivered fuel options available for each
power station. This portfolio of gas transportation contracts provides access to multiple
natural gas supply points from the Gulf region to the Marcellus shale region. In addition,
the Company actively participates in the interstate pipeline capacity release and physical
supply markets as well as longer-term, pipeline expansion projects that will augment the
transportation portfolio and enhance reliability at a reasonable cost.
Does the Company currently have a price hedging program?
Yes, the Company has historically followed its Marginal Fuel Hedging Program for
natural gas and purchased power. Under this program, the Company has hedged natural
gas using 25% of the forecasted volumes during the summer and winter months in the
low load case. In addition, the Company has hedged on-peak power using the forecasted
volumes for all 12 months in the low load case. As discussed by Company Witness
Steven A. Rogers, the Company intends to increase natural gas price hedging levels to
4

1
2
3
45
6 Q.
7 A.
8
9
10
11
12
1314
15 Q.
16 A.
17
18
19
20
21
22 Q.
23 A.
20% to 50% of forecasted volumes in the first year of a three-year period. Purchased
power volumes are expected to gradually decrease, but the Company will continue to
financially hedge a portion of these volumes when beneficial for customers.
SECTION IVOIL PROCUREMENT
Please discuss the Company's oil procurement practices.
The Company purchases its No.2 fuel oil and No.6 oil requirements on the spot market,
and optimizes its inventory, storage, and transportation to ensure reliable supply to its
power generating facilities. Trucks, vessels, barges, and pipelines are employed to
transport oil to the Company's stations and third-party storage locations. The Company
utilizes its own storage and third-party storage to ensure a reliable supply of oil, and to
mitigate the price risk associated with these potentially volatile products.
SECTION VBIOMASS PROCUREMENT
Please discuss the Company's biomass procurement practices.
The Company currently procures the majority of its wood chips and other woody material
for four biomass-fired plants (the Altavista and Pittsylvania Power Stations in the Central
Region, and the Hopewell and Southampton Power Stations in the Eastern Region) via
long-term contracts with two suppliers. Procurement for the Company's VCHEC facility
in the Western Region is conducted via short-term contracts with various suppliers. All
five biomass consuming plants receive wood deliveries via truck.
Does this conclude your pre-filed direct testimony?
Yes, it does.
5

APPENDIX A
BACKGROUND AND QUALIFICATIONSOF
GREGORYA.WORKMAN
Gregory A. Workman graduated from Fairmont State College in 1987 with a Bachelor of
Science degree in Business Administration and received a Master of Business Administration
degree from West Virginia University in 1988. He became an employee of Dominion in 2001
and has held various positions within the following departments: Business Development and
Acquisitions, Fossil and Hydro Merchant Operations, and Technical Services. In October 2007,
Mr. Workman assumed his current role as Director-Fuels. He currently serves on the National
Coal Council, a federal advisory committee to the U.S. Secretary of Energy.
Prior to joining Dominion, Mr. Workman worked for Norfolk Southern Corporation from
1990-2001. He served in various capacities at Norfolk Southern Corporation including:
Finance, Operations, Coal Marketing, and Strategic Planning. Prior to Norfolk Southern, he
worked as a Financial Consultant for American Express.
Mr. Workman has previously presented testimony before the State Corporation
Commission of Virginia, the North Carolina Utilities Commission, and the Federal Energy
Regulatory Commission.


1 Q.
2 A.
3
4
5
6
7
8
9 Q.
10 A.
11
12
13
14
15 Q.
16 A.
17
18
DIRECT TESTIMONYOF
TOM A. BROOKMIREON BEHALF OF
VIRGINIA ELECTRIC AND POWER COMPANYBEFORE THE
STATE CORPORATION COMMISSION OF VIRGINIACASE NO. PUE-2015-00022
Please state your name, business address, and position of employment.
My name is Tom A. Brookmire and I am the Supervisor of Nuclear Fuel Procurement.
My business address is 5000 Dominion Boulevard, Glen Allen, Virginia 23060. I am
responsible for activities pertaining to nuclear fuel procurement, nuclear fuel-related
project management, long-term nuclear spent fuel disposal, and nuclear fuel price
forecasting and budgeting used by Virginia Electric and Power Company ("Dominion
Virginia Power" or the "Company"). A statement of my background and qualifications is
attached as Appendix A.
What is the purpose of your testimony in this proceeding?
The purpose of my testimony is to review the Company's actual and projected nuclear
fuel costs for the prior period fuel factor of July 1,2014 through June 30, 2015, and to
provide projections for the current period of July 1,2015 through June 30, 2016. Section
I of my testimony will discuss the components of the Company's nuclear fuel costs, and
Section II will discuss the Company's nuclear fuel expense rates.
What is your responsibility in the development of the Company's fuel factor?
I am responsible for projecting the Company's nuclear fuel prices, which become the
basis for its projected nuclear fuel expense rates. These rates, along with projected costs
for interim spent fuel storage, are transmitted to the Generation System Planning group

1
2 Q.
3 A.
4
5
67
8 Q.
9 A.
10
11
12
13
14
15 Q.
16 A.
17
18
19
20
21
22
23
for use in calculating the Company's fuel factor and system fuel expenses.
During the course of your testimony, will you introduce an exhibit?
Yes. Company Exhibit No. __, TAB, consisting of Schedules 1 through 3, was
prepared under my supervision and direction, and is accurate and complete to the best of
my knowledge and belief.
SECTION ICHANGES IN NUCLEAR FUEL COST
What are the major components of nuclear fuel expense?
Nuclear fuel expenses include the amortized value of the cost for uranium, along with
required conversion, enrichment, and fabrication services (collectively called "front-end
components"). In addition, there are expenses for interim spent fuel dry storage.
Historically, there has also been the federal government's one mill/kWh charge for the
disposal of spent nuclear fuel. I will discuss the current status of this one mill/kWh
charge in Section II of my testimony.
What are the current market conditions for the front-end components?
The nuclear fuel market has softened considerably in the past five years. This is largely
due to the devastating Japanese earthquake and tsunami of March 2011. But there have
been other factors influencing this trend as well, such as clear reductions in demand (e.g.,
Germany's decision to permanently shut down eight reactors and the closing of several
U.S. reactors). There have also been some reductions in supply (e.g., postponement and
deferral of new mines and mine capacity expansions along with delays in planned
increases in uranium enrichment capacity) which have, in part, offset some of the
downward trend in demand. China continues to aggressively build new reactors, with
2
2
approximately 30 plants currently under construction and six to eleven that may come on
line in 2015.
3
4
5
6
7
8
9
10
11
The price for conversion services has also dropped significantly on the spot market due to
reduced near-term demand, while long-term prices have remained high due to concern
over the lack of investment in new conversion production facilities, and the possibility for
shortfalls in capacity longer-term. The cost for enrichment services appears to have
stabilized after a steady decline due to reduced demand and the addition of new centrifuge
capacity in Europe and the U.S. Domestic trends in fabrication prices continue to be
difficult to measure because there is no active spot market, but the general consensus is
that costs will continue to increase due to regulatory requirements, reduced competition,
and new reactor demand both in the U.S. and abroad.
12
13
14
Several reactors in Japan are likely to restart in 2015, which is likely to have some short
term price lift on front-end components. The timing and extent of other reactor restarts in
Japan remains uncertain.
Have these changes in market costs impacted the Company's projected near-term
costs?
Yes, but not significantly. The Company's current mix of longer-term front-end
component contracts has reduced its exposure to the market price escalation and volatility
that has occurred over the past several years. In addition, because the Company's nuclear
plants replace about one-third of their fuel on an 18-month schedule, there is a delay
before the full effect of any significant changes in a component price is seen in the plant
operating costs. However, in addition to some higher-priced legacy contracts, the
Q.15
16
17 A.
18
19
20
21
22
3

1
2
34
5 Q.
6 A.
7
8
9
10
11
12
13
14 Q.
15
16
17 A.
18
19
20
21
22
23
Company has been active in the market and has some market-based contracts allowing it
to take advantage of current lower prices.
SECTION IINUCLEAR FUEL
Please describe how you develop the Company's nuclear fuel expense rates.
The calculation of nuclear fuel expense rates, expressed in mills per kilowatt-hour
("mills/kWh"), is based on expected plant operating cycles and the overall cost of nuclear
fuel. As previously noted, front-end component costs include those for uranium, along
with those for the conversion, enrichment, and fabrication services. These costs are
amortized over the estimated energy production life of the nuclear fuel as provided by the
Company's Generation System Planning group. Rear-end costs include, in prior periods,
the federal government's charge of one mill/kWh on net nuclear generation sold, which is
intended to cover the eventual disposal cost of spent nuclear fuel in a federal repository.
You stated earlier in your testimony that you would discuss the status of the one
mill/kWh fee charged by the federal government for spent nuclear fuel disposal.
Please provide an update regarding the status of this fee.
On November 19,2013, the U.S. Court of Appeals for the District of Columbia Circuit
issued a decision on the legal challenge brought by the Nuclear Energy Institute and the
National Association of Regulatory Utility Commissioners ("NARUC") to the one
mill/kWh waste fee that operating nuclear plants pay quarterly into the Nuclear Waste
Fund. The court ordered the U.S. Department of Energy ("DOE") to submit to Congress
a proposal (as is required under the Nuclear Waste Policy Act) that the fee be changed to
zero, unless and until there is a viable disposal program. The DOE petitioned the court to
4
1
2
3
4
5
6
7
8 Q.
9 A.
10
11
12
13
14
15
16
17 Q.
18 A.
19
20
21
rehear this decision, but the court denied this request.
Notwithstanding, the DOE submitted a proposal to Congress in January 2014 to change
this one mill/kWh fee to zero. This relief is industry-wide and applies to all operating
reactors, including the Company's operating reactors at Surry and North Anna. The
processes specified in the Nuclear Waste Policy Act for adjustment of the fee have now
been completed, and as of May 16, 2014, the Company is no longer required to pay the
waste fee.
Can the waste fee collected by the federal government be reinstated?
Yes, it can. The Nuclear Waste Policy Act allows the Secretary of Energy to review fee
adequacy on an annual basis. It is likely that at some point in the future when a viable
waste disposal program is established by DOE, the Secretary will develop an adjustment
to the waste fee that ensures full cost recovery for the life cycle of such a program. Any
proposed adjustment to the fee will again need to be submitted to Congress for review for
a period of 90 consecutive session days. If and when a fee adjustment becomes effective,
the Company will again become obligated to make the fee payment, and will again seek
to recover payments for the assessed fee in its fuel factor.
What other items are included in the Company's nuclear fuel cost?
One other item included is the cost associated with interim spent fuel dry storage. For the
current period, the cost of interim spent fuel storage is included in the Company's
Forecasted System Fuel Expense. See Company Exhibit No. _, OAK, Schedule 2, page
20f3.
5

2
3
4
5
Q.
A.
How does your previous forecast of the Company's nuclear fuel expense rates
compare to the actual rates?
Schedule 1 shows this comparison using actual figures for the period July 1, 2014 through
January 31, 2015, and estimated figures for the period February 1,2015 through June 30,
2015. Actual nuclear fuel expense rates were 1.07% lower than forecasted.
6 Q.
7 A.
8
9
10 Q.
11 A.
What are the projections for the Company's nuclear fuel expense rates?
The Company's monthly nuclear fuel expense rate projections for the combined front-end
components and rear-end costs are shown on my Schedule 2. These projected rates are
2.1% higher than the actual prior period rates shown in Schedule 3.
Does this conclude your pre-filed direct testimony?
Yes, it does.
6

APPENDIX A
BACKGROUND AND QUALIFICATIONSOF
TOM A. BROOKMIRE
Tom A. Brookmire is a graduate of Virginia Tech with a Bachelor of Science degree in
Nuclear Science (1983), and a Master's degree in Engineering in Nuclear Engineering from the
University of Virginia (1988). He is a registered professional engineer in the Commonwealth of
Virginia.
Mr. Brookmire joined with Virginia Electric and Power Company in 1983, and has
worked since then in staff and management positions involving nuclear fuel. His current
responsibilities include procurement of nuclear fuel and related services, nuclear fuel-related
project management, long-term disposal of spent nuclear fuel, and the projection of nuclear
prices and related capital costs and expense rates.
Mr. Brookmire has previously presented testimony before the State Corporation
Commission of Virginia.

Vir
gin
iaE
lect
ric
and
Po
we
rCo
mp
an
y
Nu
clea
rF
uel
Exp
ense
Rat
e-
Th
eP
rio
rP
erio
dF
uel
Fac
tor
Act
ua
lvs
.F
ore
cast
(Ju
ly20
14-
Jun
e20
15)
(mill
s/kW
h)
Act
ual
Act
ual
Act
ual
Act
ual
Act
ual
Act
ual
Act
ual
Est
imat
eE
stim
ate
Est
imat
eE
stim
ate
Est
imat
eS
tatio
nJu
l-14
Aug
-14
Sep
-14
Oct
-14
Nov
-14
Dec
-14
Jan-
15F
eb-1
5M
ar-1
5A
pr-1
5M
ay-1
5Ju
n-15
Tot
alP
erio
d
Nor
thA
nnA
ctua
l6.
266.
276.
347.
436.
576.
256.
576.
486.
297.
106.
616.
736.
58F
orec
ast
6.27
6.27
6.34
7.08
6.69
6.69
6.69
6.69
6.34
6.81
6.81
6.81
6.63
Sur
ryA
ctua
l5.
945.
955.
955.
955.
955.
955.
955.
955.
955.
746.
046.
485.
98F
orec
ast
6.03
6.03
6.03
6.03
6.03
6.03
6.03
6.03
6.03
6.07
6.39
6.19
6.07
Act
ual
6.28
Fo
reca
st6.
34D
evia
tion
-1.0
7%
o ° 3 "0 Q.l
:::l
'< m~~
~gg
:::f~z
g:,o
.
m»
~OJ

Vir
gin
iaE
lect
ric
and
Po
we
rC
om
pa
ny
Pro
ject
ed
Nu
cle
ar
Fue
lE
xpe
nse
Rat
es-
The
Cu
rre
nt
Pe
rio
dF
uel
Fa
cto
rJu
ly20
15-
Jun
e20
16(m
ills/
kWh
)
Pro
ject
ion
Pro
ject
ion
Pro
ject
ion
Pro
ject
ion
Pro
ject
ion
Pro
ject
ion
Pro
ject
ion
Pro
ject
ion
Pro
ject
ion
Pro
ject
ion
Pro
ject
ion
Pro
ject
ion
Sta
tion
Jul-1
5A
ug-1
5S
ep-1
5O
ct-1
5N
ov-1
5D
ec-1
5Ja
n-16
Feb
-16
Mar
-16
Apr
-16
May
-16
Jun-
16N
orth
Ann
a6.
736.
636.
676.
616.
736.
666.
616.
736.
646.
966.
766.
69S
urry
5.99
5.99
5.99
5.97
6.22
6.16
6.16
6.16
6.16
6.16
6.16
6.16
6.41
o o 3 -0 ill
::J '< m
(j)~~
()~;:::+:
~~z
~:':
;I~
CD»
NO
J
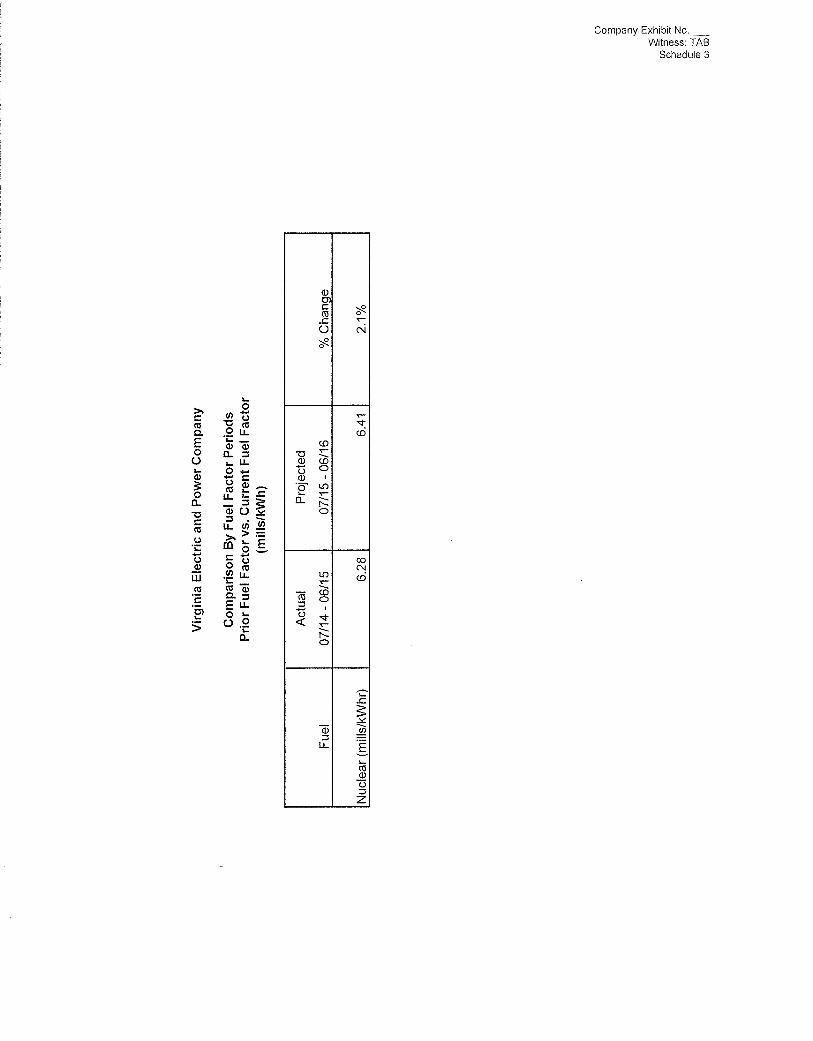
Vir
gin
iaE
lect
ric
and
Po
wer
Co
mp
any
Co
mp
aris
on
By
Fu
elF
acto
rP
erio
ds
Pri
or
Fu
elF
acto
rvs
.C
urr
ent
Fu
elF
acto
r(m
ills/
kWh
)
Act
ual
Pro
ject
ed
Fue
l07
/14
-06
/15
07/1
5-
06/1
6%
Ch
an
Qe
Nuc
lear
(mili
s/kW
hr)
6.28
6.41
2.1%
o ° 3 'tJ III :::
J-< m
~~
W~g
:T
U>
z
~:Io
Cil»
wO
J

s:mm2Szen

1 Q.
2 A.
3
4
5
6 Q.
7 A.
8
9
10
11
12
13 Q.
14 A.
15
16
DIRECT TESTIMONYOF
ALAN L. MEEKINSON BEHALF OF
VIRGINIA ELECTRIC AND POWER COMPANYBEFORE THE
STATE CORPORATION COMMISSION OF VIRGINIACASE NO. PUE-2015-00022
Please state your name, business address, and position of employment.
My name is Alan L. Meekins and I am Director of Electric Market Operations for
Virginia Electric and Power Company ("Dominion Virginia Power" or the "Company").
My business address is 5000 Dominion Boulevard, Glen Allen, Virginia 23060. A
statement of my background and qualifications is attached as Appendix A.
What are your responsibilities as Director of Electric Market Operations?
I am responsible for the Company's electric wholesale operations, including energy
procurement and generation unit commitment and dispatch. In performing these duties,
my staff and I have day-to-day responsibilities for interaction with PJM Interconnection,
L.L.C. ("PJM"), the regional transmission organization or entity ("RTO") of which the
Company is a member, regarding day-ahead ("DA") and real-time ("RT") energy market
operations activities.
What is the purpose of your testimony in this proceeding?
I will discuss the Company's economy energy purchases from PJM, which are a
component of our overall system-wide fuel expenses, and I will explain how these
purchases contribute to reducing the Company's fuel costs.

1 Q.
2
3 A.
4
5
6
7
8
9
10
11
12
13
14
15
16
17
18
19 Q.
20
21 A.
22
23
Please describe the coordination of the Company's operations in the PJM wholesale
markets.
Among the responsibilities of my group is the managing of the Company's interactions
with PJM related to generation unit operations, day-ahead bidding, and real-time
dispatch, as well as load serving entity ("LSE") requirements such as load procurement.
The Market Operations group supplies generating unit availability and cost data to PJM
each morning before noon for the next operating day. Simultaneously, we submit our
hourly load procurement profile based on forecasted need for the same period. PJM's
economic dispatch model determines the least cost means of satisfying demand, operating
reserves and other ancillary services, and the reliability requirements of the RTO. The
result of this model includes the day-ahead energy awards for our generating units and
the hourly prices.
During the operating day, the Market Operations staff further interfaces with PJM's
operations staff indirectly through PJM' s energy management information system, as
well as directly through voice communications. The Market Operations group also
communicates dispatch instructions to the plants through the Company's energy
management system and by verbal instructions. For calendar year 2014, the Company
continued to be a net buyer of economy energy from the PJM market.
Please describe the nature of these net economy energy purchases and how they
arise.
As presented by Company Witness Glenn A. Kelly, for the 12-month historical period of
February 1,2014 through January 31, 2015, the Company purchased approximately 7.1
million MWh of net economy energy from PJM at an overall cost of approximately $383
2

2
3
4
5 Q.
6
7 A.
8
9
10
11
12
13
14
15 Q.
16 A.
million. These net economy energy purchases from PJM result from the Company's
participation in PJM's DA and RT energy markets. The Company's Market Operations
staff works to optimize the commitment of the Company's fleet of generating units with
the PJM market to minimize the Company's cost to serve its load requirements.
Does the Company measure the benefit of the economy energy purchases that it
makes from PJM?
Yes, the Company uses the PJM energy markets to minimize costs, but also studies and
measures outcomes in the PJM markets to ensure that it continues to achieve
economically efficient outcomes for customers. One of the measures that we perform is
an evaluation of the economic benefit of our DA economy purchases. For calendar year
2014, the Company net purchased 5.2 million MWh ofDA energy from PJM at a savings
of approximately $109 million. These savings represent the difference in cost between
buying DA economy energy needs from PJM and generating an equivalent amount of
energy completely from our own fleet of generating resources.
Does this conclude your pre-filed direct testimony?
Yes, it does.
3

APPENDIX A
BACKGROUND AND QUALIFICATIONSOF
ALAN L. MEEKINS
Alan L. Meekins graduated from Virginia Polytechnic Institute and State University in
1979 with a Bachelor of Science degree in Electrical Engineering (concentration in Power
Systems), and he received a Master's of Business Administration degree from Virginia
Commonwealth University in 1990. Mr. Meekins joined Virginia Electric and Power Company
in July 1979 and has held several positions in Engineering, Operations, and Management. He
assumed his current position as Director - Electric Market Operations on September 1, 2004. In
this capacity, he is responsible for ensuring that the operating characteristics and costs, and daily
forecasted demand obligations, of the Company's regulated generating fleet are appropriately
placed in the PJM Day-Ahead market. Additionally, the Market Operations group, in which he
is a leader, interfaces with PJM's operations staff to effectively manage and dispatch the
Company's generating assets in the PJM Real-Time market.
Mr. Meekins has previously presented testimony before the State Corporation
Commission of Virginia and the North Carolina Utilities Commission.


1 Q.
2 A.
3
4
5
6
7
8
9 Q.
10 A.
11
12
13
14
15
16
17
18
DIRECT TESTIMONYOF
JOHN C. INGRAMON BEHALF OF
VIRGINIA ELECTRIC AND POWER COMPANYBEFORE THE
STATE CORPORATION COMMISSION OF VIRGINIACASE NO. PUE-2015-00022
Please state your name, business address, and position of employment.
My name is John C. Ingram, and my business address is 120 Tredegar Street, Richmond,
Virginia 23219. I am a Director of Accounting for Dominion Generation, which includes
responsibility for Virginia Electric and Power Company ("Dominion Virginia Power" or
the "Company"). My responsibilities include overseeing personnel responsible for
recording the Company's actual fuel and purchased power expenses, as well as any
under-lover-recovery of such expenses through the fuel deferral mechanism. A statement
of my background and qualifications is attached as Appendix A.
What is the purpose of your testimony in this proceeding?
I will present the Virginia jurisdictional fuel expenses incurred by the Company during
the period July 1,2014 through January 31, 2015, as well as the status of the Company's
fuel deferral balances as of January 31, 2015. In addition, I will (1) discuss the status of
the deferred fuel balances associated with the 24-month extended recovery period
("mitigation proposal") approved in Case No. PUE-2014-00033 (the "2014 Fuel Factor");
(2) sponsor a proposed modification to the text of the Definitional Framework for Fuel
Expenses ("Definitional Framework") to explicitly re-affirm that derivative gains and
losses, including option premiums, associated with financial hedging activities are
includable in recoverable fuel expenses; and (3) provide updates on the Company's

1
2
3 Q.
4 A.
5
6
7
8 Q.
9
10 A.
11
12 Q.
13
14 A.
15
16
17
18
19
recovery of costs associated with spent nuclear fuel storage from the U.S. Department of
Energy ("DOE").
During the course of your testimony, will you introduce an exhibit?
Yes. Company Exhibit No. _, JCI, consisting of Schedules 1 through 4, was prepared
under my supervision and direction, and is accurate and complete to the best of my
knowledge and belief. Schedule 4 presents the proposed modification to the Definitional
Framework.
What were the Company's actual Virginia jurisdictional fuel expenses incurred
during the seven-month period ending January 31, 2015?
Schedule 1, Column 2 shows $1,010,725,087 of cumulative booked fuel expenses on a
Virginia jurisdictional basis from July 1,2014 through January 31, 2015.
Is 75% of the Company's total annual margins from off-system sales being credited
against fuel factor expenses as required by Va. Code § 56-249.6 D I?
Yes, it is. The Company's profit margin from off-system sales for the period July 1,
2014 through January 31, 2015 was $1,546,842. Based upon this statutory 75% sharing
mechanism, the Virginia jurisdictional allocated share of the margin applied against fuel
factor expenses was $914,686, and is incorporated in Schedule 1, Column 1. Schedule 3
presents more detail regarding the calculation and breakdown of these off-system sales
amounts, as well as shared margins for February 1,2014 through June 30, 2014.
2

1 Q.
2
3 A.
4
5 Q.
6
7 A.
8
9
10
11
12
13
14
15
16 Q.
17
18 A.
19
What is the Company's deferred fuel balance as of January 31, 2015 for the 2014
2015 fuel year?
Schedule 1, Column 6 shows the actual Virginia jurisdictional fuel expense over-recovery
balance totaling $84,331,878 as of January 31, 2015.
What was the prior period deferred fuel balance as of the end of the 2013-2014 fuel
year and how much of that balance has now been collected?
The prior period deferred fuel balance as of June 30, 2014 was an under-recovery of
$234,533,019 as shown in Schedule 2, Column 1. During the seven-month period
beginning July 1,2014, $76,937,214 was collected as shown in Schedule 2, Column 2,
and a prior period adjustment of$537,716 was booked as shown in Schedule 2, Column
3, resulting in an under-recovery balance of$158,133,521 as of January 31,2015. Later
in my testimony I will discuss the status of deferred balances associated with the
mitigation proposal and the impact thereon of Senate Bill 1349, which was recently
enacted by the General Assembly of Virginia during its 2015 Regular Session and signed
into law by Governor McAuliffe on February 24,2015 ("Senate Bill 1349,,).1
What was the Company's deferred fuel balance for the period April 1, 2014 through
June 30, 2014?
The table below shows the calculation of the Company's deferred fuel balance (an under
recovery) for the period April 1,2014 through June 30, 2014.
1 2015 Virginia Acts of Assembly, Ch. 6, Enactment Clause 2 (approved February 24, 2015; effective July 1,2015).
3

Virginia Electric and Power ComVirginia 2013-2014 Fuel Year Recovery Experience
Three Months Ended June 2014
AllocatedFuel Current Balance in
Jurisdiction Revenue Month DeferralDeferral Account
March-14 Ending Balance 41
April-14 115,626,744 111,737,978 3,888,766 234,345,907
May-14 134,966,770 123,720,625 11,246,145 245,592,052
June-14 163,869,241 143,287,899 20,581,342 266,173,394
1
2
3
Q. What is the status of the deferred fuel balance associated with the Company's
mitigation proposal approved in the 2014 Fuel Factor, and how is it impacted by the
directives of Senate Bill 1349?
4 A.
5
6
7
8
9
10
11
12
13
14
Under the mitigation proposal, the Company proposed to recover its projected June 30,
2014 deferred fuel balance of$267.8 million over two years - 50% during the 2014-2015
fuel year and 50% during the 2015-2016 fuel year. The Commission approved this
proposal.
Senate Bill 1349 requires the Company to forgo recovery of 50% of the prior period June
30,2014 deferral balance that has not already been recovered as of December 31, 2014.
As presented in Schedule 2, Column 4, that unrecovered balance was $170,773,642,
resulting in a write-off of $85,386,821. As a result, the Company's projected June 30,
2015 deferred fuel over-recovery balance and accompanying rate calculations, described
by Company Witnesses Glenn A. Kelly and Edward J. Anderson, will exclude any
recovery of this written-off amount.
4

1
2
3
4
5
6
7 Q.
8
9
10
11 A.
12
13
14
15
16
17
18
19
20
21
22
23
Also, as I described in my testimony in the Company's 2014 Fuel Factor, amounts
relating to the mitigation proposal do not include any financing costs and no financing
costs are included for recovery in this fuel factor proceeding. Furthermore, base rates
will not increase as a result of the mitigation proposal, as any incremental financing costs
related to the mitigation proposal will be excluded from base rate cost of service in future
earnings review proceedings and borne by the Company.
Now turning to the Company's recently filed Fuel Procurement Strategy Report,
please summarize how an environment of increasing gas consumption and related
gas costs, as described therein, is expected to affect the Company's financial hedging
efforts and how such costs are treated in fuel expense.
On January 30, 2015, the Company filed its first annual Fuel Procurement Strategy
Report ("Report") pursuant to the Commission's Order in the 2014 Fuel Factor. Among
other things, this Report provides a summary of the Company's historical financial
hedging results and a discussion of its current and anticipated fuel procurement and price
hedging plans (the "Fuel Procurement Strategy"). The Fuel Procurement Strategy was
designed with an emphasis on satisfying the rapid rise in natural gas requirements
associated with the new fleet of combined cycle units and accompanying impacts on
other commodities and purchased power. As described in the Report, the Company
intends to meet its increasing fuel requirements using a combination of longer-term
natural gas supply contracts and spot purchases. For those purchase transactions that
continue to involve price risk, such as spot purchases of natural gas and purchased power,
the Company plans to continue using derivative instruments to financially hedge a certain
portion of those volumes.
5

1
2
3
4
5
6
7
8
9 Q.
10
11 A.
12
13
14
15
16 Q.
17
18 A.
19
20
21
22
23
While the Company has financially hedged a portion of its natural gas requirements and
purchased power transactions for several years now, the sheer volume of natural gas
purchases is projected to increase substantially as the new combined-cycle units come on
line. As a result, the aggregate level of dollar exposure to derivative gains and losses is
expected to increase as a direct result of financially hedging a higher notional value of
physical purchases. Furthermore, the Company also intends to continue its practice of
mitigating the price volatility for a portion of projected purchased power costs as well,
though to a lesser degree when compared to prior years.
Are you sponsoring a proposed modification to the Definitional Framework in this
case to address the Company's planned financial hedging activities?
Yes, I am sponsoring a modification to the text of the Definitional Framework to
explicitly reaffirm that derivative gains and losses, including option premiums, incurred
to financially hedge purchased commodities pursuant to the Company's Fuel
Procurement Strategy for the benefit of customers shall be included in costs recoverable
under the fuel factor, as shown on my Schedule 4.
Why does the Definitional Framework need to explicitly provide for the use of
derivative instruments for financial hedging purposes?
For most types of fuel costs, the text of the Definitional Framework does not explicitly
reference particular types of costs to be recovered through the fuel factor. Rather,
includable costs are inferred by reference to specific FERC inventory and fuel expense
accounts. As a result, includable costs are largely defined by the FERC accounting
instructions that describe what charges are allowable in those specific accounts.
Additionally, there are instances where includable costs are not explicitly written into the
6

1
2
3
4
5
6
7
8
9
10
11
12
13
14
15
16
17
18
19
20
21
22
Definitional Framework nor addressed in the FERC accounts, but have been approved in
prior fuel orders, such as the inclusion in fuel expense of interim nuclear fuel storage
costs and all settlements related to PJM financial transmission rights.
As for derivative gains or losses resulting from financial hedging transactions, the
Definitional Framework does not explicitly list them as includable costs. However,
pursuant to FERC accounting instructions, such derivative gains or losses should be
recorded to those specific FERC accounts referenced in the Definitional Framework to
the extent that the derivatives receive special "hedge accounting treatment" - as a hedge
of the physical fuel purchases recorded in those accounts.
Cash flow hedge accounting is a particular accounting treatment for derivative activity
that matches the derivative's gain or loss with the cost of the physical transaction that it is
intended to hedge based on certain accounting criteria. Generally, for derivatives not
receiving this accounting treatment ("economic hedges"), FERC accounting instructions
require that activity to be recorded in accounts that are not referenced in the Definitional
Framework. That being said, these economic hedges may be presented in the FERC fuel
related accounts if they are evaluated together with the physical transactions by the
Company's regulators for fuel accounting and ratemaking purposes.
While most all of the Company's historical derivative gains and losses have received
cash flow hedge accounting treatment, it is possible that derivatives employed in future
financial hedging transactions may not qualify for cash flow hedge accounting. I discuss
reasons how this is so further in my testimony, As noted by Company Witness Steven A.
Rogers, these financial hedges are entered into for the purpose of providing customer
7

1
2
3
4
5
6 Q.
7
8 A.
9
10
11
12
13
14
15
16
17
18
19
20
21
22
23
benefit in the form ofrate stability, and that objective is met even if the accounting
requirements for cash flow hedge accounting have not been met or maintained.
Therefore, now is the time to explicitly reaffirm in the text of the Definitional Framework
that derivative gains or losses, including option premiums, related to these financial
hedge transactions are considered to be costs recoverable in the fuel factor.
What is cash flow hedge accounting and why is it not the proper determinant of
whether a financial hedge should be included in the fuel factor?
Simply put, designating a derivative or combination of derivatives as a cash flow hedge
for accounting purposes means that the derivatives have been specifically identified, in
writing, as being highly capable of offsetting the price risk of forecasted future
transactions - in this case, the purchase of fuel commodities such as natural gas and
purchased power. Achieving cash flow hedge accounting allows the deferral of
derivative gains and losses to be matched in expense with the future market-based
commodity purchase when it is recorded in expense for financial reporting purposes. The
net result is the hedged price being reflected in expense. Hedge accounting rules include
strict criteria which require that the forecasted commodity purchases remain probable of
occurring during the entire term the derivatives are outstanding, and that the derivatives'
fair values move in a very highly correlated fashion relative to the market price changes
of the forecasted commodity purchases. Compliance with these criteria is evaluated at
the inception of the derivative transaction and during its tenure through settlement. A
cash flow hedge would be "de-designated" from hedge accounting if, at some point, it
fails to meet the strict price correlation requirements, or if the derivative volumes exceed
forecasted or actual purchased volumes (i.e., an over-hedged position).
8

1
2
3
4
5
6
7
8
9
10
11 Q.
12
13
14
15 A.
16
17
18
19
20
21
22
23
As Company Witness Rogers describes, all of the Company's financial hedging activities
with respect to fuel and power purchases represent prudent economic measures
undertaken with the objective of promoting rate stability for the benefit of customers.
Therefore, even in cases where cash flow hedge accounting may not be met or
maintained, such derivative transactions are still executed in the interest of customers and
should be specifically included in fuel expense and referenced in the text of the
Definitional Framework. As noted in the Report and discussed by Company Witness
Rogers, approval of this Definitional Framework modification is an important factor for
the Company in establishing the scope and nature of any financial hedging that it will
undertake in the future.
Beyond derivative gains and losses, including option premiums, are there any other
types of costs associated with financial hedging activities that the Company intends
to seek recovery for in this fuel proceeding, with an accompanying Definitional
Framework modification?
No, the Company is not including references to any other types of costs in its proposed
Definitional Framework modification, nor is the Company seeking fuel recovery of any
such costs in this filing. As I describe further below, there are transaction costs currently
recovered in base rates that, by their nature, should be eligible for fuel recovery.
Transaction costs are those incremental expenses incurred directly as a result of executing
the underlying derivative instruments. To date, these expenses have primarily included
broker, exchange and financing fees. The inclusion of transaction costs in the fuel factor
would be consistent with similar transaction costs that are incurred for the procurement of
the underlying physical commodities and already included in recoverable fuel expense
9

1
2
3
4
5
6
7
8 Q.
9
10 A.
11
12
13 '
14
15
16
17
18
19
20 Q.
21
22 A.
under the current Definitional Framework.
However, as base rates will not change for the next several years under Senate Bill 1349,
the Company will not seek to recover any of these transaction costs through fuel for years
in which base rates remain frozen. Following the end of the Transitional Rate Period
described in Senate Bill 1349, it is possible that the Company may seek to re-address this
issue. Option premiums, on the other hand, have historically been and should continue to
be recovered in fuel rates.
What types of costs associated with financial hedging activities would not be
included in recoverable fuel expense, by their nature?
The Company may incur directly, or through an affiliate, other types of costs that are
indirect or fixed in nature, such as internal or affiliated labor, general and administrative,
depreciation, and interest expenses. Although these costs are related to the fuel
procurement and financial hedging processes, along with the required infrastructure
established to carryon such activities, they do not arise as a direct result of the execution
of transactions and therefore are more appropriately recovered in base rates. This is
consistent with similar expenses that are incurred for the procurement of the underlying
physical commodities, but excluded from recoverable fuel expense under the current
Definitional Framework. The Company is currently recovering all infrastructure costs
arising from fuel procurement and financial hedging activities in base rates.
Please provide an update on the status of the Company's recovery of costs
associated with spent nuclear fuel storage from the DOE.
In November 2012, the Company and the DOE entered into a settlement agreement for
10

2
3
4
5
6
7
8
9
10
11
12
13 Q.
14 A.
resolution of the Company's claim for costs incurred during the period July 1, 2006
through December 31, 2010, and periodic payments for claims after that date through
2013. In January 2014, the settlement agreement was extended to provide for periodic
payments for damages incurred through December 31, 2016. A settlement payment of
approximately $27 million for costs incurred for the period January 1,2011 through
December 31, 2012 was received in July 2014. The portion of this payment allocable to
Virginia jurisdictional customers' fuel expense was approximately $16 million and was
credited to fuel expense at that time. As described by Mr. Kelly, during the 2015-2016
fuel year, the Company has included in its forecast the projected receipt of approximately
$11 million from the DOE, on a Virginia jurisdictional basis, related to further claims
regarding spent nuclear fuel storage for the periods January 1, 2013 through December
31,2013 and January 1,2014 through December 31, 2014.
Does this conclude your pre-filed direct testimony?
Yes, it does.
11

APPENDIX A
BACKGROUND AND QUALIFICATIONSOF
JOHN C. INGRAM, CPA
John C. Ingram graduated from the College of William and Mary in 1992 with a Bachelor
of Business Administration degree (concentration in Accounting) and received his Certified
Public Accountant license in 1994. He performed audit services for a national public accounting
firm for seven years prior to joining Dominion in 1999. Mr. Ingram has held various positions
within Dominion's accounting organization, including SEC reporting, accounting research, and
business unit support. He was promoted to Manager within the Dominion Generation accounting
organization in 2006, and to Director in 2010. His current responsibilities include overseeing
personnel responsible for the Company's generation accounting activities, including fuel
accounting and the Company's deferred fuel mechanism.
Mr. Ingram has previously presented testimony before the State Corporation Commission
of Virginia and the North Carolina Utilities Commission.

Vir
gin
iaE
lect
ric
and
Po
wer
Co
mp
any
Vir
gin
ia20
14-2
015
Fu
elY
ear
Rec
ove
ryE
xper
ien
ceS
even
Mo
nth
sE
nd
edJa
nu
ary
2015
Allo
cate
dC
um
ula
tive
Vir
gin
iaC
um
ula
tive
Fu
elF
uel
Cu
rre
nt
Bal
ance
inJu
risd
icti
on
Fu
elR
even
ue
Rev
enu
esM
on
thD
efer
ral
Fuel
Exp
ense
sE
xpen
ses
Rec
ove
ryR
eco
very
Def
erra
lA
cco
un
t(1
)(2
)(3
)(4
)(5
)(6
)
July
-14
$15
7,10
6,11
7$
157,
106,
117
$17
0,77
8,99
2$
170,
778,
992
$(1
3,67
2,87
5)$
(13,
672,
875)
Aug
ust-
1414
2,11
2,27
229
9,21
8,38
916
3,05
7,42
633
3,83
6,41
8$
(20,
945,
154)
(34,
618,
029)
Sep
tem
ber-
1413
2,67
3,77
943
1,89
2,16
814
3,74
4,16
647
7,58
0,58
4$
(11,
070,
387)
(45,
688,
416)
Oct
ober
-14
109,
311,
409
541,
203,
577
130,
243,
005
607,
823,
589
$(2
0,93
1,59
6)(6
6,62
0,01
2)
Nov
embe
r-14
124,
816,
197
666,
019,
774
145,
679,
207
753,
502,
796
$(2
0,86
3,01
0)(8
7,48
3,02
2)
Dec
embe
r-14
148,
239,
897
814,
259,
671
162,
496,
373
915,
999,
169
$(1
4,25
6,47
6)(1
01,7
39,4
98)
Janu
ary-
1519
6,46
5,41
61,
010,
725,
087
179,
057,
796
1,09
5,05
6,96
5$
17,4
07,6
20(8
4,33
1,87
8)
o o 3 -0 '"::J '< m
W~~
fGCD
;::+:
a.~z
c..
0CD
(=).
~-

Vir
gin
iaE
lect
ric
and
Po
wer
Co
mp
any
Vir
gin
ia20
14-2
015
Fu
elY
ear
Rec
ove
ryE
xper
ien
ceS
even
Mo
nth
sE
nd
edJa
nu
ary
2015
$
(3)
Ad
just
men
tsT
oP
rio
rP
erio
dB
alan
ceP
rio
rP
erio
dR
even
ue
Beg
inn
ing
Bal
ance
Rec
ove
ry(1
)(2
)
July
-14
$23
4,53
3,01
9(a
)$
(11,
168,
564)
Aug
ust-
1422
3,36
4,45
5(1
2,03
2,05
5)
Sep
tem
ber-
1421
1,33
2,40
0(1
0,14
7,45
1)
Oct
ober
-14
201,
722,
665
(9,1
94,1
67)
Nov
embe
r-14
192,
528,
498
(10,
283,
846)
Dec
embe
r-14
182,
244,
652
(11,
471,
010)
Janu
ary-
1517
0,77
3,64
2(1
2,64
0,12
1)
Tot
al$
(76,
937,
214)
(a)
Fue
lD
efer
ral
Bal
ance
asof
June
30,
2014
$
537,
716
537,
716
$
Fu
elP
rio
rP
erio
dE
nd
ing
Bal
ance
(4)
223,
364,
455
211,
332,
400
201,
722,
665
192,
528,
498
182,
244,
652
170,
773,
642
158,
133,
521
o o 3 -0 OJ
::J -c m x
(j)~
~0
::J_
::J"C
Dz
CD
Ul
0a.
Ul
.
~~I
N_

Do
min
ion
Vir
gin
iaP
ow
erV
irg
inia
Juri
sdic
tio
nO
ff-5
yste
mS
ales
Tw
elve
Mo
nth
sE
nd
edJa
nu
ary
2015
Allo
cate
dV
irg
inia
Sys
tem
Juri
sdic
tio
nV
olu
me
(Mw
H)
Rev
enu
eC
ost
100%
of
Mar
gin
75%
of
Mar
gin
Mar
gin
Cre
dit
(1)
(2)
(3)
(4)
(5)
(6)
Feb
ruar
y-14
$52
,598
$4,
362,
328
3,15
7,27
1$
1,20
5,05
790
3,79
2$
721,
682
Mar
ch-1
422
,327
1,58
6,28
499
0,57
159
5,71
344
6,78
535
1,94
9
Apr
il-14
(4,2
05)
(732
)(3
,473
)(2
,605
)(2
,001
)
May
-14
42,8
627,
617,
042
4,76
2,97
82,
854,
065
2,14
0,54
91,
646,
938
June
-14
46,9
342,
393,
043
1,97
2,00
042
1,04
331
5,78
224
8,41
7
July
-14
14,2
8275
0,50
160
0,14
915
0,35
111
2,76
489
,036
Au
gu
st-1
411
4,34
14,
422,
791
3,57
3,69
184
9,10
063
6,82
549
9,66
0
Sep
tem
ber-
141,
412
85,5
4455
,623
29,9
2122
,441
17,3
43
Oct
ober
-14
5,53
922
4,08
319
6,52
027
,563
20,6
7215
,903
No
vem
be
r-1
415
,201
738,
654
570,
682
167,
972
125,
979
99,5
52
Dec
embe
r-14
57,9
202,
475,
485
2,29
1,23
718
4,24
813
8,18
611
0,34
7
Janu
ary-
1528
,421
1,27
5,41
71,
137,
731
137,
686
103,
264
82,8
46
0T
otal
$4
01
,83
7$
25,9
26,9
6719
,307
,721
L6
,61
9,2
46
4,96
4,43
4$
3,88
1,67
20 :3 u ill
:::J
-c m x(f)~~
as
";::
;:::
:rC
llZ
~cno
c~
.
CDfil
0>
_

Company Exhibit No. _Witness: lCISchedule 4Page 1 of 1
VIRGINIA STATE CORPORATION COMMISSION 'SDEFINITIONAL FRAMEWORK OF FUEL EXPENSESFOR VIRGINIA ELECTRIC AND POWER COMPANY
a. The cost of fossil fuels shall be those items initially charged to account 151 and cleared toaccounts 501, 518 and 547 on the basis of fuel used. In those instances where a fuelstock account (151) is not maintained, e.g., gas for combustion turbines , the amount shallbe based on the cost of fuel consumed and entered in account 547.
b. The cost of nuclear fuel shall be the amount contained in account 518, excluding leasefinance charges, except that if account 518 also contains any expense for fossil fuelwhich has already been included in the cost of fossil fuel, it shall be deducted from thisaccount.
c. Total energy costs associated with purchased power and charged to account 555 shall berecoverable as fuel costs.
d. The commodity costs referenced in items a., b., and c. above shall include gains orlosses, including option premiums, arising from the use of derivative instruments associatedwith such commodities.
~tl . Energy revenues associated with off-system sales and recorded in account 447 shall becredited against fuel factor expenses in an amount equal to the total incremental fuelfactor costs incurred in the production and delivery of such sales. In addition , seventyfive percent (75%) of the total accumulated energy margins from off-system sales shall becredited against fuel factor expenses annually. In the event such accumulated energymargins result in a net loss, no charges shall be made to fuel factor expenses. Energymargin is defined as the total energy revenue received from an off-system salestransaction less the total incremental costs incurred in supplying that sale.
fe. The Company shall be permitted to credit energy revenues associated with DisplacedRetail Access Sales against fuel factor expenses in an amount equal to the average fuelfactor. No energy margin associated with the sale of the Displaced Retail AccessSales should be credited against fuel factor expenses.
gf. All refunds of fuel costs resulting from overcharges, late delivery, or any other reasonand all recoveries and adjustments of whatever nature affecting the price of fuel shall bepassed on through these proceedings.
hg. Company shall be permitted to adjust for system losses through development of a fuelfactor based upon fuel costs divided by sales through the application of a separatelyderived loss factor applied to a fuel factor based on net energy requirements.

»zom:;0enoz

1 Q.
2 A.
3
4
5
6 Q.
7 A.
8
9
10
11
12
13
14
15
16
17
DIRECT TESTIMONYOF
EDWARD J. ANDERSONON BEHALF OF
VIRGINIA ELECTRIC AND POWER COMPANYBEFORE THE
STATE CORPORATION COMMISSION OF VIRGINIACASE NO. PUE-2015-00022
Please state your name, business address, and position of employment.
My name is Edward J. Anderson. My business address is 701 East Cary Street,
Richmond, Virginia 23219. My title is Regulatory Advisor for Virginia Electric and
Power Company ("Dominion Virginia Power" or the "Company"). A statement of my
background and qualifications is attached as Appendix A.
What is the purpose of your testimony in this proceeding?
My testimony presents the calculation of the proposed total fuel factor to be effective
April 1, 2015, on an interim basis, to comply with the directives of Senate Bill 1349,
which was recently enacted by the General Assembly of Virginia during its 2015 Regular
Session and signed into law by Governor McAuliffe on February 24, 2015 ("Senate Bill
1349").1 The Company is requesting a total fuel factor of $0.02406/kWh to become
effective for usage on and after April 1,2015 through June 30, 2016, on an interim basis.
The impact of Senate Bill 1349 and the request to implement the fuel factor reduction on
an accelerated basis is addressed more fully in the Application and the testimony of
Company Witness Steven A. Rogers. Implementation of the proposed total fuel factor
will result in a fuel revenue decrease over the period April 1, 2015-June 30, 2016 of
approximately $512.3 million.
12015 Virginia Acts of Assembly, Ch. 6, Enactment Clause 2 (approved February 24, 2015; effective July 1,2015).

1 Q.
2 A.
3
4
5 Q.
6
7
8 A.
9
10
11
12
13
14
15
16
17
18
19
20 Q.
21
22 A.
During the course of your testimony, will you introduce an exhibit?
Yes. Company Exhibit No. __, EJA, consisting of Schedules 1 through 9, was
prepared under my supervision and direction, and is accurate and complete to the best of
my knowledge and belief.
Please explain the various components that make up the Company's proposed total
fuel factor rate to be effective April 1, 2015 through June 30, 2016, on an interim
basis.
The proposed total fuel factor, Fuel Charge Rider A, consists of both a current period and
a prior period factor. Fuel Charge Rider A's current period factor of $0.02374/kWh is
designed to recover the Company's estimated Virginia jurisdictional fuel expenses of
approximately $1.6 billion for the period July 1,2015 through June 30, 2016.
Fuel Charge Rider A's prior period factor of$0.00032/kWh is designed to recover
approximately $21.9 million, which is the net of two projected June 30, 2015 balances:
(1) The projected June 30, 2015 over-recovery balance of approximately $24.0
million associated with recovery of the July 1,2014 through June 30, 2015 current period
expense;
(2) The projected June 30, 2015 under-recovery balance of approximately $45.9
million associated with recovery of the remaining January 31, 2015 prior period expense
to be recovered through June 30, 2015.
Do you have a schedule that shows the fuel factor expenses that the Company
expects to incur during the period July 1,2014 through June 30, 2015?
Yes. Schedule 1 shows estimated system fuel factor expenses in Column 1 (as provided
2

1
2
3 Q.
4
5 A.
6
7
8
9 Q.
10
11 A.
12
13
14
15 Q.
16 A.
17
18
19
20
21
in Company Exhibit No. _, GAK Schedule 2, Page 2 of 3), allocated to the Virginia
jurisdiction for the current period shown in Column 3.
Do you have a schedule that shows the calculation of the current period factor of
Fuel Charge Rider A?
Yes. Schedule 2 shows the calculation of the current period factor. The total Virginia
jurisdictional estimated fuel factor expense of approximately $1.6 billion was divided by
the total estimated Virginia jurisdictional kWh sales for July I, 2015 through June 30,
2016. The result is the current period factor of$0.02374/kWh.
Do you have a schedule that shows the estimated recovery of the proposed current
period factor?
This is shown on Schedule 3. Estimated Virginia jurisdictional fuel factor expenses by
month from July 1,2015 through June 30, 2016 are compared to estimated monthly
Virginia jurisdictional fuel revenues by month, and the estimated resulting over- or
under-recoveries of fuel expenses for each month are shown.
Please describe the development of the prior period factor.
In order to develop the proposed prior period factor, we must first estimate the
Company's projected June 30, 2015 deferral balance.
To do so, we must first determine the projected June 30, 2015 balance associated with the
present current period expenses. The estimated system fuel expenses allocated to the
Virginia jurisdiction for the period February 1 through June 30, 2015 are calculated and
shown on my Schedule 4.
3

1
2
3
4
5
6
7
8
9
10
11
12
13 Q.
14
15 A.
16
17 Q.
18
19 A.
20
Schedule 5, Row 1, contains the January 31, 2015 actual current period deferral balance
of approximately ($84.3) million and the actual prior period deferral balance of
approximately $72.7 million (assuming 50% of the December 31, 2014 deferral
balancer), as explained by Company Witness John C. Ingram. Estimated February
through June 2015 Virginia jurisdictional sales were obtained from Company Witness
Glenn A. Kelly.
Column 10 shows the Company's total June 30, 2015 projected net balance of
approximately $21.9 million associated with the current and prior period assuming April
1, 2015 implementation of the proposed current and prior period factors in this case.
Schedule 6 shows the calculation of the proposed prior period factor of$0.00032/kWh by
dividing this $21.9 million under-recovery by the total estimated Virginia jurisdictional
kilowatt-hour sales for the fuel year.
What is the total fuel factor that the Company is requesting to become effective
April 1, 2015 through June 30, 2016, on an interim basis?
Schedule 7 shows the components ofthe proposed total fuel factor rate of $0.02406/kWh
compared to the present Fuel Charge Rider A factor of$0.03018/kWh.
Have you included in your exhibit revisions to Fuel Charge Rider A to reflect the
Company's proposed total fuel factor for April 1, 2015, on an interim basis?
Yes. My Schedule 8 shows the revised Fuel Charge Rider A, which would be applicable
for usage on and after April 1, 2015, on an interim basis.
2 This is a savings to customers of$O.OOl02lkWh per month, or $1.02/MWh, based on projected sales for the periodApril 2015 June 2016.
4

1 Q. Mr. Anderson, would you explain how these proposed changes in the fuel factor
2 would affect customers' bills?
3 A. Schedule 9 provides typical bill comparisons (base and fuel) for Rate Schedules 1, GS-l,
4 GS-2, GS-3, GS-4, and 5C based on the proposed April 1, 2015 fuel factor and rates
5 pending State Corporation Commission of Virginia approval to be effective on April 1,
6 2015. As shown on Schedule 9, Page 1, for a residential customer using 1,000 kWh per
7 month, the typical bill in the summer months (June through September) would decrease
8 $6.12 from $119.47 to $113.35 or by 5.1%. The typical bill for a residential customer
9 using 1,000 kWh in the base months (October through May) would decrease $6.12 from
10 $113.77 to $107.65, or by 5.4%. The average weighted monthly residential bill (4
11 summer months and 8 base months) would decrease $6.12 from $115.67 to $109.55, or
12 by 5.3%. For reference, page 10 of Schedule 9 provides a workpaper showing the billing
13 components of the 1,000 kWh residential bill proposed for April 1,2015.
14 Q. Does this conclude your pre-filed direct testimony?
15 A. Yes, it does.
5

APPENDIX A
BACKGROUND AND QUALIFICATIONSOF
EDWARD J. ANDERSON
Edward 1. Anderson graduated from the Virginia Military Institute in 2002 with a
Bachelor of Arts degree in Economics and Business. He was hired by Dominion in 2003. From
2003 to 2007, he worked at the Dominion Energy Clearinghouse in the Electric Accounting
group as a Business Operations Support Associate, and in the Electric Trading group as a Power
Market Analyst. His responsibilities included Power Pool (P1M and NE-ISO) reconciliation,
analysis, and trading support. In 2007, he was promoted to Hourly Trader within the Electric
Trading group. In 2008, Mr. Anderson moved to the State Regulation Department as Regulatory
Analyst III. In April 2014, Mr. Anderson was promoted to his current position as Regulatory
Advisor. His responsibilities include providing support and analysis as it relates to rate design
for the Company's regulatory filings within Virginia and North Carolina.
Mr. Anderson has previously presented testimony before the State Corporation
Commission of Virginia, the North Carolina Utilities Commission, and the Federal Energy
Regulatory Commission.

Company Exhibit No._Witness: EJA
Schedule 1Page 1 of 1
VIRGINIA JURISDICTIONAL ALLOCATED EXPENSESJULY 2015 THROUGH JUNE 2016
(1) (2) (3)TOTAL
TOTAL VIRGINIA JURISDICTION VIRGINIA JURISDICTIONSYSTEM FUEL ALLOCATION ALLOCATED FUEL
EXPENSE FACTOR EXPENSE(A) (1) x (2)
JULY 2015 $ 204,354,304 0.802349 $ 163,963,374
AUGUST $ 192,895,716 0.799842 $ 154,286,186
SEPTEMBER $ 139,832,528 0.782574 $ 109,429,313
OCTOBER $ 123,739,255 0.775092 $ 95,909,338
NOVEMBER $ 145,938,899 0.784493 $ 114,488,005
DECEMBER $ 184,775,324 0.807942 $ 149,287,795
JANUARY 2016 $ 244,813,807 0.812990 $ 199,031,144
FEBRUARY $ 184,433,804 0.809161 $ 149,236,645
MARCH $ 157,701,413 0.793859 $ 125,192,685
APRIL $ 138,381,623 0.784172 $ 108,514,938
MAY $ 137,959,990 0.784832 $ 108,275,367
JUNE $ 171,037,152 0.795942 $ 136,135,736
TOTAL $ 2,025,863,813 $ 1,613,750,526
(A) From Company Exhibit No. __, GAK, Schedule 2, Page 2 of 3.

FUEL CHARGE RIDER A CURRENT PERIOD FACTORJULY 2015 THROUGH JUNE 2016(Rates in Dollars per Kilowatt-hour)
1. ESTIMATED VA JURISDICTIONAL ALLOCATED FUEL EXPENSE (A)JULY 2015 - JUNE 2016
2. ESTIMATED VIRGINIA JURISDICTIONAL KWH SALES (B)JULY 2015 - JUNE 2016
3. ZERO BASE FACTOR ="F"
F = (E) / (8)
E = $1,613,750,526S = 67,972,748,794
F = $0.02374per kWh
(A) From Company Exhibit No. __' EJA, Schedule 1, Column 3.(B) From Company Exhibit No. __, GAK, Schedule 1.
$ 1,613,750,526 ="E"
67,972,748,794 ="S"
Company Exhibit No._Witness: EJA
Schedule 2Page 1 of 1

FU
EL
EX
PE
NS
ER
EC
OV
ER
YE
ST
IMA
TE
JULY
2015
TH
RO
UG
HJU
NE
2016
(1)
(2)
(3)
(4)
(5)
(6)
(7)
(8)
UN
DE
RO
RC
UM
UL
AT
IVE
VIR
GIN
IAC
UM
UL
AT
IVE
VIR
GIN
IAC
UR
RE
NT
FU
EL
CU
MU
LA
TIV
E(O
VE
R)
UN
DE
RO
RJU
RIS
DIC
TIO
NA
LF
UE
LJU
RIS
DIC
TIO
NA
LP
ER
IOD
RE
CO
VE
RY
FU
EL
RE
CO
VE
RY
(OV
ER
)20
15-2
016
FU
EL
EX
PE
NS
EE
XP
EN
SE
MW
HS
AL
ES
FU
EL
FA
CT
OR
BY
MO
NT
HR
EC
OV
ER
YB
YM
ON
TH
RE
CO
VE
RY
(A)
(B)
(3)
x(4
)(1
)-
(5)
JULY
2015
$16
3,96
3,37
4$
16
3,9
63
,37
46,
633,
762
$0.
0237
4$
157,
485,
503
$15
7,48
5,50
3$
6,47
7,87
1$
6,47
7,87
1
AU
GU
ST
$15
4,28
6,18
6$
318,
249,
560
6,43
6,75
1$
0.02
374
$15
2,80
8,45
8$
310,
293,
960
$1,
477,
728
$7,
955,
599
SE
PT
EM
BE
R$
109,
429,
313
$42
7,67
8,87
35,
292,
459
$0.
0237
4$
125,
642,
970
$43
5,93
6,93
1$
(16,
213,
657)
$(8
,258
,058
)
OC
TO
BE
R$
95,9
09,3
38$
523,
588,
212
4,6
97
,32
5$
0.02
374
$11
1,51
4,49
3$
547,
451,
423
$(1
5,60
5,15
4)$
(23,
863,
212)
NO
VE
MB
ER
$11
4,48
8,00
5$
638,
076,
217
4,7
19
,63
8$
0.02
374
$11
2,04
4,20
8$
659,
495,
631
$2,
443,
797
$(2
1,41
9,41
5)
DE
CE
MB
ER
$14
9,28
7,79
5$
787,
364,
012
6,27
1,47
4$
0.02
374
$14
8,88
4,79
8$
808,
380,
430
$40
2,99
7$
(21,
016,
418)
JAN
UA
RY
2016
$1
99
,03
1,1
44
$98
6,39
5,15
66,
716,
605
$0.
0237
4$
159,
452,
200
$96
7,83
2,63
0$
39,5
78,9
44$
18,5
62,5
26
FE
BR
UA
RY
$14
9,23
6,64
5$
1,13
5,63
1,80
15,
784,
181
$0.
0237
4$
137,
316,
451
$1,
105,
149,
081
$11
,920
,194
$30
,482
,720
MA
RC
H$
12
5,1
92
,68
5$
1,26
0,82
4,48
55,
393,
206
$0.
0237
4$
128,
034,
719
$1,
233,
183,
799
$(2
,842
,034
)$
27,6
40,6
86
AP
RIL
$10
8,51
4,93
8$
1,36
9,33
9,42
34
,78
7,8
14
$0.
0237
4$
113,
662,
707
$1,
346,
846,
507
$(5
,147
,769
)$
22,4
92,9
17
MA
Y$
108,
275,
367
$1,
477,
614,
790
5,17
9,06
7$
0.02
374
$12
2,95
1,04
6$
1,46
9,79
7,55
2$
(14,
675,
679)
$7,
817,
238
JUN
E$
136,
135,
736
$1,
613,
750,
526
6,0
60
,46
8$
0.02
374
$14
3,87
5,50
4$
1,61
3,67
3,05
6$
(7,7
39,7
69)
$77
,469
TO
TA
L$
1,61
3,75
0,52
66
7,9
72
,74
9$
1,61
3,67
3,05
6$
77,4
69
()
Den
otes
Ove
r-R
ecov
ery
(A)
Fro
mC
ompa
nyE
xhib
itN
o._
,E
JA,
Sch
edul
e1,
Col
umn
3.(B
)F
rom
Com
pany
Exh
ibit
No,_
,G
AK
,S
ched
ule
1,
0 0 3 ""0 ill
::J:2
:'<"1
J(j
);:;
:~
ill
0~
:!.co
zr<1
><1>
(fl
rr~
0.
!1?;:::
;:c
mZ
S-
iD'-
0~
w»
I'

ESTIMATED VIRGINIA JURISDICTIONAL ALLOCATED EXPENSESFEBRUARY 2015 THROUGH JUNE 2015
(1) (2) (3)TOTAL
TOTAL VIRGINIA JURISDICTION ALLOCATEDSYSTEM FUEL ALLOCATION VIRGINIA JURISDICTION
2015 EXPENSE FACTOR FUEL EXPENSE(A) (1) X (2)
FEBRUARY $ 260,673,103 0.808205 $ 210,677,289
MARCH $ 177,976,374 0.792473 $ 141,041,422
APRIL $ 155,764,251 0.782554 $ 121,893,996
MAY $ 159,029,982 0.783341 $ 124,574,660
JUNE $ 182,360,587 0.794660 $ 144,914,614
TOTAL $ 935,804,296 $ 743,101,981
(A) From Company Exhibit No. _, GAK, Schedule 8.
Company Exhibit No._Witness: EJA
Schedule 4Page 1 of 1

FU
EL
EX
PE
NS
ER
EC
OV
ER
YE
ST
IMA
TE
FE
BR
UA
RY
2015
TH
RO
UG
HJU
NE
2015
(1)
(2)
(3)
(4)
(5)
(6)
(7)
(8)
(9)
(10)
VIR
GIN
IAJU
RIS
DIC
TIO
NA
LC
UR
RE
NT
PE
RIO
DP
RIO
RP
ER
IOD
PR
IOR
TO
TA
LV
IRG
INIA
CU
RR
EN
TP
ER
IOD
PE
RIO
DP
RIO
RP
ER
IOD
CU
RR
EN
TP
ER
IOD
JUR
ISD
ICT
ION
AL
RE
CO
VE
RY
(OV
ER
)/U
ND
ER
-RE
CO
VE
RY
RE
CO
VE
RY
(OV
ER
)/U
ND
ER
-RE
CO
VE
RY
&P
RIO
RP
ER
IOD
2015
MW
HS
ALE
SE
XP
EN
SE
FA
CT
OR
RE
CO
VE
RY
BY
MO
NT
HS
CU
MU
LA
TIV
EF
AC
TO
RB
YM
ON
TH
SC
UM
UL
AT
IVE
BA
LAN
CE
(A)
(1)
x(3
)(2
)-
(4)
(1)
x(7
)(9
)-
(8)
(6)
+(9
)
1.)
JAN
UA
RY
31
,20
15
BA
LAN
CE
$(8
4,33
1,87
8)$
72,7
46,7
00(B
)(C
)2.
)F
EB
RU
AR
Y5
,67
9,5
84
$21
0,67
7,28
9$
0.02
819
$16
0,10
7,46
3$
50,5
69,8
26$
(33,
762,
052)
$0.
0019
9$
11,3
02,3
71$
61
,44
4,3
29
$27
,682
,276
3.)
MA
RC
H5
,29
3,5
82
$14
1,04
1,42
2$
0.02
819
$14
9,22
6,06
6$
(8,1
84,6
44)
$(4
1,94
6,69
6)$
0.00
199
$10
,534
,227
$50
,910
,101
$8
,96
3,4
05
4.)
AP
RIL
4,6
94
,48
7$
121,
893,
996
$0.
0237
4$
111,
447,
118
$1
0,4
46
,87
7$
(31,
499,
819)
$0.
0003
2$
1,50
2,23
6$
49,4
07,8
65$
17,9
08,0
46
5.)
MA
Y5
,08
2,6
14
$12
4,57
4,66
0$
0.02
374
$12
0,66
1,25
2$
3,9
13
,40
8$
(27,
586,
411)
$0.
0003
2$
1,62
6,43
6$
47,7
81,4
29$
20,1
95,0
18
6.)
JUN
E5,
952,
492
$14
4,91
4,61
4$
0.02
374
$14
1,31
2,15
5$
3,60
2,45
9$
(23,
983,
952)
$0.
0003
2$
1,90
4,79
7$
45,8
76,6
31$
21,8
92,6
80
()
Den
otes
Ove
r-R
eco
very
(A)
Fro
mC
ompa
nyE
xhib
itN
o._
,E
JA,
Sch
edul
e4,
Col
umn
3.(B
)F
rom
Com
pany
Exh
ibit
No._
,JC
I,S
ched
ule
1.(C
)F
rom
Com
pany
Exh
ibit
No._
,JC
I,S
ched
ule
2-
Ref
lect
s50
%of
De
cem
be
r20
14B
alan
cean
dJa
nuar
y20
15R
even
ueR
ecov
ery.
o o 3 '0 Q) ::> -c
;i;~
'lJ(j
)S
:!.~
g.~
gCD
~!'!
z->
.C
m0
9.~5;f

FUEL CHARGE RIDER A PRIOR PERIOD FACTORJULY 2015 THROUGH JUNE 2016(Rates in Dollars per Kilowatt-hour)
1. ESTIMATED VIRGINIA JURISDICTION ALLOCATED FUEL EXPENSEJULY 2015 - JUNE 2016 (A)
2. ESTIMATED VIRGINIA JURISDICTIONAL KWH SALESJULY 2015 - JUNE 2016 (B)
3. ZERO BASE FACTOR ="F"
F =(E) / (8)
E = $21,892,680S = 67,972,748,794
F = $0.00032per kWh
(A) From Company Exhibit No. __, EJA, Schedule 5, Column 10.(B) From Company Exhibit No. __, GAK, Schedule 1.
Company Exhibit No._Witness: EJA
Schedule 6Page 1 of 1
$21,892,680 = "E"
67,972,748,794 = "S"

APRIL 1,2015 - JUNE 30, 2016 PROPOSED FUEL FACTORTOTAL FUEL FACTOR COMPARISON
(Rates in Dollars per Kilowatt-hour)
Company Exhibit No._Witness: EJA
Schedule 7Page 1 of 1
PROPOSED
PRESENT
DIFFERENCE
CURRENT PERIODFACTOR
$0.02374
$0.02819
($0.00445)
PRIOR PERIODFACTOR
$0.00032
$0.00199
($0.00167)
RIDER A TOTAL FUELFACTOR
$0.02406
$0.03018
($0.00612)

Virginia Electric and Power CompanyCompany Exhibit No._Witness: EJASchedule 8
FUEL CHARGE RIDER-A
The charge for service under Virginia Electric and Power Company's Filed Rate
Schedules 1, IP, IS, IT, lW, DP-R, lEV, EV, 5, 5C, 5P, 6, GS-l, DP-l, GS-2, DP-2, GS-2T,
GS-3, GS-4, 6TS, 7, 8, 10,25,27,28 and 29, as well as applicable energy charges specified in
any special rates, contracts or incentives approved by the State Corporation Commission
pursuant to Virginia Code § 56-235.2 shall be increased by 2.406 cents per kilowatthour.
Filed 02-27-15Electric-Virginia
Superseding Filing Effective For UsageOn and After 07-01-14. This Filing EffectiveFor Usage On and After 04-01-15, On anInterim Basis.

Company Exhibit No. _Witness: EJA
Schedule 91 of 10
VIRGINIA ELECTRIC AND POWER COMPANYTYPICAL BILLS - RESIDENTIAL - SCHEDULE 1
SUMMER MONTHS
EFFECTIVE FOR EFFECTIVE FOR
USAGE ON AND AFTER USAGE ON AND AFTER
04-01-2015' 04-01-2015"APPLICABLE APPLICABLE
BASIC NON-FUEL TOTAL BASIC NON-FUEL TOTAL PERCENT
KWH RATE # RIDERS## FUEL' BILL RATE # RIDERS## FUEL" BILL DIFFERENCE DIFFERENCE
500 $42.12 $5.03 $15.09 $62.24 $42.12 $5.03 $12.03 $59.18 ($3.06) -4.9%
750 $59.67 $7.56 $22.64 $89.87 $59.67 $7.56 $18.05 $85.28 ($4.59) -5.1%
1,000 $79.24 $10.05 $30.18 $119.47 $79.24 $10.05 $24.06 $113.35 ($6.12) -5.1%1
1,500 $119.38 $15.08 $45.27 $179.73 $119.38 $15.08 $36.09 $170.55 ($9.18) -5.1%
2,000 $159.52 $20.10 $60.36 $239.98 $159.52 $20.10 $48.12 $227.74 ($12.24) -5.1%
2,500 $199.66 $25.13 $75.45 $300.24 $199.66 $25.13 $60.15 $284.94 ($15.30) -5.1%
3,000 $239.80 $30.15 $90.54 $360.49 $239.80 $30.15 $72.18 $342.13 ($18.36) -5.1%
5,000 $400.36 $50.25 $150.90 $601.51 $400.36 $50.25 $120.30 $570.91 ($30.60) -5.1%
BASE MONTHS
APPLICABLE APPLICABLE
BASIC NON-FUEL TOTAL BASIC NON-FUEL TOTAL PERCENT
KWH RATE # RIDERS## FUEL' BILL RATE # RIDERS## FUEL" BILL DIFFERENCE DIFFERENCE
500 $42.12 $5.03 $15.09 $62.24 $42.12 $5.03 $12.03 $59.18 ($3.06) -4.9%
750 $59.67 $7.56 $22.64 $89.87 $59.67 $7.56 $18.05 $85.28 ($4.59) -5.1%
1,000 $73.54 $10.05 $30.18 $113.77 $73.54 $10.05 $24.06 $107.65 ($6.12) -5.4%1
1,500 $99.46 $15.08 $45.27 $159.81 $99.46 $15.08 $36.09 $150.63 ($9.18) -5.7%
2,000 $125.36 $20.10 $60.36 $205.82 $125.36 $20.10 $48.12 $193.58 ($12.24) -5.9%
2,500 $151.28 $25.13 $75.45 $251.86 $151.28 $25.13 $60.15 $236.56 ($15.30) -6.1%
3,000 $177.18 $30.15 $90.54 $297.87 $177.18 $30.15 $72.18 $279.51 ($18.36) -6.2%
5,000 $280.82 $50.25 $150.90 $481.97 $280.82 $50.25 $120.30 $451.37 ($30.60) -6.3%
# BASIC RATE INCLUDES BASE DISTRIBUTION, GENERA TION, AND EMBEDDED TRANSMISSION RATES.## REFLECTS CURRENT APPLICABLE NON-BASE RATE RIDERS AND THOSE PENDING COMMISSION APPROVAL TO BE EFFECTIVE APRIL 1, 2015.
, REFLECTS TOTAL CURRENT FUEL LEVEL OF $0.03018 PER KWH." REFLECTS TOTAL PROPOSED FUEL LEVEL OF $0,02406 PER KWH.

VIR
GIN
IAE
LE
CT
RIC
AN
DP
OW
ER
CO
MP
AN
YT
YP
ICA
LB
ILL
S-
SC
HE
DU
LE
GS
-1
SU
MM
ER
MO
NT
HS
EF
FE
CT
IVE
FO
RE
FF
EC
TIV
EF
OR
US
AG
EO
NA
ND
AF
TE
RU
SA
GE
ON
AN
DA
FT
ER
04-0
1-20
15"
04-0
1-20
15"
AP
PLI
CA
BLE
AP
PLI
CA
BLE
BIL
LLO
AD
BA
SIC
NO
N-F
UE
LT
OT
AL
BA
SIC
NO
N-F
UE
LT
OT
AL
PE
RC
EN
T
KW
KW
HP
HA
SE
FA
CT
OR
RA
TE
#R
IDE
RS
##F
UE
L"
BIL
LR
AT
E#
RID
ER
S##
FU
EL
"B
ILL
DIF
FE
RE
NC
ED
IFF
ER
EN
CE
550
01
14%
$42.
12$5
.62
$15.
09$6
2.83
$42.
12$5
.62
$12.
03$5
9.77
($3.
06)
-4.9
%50
03
14%
$46.
12$5
.62
$15.
09$6
6.83
$46.
12$5
.62
$12.
03$6
3.77
($3.
06)
-4.6
%
1,00
01
28%
$72.
76$1
1.21
$30.
18$1
14.1
5$7
2.76
$11.
21$2
4.06
$108
.03
($6.
12)
-5.4
%1,
000
328
%$7
6.76
$11.
21$3
0.18
$118
.15
$76.
76$1
1.21
$24.
06$1
12.0
3($
6.12
)-5
.2%
1,50
01
42%
$103
.96
$16.
83$4
5.27
$166
.06
$103
.96
$16.
83$3
6.09
$156
.88
($9.
18)
-5.5
%1,
500
342
%$1
07.9
6$1
6.83
$45.
27$1
70.0
6$1
07.9
6$1
6.83
$36.
09$1
60.8
8($
9.18
)-5
.4%
2,00
01
56%
$137
.35
$22.
42$6
0.36
$220
.13
$137
.35
$22.
42$4
8.12
$207
.89
($12
.24)
-5.6
%2,
000
356
%$1
41.3
5$2
2.42
$60.
36$2
24.1
3$1
41.3
5$2
2.42
$48.
12$2
11.8
9($
12.2
4)-5
.5%
151,
500
114
%$1
03.9
6$1
6.83
$45.
27$1
66.0
6$1
03.9
6$1
6.83
$36.
09$1
56.8
8($
9.18
)-5
.5%
1,50
03
14%
$107
.96
$16.
83$4
5.27
$170
.06
$107
.96
$16.
83$3
6.09
$160
.88
($9.
18)
-5.4
%
3,00
01
28%
$204
.14
$33.
63$9
0.54
$328
.31
$204
.14
$33.
63$7
2.18
$309
.95
($18
.36)
-5.6
%3,
000
328
%$2
08.1
4$3
3.63
$90.
54$3
32.3
1$2
08.1
4$3
3.63
$72.
18$3
13.9
5($
18.3
6)-5
.5%
4,50
01
42%
$304
.33
$50.
46$1
35.8
1$4
90.6
0$3
04.3
3$5
0.46
$108
.27
$463
.06
($27
.54)
-5.6
%4,
500
342
%$3
08.3
3$5
0.46
$135
.81
$494
.60
$308
.33
$50.
46$1
08.2
7$4
67.0
6($
27.5
4)-5
.6%
6,00
01
56%
$404
.51
$67.
26$1
81.0
8$6
52.8
5$4
04.5
1$6
7.26
$144
.36
$616
.13
($36
.72)
-5.6
%6,
000
356
%$4
08.5
1$6
7.26
$181
.08
$656
.85
$408
.51
$67.
26$1
44.3
6$6
20.1
3($
36.7
2)-5
.6%
252,
500
114
%$1
70.7
5$2
8.04
$75.
45$2
74.2
4$1
70.7
5$2
8.04
$60.
15$2
58.9
4($
15.3
0)-5
.6%
2,50
03
14%
$174
.75
$28.
04$7
5.45
$278
.24
$174
.75
$28.
04$6
0.15
$262
.94
($15
.30)
-5.5
%
5,00
01
28%
$337
.72
$56.
05$1
50.9
0$5
44.6
7$3
37.7
2$5
6.05
$120
.30
$514
.07
($30
.60)
-5.6
%5,
000
328
%$3
41.7
2$5
6.05
$150
.90
$548
.67
$341
.72
$56.
05$1
20.3
0$5
18.0
7($
30.6
0)-5
.6%
0 07,
500
142
%$5
04.7
0$8
4.09
$226
.35
$815
.14
$504
.70
$84.
09$1
80.4
5$7
69.2
4($
45.9
0)-5
.6%
37,
500
342
%$5
08.7
0$8
4.09
$226
.35
$819
.14
$508
.70
$84.
09$1
80.4
5$7
73.2
4($
45.9
0)-5
.6%
"Cl
III :::;
-c10
,000
156
%$6
71.6
7$1
12.1
0$3
01.8
0$1
,085
.57
$671
.67
$112
.10
$240
.60
$1,0
24.3
7($
61.2
0)-5
.6%
m10
,000
356
%$6
75.6
7$1
12.1
0$3
01.8
0$1
,089
.57
$675
.67
$112
.10
$240
.60
$1,0
28.3
7($
61.2
0)-5
.6%
(f)~
~3-
~;::
;:N
roC
f>Z
#B
AS
ICR
AT
EIN
CL
UD
ES
BA
SE
DIS
TR
IBU
TIO
N,
GE
NE
RA
TIO
N,
AN
DE
MB
ED
DE
DT
RA
NS
MIS
SIO
NR
AT
ES
.Q.~O
8.s.
m(##
RE
FLE
CT
SC
UR
RE
NT
AP
PL
ICA
BL
EN
ON
-BA
SE
RA
TE
RID
ER
SA
ND
TH
OS
EP
EN
DIN
GC
OM
MIS
SIO
NA
PP
RO
VA
LT
OB
EE
FF
EC
TIV
EA
PR
IL1,
2015
.~ro,-
RE
FLE
CT
ST
OT
AL
CU
RR
EN
TF
UE
LLE
VE
LO
F$
0.0
30
18
PE
RK
WH
.0
(0
»
..R
EF
LEC
TS
TO
TA
LP
RO
PO
SE
DF
UE
LLE
VE
LO
F$
0.0
24
06
PE
RK
WH
.

VIR
GIN
IAE
LE
CT
RIC
AN
DP
OW
ER
CO
MP
AN
YT
YP
ICA
LB
ILL
S-
SC
HE
DU
LE
GS
-1
BA
SE
MO
NT
HS
EF
FE
CT
IVE
FO
RE
FF
EC
TIV
EF
OR
US
AG
EO
NA
ND
AF
TE
RU
SA
GE
ON
AN
DA
FT
ER
04-0
1-20
15*
04-0
1-20
15**
AP
PLI
CA
BLE
AP
PL
ICA
BL
E
BIL
LLO
AD
BA
SIC
NO
N-F
UE
LT
OT
AL
BA
SIC
NO
N-F
UE
LT
OT
AL
PE
RC
EN
T
KW
KW
HP
HA
SE
FA
CT
OR
RA
TE
#R
IDE
RS
##F
UE
L'
BIL
LR
AT
E#
RID
ER
S##
FU
EL"
BIL
LD
IFF
ER
EN
CE
DIF
FE
RE
NC
E
550
01
14%
$42.
12$5
.62
$15.
09$6
2.83
$42.
12$5
.62
$12.
03$5
9.77
($3.
06)
-4.9
%50
03
14%
$46.
12$5
.62
$15.
09$6
6.83
$46.
12$5
.62
$12.
03$6
3.77
($3.
06)
-4.6
%
1,00
01
28%
$72.
76$1
1.21
$30.
18$1
14.1
5$7
2.76
$11.
21$2
4.06
$108
.03
($6.
12)
-5.4
%1,
000
328
%$7
6.76
$11.
21$3
0.18
$118
.15
$76.
76$1
1.21
$24.
06$1
12.0
3($
6.12
)-5
.2%
1,50
01
42%
$101
.36
$16.
83$4
5.27
$163
.46
$101
.36
$16.
83$3
6.09
$154
.28
($9.
18)
-5.6
%1,
500
342
%$1
05.3
6$1
6.83
$45.
27$1
67.4
6$1
05.3
6$1
6.83
$36.
09$1
58.2
8($
9.18
)-5
.5%
2,00
01
56%
$121
.78
$22.
42$6
0.36
$204
.56
$121
.78
$22.
42$4
8.12
$192
.32
($12
.24)
-6.0
%2,
000
356
%$1
25.7
8$2
2.42
$60.
36$2
08.5
6$1
25.7
8$2
2.42
$48.
12$1
96.3
2($
12.2
4)-5
.9%
151,
500
114
%$1
01.3
6$1
6.83
$45.
27$1
63.4
6$1
01.3
6$1
6.83
$36.
09$1
54.2
8($
9.18
)-5
.6%
1,50
03
14%
$105
.36
$16.
83$4
5.27
$167
.46
$105
.36
$16.
83$3
6.09
$158
.28
($9.
18)
-5.5
%
3,00
01
28%
$162
.62
$33.
63$9
0.54
$286
.79
$162
.62
$33.
63$7
2.18
$268
.43
($18
.36)
-6.4
%3,
000
328
%$1
66.6
2$3
3.63
$90.
54$2
90.7
9$1
66.6
2$3
3.63
$72.
18$2
72.4
3($
18.3
6)-6
.3%
4,50
01
42%
$223
.88
$50.
46$1
35.8
1$4
10.1
5$2
23.8
8$5
0.46
$108
.27
$382
.61
($27
.54)
-6.7
%4,
500
342
%$2
27.8
8$5
0.46
$135
.81
$414
.15
$227
.88
$50.
46$1
08.2
7$3
86.6
1($
27.5
4)-6
.6%
6,00
01
56%
$285
.14
$67.
26$1
81.0
8$5
33.4
8$2
85.1
4$6
7.26
$144
.36
$496
.76
($36
.72)
-6.9
%6,
000
356
%$2
89.1
4$6
7.26
$181
.08
$537
.48
$289
.14
$67.
26$1
44.3
6$5
00.7
6($
36.7
2)-6
.8%
252,
500
114
%$1
42.2
0$2
8.04
$75.
45$2
45.6
9$1
42.2
0$2
8.04
$60.
15$2
30.3
9($
15.3
0)-6
.2%
2,50
03
14%
$146
.20
$28.
04$7
5.45
$249
.69
$146
.20
$28.
04$6
0.15
$234
.39
($15
.30)
-6.1
%
5,00
01
28%
$244
.30
$56.
05$1
50.9
0$4
51.2
5$2
44.3
0$5
6.05
$120
.30
$420
.65
($30
.60)
-6.8
%5,
000
328
%$2
48.3
0$5
6.05
$150
.90
$455
.25
$248
.30
$56.
05$1
20.3
0$4
24.6
5($
30.6
0)-6
.7%
0 07,
500
142
%$3
46.4
0$8
4.09
$226
.35
$656
.84
$346
.40
$84.
09$1
80.4
5$6
10.9
4($
45.9
0)-7
.0%
37,
500
342
%$3
50.4
0$8
4.09
$226
.35
$660
.84
$350
.40
$84.
09$1
80.4
5$6
14.9
4($
45.9
0)-6
.9%
'0 Ql
:J '<;
10,0
001
56%
$448
.50
$112
.10
$301
.80
$862
.40
$448
.50
$112
.10
$240
.60
$801
.20
($61
.20)
-7.1
%m
10,0
003
56%
$452
.50
$112
.10
$301
.80
$866
.40
$452
.50
$112
.10
$240
.60
$805
.20
($61
.20)
-7.1
%CJ
)§j~
g.~;:+:
",(D
UlZ
#B
AS
ICR
AT
EIN
CL
UD
ES
BA
SE
DIS
TR
IBU
TIO
N.
GE
NE
RA
TIO
N,
AN
DE
MB
ED
DE
DT
RA
NS
MIS
SIO
NR
AT
ES
.og~~
##R
EF
LEC
TS
CU
RR
EN
TA
PP
LiC
AB
LE
NO
N-B
AS
ER
AT
ER
IDE
RS
AN
DT
HO
SE
PE
ND
ING
CO
MM
ISS
ION
AP
PR
OV
AL
TO
BE
EF
FE
CT
IVE
AP
RIL
1.20
15.
--ml
~(D<-
RE
FL
EC
TS
TO
TA
LC
UR
RE
NT
FU
EL
LEV
EL
OF
$0
.03
01
8P
ER
KW
H.
0(0
»
'*R
EF
LE
CT
ST
OT
AL
PR
OP
OS
ED
FU
EL
LEV
EL
OF
$0
.02
40
6P
ER
KW
H.

VIR
GIN
IAE
LE
CT
RIC
AN
DP
OW
ER
CO
MP
AN
YT
YP
ICA
LB
ILL
S-S
CH
ED
UL
EG
S-2
SU
MM
ER
MO
NT
HS
EFF
EC
TIV
EFO
RE
FFE
CT
IVE
FOR
USA
GE
ON
AN
DA
FTE
RU
SAG
EO
NA
ND
AFT
ER
04-0
1-20
15*
04-0
1-20
15**
APP
LIC
AB
LEA
PPLI
CA
BLE
BILL
LOA
DBA
SIC
NO
N-F
UEL
TOTA
LBA
SIC
NO
N-F
UEL
TOTA
LPE
RC
ENT
KWKW
HFA
CTO
RRA
TE#
RID
ERS#
#FU
EL*
BILL
RATE
#R
IDER
S##
FUEL
*'BI
LLD
IFFE
REN
CE
DIF
FER
ENC
E
304,
500
21%
$389
.72
$62.
08$1
35.8
1$5
87.6
1$3
89.7
2$6
2.08
$108
.27
$560
.07
($27
.54)
-4.7
%9,
000
42%
$571
.24
$97.
44$2
71.6
2$9
40.3
0$5
71.2
4$9
7.44
$216
.54
$885
.22
($55
.08)
-5.9
%15
,000
69%
$626
.69
$116
.16
$452
.70
$1,1
95.5
5$6
26.6
9$1
16.1
6$3
60.9
0$1
,103
.75
($91
.80)
-7.7
%
507,
500
21%
$635
.42
$103
.45
$226
.35
$965
.22
$635
.42
$103
.45
$180
.45
$919
.32
($45
.90)
-4.8
%15
,000
42%
$937
.95
$162
.40
$452
.70
$1,5
53.0
5$9
37.9
5$1
62.4
0$3
60.9
0$1
,461
.25
($91
.80)
-5.9
%25
,000
69%
$1,0
30.3
7$1
93.6
0$7
54.5
0$1
,978
.47
$1,0
30.3
7$1
93.6
0$6
01.5
0$1
,825
.47
($15
3.00
)-7
.7%
100
15,0
0021
%$1
,249
.67
$206
.85
$452
.70
$1,9
09.2
2$1
,249
.67
$206
.85
$360
.90
$1,8
17.4
2($
91.8
0)-4
.8%
30,0
0042
%$1
,854
.72
$324
.80
$905
.40
$3,0
84.9
2$1
,854
.72
$324
.80
$721
.80
$2,9
01.3
2($
183.
60)
-6.0
%50
,000
69%
$2,0
39.5
7$3
87.2
0$1
,509
.00
$3,9
35.7
7$2
,039
.57
$387
.20
$1,2
03.0
0$3
,629
.77
($30
6.00
)-7
.8%
150
22,5
0021
%$1
,863
.92
$310
.30
$679
.05
$2,8
53.2
7$1
,863
.92
$310
.30
$541
.35
$2,7
15.5
7($
137.
70)
-4.8
%45
,000
42%
$2,7
71.5
0$4
87.2
0$1
,358
.10
$4,6
16.8
0$2
,771
.50
$487
.20
$1,0
82.7
0$4
,341
.40
($27
5.40
)-6
.0%
75,0
0069
%$3
,048
.77
$580
.80
$2,2
63.5
0$5
,893
.07
$3,0
48.7
7$5
80.8
0$1
,804
.50
$5,4
34.0
7($
459.
00)
-7.8
%
250
37,5
0021
%$3
,092
.42
$517
.15
$1,1
31.7
5$4
,741
.32
$3,0
92.4
2$5
17.1
5$9
02.2
5$4
,511
.82
($22
9.50
)-4
.8%
75,0
0042
%$4
,605
.05
$812
.00
$2,2
63.5
0$7
,680
.55
$4,6
05.0
5$8
12.0
0$1
,804
.50
$7,2
21.5
5($
459.
00)
-6.0
%12
5,00
069
%$5
,067
.17
$968
.00
$3,7
72.5
0$9
,807
.67
$5,0
67.1
7$9
68.0
0$3
,007
.50
$9,0
42.6
7($
765.
00)
-7.8
%
450
67,5
0021
%$5
,549
.42
$930
.85
$2,0
37.1
5$8
,517
.42
$5,5
49.4
2$9
30.8
5$1
,624
.05
$8,1
04.3
2($
413.
10)
-4.9
%13
5,00
042
%$8
,272
.15
$1,4
61.6
0$4
,074
.30
$13,
808.
05$8
,272
.15
$1,4
61.6
0$3
,248
.10
$12,
981.
85($
826.
20)
-6.0
%22
5,00
069
%$9
,103
.97
$1,7
42.4
0$6
,790
.50
$17,
636.
87$9
,103
.97
$1,7
42.4
0$5
,413
.50
$16,
259.
87($
1,37
7.00
)-7
.8%
0 0II
BA
SIC
RA
TE
INC
LU
DE
SB
AS
ED
IST
RIB
UT
ION
,G
EN
ER
AT
lON
,A
ND
EM
BE
DD
ED
TR
AN
SM
ISS
ION
RA
TE
S.
3 '011
11R
EF
LE
CT
SC
UR
RE
NT
AP
PL
ICA
BL
EN
ON
-BA
SE
RA
TE
RID
ER
SA
ND
TH
OS
EP
EN
DIN
GC
OM
MIS
SIO
NA
PP
RO
VA
LT
OB
EE
FF
EC
TIV
EA
PR
IL1,
2015
.m :::
JR
EF
LE
CT
ST
OT
AL
CU
RR
EN
TF
UE
LLE
VE
LO
F$
0.0
30
18
PE
RK
WH
.'<
**R
EF
LE
CT
ST
OT
AL
PR
OP
OS
ED
FU
EL
LEV
EL
OF
$0
.02
40
6P
ER
KW
H.
m(J)~~
g.f6~
.."r
oU
lZ
a.~o
oc
.--
ml
~ro~
0<
.0
»

VIR
GIN
IAE
LE
CT
RIC
AN
DP
OW
ER
CO
MP
AN
YT
YP
ICA
LB
ILL
S-
SC
HE
DU
LE
GS
-2
BA
SE
MO
NT
HS
EF
FE
CT
IVE
FO
RE
FF
EC
TIV
EF
OR
US
AG
EO
NA
ND
AF
TE
RU
SA
GE
ON
AN
DA
FT
ER
04-0
1-20
15'
04-0
1-20
15**
AP
PLI
CA
BLE
AP
PLI
CA
BLE
BIL
LLO
AD
BA
SIC
NO
N·F
UE
LT
OT
AL
BA
SIC
NO
N·F
UE
LT
OT
AL
PE
RC
EN
T
KWKW
HF
AC
TO
RR
AT
E#
RID
ER
S##
FU
EL
'B
ILL
RA
TE
#R
IDE
RS
##F
UE
L"
BIL
LD
IFF
ER
EN
CE
DIF
FE
RE
NC
E-
304,
500
21%
$357
.32
$62.
08$1
35.8
1$5
55.2
1$3
57.3
2$6
2.08
$108
.27
$527
.67
($27
.54)
-5.0
%9,
000
42%
$528
.10
$97.
44$2
71.6
2$8
97.1
6$5
28.1
0$9
7.44
$216
.54
$842
.08
($55
.08)
-6.1
%15
,000
69%
$583
.55
$116
.16
$452
.70
$1,1
52.4
1$5
83.5
5$1
16.1
6$3
60.9
0$1
,060
.61
($91
.80)
-8.0
%
507,
500
21%
$581
.42
$103
.45
$226
.35
$911
.22
$581
.42
$103
.45
$180
.45
$865
.32
($45
.90)
-5.0
%15
,000
42%
$866
.05
$162
.40
$452
.70
$1,4
81.1
5$8
66.0
5$1
62.4
0$3
60.9
0$1
,389
.35
($91
.80)
-6.2
%25
,000
69%
$958
.47
$193
.60
$754
.50
$1,9
06.5
7$9
58.4
7$1
93.6
0$6
01.5
0$1
,753
.57
($15
3.00
)-8
.0%
100
15,0
0021
%$1
,141
.67
$206
.85
$452
.70
$1,8
01.2
2$1
,141
.67
$206
.85
$360
.90
$1,7
09.4
2($
91.8
0)-5
.1%
30,0
0042
%$1
,710
.92
$324
.80
$905
.40
$2,9
41.1
2$1
,710
.92
$324
.80
$721
.80
$2,7
57.5
2($
183.
60)
-6.2
%50
,000
69%
$1,8
95.7
7$3
87.2
0$1
,509
.00
$3,7
91.9
7$1
,895
.77
$387
.20
$1,2
03.0
0$3
,485
.97
($30
6.00
)-8
.1%
150
22,5
0021
%$1
,701
.92
$310
.30
$679
.05
$2,6
91.2
7$1
,701
.92
$310
.30
$541
.35
$2,5
53.5
7($
137.
70)
-5.1
%45
,000
42%
$2,5
55.8
0$4
87.2
0$1
,358
.10
$4,4
01.1
0$2
,555
.80
$487
.20
$1,0
82.7
0$4
,125
.70
($27
5.40
)-6
.3%
75,0
0069
%$2
,833
.07
$580
.80
$2,2
63.5
0$5
,677
.37
$2,8
33.0
7$5
80.8
0$1
,804
.50
$5,2
18.3
7($
459.
00)
-8.1
%
250
37,5
0021
%$2
,822
.42
$517
.15
$1,1
31.7
5$4
,471
.32
$2,8
22.4
2$5
17.1
5$9
02.2
5$4
,241
.82
($22
9.50
)-5
.1%
75,0
0042
%$4
,245
.55
$812
.00
$2,2
63.5
0$7
,321
.05
$4,2
45.5
5$8
12.0
0$1
,804
.50
$6,8
62.0
5($
459.
00)
-6.3
%12
5,00
069
%$4
,707
.67
$968
.00
$3,7
72.5
0$9
,448
.17
$4,7
07.6
7$9
68.0
0$3
,007
.50
$8,6
83.1
7($
765.
00)
-8.1
%
450
67,5
0021
%$5
,063
.42
$930
.85
$2,0
37.1
5$8
,031
.42
$5,0
63.4
2$9
30.8
5$1
,624
.05
$7,6
18.3
2($
413.
10)
-5.1
%13
5,00
042
%$7
,625
.05
$1,4
61.6
0$4
,074
.30
$13,
160.
95$7
,625
.05
$1,4
61.6
0$3
,248
.10
$12,
334.
75($
826.
20)
-6.3
%22
5,00
069
%$8
,456
.87
$1,7
42.4
0$6
,790
.50
$16,
989.
77$8
,456
.87
$1,7
42.4
0$5
,413
.50
$15,
612.
77($
1,37
7.00
)-8
.1%
0 0#
BA
SIC
RA
TE
INC
LUD
ES
BA
SE
DIS
TR
IBU
TIO
N,
GE
NE
RA
TlO
N,
AN
DE
MB
ED
DE
DT
RA
NS
MIS
SIO
NR
AT
ES
.3
##R
EF
LE
CT
SC
UR
RE
NT
AP
PL
ICA
BL
EN
ON
-BA
SE
RA
TE
RID
ER
SA
ND
TH
OS
EP
EN
DIN
GC
OM
MIS
SIO
NA
PP
RO
VA
LT
OB
EE
FF
EC
TIV
EA
PR
IL1,
2015
."0 OJ
RE
FL
EC
TS
TO
TA
LC
UR
RE
NT
FU
EL
LEV
EL
OF
$0
.03
01
8P
ER
KW
H.
=> '<••
RE
FL
EC
TS
TO
TA
LP
RO
PO
SE
DF
UE
LLE
VE
LO
F$
0.0
24
06
PE
RK
WH
.m
(I)~~
(')::::
:l_
.::T(1)~
01
(1)
(I)
Z
8,~~r
~(1),-
om
»

VIR
GIN
IAE
LE
CT
RIC
AN
DP
OW
ER
CO
MP
AN
YT
YP
ICA
LB
ILL
S-
SC
HE
DU
LE
GS
-3C
AL
CU
LA
TE
DF
OR
40%
AN
D60
%O
N-P
EA
KK
WH
US
AG
E
EF
FE
CT
IVE
FO
RE
FF
EC
TIV
EF
OR
US
AG
EO
NA
ND
AF
TE
RU
SA
GE
ON
AN
DA
FT
ER
04-0
1-20
15'
04-0
1-20
15"
AP
PL
ICA
BL
EA
PP
LIC
AB
LE
BIL
LLO
AD
ON
-PE
AK
OF
F-P
EA
KB
AS
ICN
ON
-FU
EL
TO
TA
LB
AS
ICN
ON
-FU
EL
TO
TA
LP
ER
CE
NT
KW
FA
CT
OR
KW
HK
WH
RA
TE
#R
IDE
RS
##F
UE
L'
BIL
LR
AT
E#
RID
ER
S##
FU
EL
"B
ILL
DIF
FE
RE
NC
ED
IFF
ER
EN
CE
500
28%
40,0
0060
,000
$8,0
79.2
5$2
,184
.00
$3,0
18.0
0$1
3,28
1.25
$8,0
79.2
5$2
,184
.00
$2,4
06.0
0$1
2,66
9.25
($61
2.00
)-4
.6%
28%
60,0
0040
,000
$8,1
05.6
5$2
,184
.00
$3,0
18.0
0$1
3,30
7.65
$8,1
05.6
5$2
,184
.00
$2,4
06.0
0$1
2,69
5.65
($61
2.00
)-4
.6%
49
%70
,000
105,
000
$8,3
34.8
5$2
,209
.50
$5,2
81.5
0$1
5,82
5.85
$8,3
34.8
5$2
,209
.50
$4,2
10.5
0$1
4,75
4.85
($1,
071.
00)
-6.8
%4
9%
105,
000
70,0
00$8
,381
.05
$2,2
09.5
0$5
,281
.50
$15,
872.
05$8
,381
.05
$2,2
09.5
0$4
,210
.50
$14,
801.
05($
1,07
1.00
)-6
.7%
69%
100,
000
150,
000
$8,5
90.4
5$2
,235
.00
$7,5
45.0
0$1
8,37
0.45
$8,5
90.4
5$2
,235
.00
$6,0
15.0
0$1
.6,8
40.4
5($
1,53
0.00
)-8
.3%
69%
150,
000
100,
000
$8,6
56.4
5$2
,235
.00
$7,5
45.0
0$1
8,43
6.45
$8,6
56.4
5$2
,235
.00
$6,0
15.0
0$1
6,90
6.45
($1,
530.
00)
-8.3
%
1,00
028
%80
,000
120,
000
$16,
038.
85$4
,368
.00
$6,0
36.0
0$2
6,44
2.85
$16,
038.
85$4
,368
.00
$4,8
12.0
0$2
5,21
8.85
($1,
224.
00)
-4.6
%28
%12
0,00
080
,000
$16,
091.
65$4
,368
.00
$6,0
36.0
0$2
6,49
5.65
$16,
091.
65$4
,368
.00
$4,8
12.0
0$2
5,27
1.65
($1,
224.
00)
-4.6
%
49
%14
0,00
021
0,00
0$1
6,55
0.05
$4,4
19.0
0$1
0,56
3.00
$31,
532.
05$1
6,55
0.05
$4,4
19.0
0$8
,421
.00
$29,
390.
05($
2,14
2.00
)-6
.8%
49%
210,
000
140,
000
$16,
642.
45$4
,419
.00
$10,
563.
00$3
1,62
4.45
$16,
642.
45$4
,419
.00
$8,4
21.0
0$2
9,48
2.45
($2,
142.
00)
-6.8
%
69%
200,
000
300,
000
$17,
061.
25$4
,470
.00
$15,
090.
00$3
6,62
1.25
$17,
061.
25$4
,470
.00
$12,
030.
00$3
3,56
1.25
($3,
060.
00)
-8.4
%69
%30
0,00
020
0,00
0$1
7,19
3.25
$4,4
70.0
0$1
5,09
0.00
$36,
753.
25$1
7,19
3.25
$4,4
70.0
0$1
2,03
0.00
$33,
693.
25($
3,06
0.00
)-8
.3%
5,00
028
%40
0,00
060
0,00
0$7
9,71
5.50
$21,
840.
00$3
0,18
0.00
$131
,735
.50
$79,
715.
50$2
1,84
0.00
$24,
060.
00$1
25,6
15.5
0($
6,12
0.00
)-4
.6%
28%
600,
000
400,
000
$79,
979.
50$2
1,84
0.00
$30,
180.
00$1
31,9
99.5
0$7
9,97
9.50
$21,
840.
00$2
4,06
0.00
$125
,879
.50
($6,
120.
00)
-4.6
%
49
%70
0,00
01,
050,
000
$82,
271.
50$2
2,09
5.00
$52,
815.
00$1
57,1
81.5
0$8
2,27
1.50
$22,
095.
00$4
2,10
5.00
$146
,471
.50
($10
,710
.00)
-6.8
%4
9%
1,05
0,00
070
0,00
0$8
2,73
3.50
$22,
095.
00$5
2,81
5.00
$157
,643
.50
$82,
733.
50$2
2,09
5.00
$42,
105.
00$1
46,9
33.5
0($
10,7
10.0
0)-6
.8%
69%
1,00
0,00
01,
500,
000
$84,
827.
50$2
2,35
0.00
$75,
450.
00$1
82,6
27.5
0$8
4,82
7.50
$22,
350.
00$6
0,15
0.00
$167
,327
.50
($15
,300
.00)
-8.4
%69
%1,
500,
000
1,00
0,00
0$8
5,48
7.50
$22,
350.
00$7
5,45
0.00
$183
,287
.50
$85,
487.
50$2
2,35
0.00
$60,
150.
00$1
67,9
87.5
0($
15,3
00.0
0)-8
.3%
10,0
0028
%80
0,00
01,
200,
000
$159
,311
.35
$43,
680.
00$6
0,36
0.00
$263
,351
.35
$159
,311
.35
$43,
680.
00$4
8,12
0.00
$251
,111
.35
($12
,240
.00)
-4.6
%28
%1,
200,
000
800,
000
$159
,839
.35
$43,
680.
00$6
0,36
0.00
$263
,879
.35
$159
,839
.35
$43,
680.
00$4
8,12
0.00
$251
,639
.35
($12
,240
.00)
-4.6
%0
$105
,630
.00
$314
,243
.35
$164
,423
.35
$44,
190.
00$8
4,21
0.00
$292
,823
.35
($21
,420
.00)
-6.8
%0
49%
1,40
0,00
02,
100,
000
$164
,423
.35
$44,
190.
003
49%
2,10
0,00
01,
400,
000
$165
,347
.35
$44,
190.
00$1
05,6
30.0
0$3
15,1
67.3
5$1
65,3
47.3
5$4
4,19
0.00
$84,
210.
00$2
93,7
47.3
5($
21,4
20.0
0)-8
.8%
'0 !ll
::::l
-c69
%2,
000,
000
3,00
0,00
0$1
69,5
35.3
5$4
4,70
0.00
$150
,900
.00
$365
,135
.35
$169
,535
.35
$44,
700.
00$1
20,3
00.0
0$3
34,5
35.3
5($
30,6
00.0
0)-8
.4%
m69
%3,
000,
000
2,00
0,00
0$1
70,8
55.3
5$4
4,70
0.00
$150
,900
.00
$366
,455
.35
$170
,855
.35
$44,
700.
00$1
20,3
00.0
0$3
35,8
55.3
5($
30,6
00.0
0)-8
.4%
(j)§
~g.~;:+
(J)<
DU
>Z
#B
AS
ICR
AT
EIN
CL
UD
ES
BA
SE
DIS
TR
IBU
TIO
N,
GE
NE
RA
TIO
N,
AN
DE
MB
ED
DE
DT
RA
NS
MIS
SIO
NR
AT
ES
.s;,~~r
~<D,--
##R
EF
LEC
TS
CU
RR
EN
TA
PP
LIC
AB
LE
NO
N-B
AS
ER
AT
ER
IDE
RS
AN
DT
HO
SE
PE
ND
ING
CO
MM
ISS
ION
AP
PR
OV
AL
TO
BE
EF
FE
CT
IVE
AP
RIL
1,2
01
5.
0<
.0
»
RE
FLE
CT
ST
OT
AL
CU
RR
EN
TF
UE
LLE
VE
LO
F$0
.030
18P
ER
KW
H.
••R
EF
LE
CT
ST
OT
AL
PR
OP
OS
ED
FU
EL
LEV
EL
OF
$0.0
2406
PE
RK
WH
.

VIR
GIN
IAE
LE
CT
RIC
AN
DP
OW
ER
CO
MP
AN
YT
YP
ICA
LB
ILL
S-
SC
HE
DU
LE
GS
-4C
AL
CU
LA
TE
DF
OR
40%
AN
D60
%O
N-P
EA
KK
WH
US
AG
EP
RIM
AR
YS
ER
VIC
E
EF
FE
CT
IVE
FO
RE
FF
EC
TIV
EF
OR
US
AG
EO
NA
ND
AF
TE
RU
SA
GE
ON
AN
DA
FT
ER
04-0
1-20
15'
04-0
1-20
15"
AP
PLI
CA
BLE
AP
PLI
CA
BLE
BIL
LLO
AD
ON
-PE
AK
OF
F-P
EA
KB
AS
ICN
ON
-FU
EL
TO
TA
LB
AS
ICN
ON
-FU
EL
TO
TA
LP
ER
CE
NT
KW
FA
CT
OR
KW
HK
WH
RA
TE
#R
IDE
RS
##F
UE
L'
BIL
LR
AT
E#
RID
ER
S##
FU
EL
"B
ILL
DIF
FE
RE
NC
ED
IFF
ER
EN
CE
500
28%
40,0
0060
,000
$7,5
97.8
5$1
,998
.50
$3,0
18.0
0$1
2,61
4.35
$7,5
97.8
5$1
,998
.50
$2,4
06.0
0$1
2,00
2.35
($61
2.00
)-4
.9%
28%
60,0
0040
,000
$7,6
24.2
5$1
,998
.50
$3,0
18.0
0$1
2,64
0.75
$7,6
24.2
5$1
,998
.50
$2,4
06.0
0$1
2,02
8.75
($61
2.00
)-4
.8%
56%
80,0
0012
0,00
0$7
,934
.65
$2,0
23.5
0$6
,036
.00
$15,
994.
15$7
,934
.65
$2,0
23.5
0$4
,812
.00
$14,
770.
15($
1,22
4.00
)-7
.7%
56%
120,
000
80,0
00$7
,987
.45
$2,0
23.5
0$6
,036
.00
$16,
046.
95$7
,987
.45
$2,0
23.5
0$4
,812
.00
$14,
822.
95($
1,22
4.00
)-7
.6%
83%
120,
000
180,
000
$8,2
71.4
5$2
,048
.50
$9,0
54.0
0$1
9,37
3.95
$8,2
71.4
5$2
,048
.50
$7,2
18.0
0$1
7,53
7.95
($1,
836.
00)
-9.5
%83
%15
0,00
015
0,00
0&
$8,3
11.0
5$2
,048
.50
$9,0
54.0
0$1
9,41
3.55
$8,3
11.0
5$2
,048
.50
$7,2
18.0
0$1
7,57
7.55
($1,
836.
00)
-9.5
%
5,00
028
%40
0,00
060
0,00
0$7
4,83
1.30
$19,
985.
00$3
0,18
0.00
$124
,996
.30
$74,
831.
30$1
9,98
5.00
$24,
060.
00$1
18,8
76.3
0($
6,12
0.00
)-4
.9%
28%
600,
000
400,
000
$75,
095.
30$1
9,98
5.00
$30,
180.
00$1
25,2
60.3
0$7
5,09
5.30
$19,
985.
00$2
4,06
0.00
$119
,140
.30
($6,
120.
00)
-4.9
%
56%
800,
000
1,20
0,00
0$7
8,19
9.30
$20,
235.
00$6
0,36
0.00
$158
,794
.30
$78,
199.
30$2
0,23
5.00
$48,
120.
00$1
46,5
54.3
0($
12,2
40.0
0)-7
.7%
56%
1,20
0,00
080
0,00
0$7
8,72
7.30
$20,
235.
00$6
0,36
0.00
$159
,322
.30
$78,
727.
30$2
0,23
5.00
$48,
120.
00$1
47,0
82.3
0($
12,2
40.0
0)-7
.7%
83%
1,20
0,00
01,
800,
000
$81,
567.
30$2
0,48
5.00
$90,
540.
00$1
92,5
92.3
0$8
1,56
7.30
$20,
485.
00$7
2,18
0.00
$174
,232
.30
($18
,360
.00)
-9.5
%83
%1,
500,
000
1,50
0,00
0&
$81,
963.
30$2
0,48
5.00
$90,
540.
00$1
92,9
88.3
0$8
1,96
3.30
$20,
485.
00$7
2,18
0.00
$174
,628
.30
($18
,360
.00)
-9.5
%
10,0
0028
%80
0,00
01,
200,
000
$148
,825
.15
$39,
970.
00$6
0,36
0.00
$249
,155
.15
$148
,825
.15
$39,
970.
00$4
8,12
0.00
$236
,915
.15
($12
,240
.00)
-4.9
%28
%1,
200,
000
800,
000
$149
,353
.15
$39,
970.
00$6
0,36
0.00
$249
,683
.15
$149
,353
.15
$39,
970.
00$4
8,12
0.00
$237
,443
.15
($12
,240
.00)
-4.9
%
56%
1,60
0,00
02,
400,
000
$155
,561
.15
$40,
470.
00$1
20,7
20.0
0$3
16,7
51.1
5$1
55,5
61.1
5$4
0,47
0.00
$96,
240.
00$2
92,2
71.1
5($
24,4
80.0
0)-7
.7%
56%
2,40
0,00
01,
600,
000
$156
,617
.15
$40,
470.
00$1
20,7
20.0
0$3
17,8
07.1
5$1
56,6
17.1
5$4
0,47
0.00
$96,
240.
00$2
93,3
27.1
5($
24,4
80.0
0)-7
.7%
83%
2,40
0,00
03,
600,
000
$162
,297
.15
$40,
970.
00$1
81,0
80.0
0$3
84,3
47.1
5$1
62,2
97.1
5$4
0,97
0.00
$144
,360
.00
$347
,627
.15
($36
,720
.00)
-9.6
%83
%3,
000,
000
3,00
0,00
0&
$163
,089
.15
$40,
970.
00$1
81,0
80.0
0$3
85,1
39.1
5$1
63,0
89.1
5$4
0,97
0.00
$144
,360
.00
$348
,419
.15
($36
,720
.00)
-9.5
%
30,0
0028
%2,
400,
000
3,60
0,00
0$4
44,8
00.4
0$1
19,9
10.0
0$1
81,0
80.0
0$7
45,7
90.4
0$4
44,8
00.4
0$1
19,9
10.0
0$1
44,3
60.0
0$7
09,0
70.4
0($
36,7
20.0
0)-4
.9%
28%
3,60
0,00
02,
400,
000
$446
,384
.40
$119
,910
.00
$181
,080
.00
$747
,374
.40
$446
,384
.40
$119
,910
.00
$144
,360
.00
$710
,654
.40
($36
,720
.00)
-4.9
%
56%
4,80
0,00
07,
200,
000
$465
,008
.40
$121
,410
.00
$362
,160
.00
$948
,578
.40
$465
,008
.40
$121
,410
.00
$288
,720
.00
$875
,138
.40
($73
,440
.00)
-7.7
%56
%7,
200,
000
4,80
0,00
0$4
68,1
76.4
0$1
21,4
10.0
0$3
62,1
60.0
0$9
51,7
46.4
0$4
68,1
76.4
0$1
21,4
10.0
0$2
88,7
20.0
0$8
78,3
06.4
0($
73,4
40.0
0)-7
.7%
0 0 383
%7,
200,
000
10,8
00,0
00$4
85,2
16.4
0$1
22,9
10.0
0$5
43,2
40.0
0$1
,151
,366
.40
$485
,216
.40
$122
,910
.00
$433
,080
.00
$1,0
41,2
06.4
0($
110,
160.
00)
-9.6
%'0 O
J
83%
9,00
0,00
09,
000,
000
&$4
87,5
92.4
0$1
22,9
10.0
0$5
43,2
40.0
0$1
,153
,742
.40
$487
,592
.40
$122
,910
.00
$433
,080
.00
$1,0
43,5
82.4
0($
110,
160.
00)
-9.5
%::J -c m
#B
AS
ICR
AT
EIN
CLU
DE
SB
AS
ED
IST
RIB
UT
ION
,G
EN
ER
AT
lON
,A
ND
EM
BE
DD
ED
TR
AN
SM
ISS
ION
RA
TE
S.
(f)§
~#4
/R
EF
LEC
TS
CU
RR
EN
TA
PP
LIC
AB
LE
NO
N-B
AS
ER
AT
ER
IDE
RS
AN
DT
HO
SE
PE
ND
ING
CO
MM
ISS
ION
AP
PR
OV
AL
TO
BE
EF
FE
CT
IVE
AP
RIL
"20
15.
g.~;:;:
--J<
DU
>Z
RE
FLE
CT
ST
OT
AL
CU
RR
EN
TF
UE
LLE
VE
LO
F$0
.030
18P
ER
KW
H.
~d~:;(
••R
EF
LEC
TS
TO
TA
LP
RO
PO
SE
DF
UE
LLE
VE
LO
F$
0.0
24
06
PE
RK
WH
.~<D,-
&O
N·P
EA
KK
WH
SE
TA
TM
AX
IMU
MLE
VE
LT
HA
TC
OU
LDB
EC
ON
SU
ME
DIN
AB
AS
EM
ON
TH
AS
SU
MIN
GA
100%
ON
·PE
AK
LOA
DF
AC
TO
RF
OR
30D
AY
S.
OC
O»

VIR
GIN
IAE
LEC
TR
ICA
ND
PO
WE
RC
OM
PA
NY
TY
PIC
AL
BIL
LS
-S
CH
ED
ULE
GS
-4C
AL
CU
LA
TE
DF
OR
40%
AN
D60
%O
N-P
EA
KK
WH
US
AG
ET
RA
NS
MIS
SIO
NS
ER
VIC
E
EF
FE
CT
IVE
FO
RE
FF
EC
TIV
EF
OR
US
AG
EO
NA
ND
AF
TE
RU
SA
GE
ON
AN
DA
FT
ER
04-0
1-20
15'
04-0
1-20
15"
AP
PLI
CA
BLE
AP
PLI
CA
BLE
BIL
LLO
AD
ON
-PE
AK
OF
F-P
EA
KB
AS
ICN
ON
-FU
EL
TO
TA
LB
AS
iCN
ON
-FU
EL
TO
TA
LP
ER
CE
NT
KW
FA
CT
OR
KWH
KW
HR
AT
E#
RID
ER
S##
FU
EL
'B
ILL
RA
TE
#R
IDE
RS
##F
UE
L"
BIL
LD
IFF
ER
EN
CE
DIF
FE
RE
NC
E
500
28%
40,0
0060
,000
$7,1
33,8
5$1
,947
.50
$3,0
18.0
0$1
2,09
9.35
$7,1
33.8
5$1
,947
.50
$2,4
06.0
0$1
1,48
7.35
($61
2.00
)-5
.1%
28%
60,0
0040
,000
$7,1
60.2
5$1
,947
.50
$3,0
18.0
0$1
2,12
5.75
$7,1
60.2
5$1
,947
.50
$2,4
06,0
0$1
1,51
3.75
($61
2,00
)-5
.0%
56%
80,0
0012
0,00
0$7
,470
.65
$1,9
72.5
0$6
,036
.00
$15,
479.
15$7
,470
.65
$1,9
72.5
0$4
,812
.00
$14,
255.
15($
1,22
4.00
)-7
.9%
56%
120,
000
80,0
00$7
,523
.45
$1,9
72.5
0$6
,036
.00
$15,
531,
95$7
,523
.45
$1,9
72.5
0$4
,812
.00
$14,
307.
95($
1,22
4.00
)-7
.9%
83%
120,
000
180,
000
$7,8
07.4
5$1
,997
.50
$9,0
54.0
0$1
8,85
8.95
$7,8
07.4
5$1
,997
.50
$7,2
18.0
0$1
7,02
2.95
($1,
836.
00)
-9.7
%83
%15
0,00
015
0,00
0&
$7,8
47.0
5$1
,997
.50
$9,0
54.0
0$1
8,89
8.55
$7,8
47.0
5$1
,997
.50
$7,2
18.0
0$1
7,06
2.55
($1,
836.
00)
-9,7
%
5,00
028
%40
0,00
060
0,00
0$7
0,19
1.30
$19,
475,
00$3
0,18
0,00
$119
,846
.30
$70,
191.
30$1
9,47
5.00
$24,
060.
00$1
13,7
26.3
0($
6,12
0.00
)-5
.1%
28%
600,
000
400,
000
$70,
455.
30$1
9,47
5.00
$30,
180.
00$1
20,1
10,3
0$7
0,45
5.30
$19,
475,
00$2
4,06
0.00
$113
,990
.30
($6,
120,
00)
-5.1
%
56%
800,
000
1,20
0,00
0$7
3,55
9.30
$19,
725.
00$6
0,36
0.00
$153
,644
.30
$73,
559.
30$1
9,72
5.00
$48,
120.
00$1
41,4
04.3
0($
12,2
40.0
0)-8
.0%
56%
1,20
0,00
080
0,00
0$7
4,08
7,30
$19,
725.
00$6
0,36
0,00
$154
,172
.30
$74,
087.
30$1
9,72
5.00
$48,
120.
00$1
41,9
32.3
0($
12,2
40.0
0)-7
.9%
83%
1,20
0,00
01,
800,
000
$76,
927.
30$1
9,97
5.00
$90,
540.
00$1
87,4
42,3
0$7
6,92
7.30
$19,
975.
00$7
2,18
0.00
$169
,082
.30
($18
,360
.00)
-9.8
%83
%1,
500,
000
1,50
0,00
0&
$77,
323.
30$1
9,97
5.00
$90,
540.
00$1
87,8
38.3
0$7
7,32
3.30
$19,
975.
00$7
2,18
0.00
$169
,478
.30
($18
,360
,00)
-9.8
%
10,0
0028
%80
0,00
01,
200,
000
$140
,255
.15
$38,
950.
00$6
0,36
0.00
$239
,565
,15
$140
,255
.15
$38,
950.
00$4
8,12
0.00
$227
,325
.15
($12
,240
.00)
-5,1
%28
%1,
200,
000
800,
000
$140
,783
.15
$38,
950.
00$6
0,36
0.00
$240
,093
.15
$140
,783
.15
$38,
950.
00$4
8,12
0.00
$227
,853
.15
($12
,240
.00)
-5.1
%
56%
1,60
0,00
02,
400,
000
$146
,991
.15
$39,
450.
00$1
20,7
20.0
0$3
07,1
61.1
5$1
46,9
91.1
5$3
9,45
0.00
$96,
240.
00$?
82,6
81.1
5($
24,4
80,0
0)-8
.0%
56%
2,40
0,00
01,
600,
000
$148
,047
.15
$39,
450.
00$1
20,7
20.0
0$3
08,2
17.1
5$1
48,0
47.1
5$3
9,45
0.00
$96,
240,
00$2
83,7
37.1
5($
24,4
80.0
0)-7
.9%
83%
2,40
0,00
03,
600,
000
$153
,727
.15
$39,
950.
00$1
81,0
80.0
0$3
74,7
57.1
5$1
53,7
27.1
5$3
9,95
0,00
$144
,360
,00
$338
,037
,15
($36
,720
.00)
-9,8
%83
%3,
000,
000
3,00
0,00
0&
$154
,519
.15
$39,
950.
00$1
81,0
80.0
0$3
75,5
49.1
5$1
54,5
19.1
5$3
9,95
0.00
$144
,360
.00
$338
,829
.15
($36
,720
.00)
-9.8
%
30,0
0028
%2,
400,
000
3,60
0,00
0$4
20,5
10.4
0$1
16,8
50.0
0$1
81,0
80.0
0$7
18,4
40.4
0$4
20,5
10.4
0$1
16,8
50.0
0$1
44,3
60.0
0$6
81,7
20.4
0($
36,7
20.0
0)-5
,1%
28%
3,60
0,00
02,
400,
000
$422
,094
.40
$116
,850
.00
$181
,080
.00
$720
,024
.40
$422
,094
.40
$116
,850
.00
$144
,360
,00
$683
,304
.40
($36
,720
,00)
-5.1
%
56%
4,80
0,00
07,
200,
000
$440
,718
.40
$118
,350
.00
$362
,160
.00
$921
,228
.40
$440
,718
.40
$118
,350
.00
$288
,720
.00
$847
,788
.40
($73
,440
.00)
-8,0
%0
56%
7,20
0,00
04,
800,
000
$443
,886
.40
$118
,350
.00
$362
,160
.00
$924
,396
.40
$443
,886
.40
$118
,350
.00
$288
,720
.00
$850
,956
.40
($73
,440
,00)
-7.9
%0 3 "0
83%
7,20
0,00
010
,800
,000
$460
,926
.40
$119
,850
.00
$543
,240
,00
$1,1
24,0
16.4
0$4
60,9
26.4
0$1
19,8
50,0
0$4
33,0
80.0
0$1
,013
,856
.40
($11
0,16
0.00
)-9
.8%
ill
:J83
%9,
000,
000
9,00
0,00
0&
$463
,302
.40
$119
,850
,00
$543
,240
.00
$1,1
26,3
92.4
0$4
63,3
02.4
0$1
19,8
50,0
0$4
33,0
80.0
0$1
,016
,232
.40
($11
0,16
0.00
)-9
.8%
'< m
#B
AS
ICR
AT
EIN
CLU
DE
SB
AS
ED
IST
RIB
UT
ION
,G
EN
ER
AT
lON
,A
ND
EM
BE
DD
ED
TR
AN
SM
ISS
ION
RA
TE
S.
(j)§~
g.ffi
;=;:
##R
EF
LE
CT
SC
UR
RE
NT
AP
PL
/CA
BL
EN
ON
-BA
SE
RA
TE
RID
ER
SA
ND
TH
OS
EP
EN
DIN
GC
OM
MIS
SIO
NA
PP
RO
VA
LT
OB
EE
FF
EC
TIV
EA
PR
IL1.
2015
.O
OC
DU
lZR
EF
LEC
TS
TO
TA
LC
UR
RE
NT
FU
EL
LEV
EL
OF
$0
.03
01
8P
ER
KW
HS
,~~r
"R
EF
LEC
TS
TO
TA
LP
RO
PO
SE
DF
UE
LLE
VE
LO
F$
0.0
24
06
PE
RK
WH
~CD,--
&O
N-P
EA
KK
WH
SE
TA
TM
AX
IMU
MLE
VE
LT
HA
TC
OU
LDB
EC
ON
SU
ME
DIN
AB
AS
EM
ON
TH
AS
SU
MIN
GA
100%
ON
-PE
AK
LOA
DF
AC
TO
RF
OR
30D
AY
S.
0(0
»

Company Exhibit No. _Witness: EJA
Schedule 99 of 10
VIRGINIA ELECTRIC AND POWER COMPANYTYPICAL BILLS - CHURCH AND SYNAGOGUE - SCHEDULE 5C
SUMMER MONTHS
EFFECTIVE FOR EFFECTIVE FORUSAGE ON AND AFTER USAGE ON AND AFTER
04-01-2015' 04-01-2015**APPLICABLE APPLICABLE
BASIC NON·FUEL TOTAL BASIC NON·FUEL TOTAL PERCENT
KWH RATE # RIDERS## FUEL' BILL RATE # RIDERS## FUEL" BILL DIFFERENCE DIFFERENCE
1,500 $118.56 $17.75 $45.27 $181.58 $118.56 $17.75 $36.09 $172.40 ($9.18) -5.1%
3,000 $228.61 $35.49 $90.54 $354.64 $228.61 $35.49 $72.18 $336.28 ($18.36) -5.2%
5,000 $367.57 $59.15 $150.90 $577.62 $367.57 $59.15 $120.30 $547.02 ($30.60) -5.3%
7,500 $541.27 $88.73 $226.35 $856.35 $541.27 $88.73 $180.45 $810.45 ($45.90) -5.4%
10,000 $714.97 $118.30 $301.80 $1,135.07 $714.97 $118.30 $240.60 $1,073.87 ($61.20) -5.4%
15,000 $1,062.37 $177.45 $452.70 $1,692.52 $1,062.37 $177.45 $360.90 $1,600.72 ($91.80) -5.4%
BASE MONTHSAPPLICABLE APPLICABLE
BASIC NON-FUEL TOTAL BASIC NON-FUEL TOTAL PERCENT
KWH RATE # RIDERS## FUEL' BILL RATE # RIDERS## FUEL" BILL DIFFERENCE DIFFERENCE
1,500 $11856 $17.75 $45.27 $181.58 $118.56 $17.75 $36.09 $172.40 ($918) -5.1%
3,000 $228.61 $35.49 $90.54 $354.64 $228.61 $35.49 $72.18 $336.28 ($18.36) -5.2%
5,000 $355.73 $59.15 $150.90 $565.78 $355.73 $59.15 $120.30 $535.18 ($30.60) -5.4%
7,500 $514.63 $88.73 $226.35 $829.71 $514.63 $88.73 $180.45 $783.81 ($45.90) -5.5%
10,000 $673.53 $118.30 $301.80 $1,093.63 $673.53 $118.30 $240.60 $1,032.43 ($61 :20) -5.6%
15,000 $991.33 $177.45 $452.70 $1,621.48 $991.33 $177.45 $360.90 $1,529.68 ($91.80) -5.7%
# BASIC RA TE INCLUDES BASE DISTRIBUTION, GENERATION, AND EMBEDDED TRANSMISSION RATES.
## REFLECTS CURRENT APPLICABLE NON-BASE RATE RIDERS AND THOSE PENDING COMMISSION APPROVAL TO BE EFFECTIVE APRIL 1, 2015., REFLECTS TOTAL CURRENT FUEL LEVEL OF $0.03018 PER KWH.
*' REFLECTS TOTAL PROPOSED FUEL LEVEL OF $0.02406 PER KWH.

DOMINION VIRGINIA POWER1,000 KWH SEASONALLY WEIGHTED RESIDENTIAL BILLRATE SCHEDULE 1
BILL COMPONENTS ~
DISTRIBUTION· BASE s 27.63GENERATION· BASE $ 38.11TRANSMISSION $ 9.43FUEL s 24.06GENERATION A6 $ 9.70DSM/EE A5 $ 0.62
TOTAL BILL $ 109.55
Company Exhibit No. _Witness: EJA
Schedule 910 of 10
KWH KWHRATES RATES 1,000 I 1,000 I
BILL COMPONENTS SUMMER NON·SUMMER SUMMER NON·SUMMER WEIGHTED
BASIC CUSTOMER CHARGE $ 7.00 s 7.00 s 7.00 $ 7.00 $ 7.00
DISTRIBUTION 800 KWH $ 0.02258 $ 0.02258 $ 18.06 $ 18.06 $ 18.06
DISTRIBUTION OVER 800 KWH $ 0.01285 $ 0.01285 $ 2.57 $ 2.57 $ 2.57
ELECTRICITY SUPPLY SERVICE 800 KWH $ 0.03795 $ 0.03795 $ 30.36 $ 30.36 $ 30.36
ELECTRICITY SUPPLY SERVICE OVER 800 KWH $ 0.05773 $ 0.02927 $ 11.55 $ 5.85 7.75
TRANSMISSION $ 0.00970 s 0.00970 $ 9.70 $ 9.70 s 9.70
RIDER T1 • TRANSMISSION $ (0.00027) $ (0.00027) s (0.27) $ (0.27) $ (0.27)
FUEL FACTOR RIDER A' $ 0.02406 $ 0.02406 $ 24.06 $ 24.06 $ 24.06
RIDER C1A (A5) $ 0.00002 $ 0.00002 $ 0.02 s 0.02 $ 0.02
RIDER C2A (A5) $ 0.00060 $ 0.00060 $ 0.60 s 0.60 0.60
RIDER B • BIOMASS (A6)' $ 0.00022 $ 0.00022 $ 0.22 $ 0.22 $ 0.22
RIDER R • BEAR GARDEN (A6)' $ 0.00143 $ 0.00143 $ 1.43 $ 1.43 $ 1.43
RIDER S • VCHEC (A6)' $ 0.00418 s 0.00418 $ 4.18 $ 4.18 $ 4.18
RIDER W· WARREN COUNTY (A6) $ 0.00230 $ 0.00230 $ 2.30 $ 2.30 2.30
RIDER BW • BRUNSWICK COUNTY (A6) $ 0.00157 $ 0.00157 $ 1.57 $ 1.57 $ 1.57
BILL AMOUNT $ 113.35 $ 107.65 109.55
BLEND (SUMMER x 4 • NON·SUMMER x 8) $ 453.40 $ 861.20
AVG $ 109.55
'PENDING SCC APPROVAL