application and use of insect phenology modeling for ...observed and modeled effects of cc on insect...
TRANSCRIPT

11 – 14 October, 2 0 1 0
WorkshopPotential Invasive Pests Workshop
M. Sporleder, J. Kroschel , R. Simon, H. Tonnang, P. Carhuapoma, J.C. Gonzales, H. Juarez, CIP-Agroecology/IPM Group and Research Informatics Unit, Lima, Peru
Application and Use of Insect Phenology Modeling for Invasive
Species for Regional and Global Risk Assessments under Future Climate
Change Scenarios

Introduction• Invasive potato pest species• Expected impacts of CC to pests• Observed and modeled effects of CC to pests• Temperature-based phenology modeling
Methodology
Outline
Methodology• Data collection and data analysis using ILCYM software
Results• Model parameterization and validation• Risk mapping worldwide and for the Andean region under different
climate change scenarios
Conclusions
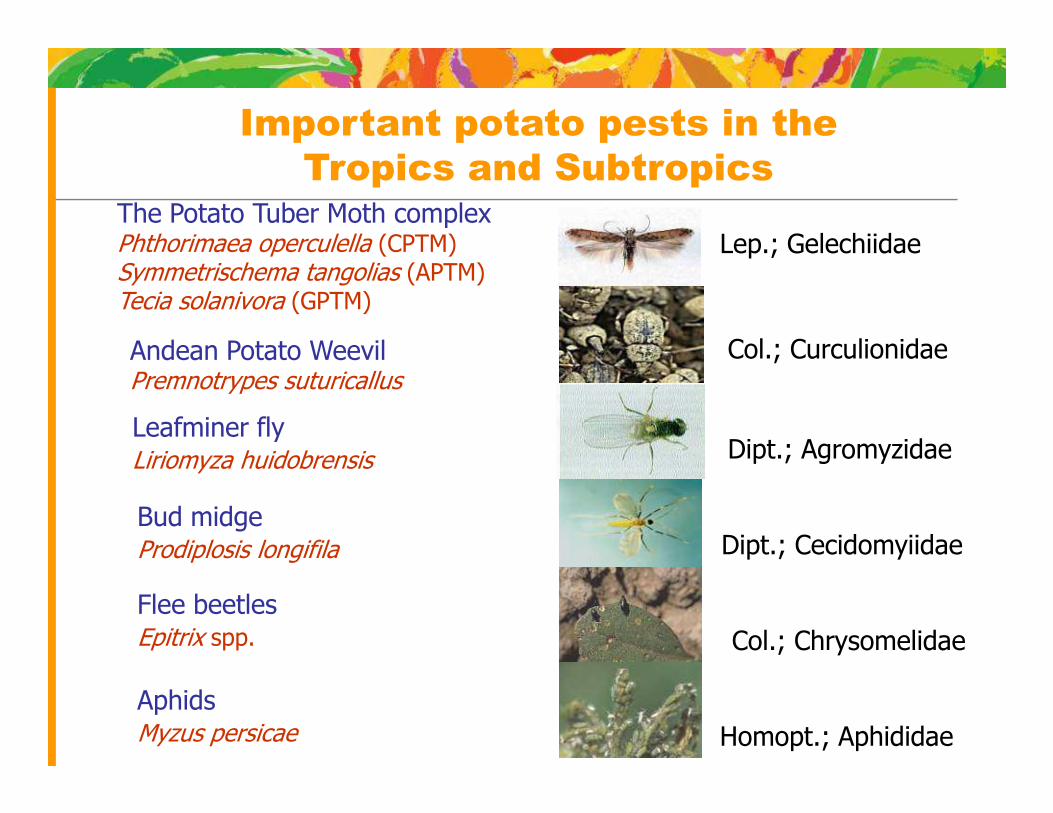
Important potato pests in the
Tropics and SubtropicsThe Potato Tuber Moth complexPhthorimaea operculella (CPTM)Symmetrischema tangolias (APTM)Tecia solanivora (GPTM)
Lep.; Gelechiidae
Andean Potato WeevilPremnotrypes suturicallus
Col.; Curculionidae
Leafminer flyLiriomyza huidobrensis Dipt.; Agromyzidae
Bud midgeProdiplosis longifila Dipt.; Cecidomyiidae
AphidsMyzus persicae Homopt.; Aphididae
Flee beetlesEpitrix spp. Col.; Chrysomelidae

Potato Tuber MothPhthorimaea operculella (PTM)
• Invasive species; reported from more than 90 countries
• Adapted to wide range of different climates and agroecologies
• Yield losses due to leaf and tuber infestation at harvest
• Storage pest in tropical and subtropical countries

Potato production areas and PTM distribution
Phthorimaea operculellaSymmetrischema tangolias
Tecia solanivora

Framework for IPM development and use in potato
Adoption of IPM in potato by different types of farmers
- On-farm research, adaptation, FFS, extension
Biological control
- Conservation- Augmentation
Cultural
- Seed- Planting date
Biorational Biotechnology
- Pheromones - Attract-and-kill
- Bt-potato
Chemical
- Low toxicity- no effects on
Compatibility of control methods for all pests!!!
Ecological infrastructure
- Fauna inventory and functional diversity- Agro-ecosystems characteristics- Bioindicators for stability / degradation
Pest population ecology
- Population dynamics (abiotic/biotic)- Pest severity- Control thresholds
Communication/behavior
- Migration/distribution- Sex pheromones
Insect modeling & Climate Change
- Augmentation - Classical- Biopesticides
- Planting date- Rotation- …
- Attract-and-kill - no effects onnon-targets
• Range expansion of existing pests and invasion by new pests.
• Accelerated pest development leading to more pest cycles per season.
• Disruption of the temporal and geographical synchronization of pests
Impacts of CC on Pests
An increase in extreme climate events, changes in moistureconditions, temperature rise , elevated CO 2 concentrations, areexpected to magnify pest pressure on agricultural systems t hrough:
• Disruption of the temporal and geographical synchronization of pests and beneficial insects that increase risk of pest outbreaks.
• Promotion of minor pests to primary pests brought about by reduction in host tolerance and changes in landscape characteristics and land-use practices.
• Increase damage potential from invasive alien species.
• Susceptibility to pests increases in drought stressed plants.
(adapted from Padgham, 2009; Discussion paper - The World Bank)

Observed and modeled effects of CC on insect pests
Pest Climate DimensionCropping
System/RegionReference
INSECTS
Brown locust(Locustana pardalina)*
Increased outbreaks during ENSO events.
Crop/rangeland, S-Africa
Todd et al. 2002
Leaf miner (Caloptilia sp.) Range expansion projected. Coffee, Brazil Magrin et al. 2007
Southern pink bollworm(Pectinophora gossypiella)
Increased winter tempera-tures predicted to increase range and damage potential.
Cotton, SW-US Gutierrez et al. 2006
Southern pine beetle(Dendroctonus frontalis)
Increased winter/spring tem-peratures predicted to in-crease range and damagepotential.
Forests, S-US Gan 2004
White fly(Bemisia tabaci, and B. afer)*
Increased outbreaks during ENSO events.
Tuber crops, Andean region
Shapiro et al. 2007
Potato tuber moth(Phthorimaea operculella)
Temperature increase of 2°C–3°C expands distribution by 400–800 km to the north and accelerates damage intensity .
Potato, globallySporleder et al. 2007
(Padgham 2009)
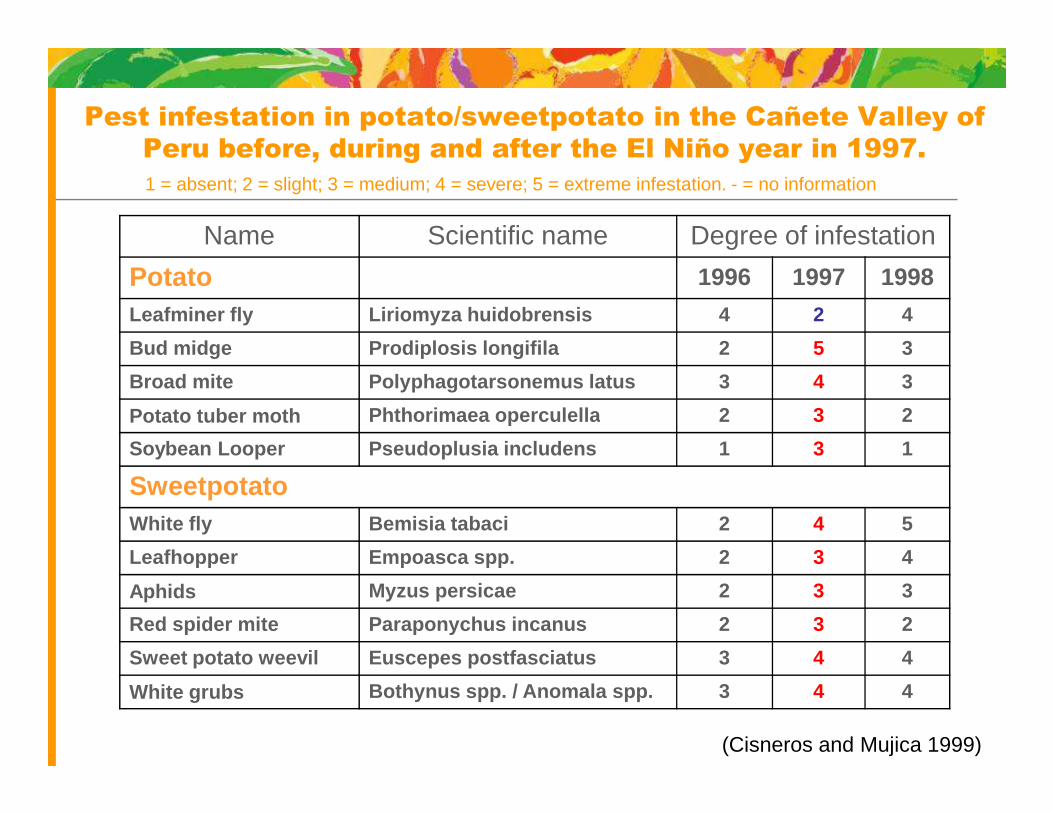
Pest infestation in potato/sweetpotato in the Cañete Valley of
Peru before, during and after the El Niño year in 1997.
1 = absent; 2 = slight; 3 = medium; 4 = severe; 5 = extreme infestation. - = no information
Name Scientific name Degree of infestation
Potato 1996 1997 1998
Leafminer fly Liriomyza huidobrensis 4 2 4
Bud midge Prodiplosis longifila 2 5 3
Broad mite Polyphagotarsonemus latus 3 4 3
Potato tuber moth Phthorimaea operculella 2 3 2
(Cisneros and Mujica 1999)
Potato tuber moth Phthorimaea operculella 2 3 2
Soybean Looper Pseudoplusia includens 1 3 1
SweetpotatoWhite fly Bemisia tabaci 2 4 5
Leafhopper Empoasca spp . 2 3 4
Aphids Myzus persicae 2 3 3
Red spider mite Paraponychus incanus 2 3 2
Sweet potato weevil Euscepes postfasciatus 3 4 4
White grubs Bothynus spp. / Anomala spp. 3 4 4

Yields (in t or quintal for cotton) in different crops, Cañete
Valley, Peru, before, during and after the El Niño year in 1997
and related yield losses (%) due to increased pest severity
Crop 1996 1997 1998Yield loss
(1996-1998)
Potato 27 (18-35) 12 (1.5-21) 15 (5-20) 55
Sweetpotato 28 (10-40) 16 (2-40) 15 (2-20) 54Sweetpotato 28 (10-40) 16 (2-40) 15 (2-20) 54
Cotton 50 (45-110) 25 (1-60) 35 (10-70) 50
Maize - 6.5 (5-8) 3.5 (2-4) 46
Citrus - 60 24 (14-30) 60
Asparagus 8 7 2 70
(Cisneros and Mujica 1999)
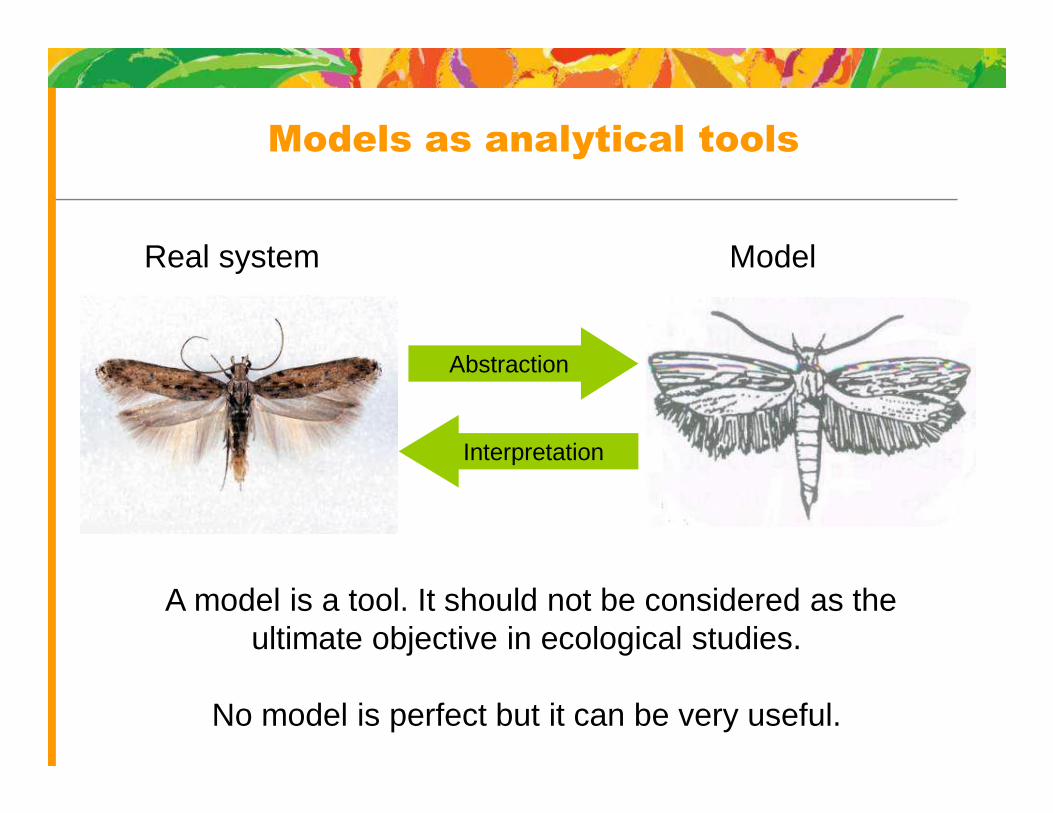
Real system Model
Abstraction
Models as analytical tools
Interpretation
A model is a tool. It should not be considered as the ultimate objective in ecological studies.
No model is perfect but it can be very useful.

• Phytosanitary pest risk assessments / Climate change
• Integrated Pest Management
Temperature-based insect phenology modeling
Analytical tools for predicting, evaluating and und erstanding the dynamics of insect populations in agroececosyst ems.
• Integrated Pest Management
- Classical biocontrol: identification of potential release sites for parasitoids
- Simulation of field performance of biopesticides and application frequencies

Insect Life Cycle Modeling (ILCYM)
• Collecting life cycle data under constant and fluctuating temperature regimes
• Analyzing the data using ILCYM
- Fitting functions for describing temperature-driven development processes under
Software package for developing temperature-based i nsect phenology models with applications for regional and global pest risk assessments and mapping .
driven development processes under constant temperatures, i.e. development rate, mortality and reproduction (“Model Builder”)
- Validating the model using life table data established under fluctuating temperature
• Generate risks maps using ILCYM in an GIS environment- Establishment index- Generation index- Activity index (www.cipotato.org/ilcym)

� ILCYM offers advanced modeling techniques for insect populations and tools for analyzing models; users do not need to be experts in the field.
� ILCYM guides the user interactively through the steps
Use of ILCYM
� ILCYM guides the user interactively through the steps developing a phenology/population model and facilitates spatial pest risk mapping.
� User do not need to learn programming languages.
� However, ILCYM restricts users to certain model designs and might not provide solutions for every problem.

Data collection
•• OvipositionOviposition•• Survival timeSurvival time
(male and female)(male and female)
•• Development timeDevelopment time•• MortalityMortality
Constant Constant temperaturestemperatures

Life table data (complete)
Each column Each column represent one
individual
Each line represent one
evaluation interval (days)

Instead of “numbers” for
oviposited eggs or “M” for
Life table data (incomplete)
eggs or “M” for males you
indicate “A” for adult or “F” and
“M” for “female” and
“male”

Model Implementation
EI
Development to the next stage
ReproductionTemp
Dev
.rat
e
Dev
elop
men
t
Tem perature
Ovi
posi
tion
normalized age
Pro
por
tion
of p
roge
ny
EIE..E1E0 LIL..L1L0PIP..P1P0
AfIAf..Af1Af0
Mortality
Temperature
Mo
rtalit
y
0 1normalized age

Variation of Development Time
Functions generated in ILCYM

Development Rate
Functions generated in ILCYM

Mortality
Functions generated in ILCYM
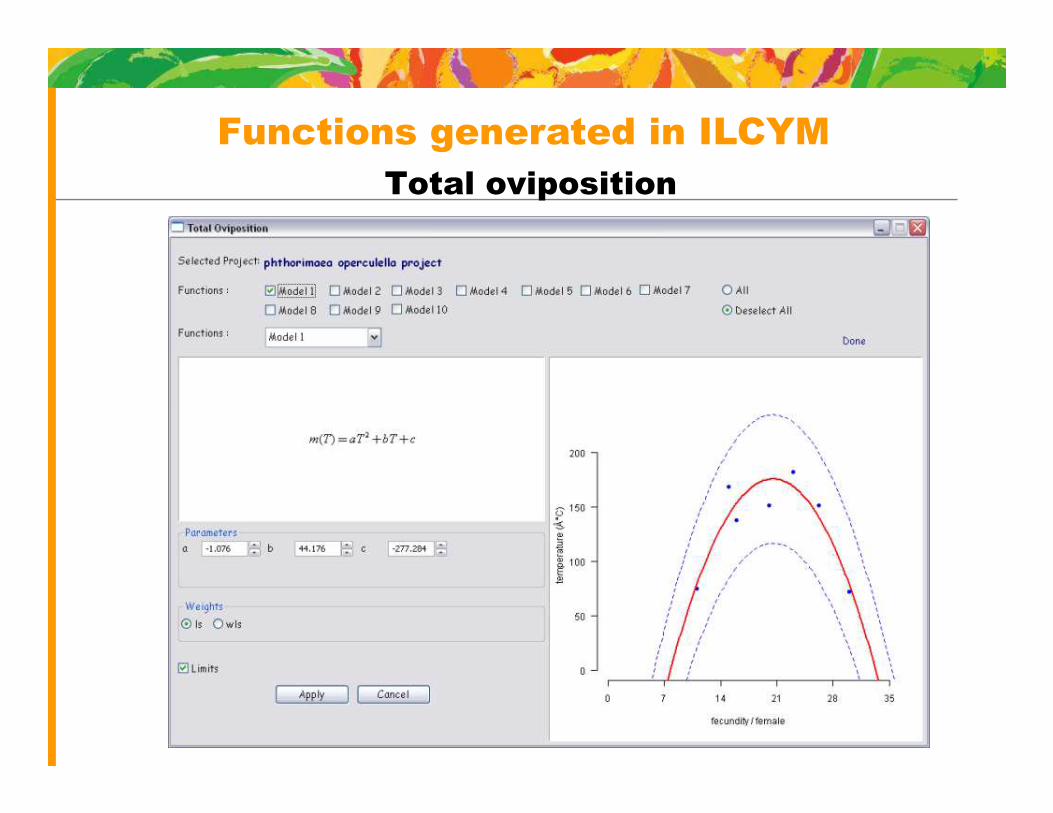
Total oviposition
Functions generated in ILCYM
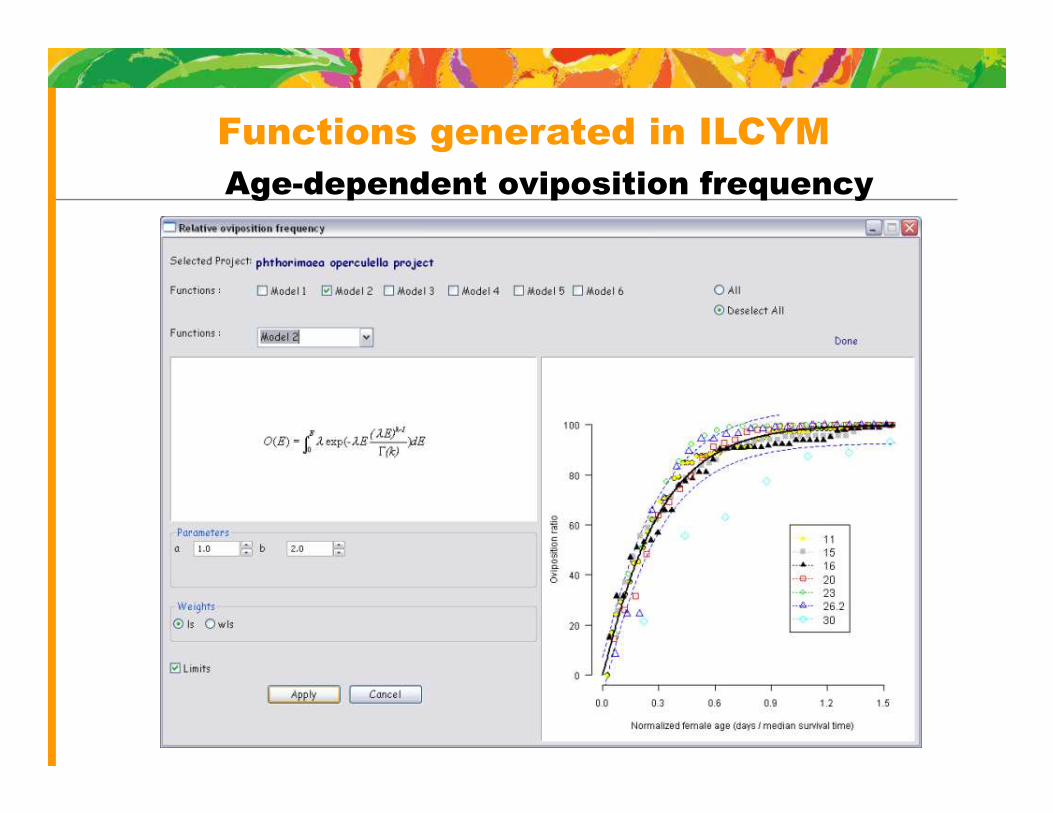
Age-dependent oviposition frequency
Functions generated in ILCYM
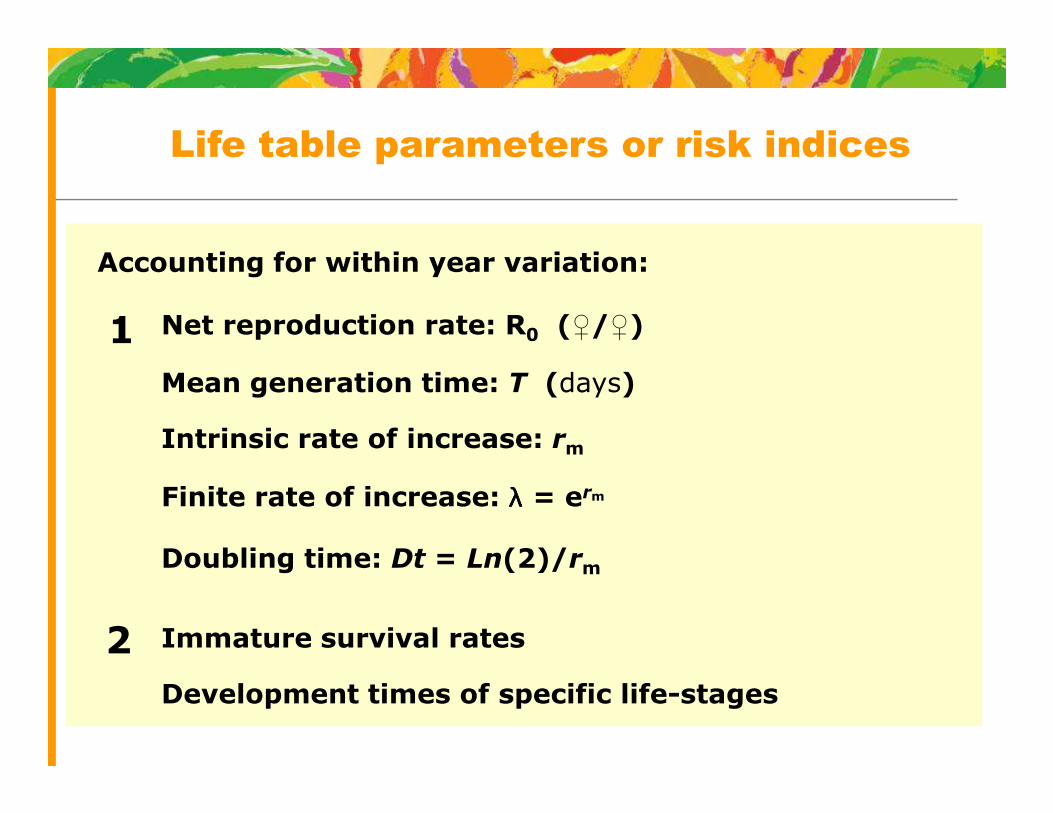
Accounting for within year variation:
1 Net reproduction rate: R0 (♀/♀)
Mean generation time: T (days)
Life table parameters or risk indices
2
Intrinsic rate of increase: rm
Finite rate of increase: λλλλ = erm
Doubling time: Dt = Ln(2)/rm
Immature survival rates
Development times of specific life-stages
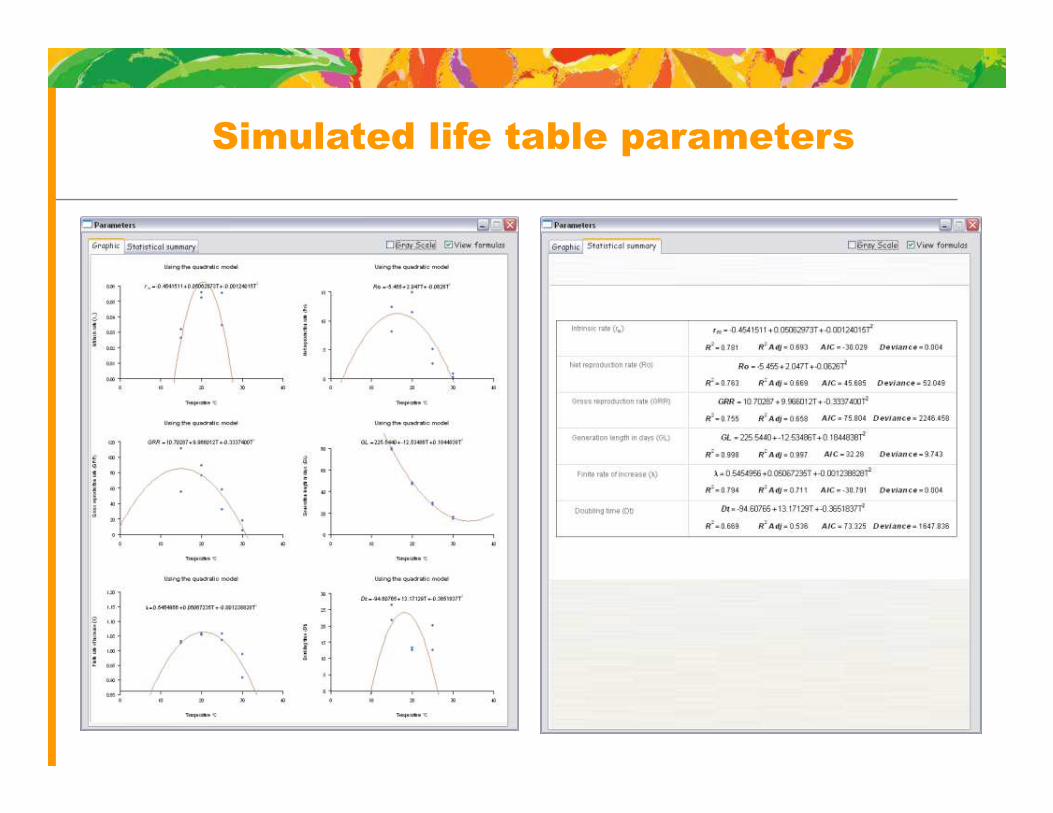
Simulated life table parameters

Net reproduction rate Mean generation time Intrinsic rate of increase
Simulated life table parameters
50
100
Num
ber
of e
ggs
(♀/♀
)
50
100
150
Tim
e (d
ays)
0.08
0.06
0.04
0.02
r m
( )T
RoLnrm =
∑∑=
ml
mlxT
∑ ×= mlRo
1.25
1.20
1.15
1.10
1.05
1.00
0.95
0.90100 20 30 40
Finite rate of increase Doubling time
Temperature °C
0 10 20 30Num
ber
of e
ggs
0 10 403020
Temperature °C Temperature °C
0 10 20 30 400.00
0
150
100
50
0 10 20 30 40
Temperature °C
Dt (
days
)
Temperature °C
λ
( )mr
LnDt
2=rme=λ
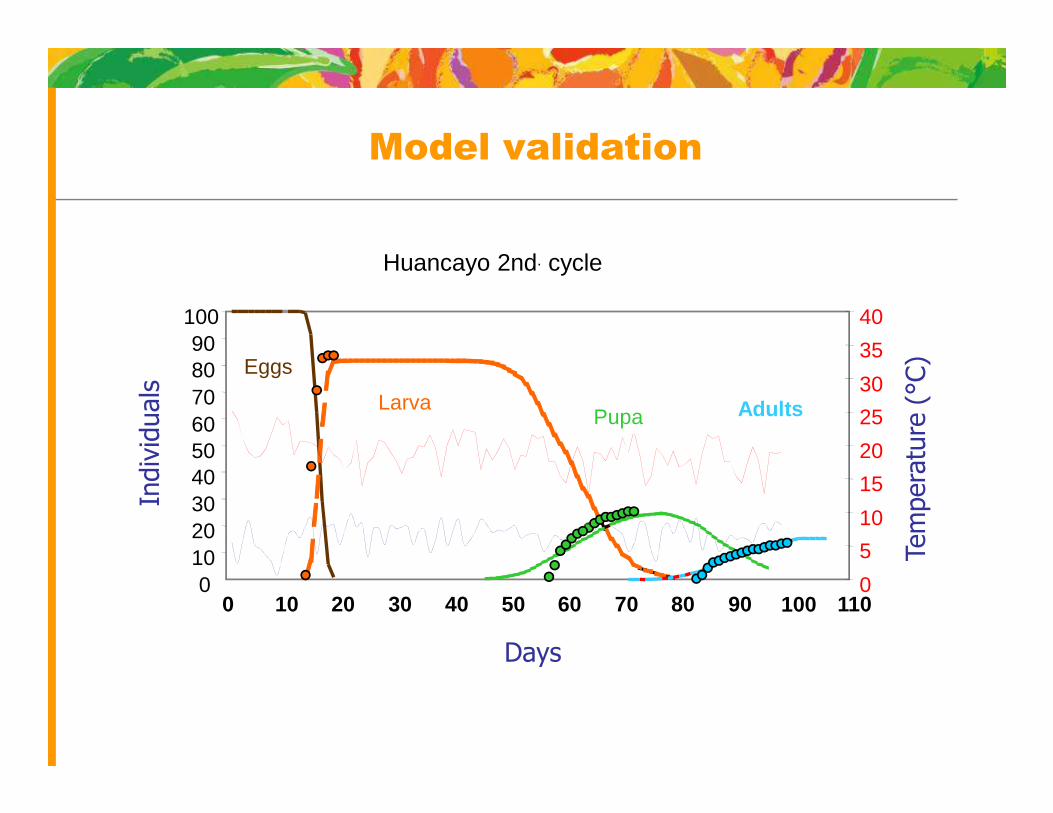
Model validation
Tem
pera
ture
(°C
)
Indiv
iduals 70
8090
100
25
30
35
40
Huancayo 2nd. cycle
LarvaPupa Adults
Eggs
Days
Tem
pera
ture
(
Indiv
iduals
010203040506070
0 10 20 30 40 50 60 70 80 90 100 1100
5
10
15
20
25Larva
Pupa Adults
60708090
100
25
30
35
40
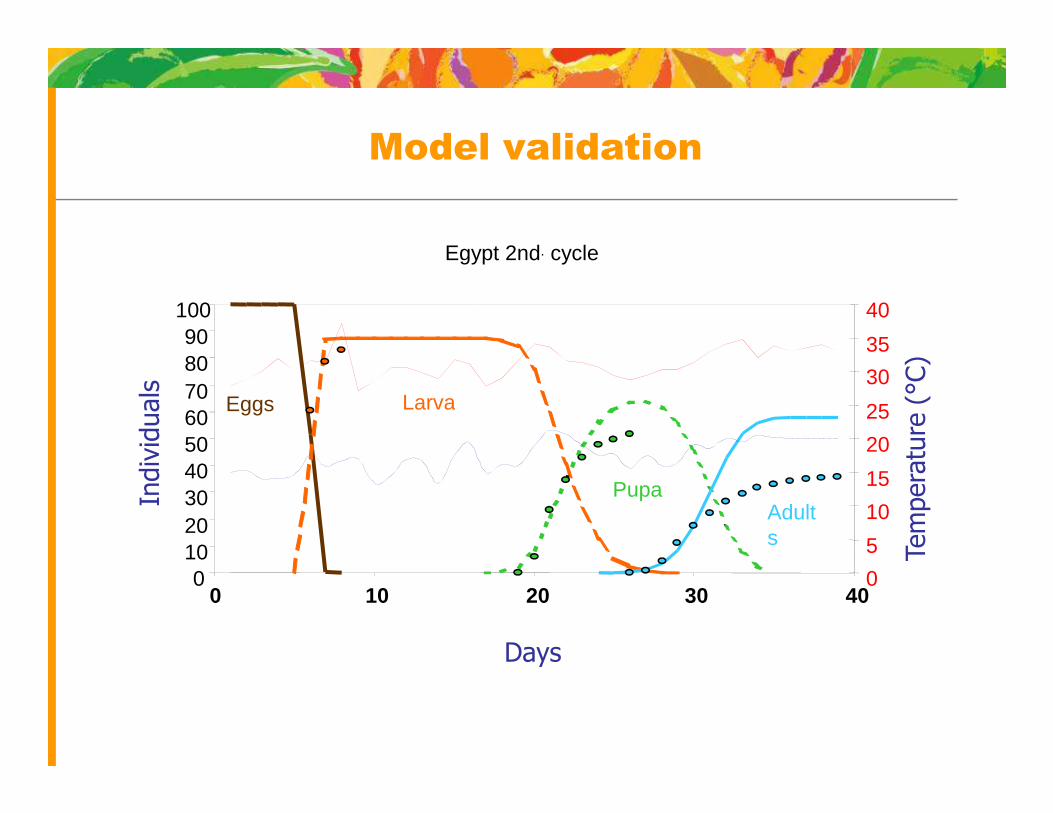
Egypt 2nd. cycle
LarvaEggs
Model validation
Tem
pera
ture
(°C
)
Indiv
iduals
0102030405060
0 10 20 30 400
5
10
15
20
25Larva
PupaAdults
Eggs
Days
Tem
pera
ture
(
Indiv
iduals
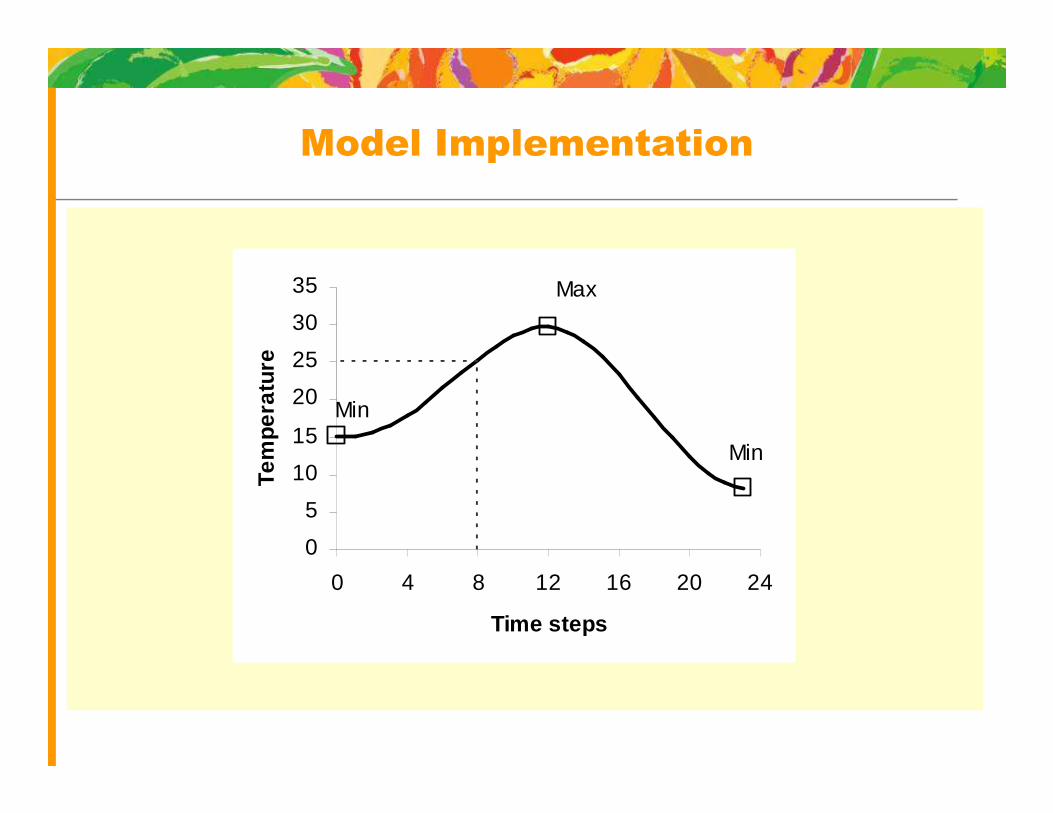
Model Implementation
20
25
30
35Te
mpe
ratu
re
Min
Max
0
5
10
15
20
0 4 8 12 16 20 24
Time steps
Tem
pera
ture
Min
Min
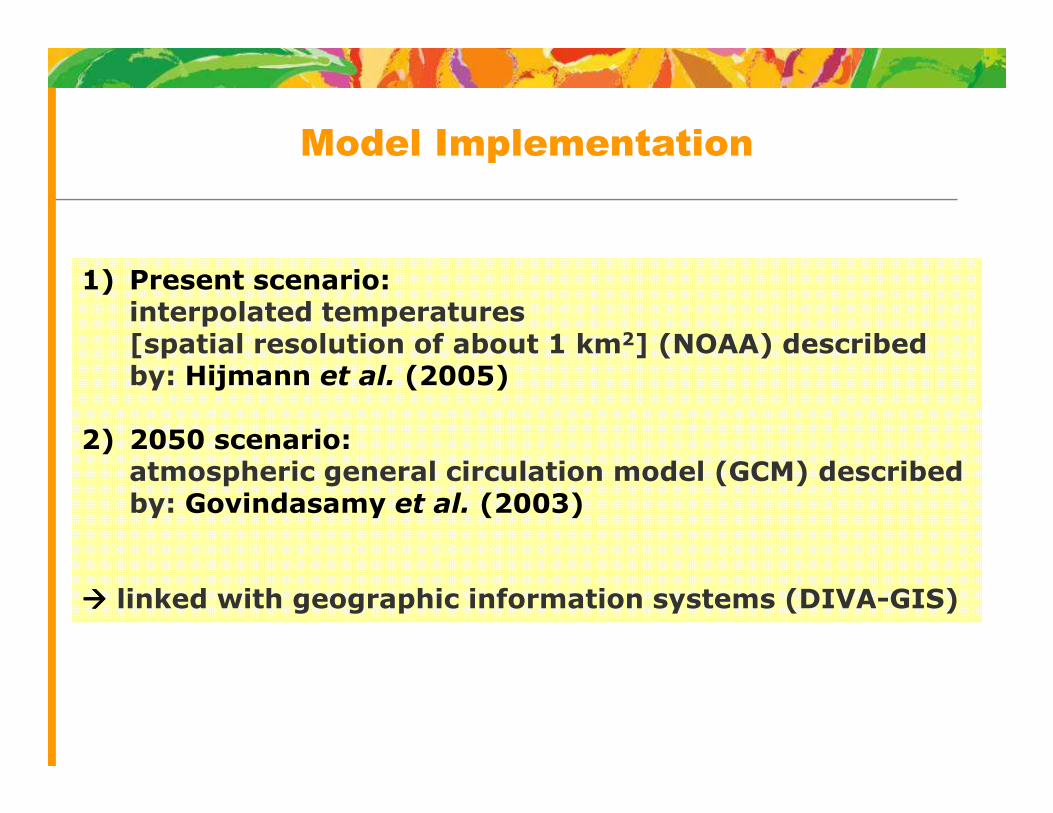
Model Implementation
1) Present scenario:interpolated temperatures [spatial resolution of about 1 km2] (NOAA) described by: Hijmann et al. (2005)
2) 2050 scenario: atmospheric general circulation model (GCM) described by: Govindasamy et al. (2003)
���� linked with geographic information systems (DIVA-GIS)
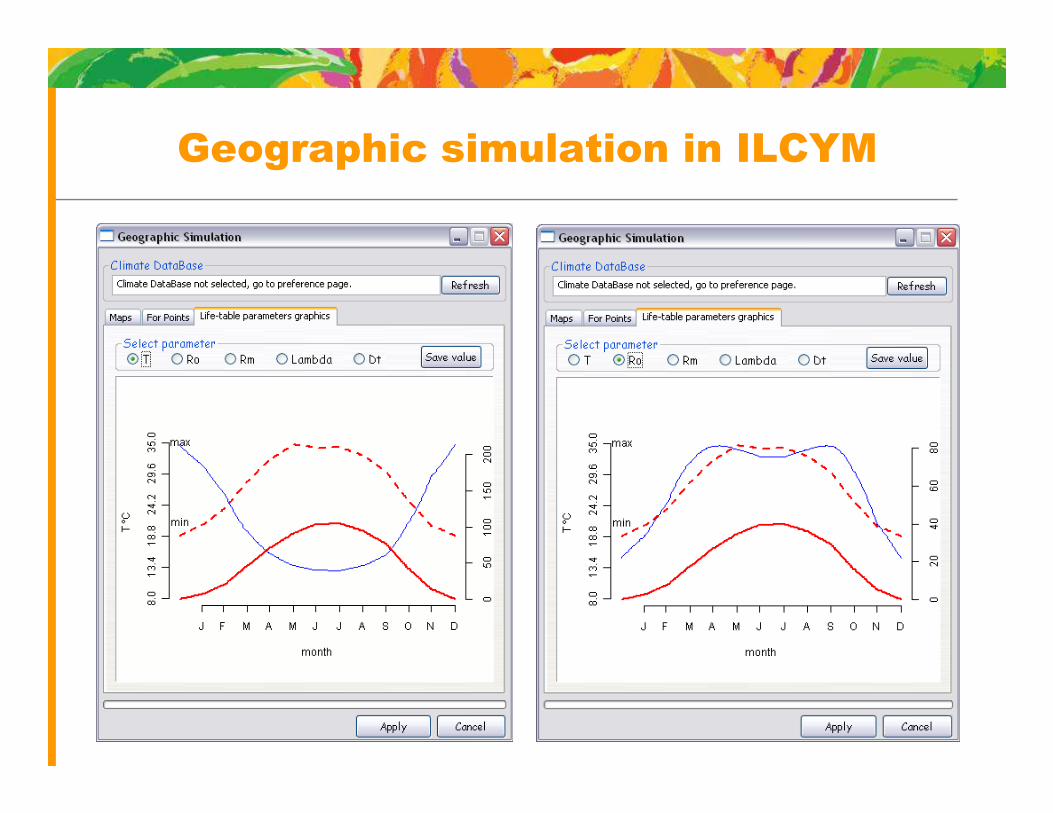
Geographic simulation in ILCYM
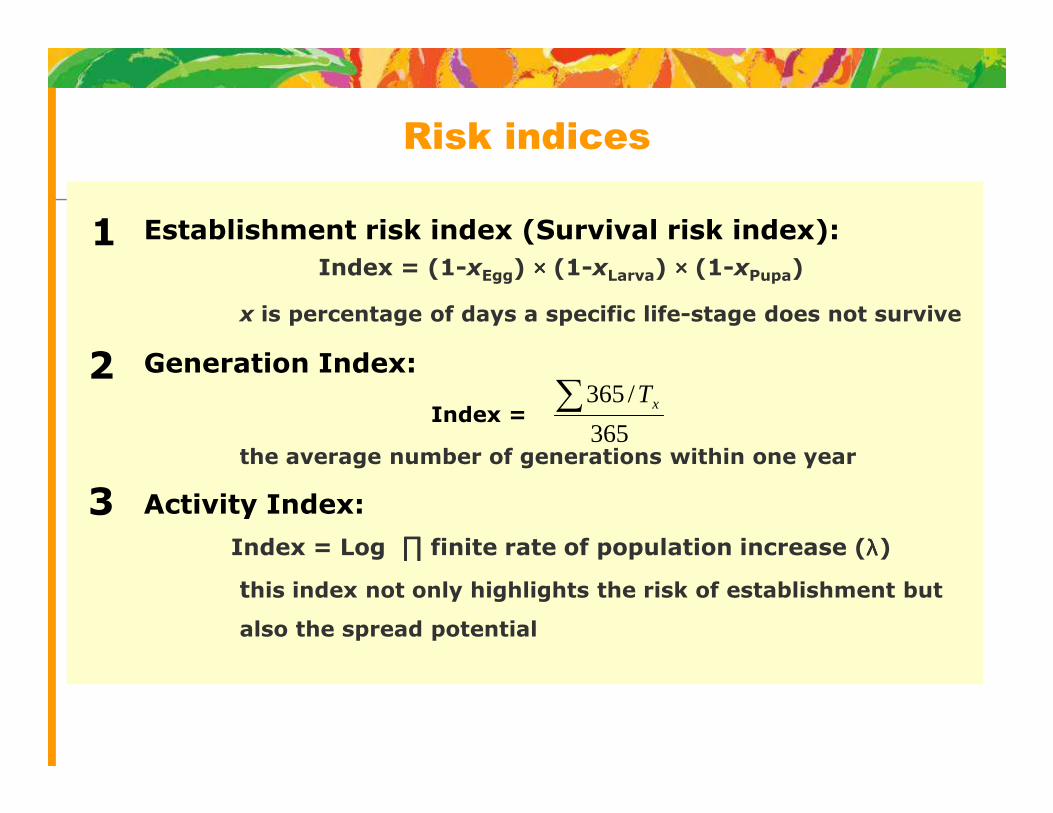
Establishment risk index (Survival risk index):
Index = (1-xEgg) ×××× (1-xLarva) ×××× (1-xPupa)
x is percentage of days a specific life-stage does not survive
Generation Index:
Index =
1
2
Risk indices
/365∑ xTIndex =
the average number of generations within one year
Activity Index:
Index = Log ∏∏∏∏ finite rate of population increase (λλλλ)
this index not only highlights the risk of establishment but
also the spread potential
3
365
/365∑ xT

Establishment risk index

Establishment risk index

Generation index
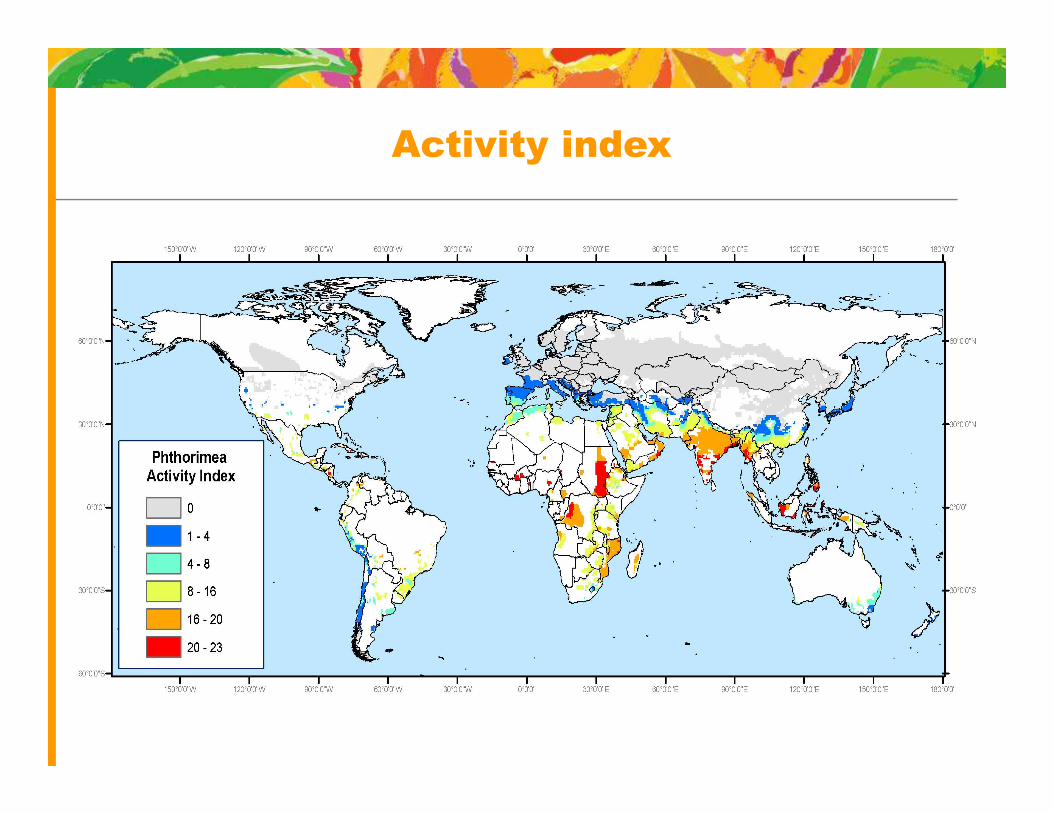
Activity index
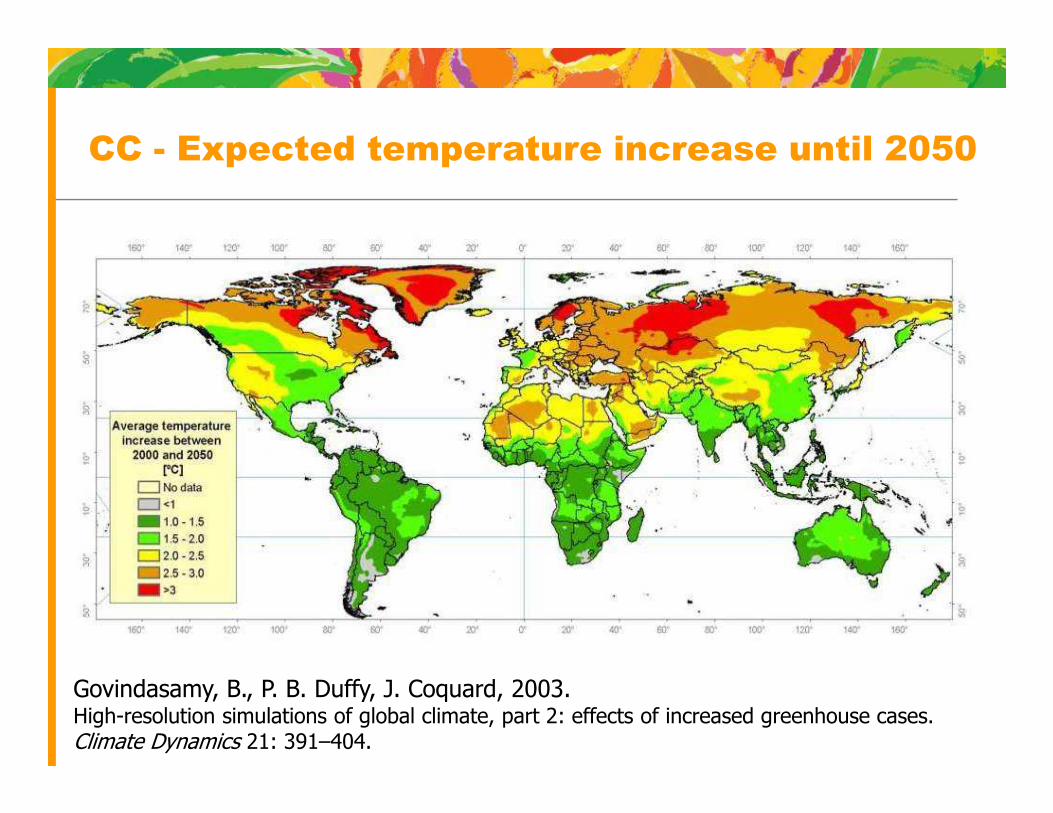
CC - Expected temperature increase until 2050
Govindasamy, B., P. B. Duffy, J. Coquard, 2003.High-resolution simulations of global climate, part 2: effects of increased greenhouse cases. Climate Dynamics 21: 391–404.

Global risks of potato tuber moth in potato:
2000 - 2050

Global risks of potato tuber moth in potato:
2000 - 2050
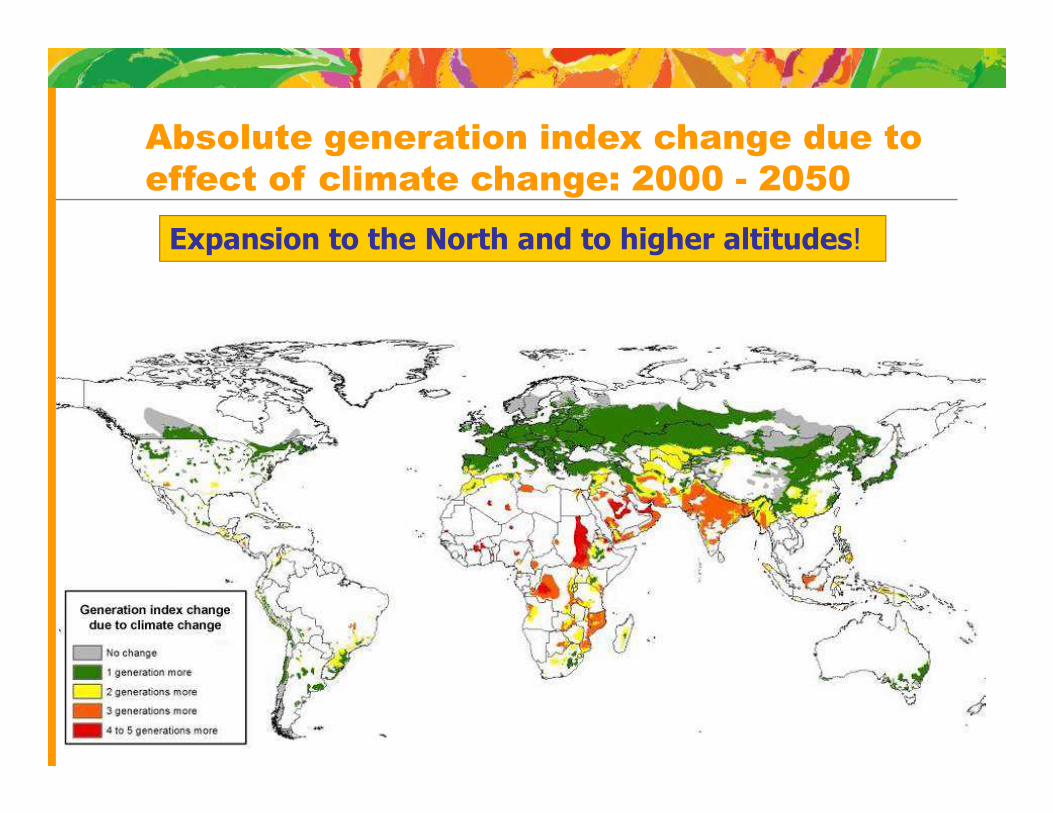
Absolute generation index change due to
effect of climate change: 2000 - 2050
Expansion to the North and to higher altitudes!
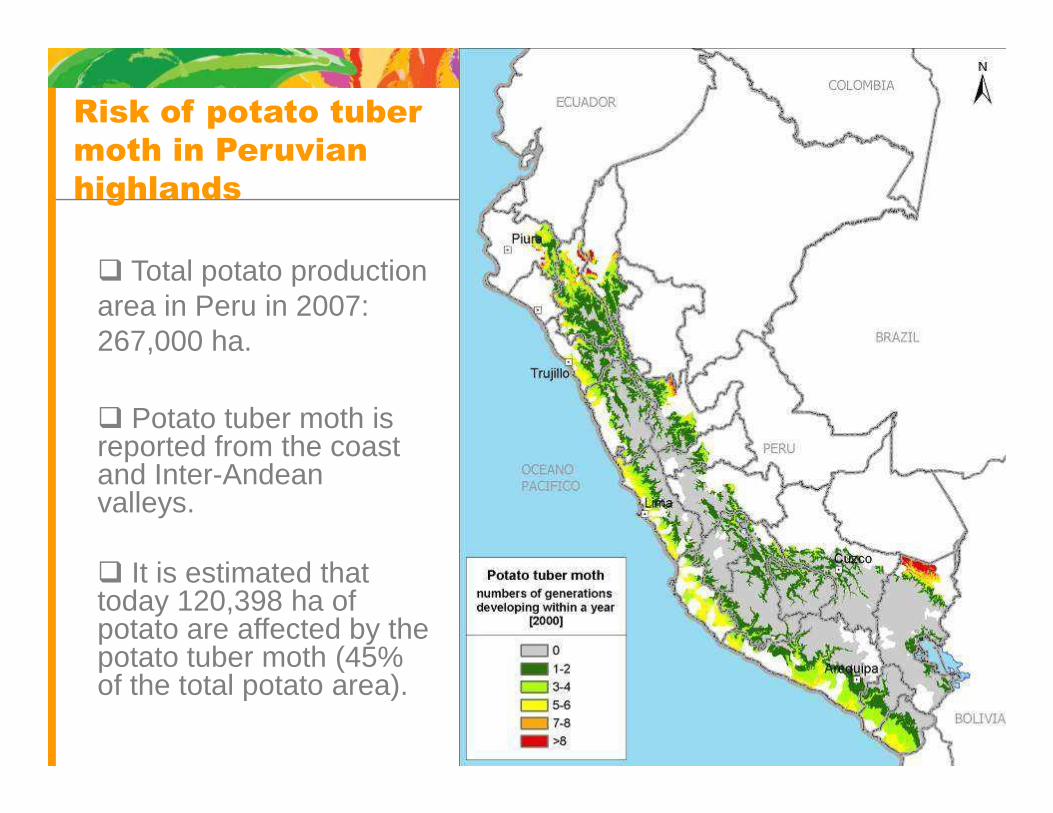
Risk of potato tuber
moth in Peruvian
highlands
� Total potato production area in Peru in 2007: 267,000 ha.
� Potato tuber moth is � Potato tuber moth is reported from the coast and Inter-Andean valleys.
� It is estimated that today 120,398 ha of potato are affected by the potato tuber moth (45% of the total potato area).
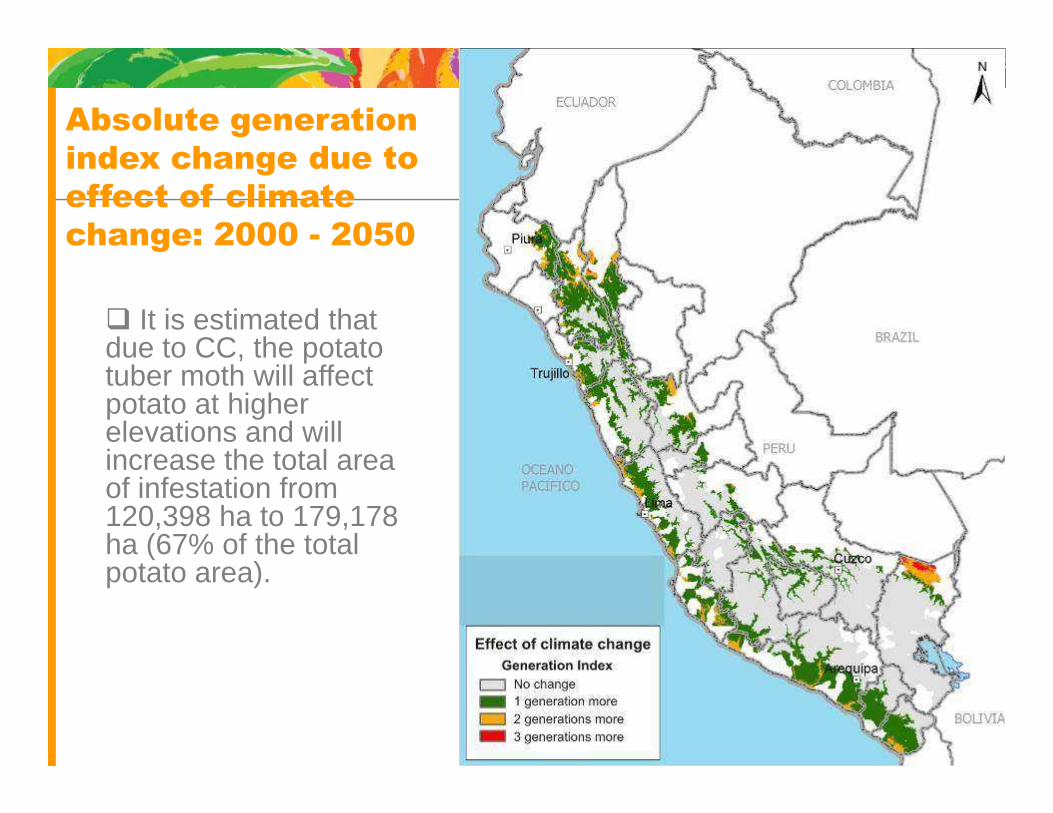
� It is estimated that due to CC, the potato tuber moth will affect potato at higher
Absolute generation
index change due to
effect of climate
change: 2000 - 2050
potato at higher elevations and will increase the total area of infestation from 120,398 ha to 179,178 ha (67% of the total potato area).

Num
ber
of g
ener
atio
ns p
er y
ear
10
12
14
16
18
12.512
+1.5+2.5
+3.9+4.6
+2.4+2.8
+1.3+2.2
+2.7 10 10+1.2
+2.0
+3.7+3.1
Effect of climate change scenarios on the
number of generations at different locations
Num
ber
of g
ener
atio
ns p
er y
ear
0
2
4
6
8
Peru - San Ramon (800 m) Peru - Huancayo (3250 m) Peru - Arequipa (1440) Yemen - Sana’a (2250) Egypt - Giza (10 m)
2.9+0.4+0.7
+1.0+1.2
6.7+0.8
+1.4+2.4
3.0
7.0
8.0
7.0
+0.9+1.3
PRESENT PREDICTION PRESENT PREDICTION PRESENT PREDICTION PRESENT PREDICTIONPRESENT PREDICTION
0
5
10
15
20
25
30
35
tem
pera
ture
(ºC
)
-5
0
5
10
15
20
25
30
35
tem
pera
ture
(ºC
)
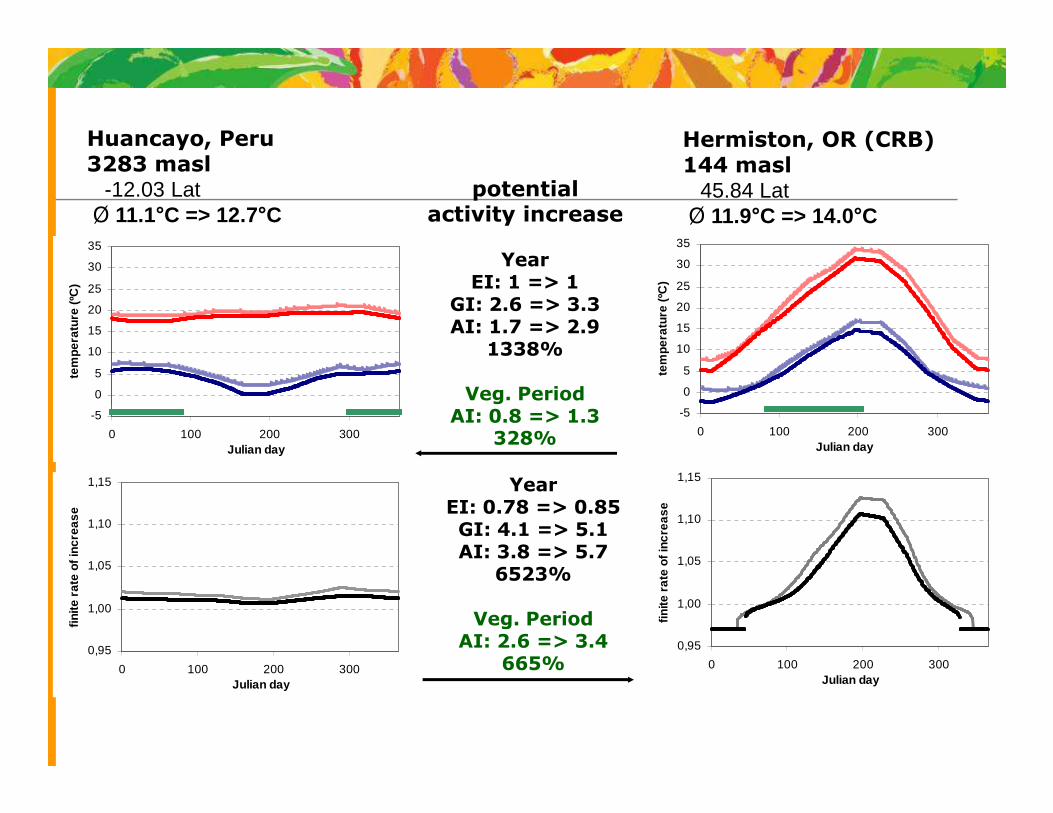
Hermiston, OR (CRB)144 masl
45.84 LatØ 11.9°C => 14.0°C
Huancayo, Peru3283 masl
-12.03 LatØ 11.1°C => 12.7°C
potential activity increase
YearEI: 1 => 1
GI: 2.6 => 3.3AI: 1.7 => 2.9
1338%
Veg. PeriodAI: 0.8 => 1.3
0,95
1,00
1,05
1,10
1,15
0 100 200 300Julian day
finite
rat
e of
incr
ease
-5
0 100 200 300Julian day
-5
0 100 200 300Julian day
0,95
1,00
1,05
1,10
1,15
0 100 200 300Julian day
finite
rat
e of
incr
ease
YearEI: 0.78 => 0.85GI: 4.1 => 5.1AI: 3.8 => 5.7
6523%
Veg. PeriodAI: 2.6 => 3.4
665%
AI: 0.8 => 1.3328%

Al Buhayrah, Egypt10 masl30.4 LatØ 21.5°C => 23.8°C
Cochabamba, Bolivia2531 masl-17.45 LatØ 15.3°C => 16.9°C
potential activity increase
0
5
10
15
20
25
30
35
40
tem
pera
ture
(ºC
)
0
5
10
15
20
25
30
35
40
tem
pera
ture
(ºC
)
YearEI: 1 => 1
GI: 5.0 => 5.9AI: 5.9 => 7.7
5730%
Veg. PeriodAI: 3.2 => 4.10
0 100 200 300Julian day
0
0 100 200 300Julian day
1,00
1,05
1,10
1,15
1,20
0 100 200 300Julian day
finite
rat
e of
incr
ease
1,00
1,05
1,10
1,15
1,20
0 100 200 300Julian day
finite
rat
e of
incr
ease
AI: 3.2 => 4.1709%
YearEI: 1 => 1
GI: 9.6 => 11.8AI: 13.9 => 16.4
>33000%
Veg. PeriodAI: 2.4 => 3.4
951%

Conclusions and challenges
� Phenology modeling and GIS risk mapping might be an appropriate tool and framework for pest risk assess ments and adaptation planning for CC, but: - Uncertainties in climate change predictions.- Worldclim data provide monthly aggregated temperat ure data;
interpolation of weather data.- Regional meteorological data could have higher accu racy. - Regional meteorological data could have higher accu racy. - Other factors: e.g., precipitation.
� Understanding the effects of temperature increase o n key pests and related beneficial insects by using two-s pecies interaction models.
� Developing risk maps for major pests for current an d future scenarios according to temperature indicating major future pest hot spots.
CIP’s Modeling Group
The team is composed by:-specialists in Agroecology/IPM- insect modeling and statistics, and - application of GIS.
RheinhardSimon
HenryTonnang
HenryJuarez
Juan CarlosGonzalo
PabloCarhuapoma
MarcSporleder
Jürgen Kroschel