apple picking: the rise of electronic device thefts in
TRANSCRIPT

City University of New York (CUNY)CUNY Academic Works
Dissertations, Theses, and Capstone Projects Graduate Center
5-2015
Apple picking: The rise of electronic device thefts inBoston subwaysKendra GentryGraduate Center, City University of New York
How does access to this work benefit you? Let us know!Follow this and additional works at: https://academicworks.cuny.edu/gc_etds
Part of the Criminology Commons, and the Criminology and Criminal Justice Commons
This Dissertation is brought to you by CUNY Academic Works. It has been accepted for inclusion in All Dissertations, Theses, and Capstone Projectsby an authorized administrator of CUNY Academic Works. For more information, please contact [email protected].
Recommended CitationGentry, Kendra, "Apple picking: The rise of electronic device thefts in Boston subways" (2015). CUNY Academic Works.https://academicworks.cuny.edu/gc_etds/938
APPLE PICKING:
THE RISE OF ELECTRONIC DEVICE THEFTS IN BOSTON SUBWAYS
by
KENDRA GENTRY
A dissertation submitted to the Graduate Faculty in Criminal Justice in partial fulfillment of the
requirements for the degree of Doctor of Philosophy, the City University of New York
2015

ii
© 2015
KENDRA GENTRY
iii
All Rights Reserved
This manuscript has been read and accepted for the
Graduate Faculty in Criminal Justice in satisfaction of the
dissertation requirement for the degree of Doctor of Philosophy.
Dr. Michael Maxfield, John Jay College of Criminal Justice
___________________ __________________________________________
Date Dissertation Chair
Dr. Deborah Koetzle, John Jay College of Criminal Justice
___________________ __________________________________________
Date Executive Officer
Dr. Valerie West John Jay College of Criminal Justice
Dr. Jeremy Porter John Jay College of Criminal Justice
Dissertation Committee
THE CITY UNIVERSITY OF NEW YORK

iv
ABSTRACT
Apple picking:
The rise of electronic device thefts in Boston subways
by
Kendra Gentry
Dissertation Chair: Dr. Michael Maxfield
As mobile technology advances and the demand for WiFi and phone coverage increases,
electronic device theft is becoming an international problem in metropolitan public
transportation systems. Using transit police reports, this dissertation applies crime opportunity
theories to understand which factors increased electronic device theft in Boston subway stations
from 2003-2011.
This approach addresses previous studies regarding crime on public transportation,
robbery and larceny on subways and electronic device theft – as none have focused on this
problem as the theft of a “hot product” within a “hot environment.” Negative binomial
regression, crime script analysis, sign tests and temporal pattern identification are used.
This study identifies 24 subway stations where electronic device theft is concentrated.
The findings suggest that district crime rates and subway station characteristics may help transit
police understand why certain stations serve as activity spaces for electronic device theft. It also
recognizes “hot times,” risky passenger behavior and potential offender tactics. Policy
implications and recommendations are discussed.

v
DEDICATION
For my mother, Brenda Gentry.

vi
ACKNOWLEDGEMENTS
I am tremendously thankful for everyone who rallied around me during my doctoral
studies. To my dissertation committee chair, Dr. Michael Maxfield, thank you for your guidance,
patience and encouragement. I am also thankful to Dr. Mangai Natarajan for introducing me to
environmental criminology and ECCA. To my faculty mentors, Dr. Frank Pezzella, Dr. Jeremy
Porter and Dr. Valerie West, thank you for all that you taught me about being a better lecturer, a
better statistician and a better crime analyst.
I owe many thanks to the Massachusetts Bay Transportation Authority (MBTA) Transit
Police. To Chief Paul MacMillan, Deputy Chief Joseph O’Connor and the entire MBTA Crime
Intelligence Unit, thank you for granting me access and believing in my research. To Manny
DeSousa, thank you for being my first point of contact at MBTA and helping me gather the data
for my pilot study. I am also thankful for the continued technical support from Athena Yerganian
and Anand Kolipakkam for extracting hundreds of case files.
To my family, thank you for your support and love. And to my NYC and Florida friends,
Lauren Kingcade, Kwame Patterson, Iliana Zelaya, Jeanene Barrett, Melissa Pognon and Casie
Grant, thank you for all of the laughs, nights out and vacations that made “Ph.D. Land” a little
less stressful.

vii
TABLE OF CONTENTS
Abstract iv
Dedication v
Acknowledgements vi
List of tables x
List of figures xi
List of photos xii
Chapter 1 INTRODUCTION
1.1 The problem: Electronic device theft in public transportation 1
Chapter 2 LITERATURE REVIEW AND THEORETICAL FRAMEWORK
2.1 Literature review 4
a. Crime on public transportation 4
b. Robbery and larceny on subways 5
c. Electronic device theft 7
2.2 Theoretical framework 11
a. Routine Activity Theory 11
b. Crime Pattern Theory 14
c. Rational Choice Theory 18
d. Risky Facilities 19
Chapter 3 CONCEPTUAL FRAMEWORK AND RESEARCH QUESTIONS
3.1 Study area 22
3.2 Pilot study: Cell phone theft in Boston subways 24
3.3 Current study: Electronic device theft in Boston subways 25
a. Research questions: Transit, space and time 25
b. Important terms 26
Chapter 4 METHODOLOGY
4.1 Data sources 27
4.2 Measures 30
a. Dependent variable: Electronic device theft at all subway stations 32
b. Thefts by subway line and transfer stations 32
4.3 Analytical strategy 34
4.4 Formatting of analytical chapters 41

viii
Chapter 5 TRANSIT-RELATED RESEARCH QUESTIONS
5.1 RQ1.1 42
a. Hypothesis 42
b. Independent variables 43
c. Results: Negative binomial regression – 46
electronic device theft and subway station characteristics
d. Discussion: Summary of key findings and linking theory 47
5.2 RQ1.2 51
a. Hypothesis 51
b. Top 24 subway stations 52
c. Independent variables: Crime script analysis 53
d. Results: Crime script analysis 57
e. Independent variables: Field observations 66
f. Results: Field observations 76
g. Discussion: Summary of key findings and linking theory 80
5. 3 RQ1.3
a. Hypothesis 83
b. Variables 86
c. Results: Sign test analysis – 96
before/after phone and WiFi service
d. Discussion: Summary of key findings and linking theory 97
Chapter 6 SPACE-RELATED RESEARCH QUESTION
6.1 RQ2.1 99
a. Hypothesis 99
b. Independent variables 102
c. Results: Negative binomial regression – 102
electronic device theft and surface-level crime rates
d. Discussion: Summary of key findings and linking theory 103
Chapter 7 TIME-RELATED RESEARCH QUESTION
7.1 RQ3.1 105
a. Hypothesis 105
b. Results: Temporal pattern identification – 108
descriptive tables, bar charts, line charts
c. Discussion: Summary of key findings and linking theory 115

ix
Chapter 8 CONCLUSIONS
8.1 Contributions: 117
a. Recommendations and policy implications 117
8.2 Limitations 123
8.3 Future research 124
NOTES 126
APPENDICES
A. Research questions, hypotheses, theories & analytical strategy 128
B. Average weekday ridership totals per station and ridership ranking 129
C. Crosstab table representing hourly and daily patterns of electronic device theft 132
at MBTA subway stations, 2003-2011
REFERENCES 133

x
LIST OF TABLES
Table 4-1a. Counts and percentages of stolen electronic devices at MBTA subway stations 27
Table 4-1b. Counts of stolen electronic devices, by year 28
Table 4-1c. Descriptives for electronic device (ED) thefts at all subway stations 31
Table 4-2. Counts and percentages of electronic device theft at transfer stations 33
Table 5-1. Descriptives for subway station characteristics 44
Table 5-2. Negative binomial regression: ED thefts at stations and station characteristics 45
Table 5-3. Top 24 subway stations with the most electronic device theft 52
Table 5-4. Crime script for snatch theft – electronic device theft in MBTA subways 58
Table 5-5. Crime script for pickpocket theft – electronic device theft in MBTA subways 62
Table 5-6. Crime script for robbery – electronic device theft in MBTA subways 65
Table 5-7. Descriptives for cell phone thefts at all subway stations 85
Table 5-8. Cell phone thefts and subway ridership, by cellular subscriptions and population 92
Table 5-9a. Rate of cell phone thefts on MBTA subways, before/after phone service 93
Table 5-9b. Rate of cell phone thefts on MBTA subways, before/after WiFi service 94
Table 5-10a. Sign test results: Mean rate of cell phone thefts, before/after phone service 95
Table 5-10b. Sign test results: Mean rate of cell phone thefts, before/after WiFi service 95
Table 6-1. Descriptives for surface-level police district crime rates 100
Table 6-2. Negative binomial regression: ED thefts at stations and police district crime rates 101
Table 7-1. Counts and percentages; and summary indicators for ED thefts at stations 110
Table 7-2. Day type with counts and percentages of ED thefts at stations 111
Table 7-3. Monthly counts and percentages of electronic device theft at stations 114

xi
LIST OF FIGURES
Figure 2-1. Crime Triangle 11
Figure 2-2. Percentage of thefts by brand and relative market share, London 14
Figure 2-3. MBTA subway, commuter and key bus map 17
Figure 4-1. Histogram: Electronic device theft frequency and station count 30
Figure 4-2. Electronic device theft count by MBTA subway line 31
Figure 4-3. Line charts: trends, cycles and noise 40
Figure 5-1. Histogram: Cell phone theft frequency and station count 84
Figure 5-2. Cell phone theft by MBTA subway line 85
Figure 5-3a. Time series plots: ED thefts and cell phone/WiFi coverage introduction dates 88
Figure 5-3b. Time series plots: ED thefts and release dates of popular devices 89
Figure 7-1. Hourly patterns of electronic device theft at stations 106
Figure 7-2. Contour chart: Hourly and daily patterns of electronic device theft at stations 107
Figure 7-3. Hourly patterns of ED theft at stations on school days vs. non-school days 113
Figure 7-4. Yearly patterns of electronic device theft at stations 115

xii
LIST OF PHOTOS
Photo 2-1. Concept of wearable phone 9
Photo 3-1. MBTA subway trains 22
Photo 5-1. Stills from NYPD PSA video 55
Photo 5-2. Stills from cell phone recording of thief stealing headphones from NYC man 55
Photo 5-3. Stills from British Transport Police PSA video 56
Photo 5-4. Still from CCTV video of man stealing a cell phone from sleeping NYC woman 56
Photos 5-5a – 5-5c. Various features located in MBTA subway stations 68
Photos 5-5d – 5-5e. Various features located in MBTA subway stations (continued) 69
Photos 5-5f – 5-5g. Various features located in MBTA subway stations (continued) 70
Photos 5-6a – 5-6d. People using electronic devices in MBTA mezzanine areas 71
Photos 5-7a – 5-7e. People using electronic devices in MBTA platform areas 72
Photos 5-7f – 5-7i. People using electronic devices in MBTA platform areas (continued) 73
Photos 5-8a – 5-8d. People using electronic devices in MBTA subway cars 74
Photos 5-8e – 5-8h. People using electronic devices in MBTA subway cars (continued) 75
Photo 5-9. Apple iPod advertisement on U.S. subway car 76
Photo 5-10. Sidekick theft awareness, MBTA Transit Police flier 91
Photo 8-1. Mobile phone theft awareness, MBTA Transit Police flier 118
Photo 8-2. Best Buy Express kiosk at Back Bay subway station 119
Photo 8-3. See Say iPhone app, MBTA Transit Police (iTunes) 121

1
CHAPTER 1: INTRODUCTION
1.1 Problem statement
As mobile technology advances and increases in popularity – and the demand for WiFi
and cell phone coverage booms, electronic device theft in public transportation systems is
becoming a growing problem in metropolitan areas around the world. According to a report by
the New York Police Department, of the 16,000 robberies in the entire city of New York during
the first 10 months of 2011, about 50 percent were electronic devices (Parascandola, 2011).
According to the report, electronics were the single most stolen property type, surpassing cash.
This report also stated that the Apple iPhone consisted of 70 percent of the thefts on NYC
subways and buses. The problem in New York has also led to violence. In 2012, an 81-year-old
man was pushed into the subway tracks in Brooklyn while chasing down teenage thieves who
stole his iPhone (Noel & Prokupecz, 2012). In 2013, a Philadelphia man dragged a woman onto
the subway tracks after stealing her phone. (Smith, 2013c). Electronic device theft is also causing
concern in public transit systems overseas. In the Shanghai subway, police say thieves snatch
phones from unsuspecting victims who sit near doorways (Minjie, 2011). In 2010, 53 percent of
the 1,071 violent thefts on Paris subways, buses and trams involved smartphones. This led Paris
police to warn riders to guard all of their electronic devices, especially the iPhone, following the
death of a woman who was pushed down the stairs by an offender after he stole her phone. Fliers
provided by the police remind riders that their cell phone is “so valuable that others would like to
get their hands on it too.”
Overall, electronic device theft in public transportation particularly fits both the study
areas of “crime and place” and “crime and opportunity” – since electronic devices are the
epitome of a “hot product” and a transit environment provides many opportunities for theft.

2
Yet, the literature related to this topic is limited. There are studies on the theft of electronic
devices. There are studies on crimes in public transport. However, there has been limited
scholarly research on electronic device theft within public transportation systems. This
converging crime topic is important; and should be considered by the academic community,
especially from environmental criminology and situational crime prevention perspectives.
This dissertation uses the Massachusetts Bay Transportation Authority (MBTA) subway
system in Boston, Massachusetts as a study site because of its unique characteristics. First, it is
among the cities that have seen a spike in electronic device theft. Second, it is one of the first
major underground public transportation systems in the U.S. to provide both cell phone coverage
and WiFi access to a majority of its subway lines and stations. Third, the MBTA specifically
collects information about each type of electronic device stolen, its manufacturer and its market
value.
According to the MBTA Transit Police, many factors contribute to this problem within
the Boston subway system. One of the most notable is the fact that a majority of subway riders
own smartphones, which are cell phones with computer-like capabilities such as Internet
connectivity, games, music, texting, e-mail, social media and camera functions. Smartphone
owners carry their device with them at all times and often display, check or use the devices on
the subway. This alerts offenders of potential suitable targets. Police officers have said that this
need to stay connected and entertained while riding on public transportation is a major
distraction; and since subway riders are “tuned in” to their electronic device screens while on the
subway, they are often “zoned out” from everything around them (personal communication,
January 10, 2012).

3
This research applies crime opportunity theories to better understand electronic device
theft and tailor crime prevention measures to high-risk subway stations, locations within cars and
stations, and lines. This approach addresses a gap in the previous literature regarding crime on
public transportation, as no studies have focused specifically on the problem of electronic device
theft in subways. Using police reports, this dissertation examines the increase in electronic
device thefts in the subway system from 2003-2011. Incident files are reviewed for relevant
information and coded. Additionally, physical locations within subway stations and subway cars
that are prone to electronic device theft are identified, such as areas near stairways or exits.
Finally, the before-and-after effects of introducing cell phone coverage and WiFi access to
subway stations is examined and recorded, focusing on its relationship with electronic device
theft.
This dissertation is organized as follows. Chapter 2 presents a review of research
literature about the following topics: crime on public transportation; robbery and larceny on
subways; and electronic device theft. Also in this chapter is an outline of the theoretical
framework used in the current study, which draws upon routine activity theory, crime pattern
theory and rational choice theory. Next, Chapter 3 provides the conceptual framework, research
design and research questions. The methodology section is covered in Chapter 4. This includes
the data sources, measures and analytical strategy. Chapters 5, 6 and 7 explain the results of the
transit-related, space-related and time-related research questions, respectively. The discussion
section is in Chapter 8 – along with contributions, limitations and thoughts on future research.

4
CHAPTER 2: LITERATURE REVIEW AND THEORETICAL FRAMEWORK
2.1 Literature review
a. Crime on public transportation
Public transportation ridership in the US has grown during the last three decades. Since
1972, overall public transit ridership has increased about 55 percent – with more than 10.2
billion trips recorded in 2010 on all modes of public transportation. Modes include buses,
trolleys, light rails, subways, commuter trains, streetcars, cable cars, ferries, water taxis,
monorails and tramways, van pool services, and paratransit services for Senior citizens and
people with disabilities (American Public Transportation Association, 2012).
Crime can occur on any of these modes of public transportation. In general, public
transportation seems to provide a unique environment that could be considered the textbook
definition of the “crime triangle” – by creating situations that repeatedly bring potential
victims/targets and motivated offenders together in space and time at a particular location.
Crimes that can occur within public transportation systems vary and can be grouped into
the following three categories: crimes against the transit authority (fare evasion, vandalism,
graffiti); crimes against transit authority employees (assault and robbery); and crimes against
passengers (theft, robbery, assault, sexual harassment).1 Research regarding crime on public
transportation often refers to the field of study as “transit crime” (Hoel, 1992).2 Of the transit
crime research that have been published, studies have focused on various modes of transit,
including: crimes on buses and at bus stops (Ingalls et al., 1994; Levine et al., 1986; Loukaitou-
Sideris, 1999; Newton, 2004; Pearlstein & Wachs, 1982; Yu, 2009); crimes on light rails
(Loukaitou-Sideris et al., 2002; Sedelmaier, 2003); and crimes on subways (Beller et al. 1980;
Clarke et al., 1996; Burrows, 1980; Felson et al., 1990; Gaylord & Galliher 1991; Kenney, 1987;

5
La Vigne, 1996a, 1996b; Myhre & Rosso 1996; Newton, 2014; Sloan-Howitt & Kelling, 1990;
Uittenbogaard & Ceccato, 2014; Weidner, 1996).
b. Robbery and larceny on subways
Electronic device theft in Boston subways is typically a crime against a passenger. The
subway environment has many features, including subway platforms, mezzanines, corridors,
access/turnstile points, waiting areas, ticket kiosks, token booths, exit stairways and
opening/closing subway car doorways. Since the crimes that occur in a subway system are partly
affected by the environment’s settings, all of these features can be conducive to electronic device
theft, especially robbery and larceny (Richards & Hoel 1980).
According to Smith and Clarke (2000), subway robbery relate to lack of supervision – or
lack of capable guardians, one component of routine activity theory (Cohen & Felson, 1979).
Offenders use three different approaches when committing a subway robbery. First, offenders
often seek vulnerable victims in deserted subway stations. For example, Falanga (1988) found
that passengers are at risk of robbery in stations that are large and sprawling. During the day,
these stations accommodate hundreds of people, but at night such large stations are sparsely
populated. Individuals are also at risk of robbery when there is lower passenger density within
subway cars and on platforms (Clarke et al., 1996). Second, passengers are at risk of robbery
when waiting at isolated stations during off-peak hours. (Shellow et al., 1975). Third, offenders
can prey on victims as they exit – either while leaving the subway car or platform (Block &
Davis, 1996). This last approach seems to be popular in Boston, according to the MBTA. For
example, police have explained that many offenders prey on victims who sit next to the subway
doors, waiting to steal their devices and run when the cars stop at a station and the doors open
(Seeyle, 2010).

6
Electronic device-related larceny is different than robbery, as it does not include force,
intimidation or a weapon. For example, pickpocketing (a stealth measure) and snatching (a
surprise measure) are forms of larceny. These types of larceny usually relate to the overcrowding
of areas within the subway system, which allow for the thefts to occur (Smith & Clarke, 2000).
Four dimensions of overcrowding can facilitate such larceny offenses in the subway system
(Morgan & Smith, 2006). First, overcrowding decreases the distance between offenders and
potential victims without causing immediate concern. Passengers who ride the subway every day
may become accustomed to crowded subway cars during rush hours. Second, the crowded
conditions may distract people who may have been able to detect or react to a theft under other
circumstances. Third, the constant movement of passengers on subway cars and platforms may
provide a convenient cover for offenders. Lastly, crowded areas may help offenders avoid
identification and escape.
Several studies have examined the different prevention measured used to combat subway
crime, specifically robbery and larceny. Webb and Laycock (1992) found that CCTV in the
London Underground reduced robberies, and increased passenger confidence. A previous study
of the London Underground also found a decrease in thefts once CCTV was implemented
(Burrows, 1980). La Vigne (1996a) found that spacious platforms, use of kiosks and lack of
bathrooms, lockers and vendors reduced crime in Washington, D.C. subway stations. This
redesigning measure also eliminated long, winding corridors, which could facilitate offenders
hiding in corners and dark places. Finally, in a landmark study, Chaiken et al. (1974) found that
an increase of NYPD officers from 8pm-4am reduced subway robberies and did not displace
crimes to other times.
7
c. Electronic device theft
Electronic devices, also known as portable or mobile devices, include smartphones, cell
phones, tablet and laptop computers, e-readers, MP3 and other music players and handheld
gaming systems. Most electronic devices have WiFi (Internet connectivity) and Bluetooth
(device connectivity). They are used for communication (phone calls, texting, e-mail) and
entertainment (games, music, social media, camera). Because of these functions, electronic
devices are considered to be the epitome of “hot products,” or items that are most suitable for
theft by motivated offenders (Ekblom, 2008). In addition, such devices are also CRAVED –
which is discussed in the next chapter under theoretical framework (Clarke, 1999). Given this, it
is important that stakeholders in law enforcement and government realize that spikes in thefts of
criminogenic products like electronic devices could lead to crime harvests, or crime waves
(Clarke & Newman, 2005a). According to Roman and Chalfin (2007), prior crime waves have
centered around expensive sneakers (Nike Air Jordan), jackets (Starter and North Face) and
media players (Walkman and iPod). However, what sets electronic device apart from these other
crime waves is that it is very common for almost every American to own at least one electronic
device. For example, according to findings from the September 2012 Pew Internet and American
Life Project, 85 percent of American adults own cell phones, while 45 percent have smartphones
(Pew Internet & American Life Project, 2012).
Electronic device theft, in general, is not only a problem in the U.S. It has also emerged
as an international crime trend. In the Netherlands, cell phone theft was already considered a
problem in the early 2000s. Theft decreased by 50 percent after Amsterdam police began using a
“bombing” strategy, which bombarded stolen cell phones with text messages from the police
department, such as: "You are in possession of a stolen cell phone.

8
Did you know that stealing a cell phone is a crime punishable by imprisonment? Using a stolen
cell phone is too, and you are risking a prison term of one year” (Harrington & Mayhew, 2001).
Using victimization statistics from the British Crime Survey between 1994-2010/2011,
Thompson (2014) found that mobile phones had the largest increase of all thefts over time. The
study reiterated that mobile phones are crave-able hot products that are snatched and robbed
from people at a high rate in comparison to other property items. When attempting to prevent
cell phone theft in the United Kingdom, the National Mobile Phone Crime Unit focuses on the
handlers, re-programmers and exporters of stolen cell phones (National Mobile Phone Crime
Unit, 2009). The unit was created in December 2003 and is a collaborative effort between law
enforcement, the government and the telecommunications industry. Since its introduction, more
than 22 million phones have been registered. The main goal of the unit is to work with phone
companies to register all cell phones in a database, known as Immobilise. If a registered phone is
ever stolen, police are able to identify it quickly. It also makes the cell phone unusable after
being reported as stolen, which again denies the benefits of reselling stolen phones or stealing for
practical use. According to the unit, thefts of cell phones have reduced since cell phone owners
have started using the registration system.
In 2012, similar legislation was proposed in the U.S. to create a database of all stolen cell
phones with the intention of blocking thieves from continued use or resale (U.S. Federal
Communications Commission, 2012). Smartphone manufactures responded to pressure from law
enforcement agencies nationwide in 2013 by promising to implement anti-theft features on future
devices. One Apple feature is said to be a “kill switch” that remotely disables a phone once it is
reported stolen. Another applies an “activation lock” requiring thieves to enter a password
specific to a stolen phone before it can be accessed.

9
However, some critics argue that these features will not deter thieves, who will learn how to
work around them (Smith, 2013b). It is important to note the lag in the implementation of such
anti-theft design features by major manufactures, despite past research calling for such needed
security enhancements to secure mobile phones (Whitehead et al., 2008). These suggestions
included: new legislation that would discourage reprogramming devices and ultimately blacklist
stolen devices at a global scale; making the tampering with IMEI codes – a device’s unique
identifier – illegal; software and hardware hardening; and the creation of wearable phones, as
shown in Photo 2-1.
Source: Whitehead et al., 2008
Photo 2-1. Concept of wearable phone
While there has been research on crimes that relate to electronic device theft like identity
theft and cybercrime (Allison, 2005; Clarke & Newman, 2005b; Gerard et al., 2004; Lynch,
2005; Wall, 2003) – the stealing of personal information from a device for illicit or illegal use;
and cell phone fraud (Clarke et al., 2001) – the act of cloning cellular devices, this dissertation
focuses solely on the theft of the electronic device itself.

10
The current study also recognizes recent research indicating that cell phone theft and cell phone
ownership may play a role in the various explanations for the crime drop since 1990. Some
studies highlight the fact that cell phone (and smartphone) theft has rapidly increased in the
United States and abroad, while other crime types have dramatically decreased (Farrell, 2013;
Farrell, et al., 2011). Other studies suggest that cell phones may provide both a deterrent and
capable guardianship effect from other crimes because of the ability to call police or identify
offenders with photos or videos (Orrick & Piquero, 2013; Klick, MacDonald, & Stratmann,
2012). Interest in the international increase in phone theft – despite “the crime drop” –
emphasizes why it is important to continue to study this crime type.
Reviewing the theft of a specific object (hot product) within a specific location (hot
environment) is the goal of this dissertation. This literature review is extended in the following
section detailing the theoretical framework of this study. There is a discussion of additional
transit crime studies focusing on crime on public transport and hot product theft through the lens
of the three environmental criminology theories -- routine activity theory, crime pattern theory
and rational choice theory.

11
2.2 Theoretical Framework
Environmental criminology is especially well-suited to learn more about electronic
device theft on subways. Three major theories – routine activity theory, crime pattern theory and
rational choice theory – all focus on the criminal event and not the criminal offender.
a. Routine Activity Theory
The routine activity theory (Cohen & Felson, 1979) is focused at the macro, or societal
level. The assumption of this theory is that a crime may occur when a likely offender and a
suitable target converge in space and time with the absence (or presence) of capable
guardianship. This is further illustrated by Figure 2-1, the modified crime triangle – or problem
analysis triangle (Eck, 1994; Clarke & Eck, 2005). A likely offender can be motivated by many
factors, including gain, need or the desire to own some attractive consumer product. A suitable
target can either be a person or an object. Finally, there can be numerous capable guardians, such
as a police officer, a nearby person, retail employees, a well-lit area, a locked door or an alarm
system.
Source: Clarke & Eck, 2005 (p.28)
Figure 2-1. Crime Triangle

12
This theory can easily be applied to electronic device theft on Boston subways. In order
for this specific theft to occur, a likely and motivated offender must find a suitable electronic
device. Once found, the offender will evaluate the capable guardianship available on the
platform, mezzanine or in the subway car. If this is adequate and guardianship is judged to be
lacking, the crime can proceed. As for the type of motivated offender, previous research found
that in the United Kingdom, more than 50 percent of the individuals who stole cell phones were
youth offenders, around 16 years old (Design Council, 2011; Harrington & Mayhew, 2001).
Additionally, an overwhelming percent of offenders were male. These data are similar to
accounts of Boston Transit Police officers assigned to subway detail. When asked to describe
typical offenders who stole cell phones on the subways, the officers all agreed on teenage males
(personal communication, January 10, 2012).
When considering the suitable target, electronic devices can be considered “hot products”
(Clarke et al., 2001). Consider the cell phone, for example. In October 2008, Motorola released a
new cell phone with touch-screen capability named the Motorola Krave ZN4. Cell phones also
fit the CRAVED model of suitable targets – meaning that cell phones are concealable,
removable, accessible, valuable, enjoyable and disposable (Clarke, 1999). As with other items
such as cash (Clarke, 1999), cloned cell phones (Clarke et al., 2001), purses and wallets (Smith,
2003) and even exotic parrots (Pires, 2012) – electronic devices, in general, are both CRAVED
items and hot products. Electronic devices are small and often look alike, so they are
concealable. Electronic devices are often free standing and lack any sort of tethering, so they are
also very removable. The frequent use or display of electronic devices also allows the hot
products to be easily accessible. Many models, especially smartphones, are expensive and
exclusive, which makes them valuable.

13
This also allows for electronic devices to be highly entertaining and enjoyable devices. Given the
demand for electronic devices, the fact that many can be resold easily allows for a disposable
product (CBS 2 New York, 2011).
Another useful tenet of environmental criminology is the “80-20 rule,” which states that
20 percent of any particular group of things is responsible for 80 percent of outcomes (Kock,
1999). When applying this rule of thumb to electronic device theft on Boston subways, only a
few devices are stolen a majority of the time, according to the MBTA Transit Police (personal
communication, January 10, 2012). For example, of the dozens of cell phones available on the
market, smartphones, such as the Apple iPhone, Android and BlackBerry, are the most popular
phones stolen on Boston subways – probably because all three models have computer-like
functions, cameras and music players (Rocheleau, 2011; Lohr, 2009). In fact, the frequency of
iPhone thefts nationwide has led many news outlets to refer to the burgeoning crime trend as
“apple picking” (Smith, 2013a). The 80-20 rule can be applied even further given that Apple
only made up 34 percent of the U.S. smartphone market in 2012 (Nielsen, 2012). Android, on the
other hand, held 51 percent of the smartphone market. And Blackberry, once a leader in the
smartphone industry, now claims about 5 percent of national ownership. This pattern of certain
models being stolen more often has been found in the United Kingdom too (Mailley et al., 2008;
Mailley, 2011; Home Office, 2014). As shown in Figure 2-2, Apple iPhone, Blackberry and
Samsung (Android) phones made up a majority of the mobile phones stolen within all of London
from August 2012 to January 2014, according to the Crime Survey for England and Wales
(Home Office, 2014).

14
Figure 2-2. Percentage of thefts by brand and relative market share, London
Finally, when taking the guardianship portion of the crime triangle into account, a study
found that the fewer number of people on subway platforms and in cars increases the risk of
robbery (Clarke et al., 1996; Belanger, 1999). This research illustrates the absence of capable
guardianship, which is opportunistic for offenders. The opportunity also arises due to lack of
supervision, which reiterates the previous discussion on robbery in subways (Newton, Partridge
& Gill, 2014b).
b. Crime Pattern Theory
The crime pattern theory (Brantingham & Brantingham, 1981) is focused on the meso, or
neighborhood-local level. Given that crimes have a tendency to occur and cluster based on
routine, daily activities, this theory focuses on how offenders and victims converge in space and
time along nodes, paths, and edges, with crimes occurring in activity spaces. Nodes are
centralized activity places, where people travel to and from, such as home, work, or school.

15
Paths are the actual routes that people take during these everyday activities, which usually
involve major traffic thoroughfares or transit systems. Edges are the boundaries of areas where
different people live, work, or do other recreation or interaction. Given that most offenders
follow the “journey to crime” (Phillips, 1980) and commit most of their crimes close to home
because they are familiar with the area, there is an automatic distance decay, which means that
crimes are less likely to occur farther away from an offender’s home. This also relates to the least
effort principle, which explains that offenders exert the minimum effort possible when
committing their crimes, such as limited travel.
Crime pattern theory can be applied to electronic device theft on Boston subways. In
2008, the MBTA subway system included 669 subway cars and 121 subway stations. Each
weekday, an average of 767,634 passengers rode the subway (MBTA, 2009). This figure is
important, given that on average, 32 percent of Boston residents use public transit to travel to
work (U.S. Census Bureau, 2008). This ridership saturation of the subway allows for offenders
and victims to converge along nodes, paths and edges. Nodes can represent a static, or stationary,
subway station near an offender's or victim's home or workplace (Newton, 2004). For example,
Belanger (1999) found that New York subway offenders commit most crimes in stations and on
subway cars near their homes, which follows the journey to crime and least effort principles.
Paths can represent the non-static subway lines that subway cars travel on or transfer stations,
which create intersections for offenders and victims to converge (Newton, 2004). If crime is
concentrated on a subway line or segment of a subway line, this could be considered a “hot
route” (Partridge, 2013).

16
Expanding on the concepts of nodes and paths, Gill, Partridge and Newton (2014) applied
crime pattern theory to further understand where thefts can occur within a transit network. The
authors noted that it is often difficult to pinpoint where victims have items stolen on a transit line
because most are pickpocket thefts. Therefore, the victims usually only know their starting point
and end point – and realize that the theft occurred at some time in between. In order to calculate
that unknown time, the authors developed interstitial crime analysis (ICA). This analysis could
also be used to map hot segments of a transit line where thefts are concentrated.3
17
Source: MBTA
Figure 2-3. MBTA subway, commuter and key bus map
As Figure 2-3 indicates, many subway lines intersect with one another, allowing a multitude of
potential crime activity spaces. Relatively short travel times allow offenders and victims to travel
easily throughout the city to outer boundaries, which in turn transcend edges.
In 1986, the first study focusing on crime patterns in a subway system was released by
the New York City Criminal Justice Agency. The study described several “hot spots,” with 24
percent of subway robberies occurring on platforms and 30 percent occurring in cars (Smith,
1986).
18
In comparison, a study of the London Underground and London South subway systems found
that more than 50 percent of subway robberies occurred in cars, while about 25 percent occurred
on a platform (Smith, 2003).
Given these hot spots, it is easy to understand why the Boston subway system would also
be considered a crime attractor, or a place where offenders go to commit crimes. Subway
platforms and cars provide plenty of opportunities and plenty of electronic devices to choose
from. However, in order to fully determine if the Boston subway system is a crime generator, or
a place where large numbers of people travel to for reasons that are unrelated to criminal
motivation, one must compare the subway crime rate to the overall crime rate of nearby surface
areas (see Chapter 6). Del Castillo (1992) conducted such a study in 1988 and found that subway
robbery within the New York subway system was in fact disproportionate to the robberies that
occurred above ground.
c. Rational Choice Theory
Rational choice perspective (Cornish & Clarke, 1986) focuses on the micro, or individual
level. This theory is based on how offenders weigh the costs and benefits of committing crimes.
It also assumes that offenders seek to benefit from crime and therefore consider the risks, efforts
and rewards of each crime opportunity (Clarke, 2012). Committing a crime involves a series of
decisions and processes made by the offender. Several principles underlie the rational choice
perspective, including the notion that criminal behavior is purposive, rational and specific to
individual crimes. Additionally, an offender’s decision to commit a crime is based on the stages
of involvement (initiation, habituation and desistance) or the specific criminal event being
committed. These choices are then decided either during preparation, target selection,
commission of the crime, escape following the crime or the crime’s aftermath.

19
All of these decisions are part of a crime script, or the step-by-step procedures take into account
by offenders during crimes (Cornish, 1994; Cornish & Clarke, 1986).
Numerous crime scripts may apply to electronic device theft on the subway. Offenders
must consider: (a) the risks of getting noticed, caught, photographed, chased, arrested, or
sentenced; (b) the level of involvement and the time of day, location and area; and (c) the
benefits of having anonymity in a crowded, unsupervised area and how the stolen device will be
used. All of these decisions also involve target selection, how the theft will be committed, the
method of escape and the outcome of the theft of the electronic device. The use of crime scripts
to explore electronic device thefts in MBTA subway stations is discussed in Chapter 5.
d. Risky Facilities
The concept of “risky facilities” argues that certain establishments with special functions
that fall under the same type (banks, bars, stores, schools) are more criminogenic than others
(Clarke & Eck, 2007; Clarke & Eck, 2005; Eck, Clark & Guerette, 2007). Crime is usually
concentrated at a few establishments, while a majority of the establishments experience little to
no crime – which also follows the 80-20 rule. Therefore, the risky facilities concept can be used
as a tool to identify problem locations.
The classification of risky facilities as problem locations has led to several place-based
crime prevention publications.4 For example, a recent project focusing on high- crime and
disorder “nuisance” motels in Chula Vista, California lowered Part I and Part II offenses
(Bichler, Schmerler, & Enriquez, 2013). This was done by regulating management, code and
ordinance enforcement – as well as requiring motel administration to meet operation and
performance standards.

20
Bowers (2014) extended the scope of risky facilities research by examining crimes that
occur within a problem location in comparison to crimes that occur externally, but within close
vicinity. The results found that some risky facilities serve as “crime radiators” – establishments
with high internal theft that also create high theft rates in the external environment nearby.
Recent public transit studies have also focused on internal vs. external crimes in relation
to risky facilities. Newton, Partridge and Gill (2014a) found that offenders who commit property
crimes below ground (internally) may also commit crimes above ground (externally).
Additionally, when studying the exposure of nearby criminogenic facilities, Groff and Lockwood
(2014) found that subway stations positively influence nearby violent, property and disorder
crimes at the surface-level.
The risky facilities concept has also been used to understand why concentrations of
offenders are drawn to certain locations. Bichler, Malm and Enriquez (2010) suggest that certain
facilities are magnetic – pulling offenders together from multiple jurisdictions. The researchers
explore this kind of offender convergence when studying delinquent youth “hangouts.” Again,
the results are similar to the 80-20 rule, since some places are more magnetic than others
(shopping centers and movie theaters near schools).
The risky facilities and magnetic facilities frameworks can both be applied to electronic
device theft in MBTA subways, as most of the thefts that occurred during the study period were
concentrated at a small proportion of all subway stations (see Figure 4-1).
MBTA subway stations fit many of the reasons outlined by Clarke and Eck (2005) why a
facility may be deemed “risky,” in relation to electronic device theft. First, subway stations have
many vulnerable targets/victims since they are located within a 24-hour public transportation
system.

21
Next, a majority of these victims carry electronic devices that are “hot products” to offenders.
Some of the subway stations may be located in high-crime neighborhoods where offenders live
or frequently travel to, while other subway stations may be located in an area with high
victimization rates. Both of these factors label those subway stations as crime attractors. And
finally, some subway stations without proper guardianship of surveillance may suffer from poor
management of the facility itself. The application of risky facilities is discussed in Chapter 6
when examining electronic device theft at stations in comparison with surface-level crimes.
MBTA subway stations can serve as magnetic facilities because offenders, especially
youths, may use the subway to travel from one magnetic facility to another, which follows the
journey to crime tenet. This is explored in Chapter 7 when discussing the influence on school
dismissal times and electronic device theft at subway stations.
This chapter reviewed previous studies involving crime on public transportation.
Additionally, crime opportunity theories were discussed. The research design for the current
study was developed based off of the theoretical framework mentioned above. Chapter 3
discusses how the pilot study evolved into the concept of the current study.

22
CHAPTER 3: CONCEPTUAL FRAMEWORK AND RESEARCH QUESTIONS
3.1 Study area
Source: MBTA, 2014a
Photo 3-1. MBTA subway trains
Besides being the home of the fifth largest public transportation system in the United
States (American Public Transportation Association, 2012), Boston was selected to study
electronic device theft within subway systems because the MBTA collects incident-level data of
electronic device thefts, which is rare (Ketola & Chia, 2000). Additionally, Boston is an
appropriate research site because it is one of the first transit systems to add WiFi and phone
coverage within subway cars and stations, which makes it more likely that phones and WiFi
devices will be used.

23
The MBTA public transportation system has subways, buses and a commuter train rail
(MBTA, 2009). For the purposes on this study, only Boston subways and streetcars were
considered. As shown in Figure 2-3 and Photo 3-1, the subways travel the Blue, Green, Red and
Orange subway lines. All four of these lines include 120 stations that are either underground,
elevated or at grade-level. Underground stations are located below ground, with trains traveling
along tracks inside tunnels. Elevated stations are located above ground, with train tracks often
situated on platforms hundreds of feet above. Grade-level stations are located on the street, with
train tracks running along roadways.
Of the four subway lines, some have special features. The Red, Orange and Blue lines are
rapid transit lines, with either underground or elevated subway stations. The Green Line is a light
rail line, with streetcars both underground and at grade-level on the street. Once traveling outside
of the downtown Boston core, the Red and Green lines split into separate branches. The Red
Line has two branches in the south: “Ashmont/Mattapan” and “Braintree.” The Green Line has
four branches located in the west: “B,” “C,” “D” and “E.” Figure 2-3 shows a map of these lines.

24
3.2 Pilot study: Cell phone theft in Boston subways
A pilot study focused only on theft of cell phones in the Boston subway system. It
examined how such thefts were related to surface-level crime rates and Census characteristics
(Gentry, 2010). Data were compiled from 556 MBTA Transit Police reports between January 1,
2005 and December 31, 2010. It is important to note that the MBTA only indicates the nearest
subway station address of each cell phone theft.
Additional information was collected from the 2008 Boston Police Department Crime
Summary Report, including the number of armed robberies and larceny thefts over $250 in each
police district. Total population, number of subway commuters and median income within each
block group was collected from the 2008 American Community Survey by the United States
Census Bureau.
Cell phone thefts occurred at or near 74 of the 120 subway stations on either the Blue,
Green, Red or Orange subway lines. Downtown Crossing station had the most cell phone thefts,
with 57 (considered a “hot spot” for crime), while the Orange Line had the most cell phone
thefts, with 275 (considered a “hot route” for crime). Additional results suggest that surface-level
crime statistics and Census characteristics can help us understand why cell phone thefts occur
more at certain stations. Specifically, key findings were as follows:
a. Stations where armed robbery is high within the police district above also have the
most armed robbery of cell phones
b. Stations where larceny is high within the police district above also have the most
larceny thefts of cell phones
c. Most cell phone thefts occur at stations where the block groups have a low-to-
moderate population
d. Block groups with a higher number of subway commuters have more cell phone
thefts
e. The most cell phone thefts occur within block groups that have low to moderate
income levels, from $15,000 to $55,000

25
3.3 Current study: Electronic device theft in Boston subways
This dissertation was developed to build findings from the pilot study. The main
objective is to expand the scope of the previous study and examine the increase in all electronic
device theft in the Boston subway system, not only cell phone theft.
a. Research questions
To better understand electronic device theft in Boston subways, the research questions for
this dissertation are separated into three categories: transit-related questions, space-related
questions and time-related questions. The hypotheses were derived from the framework of the
three major environmental criminology theories (Appendix A presents a question-method matrix
that lays out research questions and hypotheses, linking each to a theoretical framework and
analytic strategy).
Transit-related research questions
RQ 1.1 Which subway station features are associated with higher counts of electronic
device theft?
RQ 1.2 Which locations within subway stations and subway cars are the most at-risk of
electronic device theft?
RQ 1.3 How has the introduction of phone and WiFi service on subway lines influenced
electronic device theft?
Space-related research question
RQ 2.1 How does electronic device theft in the MBTA subway system compare to
surface-level property crimes, larcenies and robberies near stations?
Time-related research question
RQ 3.1 Is the time of day, week or year related to electronic device theft at subway
stations?

26
b. Important terms
cell phone the predecessor to smartphones, sometimes referred to as dumbphones or
mobile phones. Cell phones do not have computer-like functions and
only allow users to send/receive phone calls or send/receive SMS and
MMS messages through a cellular network
electronic device potable electronic devices – including smartphones, cell phones, tablet and
laptop computers, e-readers, MP3 music players, CD players and handheld
gaming systems
phone coverage access to a cellular network in order to send/receive phone calls, access
the internet or send/receive text messages
pickpocketing a stealth measure of theft. Offenders typically steal electronic devices
from a victim without their knowledge (pockets, bags)
ridership the number of commuters entering a subway station
robbery a tactic using force or threatening to use force to steal a electronic device –
(current study) this force can be physical and/or include a weapon
smartphone cell phones with computer-like capabilities such as WiFi (Internet
connectivity) and Bluetooth (device connectivity), games, music, texting,
e-mail, social media and camera functions
snatching a surprise measure of theft. Offenders typically steal electronic devices
from the hands, person or surrounding area of the victim
surface-level crimes incidents that occur above ground and not within the subway environment
text messaging SMS messaging (text only) and MMS messaging (audio, video, photo)
WiFi hotspot areas that allow electronic devices to connect to the Internet wirelessly
through routers

27
CHAPTER 4: METHODOLOGY
4.1 Data sources
This study is restricted to subway lines and excludes the commuter rail and buses. Only
electronic device thefts that occurred on or near the Blue, Green, Red and Orange subway lines
were included. All of the data used for this dissertation was compiled from MBTA Transit Police
incident-level case reports between August 19, 2003 and December 31, 2011. The beginning of
this time period corresponds with the implementation of the police department’s digital records
management system (RMS), known as Larimore, in August 2003. Larimore is a specialized RMS
for law enforcement and fire and rescue. The previous RMS used before Larimore was not
readily available for review or data extraction. Once the target dates were selected, MBTA crime
analysts and IT personnel used Crystal Reports and Microsoft Access reporting/database
software to assist with the export of cases from the Larimore system. Only stolen property cases
were queried. Then the list of property types was reviewed and only cases with stolen electronic
devices were considered. The fields used from each case file were: case year, date, day of week,
time, subway station and subway line.
Table 4-1a. Counts and percentages of stolen electronic devices at MBTA subway stations,
2003-2011 (n = 1,163)

28
Table 4-1b. Counts of stolen electronic devices, by year (n = 1,163)
Electronic device theft in subways
During the 2003-2011 study period, 1,163 electronic devices were stolen at subway
stations. As indicated in Table 4-1a, the types of stolen electronic devices included cell phones
(n= 814), MP3 players (n=131), laptop computers (n= 92), CD players (n= 66), digital camera
(n= 37), video games (n= 14) and DVD players (n= 9). Again following the CRAVED model,
smaller devices, such as cell phones and MP3 players were stolen the most often. This also aligns
with the literature stating that theft of cell phones has dramatically increased in recent years. It is
important to note that unlike the differentiation of CD players and MP3 players as music devices,
the cell phones category includes both smartphones and regular cell phones – since the study
period is from 2003-2011.This grouping is also because, unfortunately, the MBTA Transit Police
did not identify cell phones vs. smartphones in the Larimore recordkeeping system. As shown in
Table 4-1b, cell phone theft has increased over time. Again, this finding coincides with statistics
from the United Kingdom (Home Office, 2014; Thompson, 2014). Yet, when looking at MP3
players and CD players in the middle of the study period, both of these devices were stolen less
often after 2007-2008.

29
Certain popular devices/models and their release dates may have an impact on electronic device
theft in the MBTA subway system. This is discussed in Chapter 5.
Subway station characteristics
The 2007 MBTA Blue Book of Ridership and Service Statistics was used to collect
subway station features. This report is publically provided on the MBTA website. The year 2007
was chosen because it was in the middle of the study period. The features included from this
report include average weekday ridership at each station, whether or not there was a park-n-ride
lot and whether or not there was a bus connection at each station. The Central Transportation
Planning Staff (CTPS) of the Boston Region Metropolitan Planning Organization provided the
data related to terminus subway stations and grade levels at all subway stations.
Surface-level crime
In Boston, police precincts are considered “districts.” To collect surface-level crime
statistics for each district, 2007 crime statistics from the Boston Police Department and
surrounding townships were used. The number of larceny, robbery and all property crime
offenses were collected. Again, 2007 was selected due to being in the middle of the study period.
These reports were collected from the Massachusetts Crime Reporting Unit website. The
Massachusetts Crime Reporting Unit is part of the criminal information section of the
Massachusetts State Police. This official unit collects, maintains, analyzes, and reports crime
data for state, local, campus and federal police agencies in Massachusetts.
For this study, all of the variables from the various data sources were stored and
maintained in Microsoft Excel spreadsheets. SPSS and Stata statistical software were used for
analysis.

30
4.2 Measures
Figure 4-1. Histogram: Electronic device theft frequency and station count, 2003-2011

31
Table 4-1c. Descriptives for electronic device (ED) thefts at all subway stations (n = 1,163)
Source Variable Description Minimum Maximum Mean SD
MBTA ED Thefts Number of thefts (per station) 0.00 77.00 9.69 15.86
(Larimore RMS)
*Two subway lines indicate transfer stations
Figure 4-2. Electronic device theft count by MBTA subway line

32
a. Dependent variable
As shown in Table 4-1c, the dependent variable is the number of electronic device thefts
at all Boston subway stations during the study period (n= 1,163, mean= 9.69, SD= 15.86). The
unit of analysis is each individual subway station – because the MBTA Transit Police only
indicates the nearest subway station address when reporting electronic device theft. It is difficult
to know whether victims reported thefts occurring on subway cars traveling between stations,
since only 8.4 percent of the cases (98 of 1,163) included both an origin and departure station in
the incident report. The remaining cases only included one subway station as the location of the
theft. This could be an administrative oversight and should be considered for future research.
Of the 120 subway stations on these lines, electronic device thefts occurred at 90 stations,
as shown in the histogram in Figure 4-1. This distribution follows the 80-20 rule, as 73 percent
of all electronic device thefts (859 of 1,163) occurred at 20 percent of the subway stations (24 of
120). This histogram is also in the shape of a J-curve, meaning that thefts are concentrated on the
left side of the graph where there are fewer stations; and taper off to the right as the number of
stations increases.
b. Thefts by subway line and transfer stations
Figure 4-2 separates the 1,163 electronic device thefts by subway line. A majority of the
thefts occurred at stations on the Orange and Red lines. These two lines would be considered
“hot routes” (Partridge, 2013). Six MBTA subway stations allow commuters to transfer between
subway lines. All of the transfer stations intersect two subway lines only:
Blue/Green transfer station: Government Center
Blue/Orange transfer station: State
Orange/Green transfer stations: Haymarket; North Station
Orange/ Red station: Downtown Crossing
Red/Green station: Park Street

33
All of the six transfer stations have high weekly ridership and are located in or near the
downtown core Boston area. It is very interesting that only a few of these stations have
concentrations of electronic device theft (see Table 4-2). As discussed in Chapter 5, of the six
transfer stations, only Downtown Crossing, Park Street, State and Haymarket stations land of the
“Top 24 list” of stations with the most electronic device theft. North Station and Government
Center have very few thefts. This suggests that high ridership and transfer station status alone do
not necessary relate to electronic device theft at stations.
Table 4-2. Counts and percentages of electronic device theft at transfer stations (n = 1,163)

34
4.3 Analytical strategy
The analytical approaches vary by transit, space, time-related research question, as shown
in Appendix A.
RQ 1.1 Which subway station features are associated with higher rates of electronic
device theft?
RQ 2.1 How does electronic device theft in the MBTA subway system compare to
surface-level property crimes, larcenies and robberies near stations?
Negative binomial regression
Since this study involves count data (number of electronic device thefts at subway
stations), negative binomial regression is used for the two research questions above (Hilbe,
2011). This method fits because 30 stations have zero thefts during the study period (see Figure
4-1). Additionally, because the variance of the dependent variable (251.57) is larger than the
mean (9.69), overdispersion exists. The intent is to identify the factors that contribute to
electronic device theft at subway stations. The results of these two research questions are
presented in Chapter 5 (RQ 1.1) and Chapter 6 (RQ 2.1).

35
RQ 1.2 Which locations within subway stations and subway cars are the most at-risk of
electronic device theft?
Field observations
Since the data follows the 80-20 rule, the top 24 subway stations that have the most
electronic device theft (73 percent) were visited to provide situational context to the analyses
conducted for this dissertation. During the visits, the subway station environment and the
behavior of commuters using electronic devices were observed. The observations occurred
between Friday, October 4, 2013 and Monday, October 7, 2013. The period was chosen to
observe both weekday and weekend activity. The goal of the observations was to document the
behavior of individuals using electronic devices on subway mezzanines, platforms and subway
cars. The types of devices most commonly used and the manner in which they are used was also
recorded. Finally, photos of commuters using electronic devices were collected.
The results of these observations are used as supplemental information for the crime
script analysis described below. Multiple studies have depended upon structured observations to
examine the behavior of commuters on various modes of public transportation (Lyons et al.,
2007; Ohmori & Harata, 2008; Russell et al., 2011, Timmermans & Van der Waerden, 2008).
Crime script analysis
The purpose of crime script analysis is to organize the behavioral processes that occur
during a crime event in sequential order (Clarke & Eck, 2005; Cornish, 1994; Cornish & Clarke,
1986). For instance, Tompson and Chainey (2011) suggest that crimes should be broken down
into acts and scenes with actors engaging in multiple activities throughout the scenario.
36
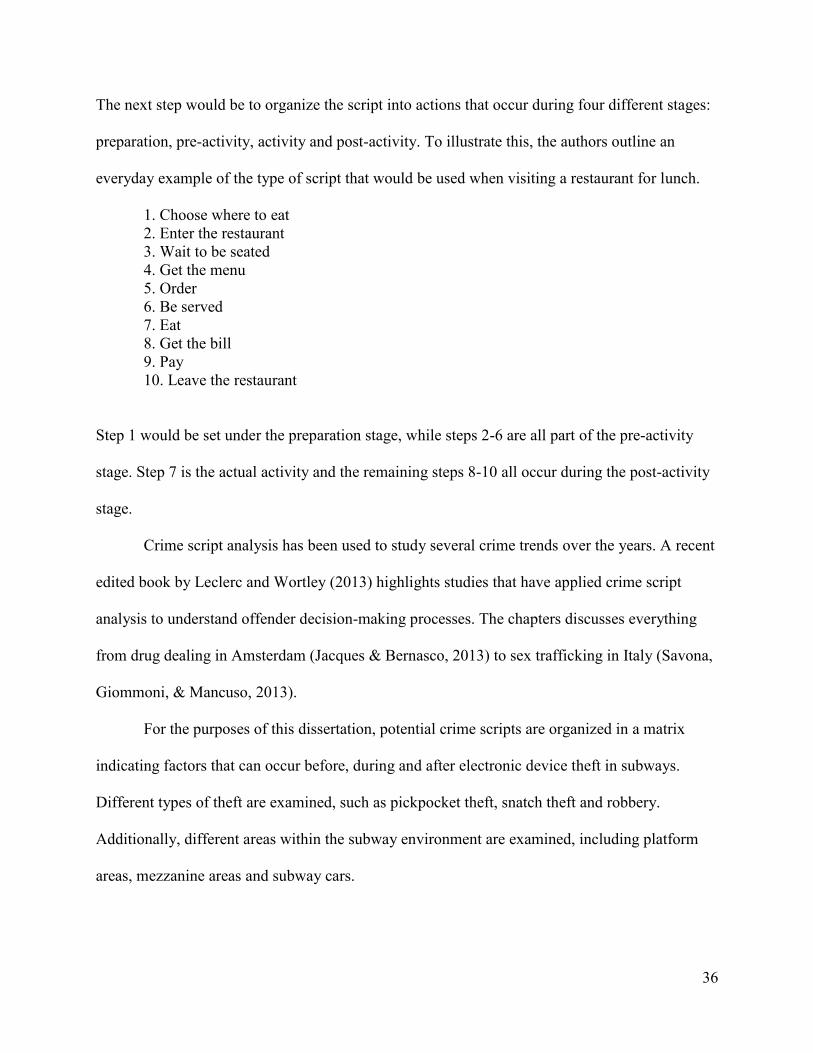
The next step would be to organize the script into actions that occur during four different stages:
preparation, pre-activity, activity and post-activity. To illustrate this, the authors outline an
everyday example of the type of script that would be used when visiting a restaurant for lunch.
1. Choose where to eat
2. Enter the restaurant
3. Wait to be seated
4. Get the menu
5. Order
6. Be served
7. Eat
8. Get the bill
9. Pay
10. Leave the restaurant
Step 1 would be set under the preparation stage, while steps 2-6 are all part of the pre-activity
stage. Step 7 is the actual activity and the remaining steps 8-10 all occur during the post-activity
stage.
Crime script analysis has been used to study several crime trends over the years. A recent
edited book by Leclerc and Wortley (2013) highlights studies that have applied crime script
analysis to understand offender decision-making processes. The chapters discusses everything
from drug dealing in Amsterdam (Jacques & Bernasco, 2013) to sex trafficking in Italy (Savona,
Giommoni, & Mancuso, 2013).
For the purposes of this dissertation, potential crime scripts are organized in a matrix
indicating factors that can occur before, during and after electronic device theft in subways.
Different types of theft are examined, such as pickpocket theft, snatch theft and robbery.
Additionally, different areas within the subway environment are examined, including platform
areas, mezzanine areas and subway cars.

37
These factors are further informed by what was recorded during the field observations within the
MBTA subway system during October 2013, as well as police PSA videos, transit security
CCTV videos and online videos of recent “caught on tape” thefts. The intent is to rationalize the
areas within the subway environment where electronic device theft occurs and the risky
behaviors of subway commuters, based on the field observations of the top stations with the most
theft. The observational and crime script analysis results are discussed in detail in Chapter 5.

38
RQ 1.3 How has the introduction of phone and WiFi service on subway lines influenced
electronic device theft?
The intent is to analyze the number of electronic device thefts over time based on two
interventions: the introduction of phone service and the introduction of WiFi service. The results
of the analysis outlined below are covered in Chapter 5.
Sign tests
The method used is a sign test, also known as a paired-samples sign test. This method is
applicable because the dependent variable has a ratio level of measurement; and the purpose is to
compare means of two correlated values (or matched pairs) – in this case by analyzing pre- and
post- service implications (Gibbons, 1993). Comparing the difference of means is a standard
practice in crime and criminology research methods (Walker & Maddan, 2012). To reiterate, this
study uses count data – electronic device thefts at subway stations. As illustrated by the
histogram in Figure 4-1, theft is positively skewed, meaning that it is not normally distributed
nor symmetrical. This is because many subway stations have zero theft, while fewer stations
have several thefts. Sign tests are used when working with such data. This non-parametric
approach is an alternative to traditional paired t-tests, which require normally distributed
observations. It is also an alternative to the Wilcoxon signed rank test, which allows for non-
normality, but requires symmetrical observations. Non-parametric statistics are appropriate in the
social sciences (Wilcox, 1987); and the sign test procedure is often used when measuring the
difference in before and after treatments. Finally, because sign tests do not depend on normality,
the test statistic is resistant to the influence of outliers. Outliers are expected in the current study
because, again, electronic device thefts are concentrated at a few stations – which follows the 80-
20 rule.

39
RQ 3.1 Does the time of day, week or year influence electronic device theft at subway
stations?
Temporal patterns identification
It is important to identify the frequency of crimes at specific places over time (Weisburd,
Lum & Yang, 2004). Given this, the intention is to determine which times of day, week and year
indicate the most electronic device thefts at stations. Peak and off-peak hours and seasonal usage
are also important. To do this, the results are organized in descriptive tables, line charts and bar
charts.
The descriptive tables feature summary indicators for hourly electronic device theft
patterns. Felson and Poulsen (2003) developed this approach to summarize hour-of-day
variations with the following indicators: median hour of crime, crime quartile minutes, crime’s
daily timespan and the 5-to-5 share of criminal activity. After determining what time should be
used as the start of the day, the median hour of electronic device theft is calculated – with half of
all thefts occurring before that time and the other half occurring after. Next, crime quartile
minutes are calculated by dividing the first and second halves of the day into four equal quartiles.
Then the daily timespan of electronic device theft is calculated by adding the minutes between
the first and third quartiles. Finally, the 5-to-5 share of electronic device theft is calculated to
indicate how theft is dispersed throughout the day, typically from 5am to 5pm.
The line charts identify trends, cycles and noise patterns. Wild & Seber (2000) explain
that this approach visually identifies daily, seasonal and yearly variation (see Figure 4-3). Trends
represent gradual fluctuations in one direction, cycles represent repetitive patterns and noise
represents irregular patterns.
Bar charts are the final graphic representation of time data. These also identify monthly
and yearly patterns of electronic device theft.

40
Figure 4-3. Line charts: trends, cycles and noise
Overall, the use of descriptive tables, line charts and bar charts help reveal more about
why certain stations encounter more theft than others. The results of this analysis are covered in
Chapter 7.

41
4.4 Formatting of analytical chapters
Chapters 5, 6 and 7 are formatted in a similar fashion. The first section of each chapter
restates the research question and provides an overview of the hypothesis. This section also
explains how the hypothesis was derived from environmental criminology theories and relevant
studies. The second section of each chapter outlines the independent variables used in the
analysis. The third section of each chapter describes the results of the analysis. The fourth and
final section of each chapter discusses the interpretation of the results – and also links the results
to theoretical perspectives and past literature.

42
Chapter 5: TRANSIT-RELATED RESEARCH QUESTIONS
5.1 Research Question 1.1
RQ 1.1 Which subway station features are associated with higher rates of electronic
device theft?
a. Hypothesis
H 1.1 Thefts will increase at stations with higher ridership, bus connections, parking
lots. Thefts will also increase at above-ground and terminus stations; and on
subway lines with more stations.
The first transit-related question asks which subway station features are associated with
higher rates of electronic device theft. It is hypothesized that electronic device thefts will
increase at stations with higher ridership, bus connections and parking lots. It is also assumed
that thefts will increase at above-ground and terminus stations; and on subway lines with more
stations. All of these assumptions stem from crime pattern theory. Because offenders and victims
converge in space and time at subway stations (nodes), this environment creates the opportunity
(activity space) for crimes to occur.
Studies on this topic align with the different parts of this hypothesis. Belanger (1999)
found that the higher the average ridership at a subway station, the higher the crime rate at that
station. This means that the more people who enter and commute from a certain station may
increase the number of offenders, victims and targets at the station – which in turn increases
crime. Studies have found that crimes on subway platforms also increase at stations with higher
ridership (Burrows, 1980; Loukitau-Sideris, 2002; Shellow et al., 1975). The same can be true
for subway stations near bus connections, where commuters exchange or transfer to a local bus
once exiting the subway station (Yu, 2009). Yu found that bus stops are associated with
increased crimes. Finally, subway stations near park-n-ride parking lots have more Type 1 crime
(Loukitau-Sideris, 2002).

43
This study found that 60 percent of the crimes that occurred on a subway line actually occurred
within the park-n-ride lots where commuters pay to park their vehicles near a subway station for
short-term periods. Only 20 percent of crime occurred on the platform. Shellow et al. (1975) also
found that offenders target passengers in elevated stations, while Block and Davis (1996)
hypothesize that terminus stations with a high volume of riders departing to reach suburban areas
would generate more street robberies.
b. Independent variables
The independent variables are referred to as ridership, bus and parking, subway line,
transfer station, terminus station and grade level of each station (see Table 5-1). The average
number of weekday riders at each Boston subway station ranged from 48 to 23,500 (mean=
4386.88, SD= 4830.740). Of the 120 subway stations, 68 percent had a bus station (mean= 0.68,
SD= 0.47) and 22 percent had a park-n-ride lot (mean= 0.22, SD= 0.41). As for subway line, 8
percent were Blue Line stations (mean= 0.08, SD= 0.28), 52 percent were Green Line stations
(mean= 0.52, SD= 0.50), 12 percent were Orange Line stations (mean= 0.12, SD= 0.33) and 23
percent were Red Line stations (mean= 0.23, SD= 0.22). Five percent of the stations were
transfer stations – with two subway lines intersecting (mean= 0.05, SD= 0.22). As for terminus
status (mean= 0.11, SD= 0.31), 11 percent were end-of-line stations. And finally in regard to
grade level of each station, 72 percent were street-level and above-ground stations (mean= 0.72,
SD= 0.45), 25 percent were underground stations (mean= 0.25, SD= 0.43) and 3 percent were
elevated stations (mean= 0.03, SD= 0.18).5

44
Table 5-1. Descriptives for subway station characteristics (n = 120 subway stations)
Source Variable Description n Minimum Maximum Mean SD
MBTA Ridership Avg. number of weekday riders -- 48.00 23500.00 4386.88 4830.74
(2007) Bus Bus connection 82 (no=0) (yes=1) 0.68 0.47
Parking Park-n-Ride lot 26 (no=0) (yes=1) 0.22 0.41
Blue Blue subway line stations 10 (no=0) (yes=1) 0.08 0.28
Green Green subway line stations 62 (no=0) (yes=1) 0.52 0.50
Orange Orange subway line stations 15 (no=0) (yes=1) 0.12 0.33
Red Red subway line stations 27 (no=0) (yes=1) 0.23 0.42
Transfer Transfer stations with 2 lines 6 (no=0) (yes=1) 0.05 0.22
CTPS Terminus End-of-line stations 13 (no=0) (yes=1) 0.11 0.31
Above Ground Street and above-ground stations 86 (no=0) (yes=1) 0.72 0.45
Underground Underground stations 30 (no=0) (yes=1) 0.25 0.43
Elevated Elevated stations 4 (no=0) (yes=1) 0.03 0.18
MBTA: Massachusetts Bay Transportation Authority
CTPS: Central Transportation Planning Staff, Boston Region Metropolitan Planning Organization

45
Table 5-2. Negative binomial regression for 2003-2011 electronic device thefts at MBTA
subway stations and subway station characteristics (n = 120 subway stations)
Variable B (SE) IRR Z
Ridership 0.0001 (0.0003) 1.0001* 3.24
Bus (no=0; yes=1) 0.5504 (0.2526) 1.7340* 2.18
Parking (no=0; yes=1) - 0.0429 (0.2593) 0.9579 - 0.17
Blue (no=0; yes=1) - 0.0032 (0.5739) 0.9967 - 0.01
Green (no=0; yes=1) - 1.5501 (0.5042) 0.2122* - 3.07
Orange (no=0; yes=1) 0.9653 (0.5022) 2.6256* 1.92
Red (no=0; yes=1) 0.3550 (0.4909) 1.4262 0.72
Terminus (no=0; yes=1) 0.6050 (0.2978) 1.8314* 2.03
Above Ground (no=0; yes=1) - 1.1089 (0.4727) 0.3299* - 2.35
Under (no=0; yes=1) - 0.9930 (0.4986) 0.3704* - 1.99
*P < 0.05
Pseudo R2 = .1779
Log likelihood = -305.3541
Likelihood ratio chi-square = 132.13
Cronbach’s = 0.0005

46
c. Results: Negative binomial regression
The results of the negative binomial regression for predicting electronic device theft in
Boston subway stations from subway station characteristics are displayed in Table 5-2. The
model is significant (p<.01), meaning that all of the predictors, when taken together, are
associated with electronic device theft in subways. The log-likelihood of this model (-305.3541)
is closer to zero than the base model without any predictors (-371.41806). This indicates a better
fit. The independent variables explain 17.7 percent of the variance of electronic device theft.
This most likely could be since only a few subway characteristics and other predictor variables
were included in the model. Additionally, the ridership, bus connection, Green Line, terminus
station, above ground station and underground station variables are significant, meaning that
their p-values are less than 0.05. The Orange Line variable has a p-value that is close to p<.05
(p=0.055). This significance is indicated by the asterisks next to the incidence rate ratios. The
incident rate ratios (IRR) are obtained by exponentiating the regression coefficients. This
determines the percentage change in the risk of electronic device theft for each unit increase in
the independent variable. When an independent variable has an IRR value that is greater than 1,
there is a positive change in the dependent variable. Conversely, when an independent variable
has an IRR value that is less than 1, there is a negative change in the dependent variable.
The IRR values for the ridership, bus, Orange Line and terminus variables are greater
than 1. This means that the presence of these variables increased the number of electronic device
thefts at subway stations. On average, electronic device theft increases by: 0.0001 for every
additional subway rider at a subway station, 0.7340 when there is a bus connection at a station,
1.6256 on the Orange Line and 0.8314 at terminus stations. The IRR values for the Green Line,
above ground station and underground station variables are less than 1.

47
This means that the presence of these variables did not increase the number of electronic device
thefts at subway stations. Instead, electronic device theft decreases by: 0.2122 on the Green Line,
0.3299 at above ground stations and 0.3704 at underground stations.
Finally, the parking, Blue Line and Red Line variables were not significant, meaning that
their p-values were greater than 0.05; and their presence did not impact electronic device theft at
subway stations. The transfer station and elevated station variables were omitted from the model
because of multi-collinearity.
d. Discussion: Summary of key findings and linking theory
Ridership and bus connections
The ridership and bus connection variables are significant within the model (see Table 5-
2). These findings reject the null hypothesis and support crime pattern theory. When there are
more riders at a subway station, the opportunity for the electronic device theft increases. The
higher the subway station ridership, the more targets that offenders can choose from. These
targets are potential victims with suitable electronic devices. Ridership can also increase when
there is the presence of a bus connection at a subway station. This attracts more people, both
motivated offenders and suitable targets, to a given node (subway station).

48
Parking
The parking variable is not significant within the model. This finding suggests that park-
n-ride lots do not influence electronic device theft at subway stations. This result could be
because offenders who visit subway stations with park-n-ride lots may be more interested in
committing motor vehicle theft or burglary/larceny theft from vehicle, instead of electronic
device theft, which is a more intimate and personal crime of larceny from a person (snatch theft
or pickpocketing). This assumption is consisted with Loukitau-Sideris (2002), who found that
theft of or from vehicles made up at least half of the crime that occurred at subway stations with
park-n-ride lots.
Subway station grade level
The above ground variable is significant within the model, but it has an IRR value that is
less than 0. This finding accepts the null hypothesis and indicates that electronic device thefts
actually decrease at above ground stations. This could be because above ground stations are
more open than underground stations, which may increase sight lines for potential capable
guardians. This heightened visibility may serve as a deterrent for offenders.
The underground variable is also significant within the model – with a below-zero IRR
value. This means electronic device theft decreases at underground stations too. This finding
supports the original hypothesis that electronic device theft would be less likely to occur at
underground stations because it is more difficult for offenders to escape. Offenders may have to
venture through many areas in order to leave a subway station. This could be problematic when
trying to avoid detection or apprehension.

49
For example, if an offender pickpockets a phone on a subway car, he or she may have to exit the
subway car, walk from the platform to the mezzanine and then exit the turnstile area. The route
that an offender uses to escape after committing an offense could be considered a path, as per
crime pattern theory.
Terminus stations
The terminus variable is significant within the model. This finding rejects the null
hypothesis and suggests that electronic device theft increases at terminus (end-of-line) stations.
This could be because offenders have more opportunities and more targets to choose from due to
terminus stations accommodating large numbers of suburban commuters. This finding relates to
the “edges” concept of crime pattern theory because suburban areas lie on the outer edges of the
Boston metropolitan area and MBTA subway system. Alternatively, it could also be because
victims may realize that their device was stolen when they reach the end of the line and indicate
the terminus station as the location of the theft in the police report.
Subway lines
It was hypothesized that the more stations on a subway line, the more at-risk the subway
line. More stations on a line offer thieves more opportunities to look for suitable electronic
devices to steal. Using this assumption, the Green Line would be the most at risk, the Red Line
would be next, followed by the Orange Line and finally the Blue Line (see n totals in Table 5-1).
Yet, as shown in Figure 4-2, more electronic device theft is concentrated on the Orange and Red
lines, while the Green and Blue lines have the least theft. This concentration contradicts the
regression results, however, which indicate that the Green and Orange lines are the only lines
that are significant predictors influencing electronic device theft.

50
In particular, thefts decrease at subway stations on the Green Line – since the IRR value is less
than 0. This finding, which accepts the null hypothesis, is very interesting because the Green
Line has the most subway stations and has high ridership.
Electronic device theft increases at subway stations on the Orange Line. This finding
partially rejects the null hypothesis because the Orange Line does not have as many stations as
other lines, but is still found to increase electronic device thefts when considering the regression
model.
The Red and Blue lines were not significant variables in the model. This is
understandable when considering the Blue Line, since it has the fewest subway stations and the
lowest ridership. However, it is interesting that the Red Line does not influence electronic device
theft since it ranks second in the most subway stations and has a high ridership.
It is important to note that when running this negative binomial model with the Red Line
omitted as a reference category, the results, significance and variance all remain the same.
Therefore, the full model – with all four of the train lines – serves as the base model for this
research question.

51
5.2 Research Question 1.2
RQ 1.2 Which locations within subway stations and subway cars are the most at-risk of
electronic device theft?
a. Hypothesis
H 1.2 Crowded areas, secluded areas and areas near subway car exits/stairs are the most
at-risk
The second transit-related question asks which areas within subway stations and subway
cars are the most at-risk for electronic device theft. It is hypothesized that crowded areas and
secluded areas both offer opportunities for thieves, as discussed in Chapter 2. Offenders could
also steal devices in areas where they can make a quick escape, such as near subway car doors or
platform/mezzanine exits. This assumption is developed from rational choice theory because
offenders mentally evaluate the benefits of stealing devices in certain areas, while also
calculating the costs of being seen or apprehended. In order to understand criminal decisions,
you have to focus on individual criminal events. For this study, the criminal event is electronic
device theft in MBTA subway stations.
Thieves have several options to choose from when stealing electronic devices from public
transit passengers, in general. Lyons et al. (2007) found that rail passengers use a variety of
electronic devices, such as mobile phones, handheld and laptop computers, and music players
when traveling in Great Britain. In another U.K. study surveying university students and part-
time working mothers, Line, Jain and Lyons (2011) found that electronic device use had become
“embedded into the participants’ everyday travel and communications.” The participants
depended on their devices to pass the time while traveling by bus. They placed calls, browsed the
internet, sent emails and texts, watched TV, listened to music and studied for class.

52
Similar patterns were observed with bus and train passengers in New Zealand (Russell et al.,
2011) and commuter train passengers in Tokyo (Ohmori & Harata, 2008). Axtell, Hislop and
Whittaker (2008) found that business passengers on a U.K. commuter train mostly reserved
electronic device use for work tasks (email, phone calls, texts) when cellular and WiFi signal
was free and available. These studies can be used to further hypothesize where in the subway
environment offenders steal devices from passengers.
Table 5-3. Top 24 subway stations with the most electronic device theft, 2003-2011
b. Top 24 subway stations
Following the 80-20 rule, the following crime script analysis and field observations focus
only on the subway stations where a majority of the electronic device theft was concentrated
during the study period.

53
Again, as illustrated in Figure 4-1, only 20 percent of the subway stations system-wide (24 of
120 stations) experienced 73.7 percent of all electronic device theft (859 of 1,163 thefts). Table
5-3 highlights these “top 24” stations, including their subway line color, number of thefts,
cumulative percent of all thefts and ridership rank.
The ridership rank was assigned by using 2007 MBTA average weekday ridership totals
and listing subway stations in descending order. The station with the highest ridership is ranked
#1. The station with the lowest ridership is ranked #120. This is outlined in Appendix B.
Most of the top 24 stations have moderate to low average weekday ridership, based on their
ridership rank. Only four of the six transfer stations (intersecting two subway lines) are on the
top 24 list. Both of these findings could lead to the assumption that a high concentration of
commuters is not an obvious predictor of electronic device theft in Boston. Finally, 11 of the top
stations are on the Red Line, eight are on the Orange Line, one is on the Blue Line and zero are
on the Green Line. This is important to consider when comparing with the results of the negative
binomial regression from Table 5-2.
c. Independent variables: Crime script analysis
Crime script analysis is used here to understand the steps offenders take during electronic
device theft in subways. The intent is to conceptualize the different tactics offenders use to steal
electronic devices. These tactics are identified as: snatch theft, pickpocket theft and robbery. As
defined in Chapter 3, snatch theft is a surprise measure that offenders use to steal electronic
devices from the hands, person or surrounding area of the victim. Pickpocket theft is different
because thieves use a stealth measure to steal a victim’s electronic device without being seen.

54
Finally, robbery is an overt tactic using force (or threatening to use force) in order to take an
electronic device. The reasoning behind using these three tactics is emphasized since both the
NYPD and British Transport Police have featured them in crime prevention-commuter
awareness videos (see Photo 5-1 and Photo 5-3, respectively). There have also been viral online
videos featuring cell phone and CCTV recordings of thieves using these tactics (see Photo 5-2
and Photo 5-4, respectively).
As a side note, it is interesting that it is difficult to differentiate between a real “caught on
tape” theft and a staged theft produced by police when watching these videos. It could be that the
non-police videos are staged as well. However, their questionable authenticity does not negate
the fact that police have confirmed similar tactics used by real thieves (personal communication,
October 5, 2013).

55
Source: NYPD, 2012
Photo 5-1. Stills from NYPD PSA video (example of snatch theft)
Source: Garcia, 2013
Photo 5-2. Stills from cell phone recording of thief stealing headphones from NYC man
(example of snatch theft)

56
Source: BTP, 2013
Photo 5-3. Stills from British Transport Police PSA video (example of pickpocket theft)
Source: NBC 4 New York, 2014
Photo 5-4. Still from CCTV video of man stealing a cell phone from sleeping NYC woman
(example of pickpocket theft)

57
d. Results: Crime script analysis
Although snatch theft, pickpocket theft and robbery all qualify as electronic device theft,
each would be categorized as a separate “criminal event” because each have different modi
operandi (Clarke & Cornish, 1985). Therefore, it is important to deconstruct the sequence of
rational choices that an offender (or co-offenders) can make during each offense type.
This section models its crime scripts based on the format used by Tompson and Chainey
(2011). This approach considers offenders (and any secondary individual who an offender
interacts with) to be cast members. Cast members engage in activities during various scenes of
electronic device theft. Scenes occur before, during and after a device is stolen. The criminal
event is divided into four scenes: preparation, pre-activity, activity and post-activity. During the
preparation scene, an offender thinks about and chooses the opportunity to steal an electronic
device. The pre-activity scene is when the offender takes the preparatory steps necessary to steal
the device. The theft of the device occurs during the activity scene, while the post-activity scene
is when the offender takes the steps to escape/exit the subway station and either use, sell or
dispose of the device. Next is a discussion explaining in detail the crime script for each type of
electronic device theft.

58
Table 5-4. Crime script for snatch theft – electronic device theft in MBTA subways
Snatch theft
The first step in the preparation scene is for the offender to decide whether or not to
commit electronic device theft at a subway station – after considering the benefits of stealing the
device compared to the costs of being apprehended (see Table 5-4). If the offender believes the
costs outweigh the benefits, it is assumed that he or she will not decide to go through with the
crime. However, if the offender believes that the benefits outweigh the costs, then he or she
moves on to the next step, which is selecting a subway station that is suitable to steal a device.
The offender may specifically choose a certain day and/or time to visit their selected station; or
the offender may simply decide to steal a device the next time he/she is at that station.

59
(Alternatively, an offender may decide upon a particular location within any subway station –
such as a mezzanine or platform. The offender could then steal a device based on the next
opportunity they have. This decision would also skip the sequence to the first step in the pre-
activity scene.)
When the offender arrives at their selected subway station, the pre-activity scene begins.
First, the offender selects a location within the subway station to steal the device.
Next, the offender chooses a target. This could be a certain victim who the offender deems
vulnerable. Vulnerability could be gauged as: distracted or preoccupied before the theft;
incapable of protecting themselves during the theft; or incapable of pursuing the offender after
the theft. The target could also be a certain electronic device, which the offender may deem as
fitting one of the CRAVED components (see Chapter 2). Once a device or victim is selected, the
offender checks the surrounding area for capable guardians. Guardians could be other
commuters, transit employees, transit police, CCTV or people recording using personal cameras.
If the offender believes guardians are nearby, then he or she may choose to disguise their
appearance or alter their clothing in order to not be detected later.
As part of their “BeAware” campaign in 2013, the British Transport Police (BTP)
released videos highlighting some of the various tactics a thief can use when snatching an
electronic gadget from a public transit passenger (BTP, 2013a). The three tactics were named:
the snatcher, the grabber, and the plucker. The video dramatizing “the snatcher” tactic shows a
woman grabbing a distracted female victim’s phone and escaping through the train doors right
before they close. In “the grabber video,” a man snatches an iPod that a woman places on her
chair while she handles her luggage and is not watching the device.

60
Lastly, in “the plucker” video, a male offender takes the phone of a man who has fallen asleep on
a train and has left the device in his lap.
The next step in the pre-activity scene, timing, is paramount to snatch thefts. An offender
chooses the most opportune time to snatch an electronic device from an unsuspecting victim.
Again, this could be when the victim is distracted or preoccupied. Timing could also be
considered when the theft occurs inside a subway car. MBTA Transit Police officers said that
many electronic device thefts occur when victims are seated next to open car doors (personal
communication, October 5, 2013). Offenders time their snatch thefts immediately before the
doors open or close when departing a station (see Photo 5-1; Photo 5-2). This ensures that the
surprised victim can’t follow once the device is snatched and the doors are shut. (This tactic is
also featured in the BTP awareness “the snatcher” video.) Offenders could also consider timing
during these instances: when a victim is using a device on an escalator or staircase; when a
victim is using a device in an elevator, when a victim is using a device when entering or exiting
the subway station. The last step in the pre-activity scene is when the offender evaluates his/her
escape options. An offender may plan the best way to exit an area before stealing a device, in
order to escape faster or not be noticed.
As described in the previous section, a snatch theft is when an offender takes a device
from a person’s hands, body or the area surrounding them. This is the activity scene.
Once the offender escapes the immediate area of the theft or proceeds to exit the subway
station, the post-activity scene begins. The offender may choose to change their clothing or alter
their appearance. When in a safe location free of the victim or guardians who witnessed the theft,
the offender may check the device for any security measures, such as lock screens, passwords or
anti-theft features.

61
Depending upon these security measures and the technical savvy of the offender, he or she will
decide how they plan to use the electronic device. The offender may choose to keep the device
for their own personal use, or give it to an acquaintance. Or they may decide to sell the device on
the black market. If this decision is made, then the crime script case expands to include any
individuals who the offender comes in contact with to facilitate the sale. This could be a broker,
someone who solicits thieves to bring them stolen devices in exchange for quick cash. In New
York City, these brokers are often owners or employees of local businesses, such as convenience
stores or barbershops (CBS 2 New York, 2011). The brokers then go on to sell the devices at a
higher price than what they bought them for, but lower than retail value. The offender may also
choose to eliminate the broker “middle man” and sell the stolen device directly to a willing
buyer.

62
Table 5-5. Crime script for pickpocket theft – electronic device theft in MBTA subways
Pickpocket theft
For pickpocket theft of an electronic device in a subway station, the entire preparation
scene and the beginning of the pre-activity scene are nearly the same as the snatch theft script
(see Table 5-5). After deciding to commit electronic device theft and choosing a subway station
and/or area within a station, the offender waits for the next opportunity to steal a CRAVE-able
device or target a vulnerable victim. Again, this theft occurs without guardian supervision.
The next step in the pre-activity scene is when an offender considers all of the pickpocket
tactics available to them at the moment. The BTP also released videos showing the various
techniques that pickpocket thieves use (BTP, 2013b). The six tactics, which featured pickpocket
thefts of personal items ranging from wallets to phones, were coined: the concealed hand, the
distraction, the diversion, the easy dip, the helpful stranger and the stall.

63
“The concealed hand” video shows a thief using a newspaper to cover his hand while standing
next to a woman in a subway car. He then reaches into her purse and walks away with an item.
“The distraction” video shows a female accomplice distracting a woman by asking her directions
in a busy subway station. A male pickpocket strolls behind the unsuspecting woman and quickly
reaches into her open purse to take something. In “the diversion” video, a woman acting as a
decoy drops change on the stairs of a transit station. As another woman bends down to help her
pick up the coins, a man walking up the stairs steals the wallet from the victim’s purse. “The
easy dip” video shows a male victim walking on a subway platform and waiting for an arriving
subway car (see Photo 5-3). A male thief follows behind him and reaches into his backpack, just
as he boards the train and the doors shut. The offender then walks away on the platform, while
the unknowing victim remains inside the subway car. In “the helpful stranger” video, a woman
using a subway station ATM machine is momentarily stopped by a female thief who tells her that
she has something on her jacket. As the woman looks down at her clothing, the thief takes the
phone out of her pocket. Then the victim thanks the stranger for noticing the stain and the thief
walks away with her device. Lastly, “the stall” video shows a co-ed pair of thieves working
together. The man walks in front of a male victim as both of them are approaching a turnstile at a
transit station. When his metro card does not work, the offender backs up away from the
turnstile. He pushes the male victim into the woman behind him – the female accomplice. As the
two collide, the woman takes the wallet out of the victim’s back pocket and leaves.
The BTP awareness videos included actor portrayals of pickpocket offenders and victims.
However, police PSA videos are not the only footage that can be used to demonstrate
pickpocketing tactics. As shown in Photo 5-4, CCTV cameras in New York City subway station
caught a man stealing an item from a sleeping woman’s coat.

64
This sneaky approach exemplifies the next two steps in the pre-activity scene – timing and
escape options. Not only does an offender have to choose the perfect tactic to use, they have to
make sure to act at the perfect time and have an escape plan. (Fortunately for the sleeping NYC
woman, nearby police officers witnessed the theft. They immediately approached and
apprehended the offender, as shown on video.)
The activity scene in a pickpocket theft is when the offender steals the device from either
the victim’s body or clothing (pocket, belt clip); or from their bag (purse, backpack, luggage).
The post-activity scene of a pickpocket theft is similar to those listed in the snatch theft script
above.

65
Table 5-6. Crime script for robbery – electronic device theft in MBTA subways
Robbery
The script for an electronic device theft in a subway station is different when the method
is robbery in comparison to snatch and pickpocket thefts (see Table 5-6). During the preparation
scene after an offender is motivated to steal the device and has selected a subway station, he or
she decides if their robbery offense will include a weapon or not. The offender may choose to
use a weapon because they already possess one, or they have easy access to one.
The steps of the pre-activity scene are the exact same as the snatch theft script. This
similarity is because a robber may decide to wear a disguise or alter their look in order to evade.
The activity scene for robbery is more aggressive than the previous scripts because the offender
must confront the victim in order to steal the electronic device.

66
This could be with a threatening demeanor, force, serious physical assault or with a weapon. The
intention of this confrontation is to intimidate or harm the victim into giving up the device. In
this instance, the robbery method is used to evoke fear in the victim.
The post-activity scene includes the escape from the area where the crime occurred and
from the subway system entirely. If a weapon was used, the offender hides, cleans or disposes of
it – in order to not be linked with it later. This scene may also include changing or removing a
disguise, if one was used. Finally, the offender may choose to use the stolen device themselves
or sell it to a broker or buyer, as described in the previous scripts.
e. Independent variables: Field observations
Since the above passenger behavior studies do not address exactly where riders use their
electronic devices within public transit modes; and the above crime scripts only offer
hypothetical situations of electronic device theft in subway stations – observations of MBTA
subway riders are used here to further address the research question. Again, only the top 24
stations with the most electronic device theft were observed (see Table 5-3). This approach
identifies risky commuter behaviors at three locations within these subway stations: the
mezzanine area, the platform area and in the subway car. The mezzanine is an entrance/exit area
where tickets are purchased and turnstiles are located (see Photo 5-5a; Photo 5-5b) – before
ascending or descending the stairs/escalator/elevator to the platform level in elevated or
underground stations, respectively. Newsstands, restrooms and food shops are typically located
here too (see Photo 5-5c). This is also where services are provided, such as police assistance and
customer information (see Photo 5-5d; Photo 5-5e). The platform is a boarding area near subway
trains in elevated, underground and above ground stations.

67
It is accessed by the street level in above ground stations; or by the mezzanine level in
underground and elevated stations (see Photo 5-5f). Subway cars are areas within a subway train
where commuters sit or stand while traveling between subway stations (see Photo 5-5g). It is
accessed by the platform level.

68
Photo 5-5a. Charlie ticket kiosk (subway train fare)
Photo 5-5b. Subway turnstile (entrance/exit) Photo 5-5c. Concessions stand
Photos 5-5a – 5-5c. Various features located in MBTA subway stations
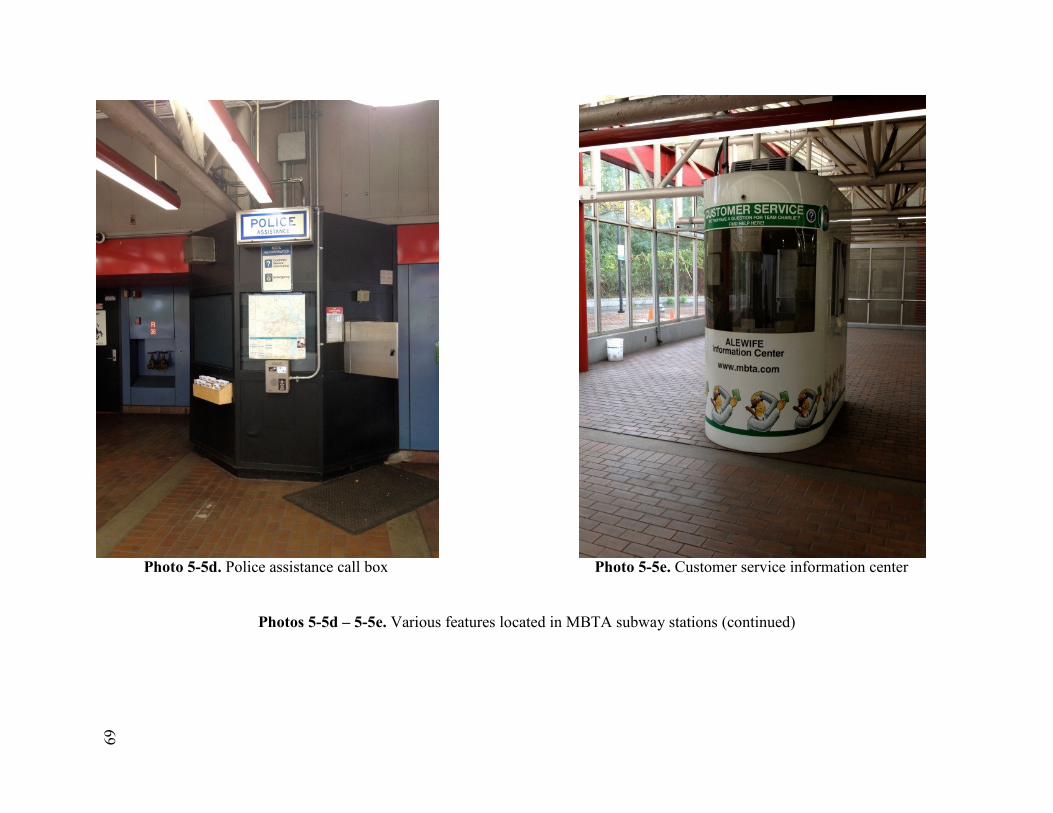
69
Photo 5-5d. Police assistance call box Photo 5-5e. Customer service information center
Photos 5-5d – 5-5e. Various features located in MBTA subway stations (continued)

70
Photo 5-5f. Platform staircase Photo 5-5g. Subway car interior
Photos 5-5f – 5-5g. Various features located in MBTA subway stations (continued)

71
Photo 5-6a. Transit Police officer using phone Photo 5-6b. Woman using phone while ordering
Photo 5-6c. People using devices when exiting mezzanine Photo 5-6d. Man using phone while waiting to purchase fare
Photos 5-6a – 5-6d. People using electronic devices in MBTA mezzanine areas

72
Photo 5-7a. Woman using phone on outdoor platform Photo 5-7b. People using phones on outdoor platform
Photo 5-7c. Men using devices on Photo 5-7d. Woman using video chat Photo 5-7e. Man using, then holding
underground platform on underground platform phone on underground platform
Photos 5-7a – 5-7e. People using electronic devices in MBTA platform areas

73
Photo 5-7f. Woman using phone on underground platform Photo 5-7g. Man using tablet on underground platform
Photo 5-7h. People listening to headphones on underground platform Photo 5-7i. People using devices on platform stairs
Photos 5-7f – 5-7i. People using electronic devices in MBTA platform areas (continued)

74
Photo 5-8a. People using phones and a laptop in a subway car Photo 5-8b. People using phones in a subway car
Photo 5-8c. Woman using phone in a subway car Photo 5-8d. Man using phone in a subway car
Photos 5-8a – 5-8d. People using electronic devices in MBTA subway cars

75
Photo 5-8e. Man using e-reader in a crowded subway car Photo 5-8f. People using devices in a crowded subway car
Photo 5-8g. People using devices in a subway car Photo 5-8h. People using devices in a subway car, near door
Photos 5-8e – 5-8h. People using electronic devices in MBTA subway cars (continued)

76
Source: Goldberg, 2011
Photo 5-9. Apple iPod advertisement on U.S. subway car
f. Results: Field observations
This section describes the electronic device use and risky behaviors of observed MBTA
subway passengers in mezzanine areas, platform areas and subway cars. A primary observation
for all of three areas is that people hold on to their devices even when not using them. For
example, passengers were observed standing, sitting or walking with their phone in hand, but not
looking at the device. This idle behavior puts the passenger in a vulnerable state because the
device is in full view. These passengers chose not to place their devices in their pocket, bag or
purse when not in use. Another finding across all observed areas is that when most people are
holding and using their device simultaneously, it is only with one hand. The other hand is either
carrying/securing a bag or personal item, or is left free. For example, when using a smartphone
with one hand, several passengers were seen scrolling and tapping the screen with their thumbs.
One female passenger was seen single-handedly using the speakerphone feature on her phone,
while holding the device a few inches in front of her face. When using two hands, most
passengers were observed to be typing on the screen or playing a game.

77
The last major observation is that some passengers listen to headphones while their electronic
devices are tucked inside a pocket or bag. This leaves their hands free, but can still alert others to
a device being used. This is important since white headphones are a tell-tale indicator that
someone is using a potentially expensive Apple device. Interestingly, Apple once featured their
white headphones in marketing posters located inside U.S. transit stations (see Photo 5-9).
Mezzanine areas
Individuals in the mezzanine area were seen using their devices at many of the 24 stations
visited. As shown in Photo 5-6a, a MBTA Transit Police officer uses his phone while in an
underground station. This officer was observed for several minutes looking at his device until a
person approached him to ask a question. Photo 5-6b shows a concession stand at the above-
ground JFK/UMass station. People mostly visited this vendor when waiting for a train to arrive
at the station. Here a woman checks her phone while the man in front of her purchases a soft
drink. Passengers were also observed using their devices while walking in, out and around the
mezzanine area, as shown in Photo 5-6c. A man in the background of the photo looks down at
his phone after exiting the turnstile at Back Bay station. Finally, Photo 5-6d shows passengers
purchasing Charlie Tickets in order to enter the subway system. While waiting for the people in
front of him to finish their transactions, a man glances down at his phone, which is in his right
hand (not shown).

78
Platform areas
Passengers were observed using various electronic devices in platform areas too – no
matter if the platform was underground, elevated or above ground. Photo 5-7a shows a woman
typing on the screen of a phone while sitting at the remote outdoor platform at Wellington
station. In Photo 5-7b, a group of individuals, who do not seem to know one another, stand on an
outdoor platform at Massachusetts Avenue station. During the few minutes that the group was
observed, all four passengers displayed their devices at least once. The photo clearly shows the
two men in the foreground looking down to use their phones – one man with one hand and the
other man with two hands. Photo 5-7c shows a group of three male friends talking with each
other while standing on the underground platform at Central station. One of the men is seen
checking his phone, while another prominently displays his camera, which hangs around his
neck.
Photo 5-7d shows several people standing or walking on the narrow underground Park
Street station platform. In the background, a man against the wall talks on his phone, while the
woman next to him looks down at hers. Both use their devices, unfazed, as people quickly walk
by in front of them at the busy downtown transfer station. This kind of behavior is what thieves
look for, said a male MBTA employee. “When a station is packed, that is when most of the
crime activity is happening” (personal communication, October 5, 2013). Nearby in the
foreground, a woman uses her device to video chat. She smiles as she holds the device in front of
her with one hand and talks into the microphone on her headphones. On the elevated platform at
Fields Corner station, a teenage boy is observed using his phone while waiting for the train to
arrive. As the train pulls into the station, the teen walks toward the subway car without securing
his phone. Instead, choosing to leave it exposed in his hand, as shown in Photo 5-7e.

79
Similar behavior was witnessed by an older woman standing at the end of the Jackson Square
underground platform. While waiting for her train, she uses both hands to view her phone.
Although most passengers were observed using smartphones and cell phones, some were seen
using other electronic devices. At the Harvard station, a man in Photo 5-7g swipes his finger
across the screen of a tablet computer. He uses the device while waiting for the train to arrive at
the underground station. Photo 5-7h and Photo 5-7i both show people listening to headphones
while waiting and walking at underground platforms.
Subway cars
Similar patterns of electronic device use were observed from passengers traveling inside
subway cars. Photo 5-8a shows three women using their devices. One woman sits and checks her
Android phone, while another woman stands next to the door and types on her phone. The last
woman sits across the car (also next to a door) looking down and typing on her Apple Mac
laptop computer. Law enforcement officials discourage such electronic device use when inside a
subway car. “You have to be smart, if people see an opportunity – times are hard. Don’t walk
around with your computer out. Just be safe,” said a female Boston PD officer (personal
communication, October 5, 2013).
This common sense thought process did not stop five subway passengers from using their
phones in a crowded subway car, as shown in Photo 5-8b. Each of them sat next to each other
and used or listened to their devices, even while the doors opened at a stop. In Photo 5-8c, a
woman is seen multitasking while typing on her phone. Since one hand is holding the device and
the other is holding her bag, she places her coffee cup in her mouth in order to continue typing.
The man sitting next to her closes his eyes while listening to large headphones. Photo 5-8d also
shows a passenger doing several tasks at once while sitting in a subway car.

80
Not only does the man in the photo listen to his headphones while using one hand to tap on the
screen, he uses the other hand to pet his small dog, which is wrapped around his body in a cloth
carrier.
Crowded subway car conditions did not seem to bother several observed passengers, as
many continued to use their devices even as space became limited. Photo 5-8e shows a man
reading his e-reader while holding on to the railing inside a moving subway car. Photo 5-8f
shows an aerial view of a subway car packed with passengers. In the picture, one woman stands
and reads an e-reader, while the man next to her uses his phone. Both do so while maintaining
their balance on the moving train. Photo 5-8g shows two people sitting next to each other in a
moderately crowded subway car that is traveling between stations. As the woman talks on the
phone, the man seated next to her intently plays a game on his device, while also listening to
headphones. Lastly, Photo 5-8h shows three people using their devices while in close proximity
to an open subway car door.
g. Discussion: Summary of key findings and linking theory
“There is just something about people wanting to use their phones on the subway,” said a
male MBTA Transit Police officer (personal communication, January 10, 2012). People are so
interested in their devices that they tune out what is going on around them, he said, adding that it
has become second nature for people to use their devices to “pass the time” while traveling on
the subway. This trait is what makes passengers susceptible to victimization. They are often too
distracted to pay attention to their surroundings.
One reason commuters may not be aware that they are engaging in risky behavior by
using their devices in subways because many believe their electronic devices, especially their
cell phones, provide a sense of security (Tennakoon & Taras, 2012).

81
It also seems the decision to sit or stand next to a subway car doorway is related to concept of
“personal space” – the desire to not sit or stand directly next to another person. By sitting at an
end seat next to a door, it only allows one person to sit next to you in the middle seat, if the train
becomes crowded. The other side of the seat is often blocked with a partition. The same
reasoning is assumed by standing next to a door. Passengers may choose to do this because the
area next to the door is away from others. This is also a prime area because it is near the exit,
which allows for a quicker exit upon arrival at your destination. However, few passengers may
realize that they put themselves at risk for snatch theft by sitting or standing near a subway car
door and using an electronic device.
This research question is linked to rational choice theory and the “criminal event”
decisions of offenders. The risky behaviors highlighted in the field observations allow offenders
to commit the snatch, pickpocket and robbery thefts, which are outlined in crime scripts section.
Therefore, the field photos and notes further expand the crime script analyses mentioned for
electronic device theft in MBTA subway stations. It is concluded that mezzanines, platforms and
subway cars can all be considered risky areas for electronic device theft, if passengers are
engaging in certain risky behaviors within these areas that attracts offenders. These observations
support the original hypothesis.
This section serves as “potential perpetrator scripts” that describe the general
hypothetical sequences that an offender could engage in when committing different types of
electronic device thefts (Borrion, 2013). Crime scripts are useful because it is important to
understand the steps of a crime from beginning to end, which can potentially be used to develop
crime prevention measures by law enforcement.

82
Additionally, observing passenger behavior at the top 24 stations is consistent with advice to
become a “local crime expert” as it pertains to electronic device theft in MBTA subway stations
(Clarke & Eck, 2005).

83
5.3 Research Question 1.3
RQ 1.3 How has the introduction of phone and WiFi service on subway lines influenced
electronic device theft?
a. Hypothesis
H 1.3 Thefts will increase on subway lines after phone and WiFi service are introduced
The third transit-related question considers the influence of phone and WiFi service. A
WiFi hotspot and an area where there is cellular signal could both be considered nodes, as crime
pattern theory suggests. Routine activity theory also relates to this question because motivated
offenders looking to steal devices would occupy specific places where WiFi and phone service
were available. It is therefore hypothesized that electronic device thefts will increase at stations
once phone and WiFi service are introduced. Since “apple picking” relies on people using (or
displaying) their smartphones to connect to the Internet and/or make phone calls, it is assumed
that crimes will spike at subway stations where that service is available. This research question is
unique, as few studies have explored if WiFi or cell tower accessibility increases thefts of
devices in a given area. Additionally, 85 percent of an individual’s daily usage of their
smartphone, for example, relies on Internet or cellular tower connectivity (Fetto, 2013). Of this,
39 percent is devoted to checking e-mail, web surfing and social media – all of which require an
Internet or phone connection; as well as 26 percent spent talking on the phone and 20 percent
spent texting – which require only a cellular signal.

84
Figure 5-1. Histogram: Cell phone theft frequency and station count, 2003-2011

85
Table 5-7. Descriptives for cell phone thefts at all subway stations (n = 814)
Source Variable Description Minimum Maximum Mean SD
MBTA Cell Thefts Number of thefts (per station) 0.00 64.00 6.78 11.96
(Larimore RMS)
Figure 5-2. Cell phone theft by MBTA subway line (n= 814)
86
b. Variables
Dependent variable
To address the research question about whether or not phone and WiFi service impact
electronic device theft in subway stations, a specific electronic device was selected. Cell phones
(“dumbphones” and smartphones) were selected because these devices regularly rely upon both
phone and WiFi signal. This device type was also selected because many people carry cell
phones with them each day. Therefore, the dependent variable (for this research question only) is
the number of cell phone thefts per station – during the study period of August 2003 to
December 2011 (see Table 5-7; n= 814, mean= 6.78, SD= 11.96).
Of the 120 subway stations, cell phone thefts occurred at 83 stations, while 37 stations
had zero thefts – as shown in Figure 5-1. This is similar to the histogram in Chapter 4 (see Figure
4-1), since both are positively skewed J-curves that follow the 80-20 rule. Again, this illustrates
that thefts are concentrated at a few stations. For this histogram, 79 percent of all cell phone
thefts (648 of 814) occurred at 22 percent of the subway stations (27 of 120).
Instead of focusing on the total 814 cell phone thefts in the entire subway system, the
focus here is broken down to individual subway lines. This is because each subway line can
serve as a separate environment (various track length, number of stations, grade level of
stations). As shown in Figure 5-2, a majority of the cell phone thefts occurred at stations on the
Orange Line, followed by the Red, Green and Blue lines.
Once it was determined that cell phone theft would be examined by subway line, the next
task was to create a rate of the number of cell phone thefts based on the number of opportunities
there are to steal cell phones on each subway line. This process took several steps, which are
outlined below and shown in Table 5-8.

87
First, U.S. mobile cellular subscriptions were collected for each year of the study period,
2003-2011. These totals were provided in a dataset by the International Telecommunication
Union (ITT, 2014). The next step was to compare these national subscription totals with U.S.
population data, in order to create a percentage. To do this, U.S. census population totals were
collected for each year of the study period (U.S. Census Bureau, 2014). Then for each year, the
U.S. subscription total was divided by the U.S. population total. This created an estimated
national percentage of Americans with cell phones for each year.
The next step was to take that yearly percentage and multiply it by the average weekday
ridership total for each subway line during each year. This created an estimated number of
subway passengers with cell phones for each year on each subway line.
The final step was to divide the number of cell phone thefts by the estimated number of
subway passengers with cell phones. This final calculation was multiplied by 1,000 to provide
the rate of the number of cell phone thefts based on the number of available cell phones on each
subway line, during each year.
These yearly rates were used in the before/after analyses to determine if phone and WiFi
service influenced cell phone theft on subway lines (see results in following section).

88
December 2007 – Downtown Stations adds cell service
December 2008 – Free WiFi added at all stations and in cars
March 2010 – Orange Line adds cell service
May 2010 – Red Line adds cell service
December 2011 – Green and Blue lines add cell service
Figure 5-3a. Time series scatter plot: Electronic device thefts at MBTA subways and cell phone/WiFi coverage introduction dates

89
October 2005 – Apple releases 5th generation iPod that plays music, photos and videos
September 2006 – Research in Motion (RIM) releases Blackberry Pearl smartphone
June 2007 – Apple releases 1st generation iPhone smartphone
November 2007 – Amazon releases Kindle e-reader
October 2008 – T-Mobile releases the G1, the first Android smartphone
Figure 5-3b. Time series scatter plot: Electronic device thefts and release dates of popular devices, Aug. 2003 - Dec 2011

90
Independent variables
The independent variables are the dates that phone service and WiFi were first introduced
to subway lines. The MBTA subway system was a pioneer in bringing phone coverage to its
subway stations and cars. In December 2007, subway stations located in the downtown core
added cell service. Free WiFi service was introduced in December 2008 to a majority of subway
stations and cars.
Although only the first introduction dates are used for this analysis, it is important to note
that the entire Orange Line received cell phone service by March 2010, while the Red Line did in
May 2010 and the Green and Blue lines did in December 2011. Figure 5-3a is a time series
scatter plot of electronic device thefts and all of the dates phone and WiFi service were
introduced on various MBTA subway lines and stations. Time series scatter plots visually
represent changes in the dependent variable over time, before and after an intervention. This
approach is a sufficient way to identify patterns (Albright, Winston, & Zappe, 2011). The value
of the dependent variable is along the vertical axis, while the period of time (in months) is along
the horizontal axis. Overall, this figure shows both an upward trend and cycle (as described in
Chapter 4) between the beginning of the study period in 2003 and the end of the study period in
2011.
The dates that phone service and WiFi were first introduced to subway lines are marked
in yellow on the horizontal axis in Figure 5-3a. Phone and WiFi services were introduced during
winter and spring months (December and March/May, respectively). These months appear to
have had less electronic device theft system-wide.
The same times series scatter plot is used when overlapping the release dates of popular
electronic devices during the study period (see Figure 5-3b).

91
For most of the years, the highest spike of electronic device theft occurred during the fall months
of September, October or November. This is interesting because many manufactures released
popular devices during the fall, including the 5th generation iPod in October 2005; the
Blackberry Pearl in September 2006; the Amazon Kindle e-reader in November 2007; and the
first Android smartphone, the G1, in October 2008. It is important to note that one of the first
phones to feature both Internet capability and a full keyboard was the T-Mobile Sidekick, which
was released in 2002. Although this release date was before the beginning of the study period, it
can be assumed that the popularity of this phone may have driven electronic device theft in the
earlier years. In fact, the MBTA Transit Police once distributed a PSA flier specific to Sidekick
theft (see Photo 5-10).
Photo 5-10. Sidekick theft awareness, MBTA Transit Police flier

92
2003 2004 2005 2006 2007 2008 2009 2010 2011
RED LINE
Number of cell phone thefts 11 23 29 34 23 43 49 39 46
Average weekday ridership 214,100 210,500 202,250 213,700 226,417 242,926 245,457 241,603 258,182
Estimated number of passengers with cell phones 118,463 132,760 139,300 164,322 187,167 208,547 219,292 222,694 247,160
Rate: Cell phone thefts / # of passengers with phones 0.09 0.17 0.21 0.21 0.12 0.21 0.22 0.18 0.19
ORANGE LINE
Number of cell phone thefts 8 27 32 45 37 61 45 53 72
Average weekday ridership 155,750 154,350 152,800 161,350 216,183 182,071 183,318 184,961 190,939
Estimated number of passengers with cell phones 86,178 97,346 105,241 124,068 178,707 156,304 163,777 170,485 182,788
Rate: Cell phone thefts / # of passengers with phones 0.09 0.28 0.30 0.36 0.21 0.39 0.27 0.31 0.39
GREEN LINE
Number of cell phone thefts 3 6 4 8 11 11 9 20 17
Average weekday ridership 217,750 212,550 192,700 202,400 237,410 250,219 234,513 236,096 219,513
Estimated number of passengers with cell phones 120,483 134,052 132,722 155,633 196,254 214,808 209,514 217,618 210,142
Rate: Cell phone thefts / # of passengers with phones 0.02 0.04 0.03 0.05 0.06 0.05 0.04 0.09 0.08
BLUE LINE
Number of cell phone thefts 3 7 2 3 3 12 2 4 12
Average weekday ridership 55,900 55,600 56,750 60,950 50,515 58,421 56,074 57,273 58,004
Estimated number of passengers with cell phones 30,930 35,066 39,087 46,867 41,758 50,153 50,097 52,790 55,528
Rate: Cell phone thefts / # of passengers with phones 0.10 0.20 0.05 0.06 0.07 0.24 0.04 0.08 0.22
Number of U.S. cellular subscriptions (millions) 160.64 184.82 203.70 229.60 249.30 261.30 274.28 285.12 298.29
U.S. population (millions) 290.33 293.05 295.75 298.59 301.58 304.37 307.01 309.33 311.59
U.S. cellular subscriptions / U.S. population 55.33% 63.07% 68.88% 76.89% 82.66% 85.85% 89.34% 92.17% 95.73%
* U.S. population totals rounded up for table. Exact totals were used for calculations.
Table 5-8. Cell phone thefts and ridership in MBTA subways, by cellular subscriptions and population
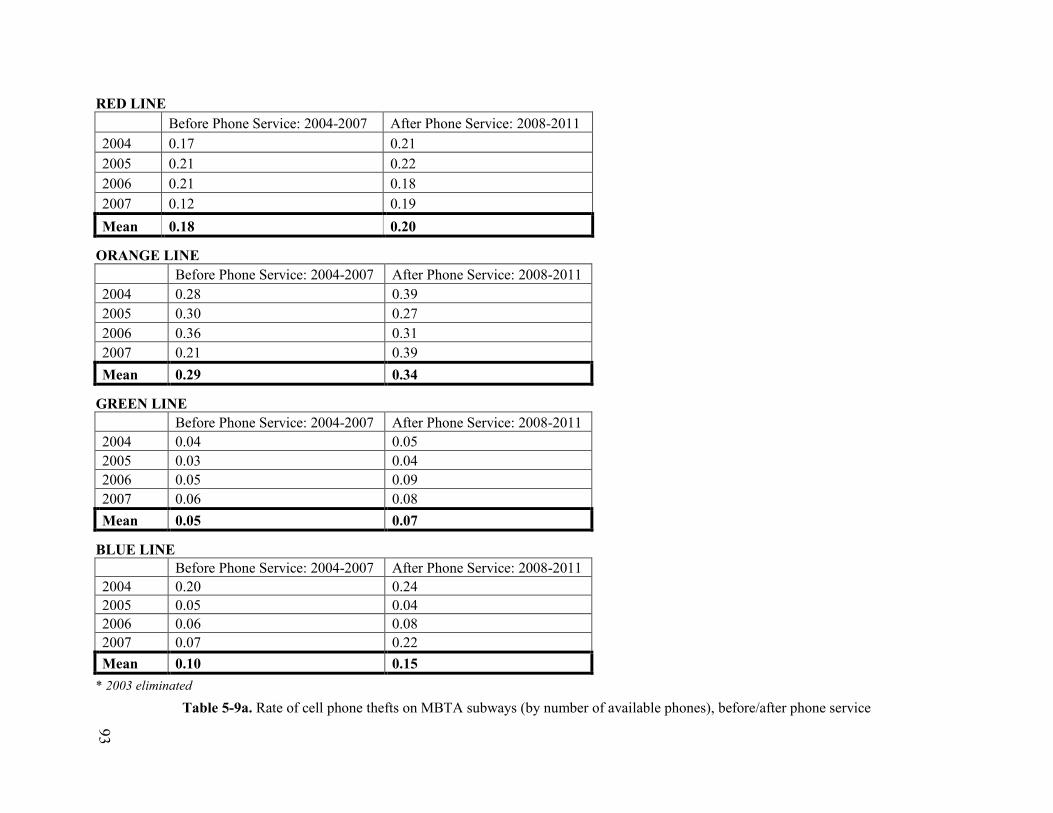
93
RED LINE
Before Phone Service: 2004-2007 After Phone Service: 2008-2011
2004 0.17 0.21
2005 0.21 0.22
2006 0.21 0.18
2007 0.12 0.19
Mean 0.18 0.20
ORANGE LINE
Before Phone Service: 2004-2007 After Phone Service: 2008-2011
2004 0.28 0.39
2005 0.30 0.27
2006 0.36 0.31
2007 0.21 0.39
Mean 0.29 0.34
GREEN LINE
Before Phone Service: 2004-2007 After Phone Service: 2008-2011
2004 0.04 0.05
2005 0.03 0.04
2006 0.05 0.09
2007 0.06 0.08
Mean 0.05 0.07
BLUE LINE
Before Phone Service: 2004-2007 After Phone Service: 2008-2011
2004 0.20 0.24
2005 0.05 0.04
2006 0.06 0.08
2007 0.07 0.22
Mean 0.10 0.15
* 2003 eliminated
Table 5-9a. Rate of cell phone thefts on MBTA subways (by number of available phones), before/after phone service

94
RED LINE
Before WiFi Service: 2006-2008 After WiFi Service: 2009-2011
2006 0.21 0.22
2007 0.12 0.18
2008 0.21 0.19
Mean 0.18 0.20
ORANGE LINE
Before WiFi Service: 2006-2008 After WiFi Service: 2009-2011
2006 0.36 0.27
2007 0.21 0.31
2008 0.39 0.39
Mean 0.32 0.32
GREEN LINE
Before WiFi Service: 2006-2008 After WiFi Service: 2009-2011
2006 0.05 0.04
2007 0.06 0.09
2008 0.05 0.08
Mean 0.05 0.07
BLUE LINE
Before WiFi Service: 2006-2008 After WiFi Service: 2009-2011
2006 0.06 0.04
207 0.07 0.08
2008 0.24 0.22
Mean 0.12 0.11
* Years 2003-2005 eliminated
Table 5-9b. Rate of cell phone thefts on MBTA subways (by number of available phones), before/after WiFi service

95
Table 5-10a. Sign test results: Mean rate of cell phone thefts on MBTA subways (by number of available devices), before/after phone service
Before Phone Service:
2004-2007
After Phone Service:
2008-2011
Mean Difference
(sign)
Model Significance
(p=)
Red Line 0.18 0.20 +
0.125
Orange Line 0.29 0.34 +
Green Line 0.05 0.07 +
Blue Line 0.10 0.15 +
(2003 eliminated)
+ positive difference
- negative difference
= no difference
* p < 0.05
Table 5-10b. Sign test results: Mean rate of cell phone thefts on MBTA subways (by number of available devices), before/after WiFi service
Before WiFi Service:
2006-2008
After WiFi Service:
2009-2011
Mean Difference
(sign)
Model Significance
(p=)
Red Line 0.18 0.20 +
1.000 Orange Line 0.32 0.32 =
Green Line 0.05 0.07 +
Blue Line 0.12 0.11 -
(2003-2005 eliminated)
+ positive difference
- negative difference
= no difference
* p < 0.05
96
c. Results: Sign tests
By examining the rate of cell phones that are stolen on different subway lines before and
after each intervention (based on the estimated number of available phones), more will be
learned about whether the crime actually increased due to riders’ having the option to connect
their devices; and offenders utilizing the opportunity of more devices being displayed and used.
The reason the rate is considered is because it is important to see if the number of thefts were
increasing simply because there were more devices to steal, or not.
The first step in the analysis organized the rates in groups of years before and after
phone/WiFi service were introduced to each subway line (see Table 5-9a; Table 5-9b). It is
important to make the before and after groups equal because it allows for proper comparison.
Therefore, 2003 was eliminated in the phone service analysis in order have four years in the
before groups and four years in the after groups. The same was done for the WiFi service
analysis, with years 2003-2005 eliminated to have three years in each group.
Next, the mean of each group was calculated, as shown in bold in Table 5-9a and Table
5-9b. Examining means is a standardized way to compare across distributions and estimate
central tendency. The mean here represents the sum of rates for each year, divided by the number
of years. The final step was to run sign tests comparing the before/after mean rates described
above.
Two models were created, one for before/after phone service (see Table 5-10a); and one
for before/after WiFi service (see Table 5-10b). For each model, the mean rates of each subway
line were included. The mean difference for each line is shown with a positive, negative or equal
sign – indicating the mean increased, decreased or stayed the same. Each table also shows the
significance value of the sign test.

97
Although the mean difference before and after phone service increased on each subway line, the
model is not significant as a whole, as shown in Table 5-10a. There is more variation in the mean
differences for the before/after analysis of WiFi service, as shown in Table 5-10b. The means for
the Red and Green lines both increased, while the Blue Line mean decreased and the Orange
Line mean stayed the same. However, when taken together, the model is not significant.
d. Discussion: Summary of key findings and linking theory
The results of the sign test models before/after phone service and WiFi service accept the
null hypothesis. This finding is surprising, as one would think increased use of electronic devices
due to phone and WiFi service access and the increase in electronic device theft would be
related. Even though the model results do not support the hypothesis, it could be further assumed
that access to phone and WiFi service can cause certain stations to be crime radiators (Bowers,
2013), similar to the way cellular and wireless signals radiate from a tower or router. The notion
of some subway stations serving as beacons for electronic device theft coincides with the risky
facility concept. However, since the sign test results do not align with this hypothesis, future
research – as discussed in Chapter 8 – should revisit this.
This research question does have a deeper underlying importance, though. It directly
involves the evolution of electronic devices from the beginning of the study period in 2003 and
the end in 2011. Since smartphones have become popular, the theft of other devices such as MP3
players, laptop computers, CD players, digital cameras, video games and DVD players have
decreased. This is because smartphones can do all of the same functions in one small device.
Now, as new smartphones are released, people are more likely to display/use them (on the
subway) because it is fashionable to own the “next big thing” on the market.

98
This “showcase” behavior then alerts offenders to all of the available targets to choose from. And
as the “phablet” (phone meets tablet) trend continues to create larger-sized smartphones, such as
the iPhone 6 plus and Samsung Galaxy Note, the targets are becoming easier to notice.
Today, almost everyone owns an electronic device, especially a cell phone or
smartphone. This relates to the literature about product life cycles and the vulnerability of stolen
products (Clarke, 1999; Guerette & Clarke, 2003; Thompson, 2014). Electronic devices never
quite reach a saturation point now because there is always a new device just around the corner –
with new, cutting-edge features. This shorter cycle starts the CRAVED and hot products process
all over every time a new release date is announced. This makes electronic devices different than
other stolen products because they are always in demand (Mailley et al., 2008; Home Office,
2014).
Yet, even though electronic devices have become more technologically advanced over
the years, many of the hot products and CRAVED aspects still apply – no matter if the device is
a bulky Walkman or an iPhone with a kill-switch feature. The unique environment of the subway
system still presents opportunities for theft to occur, no matter the device or year. This relates
back to the core premise of this dissertation: the study of hot products within a hot environment.

99
Chapter 6: SPACE-RELATED RESEARCH QUESTION
6.1 Research Question 2.1
RQ 2.1 How does electronic device theft in the subway system compare to
surface-level property crimes, larcenies and robberies near stations?
a. Hypothesis
H 2.1 Thefts will increase at stations with higher surface-level robbery, larceny
and property crimes near stations.
This space-related research question asks how electronic device theft in the MBTA
subway system compares to district crime rates near subway stations, as reported by the Boston
Police Department. In Boston, precincts are called districts. It is hypothesized that thefts will
increase at stations with higher surface-level robbery, larceny and property crimes. This relates
to all three environmental criminology theories – crime pattern, routine activities and rational
choice – because surface-level offenders may use the subway system when travelling to and from
incident sites, which could also lead to finding opportunities to steal electronic devices within the
subway environment as well.
As stated in previous chapters, past studies have found that certain crimes increase at
subway stations situated in high-crime areas (Richards & Hoel, 1980; Pearlstein & Wachs, 1982;
Falanga, 1988; DeGeneste & Sullivan, 1994; La Vigne, 1996a, 1996b; Block & Block, 2000).
This hypothesis, however, focuses solely on the concept of subway stations serving as “crime
absorbers.” Bowers (2014) explains that a facility can absorb the risk of crime from its external
environment. Since offenders have already chosen to look for opportunities within a suitable
area, this attraction makes it likely that facilities within that area will become suitable targets too.
Subway stations can qualify as absorbing facilities – whether the selection is intentional because
offenders are already in the area, or unintentional because they are already using public transit.

100
Table 6-1. Descriptives for surface-level police district crime rates (n = 120 subway stations)
Source Variable Description Minimum Maximum Mean SD
Boston PD Property Crime Total number of property crimes 238.00 4950.00 2310.60 1294.917
(2007) Larceny Total number of larcenies 172.00 4009.00 1729.69 1075.657
Robbery Total number of robberies 6.00 436.00 160.62 129.621

101
Table 6-2. Negative binomial regression for 2003-2011 electronic device thefts at MBTA
subway stations and surface-level police district crime rates (n = 120 subway stations)
Variable B (SE) IRR Z
Property crime 0.0015 (0.0007) 1.0015* 1.93
Larceny - 0.0018 (0.0008) 0.9981* - 2.12
Robbery 0.0034 (0.0020) 1.0034 1.70
*P < 0.05
Pseudo R2 = .0190
Log likelihood = -364.370
Likelihood ratio chi-square = 14.10
Cronbach’s = 0.79

102
b. Independent variables
The independent variables are referred to as property crime, larceny and robbery (see
Table 6-1). The number of property crimes in each Boston Police district with at least one
subway station ranged from 238 to 4,950 (mean= 2310.60, SD= 1294.917). The number of
larcenies in each Boston Police district ranged from 172 to 4,009 (mean= 1729.69, SD=
1075.657). The number of robberies in each Boston Police district ranged from 6 to 436 (mean=
160.62, SD= 129.621).
Crime definitions are outlined in the General Laws of Massachusetts (Massachusetts
Legislature, 2014). Massachusetts general criminal law defines larceny as stealing property,
whether such property is or is not in the person’s possession. Robbery is defined as the stealing
or taking of a person’s property while disguised and armed or unarmed. Both types of robbery
were included in the calculations for surface-level crime rates. Finally, property crimes in
general are all offenses involving the theft of property, including burglary, larceny and motor
vehicle theft.
c. Results: Negative binomial regression
The results of the negative binomial regression for predicting electronic device theft in
Boston subway stations from surface-level police district crime rates are displayed in Table 6-2.
The model is significant (p<.01), meaning the predictors are positively related to electronic
device theft in subways when taken together. This model has a better fit since the log-likelihood
(-364.370) is higher than the base model (-371.41806). The independent variables explain 1.9
percent of the variance of electronic device theft. This is likely because this approach only
considers the external crime factors that contribute to internal electronic device theft.

103
Of the three independent variables, only property crime and larceny are significant with p-values
less than 0.05. The robbery variable is not significant with a p-value greater than 0.05.
Again, as with the negative binomial regression model in Chapter 5, IRR values are used
to see the percentage change in the risk of electronic device theft for each unit increase in the
independent variable. The IRR value for the property crime is greater than 1, which means that
on average, for every additional property crime at the surface level, electronic device theft in that
police district’s subway station(s) increases by .0015. The larceny variable has an IRR value that
is less than 0, indicating that the number of larcenies at the surface level do not increase the
number of electronic device theft at subway stations. Instead, for every additional larceny above
ground, electronic device theft decreases by .9981 at subway stations within the district.
d. Discussion: Summary of key findings and linking theory
The model results do not fully support the hypothesis since only one of the three
predictors are positively related. Only surface-level property crime has a positive relationship
with electronic device theft at subway stations within the same police district. This could mean
that stations within high-property crime districts absorb the surface-level criminal activity
(Bowers, 2014), thus increasing electronic device theft at stations. Further comparison of “above
vs. below” electronic device theft is needed to study this more closely, however (Newton, et al.,
2014a). This finding does support the idea that the subway system environment serves as a
physical facilitator (Clarke & Eck, 2005) to help offenders steal electronic devices. The thefts
then become incidental offenses of using public transit to travel through the city.

104
The presence of larcenies above ground decrease electronic device theft at stations. This
could be because subway riders take more precautions when in districts known for larcenies.
They may be more careful with their electronic devices when at stations within the district.
This could mean that certain external environments already deemed “risky” by potential victims
actually provide a deterrent buffer zone around facilities within the areas. This finding would add
on to the crime radiators vs. crime absorbers framework developed by Bowers (2014).

105
Chapter 7: TIME-RELATED RESEARCH QUESTION
7.1 Research Question 3.1
RQ 3.1 Does the time of day, week or year influence electronic device theft at
subway stations?
a. Hypothesis
H 3.1 Thefts will increase during time periods when stations are the most busy
The only time-related question focuses on the temporal patterns of electronic device theft
in Boston subways. It is hypothesized that thefts will increase when stations are the most
busy/active:
During weekdays – due to the work force and school children using public transit
During rush hour – due to peak morning and afternoon travel
After school dismissal times – due to school children using public transit to return home
This assumption also suggests that electronic device thefts will decrease during summer and
winter months due to fewer workers and school children using public transit because of vacation
breaks. This hypothesis is rooted in routine activity theory.
Past criminologists have focused on the temporal distribution of transit crime. Smith
(1986) found that larceny theft on subways was mostly concentrated on weekdays during the
afternoon and evening. Others found that rush hour was when a majority of thefts occurred on
rail systems (Pearlstein and Wachs, 1982; Smith, 1986; Jochelson, 1994).
In order to examine these hypotheses, temporal distributions of electronic device theft in
MBTA subways were organized into the following: hourly patterns, daily patterns, monthly
patterns and yearly patterns.

106
Figure 7-1. Hourly patterns of electronic device theft at MBTA subway stations, 2003-2011

107
Figure 7-2. Contour chart representing hourly and daily patterns of electronic device theft at MBTA subway stations, 2003-2011

108
b. Results: Descriptives tables, bar charts, line graphs, contour chart
Hourly patterns
The MBTA subway system does not operate 24 hours a day (MBTA 2014a; MBTA
2014b). The first trains depart from the end-of-line stations at approximately 5:00am on
weekdays; and between 4:45am-6:15am on Saturdays and Sundays. As of March 28, 2014, the
last trains to depart from downtown stations leave at approximately 1:00am on Sunday through
Thursday nights and approximately 2:30am on Friday and Saturday nights. The MBTA breaks
down the subway schedule into the following time periods:
Morning: 5:00am – 6:30am
AM Rush Hour: 6:30am – 9:00am
Midday: 9:00am – 3:30pm
PM Rush Hour: 3:30pm – 6:30pm
Evening: 6:30pm – 8:00pm
Late Night: 8:00pm – CLOSE
This study identifies 5:00am as the start of the day for all crimes that can occur within the
MBTA subway system. This time was chosen (instead of midnight) because it is the first hour of
operation during weekdays; and because weekday ridership is higher than weekend ridership.
Figure 7-1 shows the hourly patterns of electronic device theft at subway stations during
the study period. As noted by the selected section, crime is concentrated in the middle of the
“crime day” between 2:00pm-8:00pm.
Figure 7-2 is a contour chart of both the hourly and daily patterns of electronic device
theft in subway stations (see Appendix C for exact values represented in a crosstab table).
Similar to Figure 7-1, thefts are concentrated in the middle of the day between 2:00pm-8:00pm,
as shown in red, orange and yellow. The green and blue quadrants represent early morning and
late night hours when fewer thefts occurred. This most likely is because the subway system is
closed between 1:00am-5:00am.

109
On average, the peak time for electronic device theft in subway stations occurred around
4:00-5:00pm on Mondays and Tuesdays, as shown in red in Figure 7-2. During this time frame,
about 20-25 thefts, on average, occurred. As the week progresses, the hot spot splits into two
different time periods on Wednesdays – with spikes around 3:00pm-4:00pm and then again
between 6:00pm-7:00pm. By Thursday and Friday, thefts were more moderate during the
afternoon hours with 10 to 20 occurring each hour. Fewer thefts occurred during the afternoon
hours on Saturdays and Sundays.
Table 7-1 shows the counts and percentages of electronic device theft throughout the day.
It also includes summary statistics highlighting specific temporal trends. When examining
robberies, Felson and Paulson (2003) calculated what they called the 5-to-5 share in order to
determine the percentage of crimes that took place before, during and after the traditional work
day, 5:00am-5:00pm. This study will take a different approach. Since MBTA subways are part of
a public transit system, the AM rush hour and PM rush hour shares are calculated to determine
the percentage of electronic device thefts that occur during peak travel times. Both follow the
rush hour time periods indicated above by the MBTA: AM rush hour is between 6:30am-9:00am;
PM rush hour is between 6:30pm-8:00pm.
About 40 electronic device thefts make up the AM rush hour share, which is about 3.4
percent of all thefts. The PM rush hour share is much larger, with about 147 thefts equaling 12.6
percent of all thefts. This finding suggests that electronic device theft is more problematic in the
afternoon than it is in the morning.

110
Table 7-1. Counts and percentages; and summary indicators for electronic device theft
at MBTA subway stations, 2003-2011
High school dismissal times are also considered for this study. High school dismissal
times in the Boston area range from 1:45pm-3:55pm Monday-Thursday. Several high schools
have early dismissal on Fridays, some as early as 11:25am (Boston Public Schools, 2014a).
Given this, the high school dismissal share is calculated as all thefts that occur between 11:00am-
5:00pm. This allows for travel and potential offending time both before and after dismissals
throughout the week.
Given this calculation, the high school dismissal share consists of 475 thefts – or 40.8
percent of all thefts in the study period. This finding reiterates that electronic device thefts and
school dismissal times are related.

111
The median crime time is 4:55pm, which is still considered the afternoon and not the
evening. The daily crime span between the first quartile minute (1:45pm) and third quartile
minute (7:58pm) is 373 minutes. This equals 6 hours and 13 minutes. This range could relate to
Felson and Boba (2010), who discuss the narrow crime spans of juveniles during after-school
hours. The authors note that when schools dismiss students in the afternoon on weekdays, these
large groups of youths are “dumped” into the community – causing an increase in violent
offenses and assault victimization anytime between 1:00pm and 6:00pm. Although a different
offense type, the timing of criminality and victimization is consistent with the current study’s
findings.
Table 7-2. Day type with counts and percentages of electronic device theft
at MBTA subway stations, 2003-2011 (n = 1,163)
Daily patterns
Electronic device thefts occur more during the week than the weekend, as indicated in
Figure 7-2. When considering school days vs. non-school days, there are more electronic device
thefts when school is in session than when it is not (see Table 7-2). Using Boston Public Schools
2003-2011 academic calendars, “school days” are weekdays during the school year when classes
are held and “non-school days” are during holiday/administrative breaks, weekends and summer
vacation (Boston Public Schools, 2014b).

112
Of all days when electronic device theft occurred during the study period (n= 931), 60.9 percent
were school days (n= 567) and 39.1 percent were non-school days (n= 364). Figure 7-3 shows
that electronic device thefts peak on subways around 2:00-3:00pm on school days and 4:00-
5:00pm on non-school days.

113
Figure 7-3. Hourly patterns of electronic device theft at MBTA subway stations on school days vs. non-school days

114
Table 7-3. Monthly counts and percentages of electronic device theft
at MBTA subway stations, 2003-2011 (n = 1,163)
Monthly patterns
In order to examine trends of seasonality, years must be separated into seasons. When
studying the clustering of offenses over time in Stockholm, Uittenbogaard and Ceccato (2012)
defined the seasons as winter (December, January, February); spring (March, April, May);
summer (June, July, August); and fall (September, October, November).
Using this approach, it is evident that there are seasonal patterns regarding electronic
device theft at MBTA subway stations (see Table 7-3). Most thefts occur in the fall (32.5
percent). The number of thefts are comparable during the spring (23.8 percent) and winter (23.7
percent); and the least amount of thefts occur in the summer (19.9 percent).

115
Figure 7-4. Yearly patterns of electronic device theft at MBTA subway stations, 2003-2011
Yearly patterns
Tracking the patterns of crime over the years allows researchers to see if the phenomenon
has increased, decreased or fluctuated. Since 2003, electronic device theft at MBTA subway
stations has gradually increased (see Figure 7-4). Between 2003-2009, there was a stair-step
pattern with thefts being above the trend line in even years and below the trend line in odd years.
Yet between 2009-2010, the number of yearly thefts dipped. In 2011, thefts increased again and
surpassed previous yearly highs.

116
c. Discussion: Summary of key findings and linking theory
It is important to understand the temporal patterns of criminal events. In fact, time is an
integral part of routine activity theory. The word “routine” suggests that there is a temporal
sequence of behavior that is repeatedly performed, such as work, school and recreation
schedules. This creates a rhythm. The convergence of victims and offenders in activity spaces
relies on time and crime rhythms (Clarke & Eck, 2005; Felson, 2006).
Just as time is part of the environmental criminology fabric, it is also central to the
MBTA subway system – because like any public transit system, Boston subways run on a
schedule. The time it takes for a subway car to travel between stations is predetermined and
recorded by transit officials. The same can be said for the amount of time a subway car waits at a
station during a stop. Passengers depend on these time tables during their routine activities.
Delays and interruptions in service can alter a passenger’s plan for the day, therefore reliability is
essential. It can be surmised that offenders also take into account subway schedules when
committing offenses in the subway system.
Identifying hourly, weekly and monthly trends can assist police in crime prevention
measures and awareness campaigns. Not only can transit police warn potential victims about how
electronic device thefts occur at subway stations (as covered by the crime scripts in Chapter 5);
or where electronic device thefts occur (as exemplified by the field photos in Chapter 5 and
regression models in Chapters 5 and 6), but they can also indicate timeframes when individuals
are most-at risk.
The above sections explaining temporal patterns show that electronic device thefts at
MBTA subway stations are concentrated in the afternoon (during PM rush hour and after
school), on weekdays and during the fall. These results reject the null hypothesis.

117
The afternoon/evening weekday hours from 2:00-8:00pm probably have the most theft
because this is when school children are dismissed and when most workers leave their jobs. This
pushes a high number of potential victims and offenders into the subway system. This type of
theft concentration is considered a “focused hotspot” since it is a period of a few hours
(Ratcliffe, 2004). The increase in electronic device thefts during the PM rush hour also coincides
with a study exploring personal property offenses in the London Underground (Newton et al.,
2014a).
The literature states, in general, there is often a higher rate of offenses on school days
than non-school days (Herrmann, 2012; Felson & Boba, 2010). Interestingly, Braga (2004) found
that most Boston youth gun violence is concentrated after school dismissal times as well. This
pattern of criminality is also at work in the city’s subways. “When you get high school kids and
college students coming and going at the same subway station, they’re either going to be a victim
or doing the stealing,” said a male MBTA transit police officer (personal communication,
October 5, 2013). This comment directly relates to the concept of magnetic facilities, which is
discussed in Chapter 2. When school is dismissed on weekdays, youths are drawn to subway
stations like magnets. Since some subway stations lack formal adult supervision, this can lead to
“juvenile offender convergence” (Bichler et al., 2010) – and subsequent electronic device theft.
The fact there were fewer electronic device thefts on subways during June, July, August
contradicts past transit crime literature – which suggests theft from underground subway
passengers is the highest during summer months (Smith, 1986). Yet, the current findings do
support recent studies which have found patterns of crime seasonality on the surface-level.
Andresen and Malleson (2013) report that thefts peak in both the summer and fall, when
studying various crime types in Vancouver, Canada.

118
Chapter 8: CONCLUSIONS
8.1 Contributions
a. Recommendations and policy implications
Electronic device theft happens in above-ground areas too, not just in transit systems.
Multiple law enforcement agencies have developed campaigns and prevention techniques to help
thwart the problem. In 2003, the Metropolitan Police Service (MPS) rolled out Operation
Ringtone in London. The initiative increases police officer patrols in mobile phone theft
hotspots, while also raising awareness with “love your phone” posters in local cafes, bars and
businesses (Tilley, Smith, Finer, Erol, Charles, & Dobby, 2004). The NYPD started using
undercover stings in 2011 to expose the black market side of electronic device theft. Plain-
clothes officers visit local businesses known to engage in illegal dealings; they tell employees
that they are willing to sell stolen devices in exchange for cash. Those who agree are caught on
tape and arrested (CBS 2 New York, 2011). The same year, the NYPD also used plain-clothes
officers in decoy stings on MTA subways. In those instances, the officers acted as vulnerable
subway passengers with expensive devices to tempt motivated offenders (Gardiner, 2011).
The MBTA Transit Police has published safety tips in an attempt to prevent electronic
device theft in Boston subways (MBTA, 2012a). Their “show how smart you are” campaign
urged passengers not to “show off” their smartphones. Tips suggested that passengers ride smart
by keeping devices out of sight (see Photo 8-1). Yet, in recent years it seems that the MBTA
administration and the MBTA Transit Police are encouraging passengers to use their devices
while inside the subway system more and more.

119
Source: MBTA
Photo 8-1. Mobile phone theft awareness, MBTA Transit Police flier

120
Photo 8-2. Best Buy Express kiosk at Back Bay subway station

121
In October 2010, the MBTA (2010) announced that various smartphone apps had been
developed to display real-time tracking data on the Red, Orange and Blue subway lines. This
capability was expanded to the Green Line in October 2014 (MBTA, 2014c). Since the subway
system already had WiFi and cell service at a majority of stations when the apps were released,
this easily allowed passengers to see arrival and depart times of trains while underground.
In November 2010, another milestone was reached when the Forest Hills and Alewife
stations both received Best Buy Express kiosks, vending machines that distribute electronic
devices and accessories (Grillo, 2010). Some of the for-sale items include phones, iPods,
cameras, GPS systems, chargers and headphones (see Photo 8-2). It is interesting that both Forest
Hills and Alewife are on the Top 24 stations list with the most 2003-2011 electronic device theft
– #3 and #10 respectively (see Chapter 5). The kiosks have since been added to additional
subway stations.
In April 2012, the MBTA became the first rail system in the world to launch smartphone
ticketing, allowing passengers to purchase passes online via their phones and redeem them later
using a barcode for train conductors to scan (MBTA, 2012b). The mobile ticketing passes –
known as mTicket – can only be used on the MBTA commuter rail and ferries, and not the city
subways or buses. Yet, this may change in coming years since other cities, such as Portland,
Oregon, are now using mobile ticketing for buses and trains – while Chicago and San Francisco
are considering it (Rose 2013; Wronski, 2014; Cabanatuan, 2014).

122
Source: MBTA
Photo 8-3. See Say iPhone app, MBTA Transit Police (iTunes)
In May 2012, the MBTA Transit Police released the “See Say” iPhone app, which allows
passengers to anonymously report suspicious activity via text, photo or phone call (MBTA,
2012c). The launch made the MBTA the first transit system in the U.S. to incorporate a
smartphone app that is also part of the “if you see something, say something” Department of
Homeland Security national campaign. The app, which automatically disables the phone’s flash
in order to be discrete, is also unique because it allows for passengers to engage in two-way
communication with a transit police dispatcher in real-time (see Photo 8-3).
While all of these advancements are appreciated by passengers and officials alike, they
also seem to contradict crime prevention measures that instruct riders not to display or use their
devices on the subway. This encouragement could be counterintuitive to any place-based crime
prevention techniques used at problem stations with electronic device theft. At the same time, it
is difficult to assume that passengers will ever stop using their electronic devices in subways
now that the practice has become so common place.

123
To summarize, this study identified the top 24 subway stations where electronic device
theft is concentrated. Officials should utilize this list to consider the different types of snatch,
pickpocket and robbery crime scripts offenders may use at areas within these “risky” stations,
such as mezzanine areas, platform areas and subway cars. Additionally, it was found that certain
subway station characteristics increase electronic device theft at stations (that may or may not be
included on the top 24 list), such as higher ridership, terminus stations, bus connections and
stations on the Orange Line. Prevention efforts should be focused at stations that fit these
characteristics and are also located within BPD districts with high surface-level property crime.
The most appropriate time to implement future crime prevention measures at these
stations is during “hot times” on Mondays and Tuesdays from 4:00pm-5:00pm; and on
Wednesdays from 3:00pm-7:00pm when Boston Public Schools are in session. This
comprehensive and targeted approach will save time and resources, while hopefully reducing the
number of electronic device thefts at subway stations system-wide. But the first step would be
making it mandatory for victims to report (and police to collect) electronic device model, type,
service provider, color, memory capacity, retail value, IMEI number and other device-specific
information. This will aid in future crime analysis, hotspot identification and retrieval measures.

124
8.2 Limitations
There are limitations to be considered. The use of incident records collected by police can
be problematic because they are collected for administrative purposes and not for research. These
files may also be incomplete or contain errors. Since the data used for this study only includes
reported thefts, there may be more electronic device thefts than we know. It is also difficult to
distinguish between offender and victim influences when using police reports.
Regarding methodology, there may be alternative internal explanations for electronic
device theft at subway stations that were not covered in Chapter 5. Crime scripts for offenders
can also change as new devices fitted with more aggressive theft-prevention measures are
implemented. Additionally, sign tests may not be the most powerful statistical tool available to
examine the impact of phone and WiFi service. Using police districts as a unit of analysis in
Chapter 6 may be problematic if there are multiple subway stations within a police district; or if
most of the surface-level crimes do not actually occur near subway stations. Another limitation
can be the presence of multi-collinearity since the property crimes variable consists of both
robberies and larcenies, two other model variables.
As for reliability of the observations of passenger electronic device use within subway
stations, only one researcher took field notes of behaviors occurring on the mezzanine and
platform levels and within subway cars. This individualized approach could have skewed the
observations by only representing personal viewpoints.
Lastly, it may be difficult to account for the increase in electronic device theft when
compared to the overall increase in electronic device ownership and use in subways. This is
especially true for cell phones, which have evolved throughout the study period into
smartphones; and have become an integral part of subway passengers’ commuting experience.

125
8.3 Future Research
Future research on this topic can relieve some of the limitations described above. In order
to truly understand the total amount of electronic device theft that occurs in MBTA subways, a
victimization survey may be collected as a supplement. The surveys could ask victims about
their device use and whether or not they believe their behavior puts them at risk for electronic
device theft. The questions could also gauge passengers’ fear of theft. Additionally, interviewing
offenders arrested for electronic device theft would be useful to learn more about crime scripts
and theft tactics used at subway stations and in subway cars. These surveys could also help
authorities learn about additional electronic device thefts that were not reported.
It may also be pertinent to examine electronic device thefts as separate crime offenses:
such as larcenies vs. robberies. That would entail collecting and organizing police data under
those two categories. As for the influence of the surface-level environment, future studies should
further question what makes certain MBTA subway stations magnetic facilities by examining the
presence of public schools within a quarter mile of the top 24 stations with the most electronic
device theft – especially since this study found that a majority of thefts occur on school days and
spike during school dismissal times. This is also supported by Herrmann (2012) who found that
robberies are concentrated at subway stations near high schools around 3pm.
Studying electronic device theft before and after kill-switch technology and blacklists
with stolen phones became standard may help police understand the evolving crime scripts of
offenders. Future studies should also consider electronic device thefts that occur on subway cars
moving between stations. In order to examine risk, future research would benefit from using
multiple researchers to properly code and observe locations within the subway car environment,
such as seating areas, standing areas and areas near or further away from exit doors.

126
This approach could also apply Gill and associate’s (2014) interstitial crime analysis in the
United States. On the same note, since this has become a crime trend in cities around the world,
it would be beneficial to do a comparative analysis with U.S. and international public transit
systems.
Finally, as manufactures become more innovative and electronic devices continue to
evolve, it would be useful to compare theft rates of various “new-age” devices.
For example, one could examine if wearable electronic gadgets such as Google Glass (glasses),
Apple Watch (watches) and Nike FuelBand (bracelets) are stolen at the same rate in subways as
devices that are not wearable. This approach would revisit the “removable” aspect of the
CRAVED concept.
This study contributes to environmental criminology literature and transit crime research.
By focusing on hot products within hot environments, the concepts of crime and place and
CRAVE-able items are expanded. From a practitioner’s standpoint, the major impact of studying
electronic device theft within the MBTA subway system is that transit police will be able to
better identify problem stations, lines and locations. By addressing this issue, the problem-
oriented policing approach will be used. This strategy applies problem-solving methods through
scanning, analysis, response and assessment – with the goal being long-term crime prevention.
This will be beneficial for law enforcement agencies in various countries that are
experiencing this crime trend. Prevention of electronic device theft can also lead to a diffusion of
benefits – preventing, decreasing or blocking other crimes such as identity theft, the illegal
selling of stolen electronic devices, assault within the subway system and crimes against transit
employees. Also, riders will have a better sense of how, where and when to protect themselves
against electronic device theft.

127
NOTES
1. Adapted from Transit Security: A Description of Problems and Countermeasures (1997) by
U.S. Department of Transportation - Federal Transit Administration and Secure and Tranquil
Travel: Preventing Crime and Disorder on Public Transport (2006) by M. Smith and D. Cornish
(eds.).
2. National transit crime data is not often compiled or readily accessible for analysis (Transit
Cooperative Research Program, 2001). Despite this, the most recent compilation of transit crime
statistics indicates that there were 52,123 reported thefts of property on heavy rails (including
subways) since 2000 (U.S. Department of Transportation - Federal Transit Administration,
2011).
Reported Thefts of Property on Heavy Rails in the United States, 2000-2010
Year Number of Property Crimes
2000 7,856
2001 7,807
2002 7,158
2003 4,802
2004 4,396
2005 2,204
2006 2,527
2007 4,121
2008 4,053
2009 4,695
2010 2,504
Total: 52,123
Source: U.S. Department of Transportation, Bureau of Transportation Statistics
3. The incident-level police reports from the MBTA Transit Police used for this study do not
include the arrival subway station and departure subway station for each of the 1,163 electronic
device thefts. Therefore, ICA could not be used. Chapter 9 discusses recommendations for future
research using ICA.
4. See Eck, Clark & Guerette (2007) for comprehensive list of past risky facilities studies.

128
5. The grade level classifications provided by CTPS were modified as follows:
Above ground – combined CTPS classifications: above ground, open cut, covered
cut, light rail with reservation in street/in traffic.
Elevated – combined CTPS classifications: elevated and elevated
embankment
Underground – (no changes)
According to CTPS, above ground stations have a dedicated right-of-way. Open cut stations have
trains that run along the bottom of an outdoor trench. Covered cut stations are built over the
trench. Light rail stations are on the street level and are grouped by those with reservation areas
in the street or in traffic. These four different classifications were combined to create a general
“above ground” grade level.
According to CTPS, elevated stations have a bridge structure with the tracks built on it, while
elevated embankment stations have tracks running along dirt that has been piled up on a gradual
incline and walled in on each side; with short bridges enabling traffic to pass underneath. These
two different classifications were combined to create a general “elevated” grade level.

129
APPENDIX A. Research questions and method matrix
1) Transit Features
Research Question Hypotheses Derived from Analytical Strategy
1. Which subway station
features are associated
with higher rates of
electronic device theft?
Thefts will increase at
stations with higher
ridership, bus
connections, parking
lots. Thefts will also
increase at above-
ground and terminus
stations; and on subway
lines with more
stations.
Crime Pattern
Theory
Negative Binomial
Regression
2. Which locations
within subway stations
and subway cars are the
most at-risk of
electronic device theft?
Crowded areas,
secluded areas and areas
near subway car exits/
stairs are the most at -
risk
Rational
Choice Theory
Crime Script
Analysis
Field
Observations
3. How has the
introduction of phone
and WiFi service on
subway lines influenced
electronic device theft?
Thefts will increase on
subway lines after
phone and WiFi service
are introduced
Crime Pattern
Theory
Routine
Activity
Theory
Sign tests
2) Space
Research Question Hypotheses Derived from Analytical Strategy
1. How does electronic
device theft in the
MBTA subway system
compare to surface-level
property crimes,
larcenies and robberies
near stations?
Thefts will increase at
stations with higher
surface-level robbery,
larceny and property
crimes near stations
Crime Pattern
Theory
Routine
Activity
Theory
Rational
Choice Theory
Negative Binomial
Regression
3) Time
Research Question Hypotheses Derived from Analytical Strategy
1. Is the time of day,
week or year related to
electronic device theft at
subway stations?
Thefts will increase
during time periods
when stations are the
most busy
Routine
Activity
Theory
Descriptive Tables
Bar Charts
Line Graphs
Contour Chart

130
APPENDIX B. Average weekday ridership totals per station and ridership ranking
STATION AVERAGE
WEEKDAY
RIDERSHIP
RIDERSHIP
RANK
DOWNTOWN CROSSING 23,500 1
SOUTH STATION 21,432 2
HARVARD 19,640 3
PARK STREET 19,348 4
NORTH STATION 16,124 5
BACK BAY 15,748 6
CENTRAL 13,537 7
COPLEY 13,536 8
KENDALL 12,518 9
FOREST HILLS 12,251 10
STATE 12,095 11
DAVIS SQUARE 10,856 12
GOVERNMENT CENTER 10,802 13
MALDEN CENTER 10,106 14
ALEWIFE 10,047 15
HAYMARKET 9,875 16
MAVERICK 9,640 17
CHARLES 9,016 18
HYNES 8,842 19
ARLINGTON 8,298 20
SULLIVAN SQUARE 8,281 21
PORTER SQUARE 8,069 22
KENMORE 7,797 23
BOYLSTON 7,566 24
RUGGLES 7,374 25
QUINCY CENTER 7,112 26
JFK/UMASS 7,018 27
WELLINGTON 6,816 28
NORTH QUINCY 6,560 29
LECHMERE - E LINE 5,792 30
ASHMONT 5,675 31
OAK GROVE 5,437 32
TUFTS MEDICAL CENTER 5,397 33
WONDERLAND 5,355 34
CHINATOWN 5,091 35
ANDREW 5,063 36
MASS AVE STATION 4,613 37
JACKSON SQUARE 4,432 38
QUINCY ADAMS 4,390 39
WOLLASTON 4,225 40

131
AQUARIUM 4,170 41
COOLIDGE CORNER-C LINE 4,150 42
HARVARD AVE - B LINE 4,077 43
BROADWAY 3,829 44
LONGWOOD MEDICAL AREA- E LINE 3,800 45
BRAINTREE 3,769 46
AIRPORT 3,670 47
ORIENT HEIGHTS 3,545 48
BROOKLINE VILLAGE- D LINE 3,512 49
FIELDS CORNER 3,480 50
PRUDENTIAL- E LINE 3,430 51
RESERVOIR - D LINE 3,395 52
ROXBURY CROSSING 3,380 53
COMMUNITY COLLEGE 3,327 54
GREEN ST 3,159 55
FENWAY-D LINE 3,041 56
NORTHEASTERN UNIVERSITY - E LINE 3,007 57
BU EAST- B LINE 2,862 58
BLANFORD ST -B LINE 2,840 59
REVERE BEACH 2,789 60
STONY BROOK 2,775 61
LONGWOOD- D LINE 2,749 62
WOOD ISLAND 2,646 63
BRIGHAM CIRC-E LINE 2,535 64
BU CENTRAL-B LINE 2,524 65
BEACHMONT 2,494 66
MATTAPAN 2,238 67
RIVERSIDE- D LINE 2,023 68
ST. MARY'S - C LINE 1,970 69
SHAWMUT 1,891 70
SYMPHONY-E LINE 1,887 71
BABCOCK STREET- B LINE 1,824 72
WASHINGTON ST-B LINE 1,723 73
MUSEUM OF FINE ARTS- E LINE 1,676 74
SAVIN HILL 1,661 75
BROOKLINE HILLS- D LINE 1,654 76
WARREN STREET- B LINE 1,650 77
PACKARD'S CORNER- B LINE 1,571 78
CLEVELAND CIRCLE- C LINE 1,557 79
NEWTON CENTER- D LINE 1,487 80
BOWDOIN 1,295 81
GRIGGS ST - B LINE 1,260 82
WASHINGTON SQUARE - C LINE 1,217 83
SUMMIT AVE- C LINE 1,175 84
ALLSTON ST-B LINE 1,115 85

132
NEWTON HIGHLAND- D LINE 1,052 86
SCIENCE PARK - E LINE 1,047 87
WOODLAND- D LINE 1,044 88
BOSTON COLLEGE-B LINE 1,042 89
PLEASANT ST-B LINE 1,014 90
ST. PAUL - C LINE 935 91
SUTHERLAND RD-B LINE 923 92
BU WEST-B LINE 899 93
BEACONSFIELD- D LINE 896 94
CHESTNUT HILL AVE-B LINE 861 95
TAPPAN STREET - C LINE 837 96
ST PAUL - B LINE 814 97
CHESTNUT HILL-D LINE 778 98
SUFFOLK DOWNS 756 99
CHISWICK RD-B LINE 735 100
CENTRAL AVE 733 101
RIVERWAY- E LINE 664 102
HEATH STREET- E LINE 622 103
ELIOT- D LINE 595 104
ENGLEWOOD AVE - C LINE 585 105
FAIRBANKS - C LINE 585 106
KENT STREET - C LINE 510 107
MISSION PARK-E LINE 462 108
WABAN- D LINE 427 109
HAWES STREET - C LINE 426 110
FENWOOD ROAD- E LINE 343 111
BRANDON HALL- C LINE 316 112
DEAN ROAD- C LINE 316 113
MILTON 300 114
SOUTH STREET- B LINE 237 115
BUTLER 234 116
CEDAR GROVE 127 117
BACK OF THE HILL- E LINE 86 118
CAPEN ST 74 119
VALLEY ROAD 48 120
Source: MBTA (2007)

133
APPENDIX C. Crosstab table representing hourly and daily patterns of
electronic device theft at MBTA subway stations, 2003-2011
Mon Tue Wed Thu Fri Sat Sun
5am-6am 0 1 0 1 0 1 1
6am-7am 0 1 2 1 2 1 0
7am-8am 3 0 1 3 2 0 1
8am-9am 5 4 7 3 4 1 3
9am-10am 6 5 6 8 6 2 2
10am-11am 6 5 4 8 8 2 3
11am-12pm 4 7 3 7 7 4 5
12pm-1pm 9 11 13 12 14 6 7
1pm-2pm 9 12 15 16 12 4 7
2pm-3pm 11 19 18 19 17 6 10
3pm-4pm 14 16 23 13 16 7 8
4pm-5pm 21 24 9 10 16 9 4
5pm-6pm 13 15 16 12 15 7 8
6pm-7pm 14 14 22 12 14 10 5
7pm-8pm 19 14 15 18 19 6 11
8pm-9pm 14 11 6 9 20 6 5
9pm-10pm 9 13 9 8 9 9 6
10pm-11pm 11 4 3 9 11 9 2
11pm-12am 3 7 2 7 7 8 7
12am-1am 4 3 3 4 4 7 9
1am-2am 1 1 2 2 3 4 6
2am-3am 1 0 0 1 0 2 3
3am-4am 0 1 1 0 2 1 0
4am-5am 1 0 1 0 0 0 0
TOTAL 178 188 181 183 208 112 113

134
REFERENCES
Albright, S., Winston, W., & Zappe, C. (2011). Data analysis and decision making. Mason, OH:
South-Western Cengage Learning.
Allison, S. F. H., Schuck, A. M., & Lersch, K. M. (2005). Exploring the crime of identity theft:
Prevalence, clearance rates, and victim/offender characteristics. Journal of Criminal
Justice, 33, 19-29.
American Public Transportation Association. (2012) 2012 Public Transportation Fact Book.
Retrieved from http://www.apta.com/resources/statistics/
Belanger, M. (1999). Crime mobility and public transport: The case of the New
York City subway. Doctoral dissertation, Rutgers University, The State University of New
Jersey.
Beller, A., Garelik, S., & Cooper, S. (1980). Sex crimes in the subway. Criminology, 18, 35-52.
Bichler, G., Malm, A., & Enriquez, J. (2010, online) Magnetic facilities: Identifying the
convergence settings of juvenile delinquents. Crime & Delinquency.
Bichler, G., Schmerler, K., & Enriquez, J. (2013) Curbing nuisance motels: An evaluation of
police as place regulators. Policing: An International Journal of Police Strategies &
Management, 36(2), 437-462.
Block, R. L., & Block, C. R. (1995). Space, place, and crime: Hot spot areas and hot places of
liquor-related crime. In J. Eck and D. Weisburd (Eds.), Crime and Place. Monsey, NY:
Criminal Justice Press.
Block, R. L., & Block, C. R.. (2000). The Bronx and Chicago: Street robbery in the environs
of rapid transit stations. In J. Mollenkopf (Ed.), Analyzing crime patterns: Frontiers in
practice. London, U.K.: Sage.
Block, R. L., & Davis, S. (1996). The environs of rapid transit stations: A focus for street
crime or just another risky place? In R. V. Clarke (Ed.), Crime prevention studies:
Preventing mass transit crime, vo1.6. (pp. 237-257). Monsey, NY: Criminal Justice
Press.
Borrion, H. (2013). Quality assurance in crime scripting. Crime Science, 2:6.
Boston Public Schools. (2014a). School listings, School directory list. Retrieved from
http://www.bostonpublicschools.org
Boston Public Schools. (2014b). Academic calendars: 2003-2011 (BPS Communications
Office).

135
Bowers, K. (2014). Risky facilities: Crime radiators or crime absorbers? A comparison of
internal and external levels of theft. Journal of Quantitative Criminology, 30, 389-414.
Braga, A. A. (2004). Gun violence among serious young offenders. (Problem-Oriented Guides
for Police, Problem-Specific Guide Series, No. 23). Washington, D.C.: Office of
Community Oriented Policing Services, U.S. Department of Justice.
Brantingham, P. L., & Brantingham, P. J. (1981). Notes on the geometry of crime. In P. J.
Brantingham, & P. L. Brantingham (Eds.), Environmental Criminology. (pp. 27-54).
Beverly Hills, CA: Sage.
British Transport Police (2013a). BeAware guide to their tactics: gadget and phone theft tactics.
Retrieved from www.btp.police.uk/theft/phone-theft.html
British Transport Police (2013b). BeAware guide to their tactics: pickpockets’ tactics. Retrieved
from www.btp.police.uk/theft/pickpockets.html
Burrows, J. (1980). Closed-circuit television and crime on the London Underground.
In R. V. Clarke, & P. Mayhew (Eds.), Designing out crime. (pp. 75-83). London, U.K.:
HMSO.
Cabanatuan, M. (2014). Muni to test smart-phone app for some fares. San Francisco Chronicle,
September 5. Retrieved from http://blog.sfgate.com/cityinsider/2014/09/05/muni-to-test-
smart-phone-app-for-some-fares/
CBS 2 New York. (2011, December 16). NYPD cracks down on sales of stolen iPads and
iPhones [Video file]. Retrieved from http://newyork.cbslocal.com/2011/12/16/nypd-
cracks-down-on-sales-of-stolen-ipads-and-iphones/
Chaiken, J., Lawless, M., & Stevenson, K. (1974). The impact of police activity on
subway crime. Journal of Urban Analysis, 3, 173-205.
Clarke, R. V. (1995), Situational crime prevention. In M. Tonry & D. Farrington (Eds.). Building
a safer society: Strategic approaches to crime prevention. Chicago: The University of
Chicago Press.
Clarke, R. V. (Ed.). (1997). Situational crime prevention: Successful case studies. New York,
NY: Harrow and Heston.
Clarke, R. V. (1999). Hot products: Understanding, anticipating and reducing demand for stolen
goods. (Police Research Series, Paper 112). London, U.K.: Home Office, Research
Development and Statistics Directorate.
Clarke, R. V. (2012). Opportunity makes the thief. Really? And so what? Crime Science, 1:3.

136
Clarke, R. V., Belanger, M., & Eastman, J. A. (1996). Where angels fear to tread: A test in
the New York City subway of the robbery/density hypothesis. In R. V. Clarke
(Ed.), Crime prevention studies: Preventing mass transit crime, vo1.6. (pp. 217-
235). Monsey, NY: Criminal Justice Press.
Clarke, R. V., & Cornish, D. (1985). Modeling offenders’ decisions: A framework for research
and policy. Crime and Justice: An Annual Review of Research, 6, 147-185.
Clarke, R. V. & Eck, J. E. (2007). Understanding risky facilities. (Problem-Oriented Guides for
Police, Problem-Solving Tools Series). Washington, D.C.: Office of Community
Oriented Policing Services, U.S. Department of Justice.
Clarke, R. V., & Eck, J. E. (2005). Crime analysis for problem solvers in 60 small steps.
Washington, D.C.: Office of Community Oriented Policing Services.
Clarke, R. V., Kemper, R., & Wyckoff, L. (2001). Controlling cell phone fraud in the
U.S.: Lessons for the UK ‘foresight’ prevention initiative. Security Journal, 14, 7-
22.
Clarke, R. V., & Newman, G. R. (2005a). Modifying criminogenic products: What role for
government? In R. V. Clarke (Ed.), Crime prevention studies: Designing out crime from
products and systems, vo1.18. (pp. 7-83). Monsey, NY: Criminal Justice Press.
Clarke, R., & Newman, G. (2005b). Secured by design: A plan for security coding of electronic
products. ? In R. V. Clarke (Ed.), Crime prevention studies: Designing out crime from
products and systems, vo1.18. (pp. 203-230). Monsey, NY: Criminal Justice Press.
Cohen, L. E., & Felson, M. (1979). Social change and crime rate trends: A routine activity
approach. American Sociological Review, 44, 588-605.
Cornish, D. (1994) The procedural analysis of offending and its relevance for situational
prevention. In R. V. Clarke (Ed.), Crime prevention studies, vo1.3. (pp. 151-196).
Monsey, NY: Criminal Justice Press.
Cornish, D., & Clarke, R. V. (Eds.). (1986). The reasoning criminal: Rational choice
perspectives on offending. New York, NY: Springer-Verlag.
Cozens, P., Neal, R., Hillier, D., & Whitaker, J. (2004). Tackling crime and fear of crime
while waiting at Britain’s railway stations. Journal of Public Transportation, 7, 23-41.
DeGeneste, H., & Sullivan, J. P. (1994). Policing transportation facilities. Springfield, IL:
Charles C. Thomas.
Del Castillo, V. (1992). Fear of crime in the New York City subway. Doctoral dissertation,
Fordham University, New York, NY.

137
Design Council. (2011). Hot products: Designing more secure mobile devices. London: U.K.:
Home Office, Design & Technology Alliance Against Crime.
Easteal, P., & Wilson, P. (1991). Preventing crime on transport. Canberra: Australian Institute
of Criminology.
Eck, J. E. (1994). Drug markets and drug places: A case-control study of the spatial
structure of illicit drug dealing. Unpublished doctoral dissertation, University of
Maryland, College Park.
Eck, J. E., Clarke, R. V., & Guerette, R. T. (2007). Risky facilities: Crime concentration in
homogeneous sets of establishments and facilities. In G. Farrell, K. J. Bowers, S.D.
Johnson, & M. Townsley (eds.), Crime prevention studies: Imagination for crime
prevention, vol.17. Monsey, NY: Criminal Justice Press.
Ekblom, P. (2008). Designing products against crime. In R. Wortley, & L. Mazerolle (Eds.),
Environmental Criminology and Crime Analysis. (pp. 195-220). Cullompton, Devon:
Willan Publishing.
Falanga, M. (1988). Reducing crime through design in the Chicago subway system.
Doctoral dissertation, University of Michigan, Ann Arbor.
Farrell, G. (2013). Five tests for a theory of the crime drop. Crime Science, 2(1), Article 5
Farrell, G, Tilley, N, Tseloni, A, Mailley, J (2011). The crime drop and the security hypothesis.
Journal of Research in Crime and Delinquency, 48(2), 147–175
Fetto, J. (2013). Americans spend 58 minutes a day on their smartphones. Experian - Consumer
Insights, Marketing Services. Retrieved from http://www.experian.com/blogs/marketing-
forward/2013/05/28/americans-spend-58-minutes-a-day-on-their-smartphones/
Felson, M. (2006). Crime and nature. Thousand Oaks, CA: Sage.
Felson, M., & Boba, R. (2010). Crime and everyday life. Thousand Oaks, CA: Sage.
Felson, M., Belanger, M., Bichler, G., Bruzinksi, C., Campbell, G., Fried, C., Grofik, K., Mazur,
I., O’Regan, A., Sweeney, P., Ullman, A., & Williams, L. (1996). Redesigning hell:
Preventing crime and disorder at the Port Authority bus terminal. In R. V. Clarke (Ed.),
Crime prevention studies: Preventing mass transit crime, vo1.6. (pp. 5-92). Monsey, NY:
Criminal Justice Press.
Felson, M., Dickman, D., Glenn, D., Kelly, L., Lambard, G., Maher, L., Nelson-Green, L.,
Ortega, C., Preiser, T., Rajedran, A., Ross, T., Tous, L., & Veil, J. (1990). Preventing
crime at Newark subway stations. Security Journal, 1, 137-42.

138
Felson, M., & Poulsen, E. (2003). Simple indicators of crime by time of day. International
Journal of Forecasting, 19, 595-601.
Garcia, A. (2013, May 29). Thief steals beats headphones in NYC subway [Video file].
Retrieved from http://youtu.be/42U5p_zfJ4s
Gardiner, S. (2011). Targeting train theft: NYPD sends decoy police onboard to fight theft of
gadgets from passengers. Wall Street Journal, November 14, A19.
Gaylord, M., & Galliher, J. (1991). Riding the underground dragon: Crime control and public
order on Hong Kong's mass transit railway. British Journal of Criminology, 31, 15-36.
Gentry, K. (2010). Cell phone theft in Boston subways. (Unpublished doctoral term paper). John
Jay College of Criminal Justice (CUNY), New York, NY.
Gerard, G. J., Hillison, W., & Pacini, C. (2004). Identity theft: The US legal environment and
organizations’ related responsibilities. Journal of Financial Crime, 12, 33-43.
Gibbons, J.D. (1993). Nonparametric statistics: An introduction (Sage Quantitative Applications
in the Social Sciences, vol. 90). Newbury Park, CA: Sage
Gill, A., Partridge, H., & Newton, A. D. (2014). Interstitial crime analysis. JDiBrief Series.
London, U.K.: UCL Jill Dando Institute of Crime Science.
Goldberg, R. (2011). Selling the Apple lifestyle: What makes the ads work. Retrieved from
http://www.minyanville.com/special-features/articles/apple-ad-best-ad-copy-
apple/3/22/2011/id/33115#ixzz3LXK9r8we
Grillo, T. (2010). Best Buy stations gadget machines at T stops. Boston Herald, November 25,
Business section.
Groff, E. R., & Lockwood, B. (2014). Criminogenic facilities and crime across street segments in
Philadelphia: Uncovering evidence about the spatial extent of facility influence. The
Journal of Research in Crime and Delinquency, 51(3), 277.
Guerette, R. T., & Clarke, R. V. (2003). Product life cycles and crime: Automated teller
machines and robbery. Security Journal, 16, 7-18.
Harrington, V., & Mayhew, P. (2001). Mobile phone theft. (Home Office Research Study
235). London, U.K.: Home Office.
Herrmann, C. (2012). Risky businesses: A micro-level spatiotemporal analysis of crime, place
and business establishment type. Doctoral dissertation, Graduate Center, City University
of New York.

139
Hilbe, J. (2011). Negative binomial regression. New York, New York: Cambridge University
Press.
Hoel, L. A. (1992). Public transportation security. In G. E. Gray & L. A Hoel (Eds.), Public
Transportation, Englewood Cliffs, N.J.: Prentice Hall.
Home Office (2014). Reducing mobile phone theft and improving security. London, U.K.: Home
Office.
Ingalls, G., Hartgen, T., & Owens, T. (1994). Public fear of crime and its role in bus transit use.
Transportation Research Record, 1433, 201-211.
International Telecommunication Union. (2014). Mobile-cellular subscriptions [Data file].
Retrieved from http://www.itu.int/net4/itu-d/icteye/
Jacques, S., & Bernasco, W. (2013). Drug dealing. In B. Leclerc & R. Wortley (Eds.),
Cognition and crime: Offender decision making and script analyses. London: Routledge,
Crime Science Series.
Jochelson, R. (1994). Crime on the rail system. Sydney, Australia: New South Wales Bureau of
Crime Statistics Research, Attorney General’s Department.
Kenney, D. (1987). Crime, fear, and the New York City subway. New York: Praeger.
Ketola, H. N., & Chia, D. (2000). Developing useful transit-related crime and incident data.
(Transit Cooperative Research Program, Project F-6A). Washington, D.C.: National
Research Council.
Klick, J. M., MacDonald, J. & Stratmann, T. (2012). Mobile phones and crime deterrence: An
underappreciated link. In A. Harel & K. N. Hylton (Eds.), Research handbook on the
economics of criminal law (pp. 243-256). Cheltenham: Edward Elgar.
Kock, R. (1999). 80-20 principle: The secret to success by achieving more with less.
New York, NY: Doubleday.
La Vigne, N. (1996a). Crime prevention through the design and management of the built
environment: The case of the DC metro. Doctoral dissertation, Rutgers University,
Newark, NJ.
La Vigne, N. (1996b) Safe transport: Security by design on the Washington metro. In:
R. V. Clarke (ed.), Crime Prevention Studies: Preventing Mass Transit Crime, Vo1.
6, pp. 237-257. Monsey, NY: Criminal Justice Press, pp. 163-198). Monsey, NY:
Criminal Justice Press.
Leclerc, B. & Wortley, R. (Eds.) (2013). Cognition and crime: Offender decision making and
script analyses. London: Routledge, Crime Science Series.

140
Levine, N., & Wachs, M. (1986). Bus crime in Los Angeles I – Measuring the impact.
Transportation Research A, 20, 273-284.
Levine, N., Wachs, M., & Shirazi, E. (1986). Crime at bus stops. A study of environmental
factors. Journal of Architectural and Planning Research, 3, 339-361.
Line, T., Jain, J. & Lyons, G. (2011). The role of ICTs in everyday mobile lives. Journal of
Transport Geography, 19, 1490-1499.
Lohr, S. (2009). Smartphone rises fast from gadget to necessity. New York Times, June 10, B1.
Loukaitou-Sideris, A. (1999). Hot spots of bus stop crime. The importance of environmental
attributes. Journal of the American Planning Association, 65, 395-411.
Loukaitou-Sideris, A., Liggett, R. and Hiseki, I. (2002). The geography of transit crime:
Documentation and evaluation of crime incidence on and around the Green line stations
in Los Angeles. Journal of Planning Education and Research, 22, 135-151.
Lynch, J. (2005). Identity theft in cyberspace: Crime control methods and their effectiveness in
combating phishing attacks; Berkeley Technology Law Journal, 259.
Lyons, G., Jain, J., & Holley, D. (2007). The use of travel time by rail passengers in Great
Britain. Transportation Research, 107-120.
Mailley, J., Garcia, R., Whitehead, S., & Farrell, G. (2008). Phone theft index. Security Journal,
21(3), 212–227.
Mailley, J. (2011). The prevention of mobile phone theft: a case study of crime as pollution;
rational choices and consumer demand. Doctoral dissertation, Loughborough University,
Loughborough, England.
Massachusetts Bay Transportation Authority. (2014a). Fall 2014 frequency schedule.
Retrieved from http://www.mbta.com/schedules_and_maps/subway/
Massachusetts Bay Transportation Authority. (2014b). Late night service FAQs.
Retrieved from http://www.mbta.com/riding_the_t/default.asp?id=6442451913
Massachusetts Bay Transportation Authority. (2014c). Customers are now able to track green
line trains. Retrieved from http://mbta.com/about_the_mbta/news_events/?id=64424
53268
Massachusetts Bay Transportation Authority. (2012a). Transit safety tips. Retrieved from
http://www.mbta.com/safety/safety_tips/

141
Massachusetts Bay Transportation Authority. (2012b). MBTA and Masabi to launch first
smartphone rail ticketing system in the U.S. Retrieved from http://www.mbta.com/about_
the_mbta/news_events/?id=24562
Massachusetts Bay Transportation Authority. (2012c). See Say smartphone app. Retrieved from
http://www.mbta.com/about_the_mbta/news_events/?id=24872
Massachusetts Bay Transportation Authority. (2010). Taking the guesswork out of taking the
subway. Retrieved from http://www.mbta.com/about_the_mbta/news_events/?id=20456
Massachusetts Bay Transportation Authority. (2007). Ridership and service statistics, Blue Book.
Retrieved from http://www.mbta.com/about_the_mbta/document_library
Massachusetts Legislature. (2014). General laws - Part IV: Crimes, punishments and
proceedings in criminal cases. Retrieved from https://malegislature.gov/Laws/General
Laws/Search
Minjie, Z. (2011). Thieves target Metro phones. Shanghai Daily, November 9, A4.
Morgan, R., & Smith, M.J. (2006). Crime against passengers – Theft, robbery, assault
and indecent assault. In M. J. Smith, & D. B Cornish (Eds.), Secure and tranquil
travel: Preventing crime and disorder on public transport. (pp. 77-102). London,
U.K.: UCL Jill Dando Institute of Crime Science.
Myre, M., & Rosso, F. (1996). Designing for security in Meteor: A projected new metro line in
Paris. In R. V. Clarke (Ed.), Crime prevention studies: Preventing mass transit crime,
vo1.6. (pp. 199-216). Monsey, NY: Criminal Justice Press.
National Mobile Phone Crime Unit. (2009). What we do. Retrieved from http://www.met.police
.uk/mobilephone.
NBC 4 New York. (2014, September 16). Suspected subway pickpocket steals cellphone, gets
arrested [Video file]. Retrieved from http://www.nbcnewyork.com/news/local/Times-
Square-Pickpocket-Steals-Cellphone-Sleeping-Woman-Subway-275380741.html
Newton, A. D. (2004). Crime on public transport: ‘Static’ and ‘non-static’ (moving) crime
events. Western Criminology Review, 5, 25-42.
Newton, A. D. (2014). Crime on public transport. In G. Bruinsma, & D. Weisburd (Eds.),
Encyclopedia of criminology and criminal justice. (pp. 709-720). London, U.K.:
Springer.
Newton, A., Partridge, H., & Gill, A. (2014a). Above and below: Measuring crime risk in and
around underground mass transit systems. Crime Science, 3:1.

142
Newton, A., Partridge, H., & Gill, A. (2014b). In and around: Identifying predictors of theft
within and near to major mass underground transit systems. Security Journal, 27 (2). 132-
146.
New York Police Department. (2012, January 11). Electronic device safety PSA [Video file].
Retrieved from http://youtu.be/SJ-1KC_JJIw
Nielsen. (2012). Two thirds of new mobile buyers now opting for smartphones. http://www.
nielsen.com/us/en/newswire/2012/two-thirds-of-new-mobile-buyers-now-opting-for-
smartphones.html
Noel, J., & Prokupecz, S. (2012). Man, 81, chases iPhone thief, gets pushed onto subway tracks
by 2nd suspect. NBC 4 New York, April 9. Retrieved from http://www.nbcnewyork.com
/news/local/Elderly-Man-Subway-Thief-iPhone-Tracks-Push-Suspect-Brooklyn-
139963573.html
Ohmori, N, & Harata, N. (2008). How different are activities while commuting by train: A
case in Tokyo. Journal of Economic and Social Geography, 99, 547-561.
Orrick, E. A. & Piquero, A. R. (2013). Were cell phones associated with lower crime in the
1990s and 2000s? Journal of Crime and Justice.
Parascandola, R. (2011). NYPD: Thefts of smartphones and iPads now more prevalent than cash
as criminals turn focus on electronics. New York Daily News, December 6. Retrieved
from http://www.nydailynews.com/new-york/nypd-thefts-smartphones-ipads-prevalent-
cash-criminals-turn-focus-electronics-article-1.987406.
Partridge, H. (2013). Hot routes. JDiBrief Series. London, U.K.: UCL Jill Dando Institute of
Crime Science.
Pearlstein, A. and Wachs, M. (1982). Crime in public transit systems: An environmental design
perspective. Transportation, 11, 277-297.
Pew Internet & American Life Project. (2012) Device ownership, Trend Data (Adults). Retrieved
from http://www.pewinternet.org/Trend-Data-(Adults)/Device-Ownership.aspx
Phillips, P. D. (1980). Characteristics and topology of the journey to crime. In D. E.
Georges-Abeyie, & K. D. Harries (Eds.), Crime: A spatial perspective. (pp. 169-
80). New York, NY: Columbia University Press.
Pires, S. F. & Clarke, R. V. (2012). Are parrots CRAVED? An analysis of parrot poaching in
Mexico. Journal of Research in Crime and Delinquency, 49, 122-146.
Ratcliffe, J. H. (2004). The hotspot matrix: A framework for the spatio-temporal targeting of
crime reduction. Police Practice and Research, 5(1), 5-23.

143
Richards, L., & Hoel, L. (1980). Planning procedures for improving transit station security. (No.
DOTOS-50233). Washington, DC: U.S. Department of Transportation.
Rocheleau, M. (2011, February 4). South Station saw most reported crime in MBTA system last
year. Boston Globe. Retrieved from http://www.boston.com/bostonglobe.
Roman, J., & Chalfin, A. (2007). Is there an iCrime wave? Urban Institute, Justice Policy Center.
Retrieved from http://www.urban.org
Rose, J. (2013). TriMet ticketing app getting rave reviews from riders. The Oregonian,
September 5.
Russell M., Price R., Gerring Z., Signal L., Cumming J. & Stanley J. (2011). What do passengers
do with their travel time? Structured observations on buses and trains. Journal of Public
Transportation, 14.
Savona, E. U., Giommoni, L, & Mancuso, M. (2013). Human trafficking for sexual exploitation
in Italy. In B. Leclerc & R. Wortley (Eds.), Cognition and crime: Offender decision
making and script analyses. London: Routledge, Crime Science Series.
Sedelmaier, C. M. (2003). Railroaded: The effects of a new public transportation system upon
local crime patterns. Doctoral dissertation, Rutgers University, Newark, NJ.
Seelye, K. Q. (2010, April 16). As cellular service expands in subways, thefts rise. New York
Times. Retrieved from http://www.boston.com/bostonglobe.
Shellow, R., Bartel, E.W., & Romualdi, J. (1975). Security of patrons on urban
transportation systems. (Transportation Research Institute Report No. 6).
Pittsburgh: Carneige-Mellon University.
Sloan-Howitt, M. & Kelling, G. L. (1990). Subway graffiti in New York City: "Gettin up"
vs. "Meanin it and cleanin it". Security Journal, 1, 131-136.
Smith, G. (2013a) Apple picking: How the iPhone became an object worth killing for.
Huffington Post, March 7.
Smith, G. (2013b) Apple, Samsung anti-theft features tested in smartphone crime probe.
Huffington Post, July 18.
Smith, J. (2003). The nature of personal robbery. (Home Office Research Study 254).
London, U.K.: Home Office, Development and Statistics Directorate.
Smith, M. J. (1986). Transit crime study. Volume II: final report. New York, NY: New
York City Criminal Justice Agency.

144
Smith, M. J. & Clarke, R. V. (2000). Crime and public transport. Crime and justice – A
review of research, 27, 169-233.
Smith, O. (2013c). Man held after woman thrown onto subway tracks in Philadelphia. CNN,
January 18. Retrieved from http://www.cnn.com/2013/01/18/us/philadelphia-subway-
attack
Solans, N. M. (2012). Employee theft from passengers at U.S. airports: An environmental
criminology perspective. Doctoral dissertation, Rutgers University, Newark, NJ.
Tennakoon, K. L, & Taras, D. G. (2012). The relationship between cell phone use and sense
of security: A two-nation study. Security Journal, 25, 291-308.
Thompson, R. (2014) Understanding theft from the person and robbery of personal property
victimization trends in England and Wales, 1994-2010/11. Doctoral dissertation,
Nottingham Trent University, Nottingham, England.
Tilley, N., Smith, J., Finer, S., Erol, R., Charles, C. and Dobby, J. (2004) Problem-solving street
crime: Practical lessons from the street crime initiative. London, U.K.: Home Office.
Timmermans, H. and Van der Waerden, P. (2008). Synchronicity of activity engagement
and travel in time and space: Descriptors and correlates of field observations.
Transportation Research Record, 2054, 1-9.
Tompson, L. and Chainey, S. (2011). Profiling illegal waste activity: Using crime scripts as a
data collection and analytical strategy. European Journal of Criminal Policy and
Research, 17, 179-201.
Transit Cooperative Research Program. (2001). Guidelines for collecting, analyzing, and
reporting transit crime data. (Research Results Digest 41). Washington, D.C.:
Transportation Research Board, National Research Council.
Uittenbogaard, A., & Ceccato, V. (2014). Safety in Stockholm's underground stations: An
agenda for action. European Journal on Criminal Policy and Research, 20(1), 73-100.
Uittenbogaard, A., & Ceccato, V. (2012). Space-time clusters of crime in Stockholm, Sweden.
Review of European Studies, 4(5), 148-156.
U.S. Census Bureau. (2014). Population estimates (2003 & 2011) [Data file]. Retrieved from
http://www.census.gov/popest/data/historical/index.html.
U.S. Census Bureau. 2008 American Community Survey [Data file]. Retrieved from
http://www.census.gov/acs.

145
U.S. Federal Communications Commission. (2012) Announcement of new initiatives to combat
smartphone and data theft. http://www.fcc.gov/document/ announcement- new-
initiatives-combat-smartphone-and-data-theft, accessed April 2012.
U.S. Department of Transportation - Federal Transit Administration. (1997). Transit security: A
description of problems and countermeasures. Retrieved from
www.fta.dot.gov/documents /TS_Problem_Coutnermeasures.pdf
U.S. Department of Transportation - Federal Transit Administration. (2011). Reports of violent
crime, property crime and arrests by transit mode. Retrieved from http://www.rita.
dot.gov/bts/sites/rita.dot.gov.bts/files/publications/national_transportation_statistics/html/
table_02_38.html
Wall, D. (2003). Crime and the Internet. New York, NY: Routledge.
Walker, J. T., & Maddan, S. (2012). Statistics in criminology and criminal justice: Analysis and
interpretation. Burlington, MA: Jones & Bartlett.
Webb, B., & Laycock, G. (1992). Reducing crime on the London underground. (Crime
Prevention Unit Paper, #30). London, U.K.: Home Office.
Weidner, R. R. (1996). Target hardening at a New York City subway station: Decreased
fare evasion--at what price? In R. V. Clarke (Ed.), Crime prevention studies: Preventing
mass transit crime, vo1.6. Monsey, NY: Criminal Justice Press.
Weisburd, D., Lum C., & Yang, S-M. (2004). The criminal careers of places: a longitudinal
study. Washington, DC: U.S. Department of Justice - National Institute of Justice.
Whitehead, S., Mailley, J., Storer, I., McCardle, J., Torrens, G. & Farrell, G. (2008). In safe
hands: a review of mobile phone anti-theft designs. European Journal on Criminal Policy
and Research, 14(1): 39-60
Wild, C. J., & Seber, G. A. F. (2000). Chance encounters: A first course in data analysis and
inference. New York, NY: John Wiley & Sons.
Wilcox, R. R. (1987). New statistical procedures for the social sciences: Modern solutions to
basic problems. Hillsdale, NJ: Erlbaum.
Wronski, R. (2014). Wait continues for mobile ticketing on Metra. Chicago Tribune, September
22.
Yu, S. V. (2009). Bus stops and crime: Do bus stops increase crime opportunities in local
neighborhoods? Doctoral dissertation, Rutgers University, Newark, NJ.