apple and the ipad ® new mexico highlands university
TRANSCRIPT

Apple and the iPad®
New Mexico Highlands University

Mission
Apple is committed to bringing the best personal computing experience to students,
creative professionals and consumers around the world through its innovative
hardware, software and Internet offerings.

HistoryiPad Model Release Date (United States)
iPad® April 3, 2010
iPad 2® March 11, 2011
iPad 3® March 16, 2012
iPad 4® November 2, 2012
iPad mini® November 2, 2012
iPad Air® November 1, 2013
iPad mini® (with Retina display) November 12, 2013

Market Analysis
IBIS Industry Report
United StatesMacro-environment
Gross Domestic Product 15.68 trillion Growth Rate 2.8 Inflation Rate 1.51 Unemployment Rate 7.3%
Apple Inc. 13.0%
Amazon 35.3% Other 45.2%
Dell Inc. 6.5%

Product
16 GB 499$ 16 GB 399$ 16 GB 399$ 16 GB 299$ 32 GB 599 32 GB 499 64 GB 699 64 GB 599 128 GB 799 128 GB 699
16 GB 629$ 16 GB 529$ 16 GB 529$ 16 GB 429$ 32 GB 729 32 GB 629 64 GB 829 64 GB 729 128 GB 929 128 GB 829
Wi-Fi + Cellular Wi-Fi + 3G Wi-Fi + Cellular Wi-Fi + Cellular
iPad Air iPad 2iPad mini (Retina) iPad mini
Wi-Fi Wi-Fi Wi-Fi Wi-Fi
PRICES

Product
iPad Air iPad 2iPad mini (Retina) iPad mini
Weight 1 pound 1.33 pounds 0.73 pound 0.68 poundDisplay Retina display Retina display
9.7' LED 9.7' LED 7.9" LED 7.9" LEDChip A7 A5 A7 A5Cameras FaceTime HD FaceTime FaceTime HD FaceTime HD
iSight Camera Back Camera iSight Camera iSight CameraVideos 1080p HD 720p HD 1080p HD 1080p HD
SPECIFICATIONS
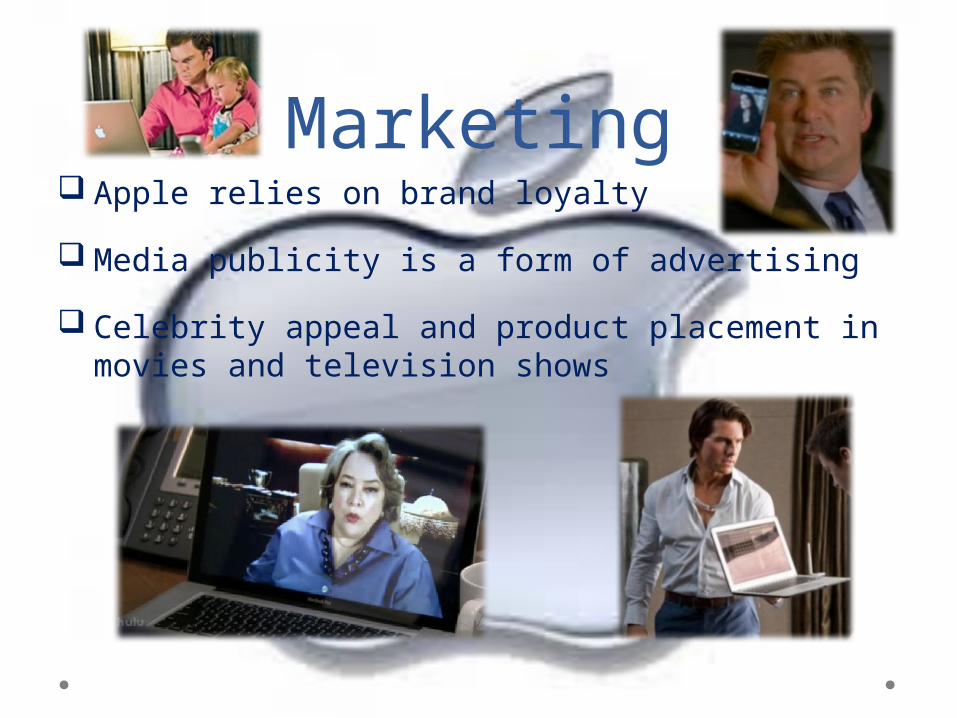
Marketing Apple relies on brand loyalty
Media publicity is a form of advertising
Celebrity appeal and product placement in movies and television shows

Research & Development
Apple’s innovation is embodied in its Intellectual Property, including Patents, Trademarks, and Copyrights
Protects intellectual property aggressively
Apple’s current R&D is secretive Rumors of an iPad 6 in development 2013 R&D budget was $4,475,000
INTELLECTUAL
PROPERTY
CURRENT
R&D

Stakeholders
CUSTOMERS
Governments Schools Families Businesses
MANAGEMENT INVESTORS
EMPLOYEES
SUPPLIERS

Environmental &Social Impact
all values in million metric tons
30.9 18.849 1.545 9.27 0.618 0.618
GREENHOUSE GAS EMISSIONS
61% 5% 30% 2% 2%

Regulatory Compliance
Required to file reports with the Securities and Exchange Commission (SEC)
Bound by Sarbanes-Oxley Act of 2002 (SOX) standards
Compliant with trade agreements and embargoes

Corporate Structure
Tim Cook
Peter OppenheimerChief Financial Officer
Jeff WilliamsOperations
Eddy CueSoftware Service
Dan RiccioHardware Engineering
Graig FederighiSoftware Engineering
Philip SchillerWorldwide Marketing
Jonathan IveDesign
Bruce SewellGeneral Counsel

Board of Directors Bill Campbell
Andrea Jung
Millard Drexler
Ronald D. Sugar
Tim Cook
Arthur D. Levinson
Albert Gore Jr.
Robert A. Iger

Financial Statements2013 2012 2011
Net sales 170,910 156,508 108,249 Net income 37,037 41,733 25,922 Earnings per share:
Basic 40.03 44.64 28.05 Diluted 39.75 44.15 27.68
Cash dividends declared per share 11.40 2.65 - Shares used in computing earnings per share:
Basic 925,331 934,818 924,258 Diluted 931,662 945,355 936,645
Total cash, cash equivalents and marketable securities
146,761 121,251 81,570
Total assets 207,000 176,064 116,371 Long-term debt 16,960 - - Long-term obligations (3) 20,208 16,664 10,100 Total liabilities 83,451 57,854 39,756 Total shareholders' equity 123,549 118,210 76,615
(in millions, except number of shares, which are reflected in thousands, and per share data amounts)
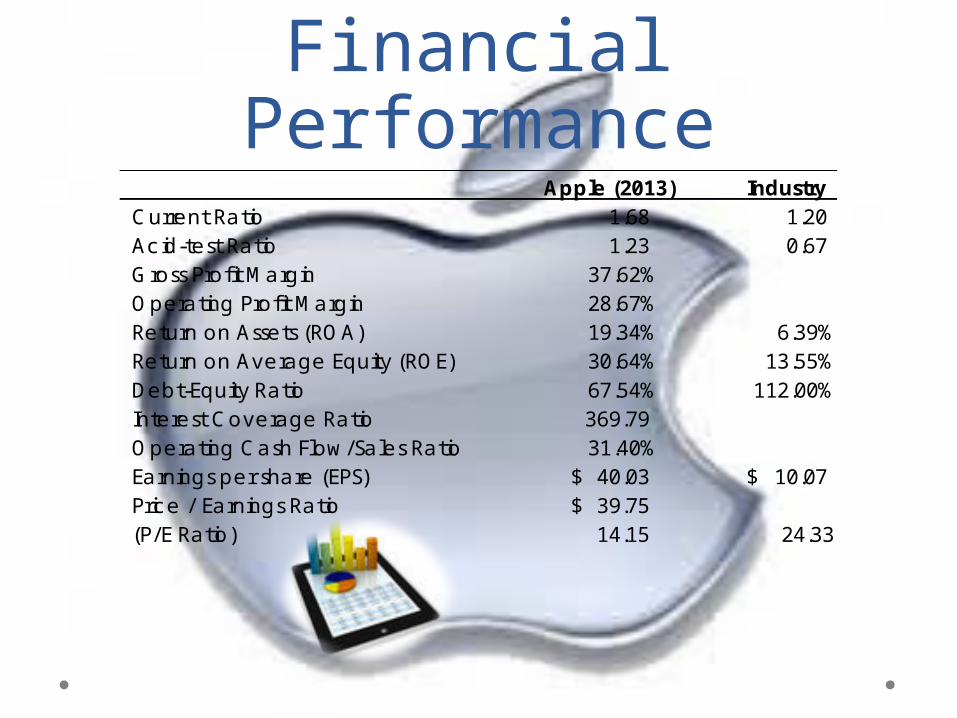
Financial PerformanceApple (2013) Industry
Current Ratio 1.68 1.20 Acid-test Ratio 1.23 0.67 Gross Profit Margin 37.62%Operating Profit Margin 28.67%Return on Assets (ROA) 19.34% 6.39%Return on Average Equity (ROE) 30.64% 13.55%Debt-Equity Ratio 67.54% 112.00%Interest Coverage Ratio 369.79 Operating Cash Flow/Sales Ratio 31.40%Earnings per share (EPS) 40.03$ 10.07$ Price / Earnings Ratio 39.75$ (P/E Ratio) 14.15 24.33

SWOT AnalysisStrengths Brand loyalty Innovative
technology Low manufacturing costs Environmental policies Strong financial position
Weaknesses Market share Marketing strategy Technology compatibility
Opportunities Increase market share Innovation leader
Threats Market competition
S W
O T

Objectives & Strategies
Focus on developing new models
Investments into research and development
Modifications to market strategy
Ethical leadership
2/24/55 – 10/5/11