apple 2005 slide
TRANSCRIPT

® 2007, Tony Gauvin, UMFK
Apple Computer Inc.
2005
A Strategic Management
Case Study
Graphics are the property of
Apple Computer
® 2007, Tony Gauvin, UMFK2
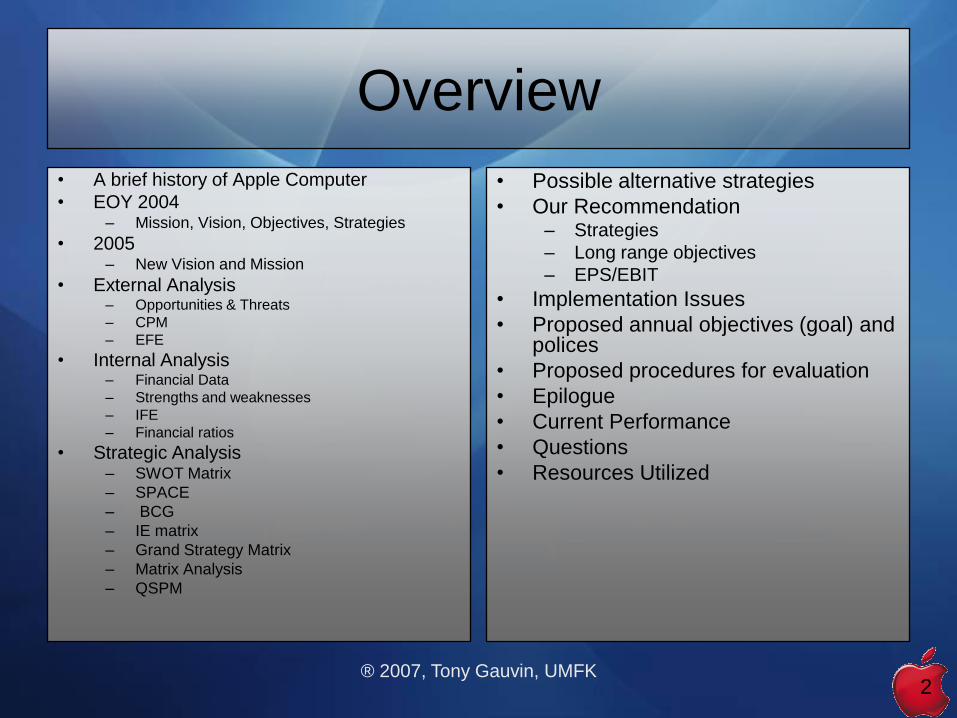
Overview
• A brief history of Apple Computer
• EOY 2004– Mission, Vision, Objectives, Strategies
• 2005 – New Vision and Mission
• External Analysis– Opportunities & Threats
– CPM
– EFE
• Internal Analysis– Financial Data
– Strengths and weaknesses
– IFE
– Financial ratios
• Strategic Analysis – SWOT Matrix
– SPACE
– BCG
– IE matrix
– Grand Strategy Matrix
– Matrix Analysis
– QSPM
• Possible alternative strategies
• Our Recommendation– Strategies
– Long range objectives
– EPS/EBIT
• Implementation Issues
• Proposed annual objectives (goal) and polices
• Proposed procedures for evaluation
• Epilogue
• Current Performance
• Questions
• Resources Utilized

® 2007, Tony Gauvin, UMFK3
History of Apple
• 1976 – Apple started in a garage in Santa Clara, CA by Steve Wozniak
and Steve Jobs
– A easy to use PC for small computer users
• 1980– $117,000,000 in sales
– IPO
• 1983– Wozniak quits
– Jobs hires John Sculley From Pepsi Co. to become President of Apple
• 1984– Macintosh PC
® 2007, Tony Gauvin, UMFK4
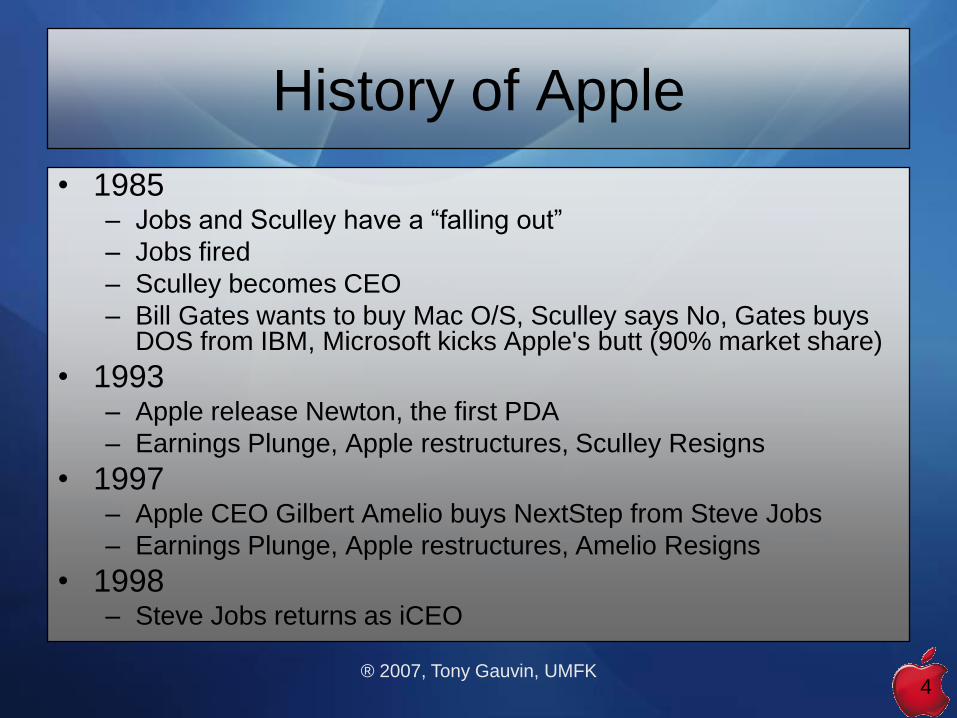
History of Apple
• 1985– Jobs and Sculley have a ―falling out‖
– Jobs fired
– Sculley becomes CEO
– Bill Gates wants to buy Mac O/S, Sculley says No, Gates buys DOS from IBM, Microsoft kicks Apple's butt (90% market share)
• 1993– Apple release Newton, the first PDA
– Earnings Plunge, Apple restructures, Sculley Resigns
• 1997– Apple CEO Gilbert Amelio buys NextStep from Steve Jobs
– Earnings Plunge, Apple restructures, Amelio Resigns
• 1998– Steve Jobs returns as iCEO

® 2007, Tony Gauvin, UMFK5
History of Apple
• 1998
– Jobs restructures Apple along two products lines
• Consumer ―i‖Mac
– ―i‖ for internet
• Professional ―Power‖Mac
– ―power‖ for power user
– Sales return, Brand emerges, Innovation rules
• USB, Firewire, Airport
• iPod and iTunes
– Stock price takes off like a rocket!
® 2007, Tony Gauvin, UMFK6
Lesson learned
+ =
® 2007, Tony Gauvin, UMFK7
2004 Vision Statement
Apple ignited the personal computer revolution in
the 1970s with the Apple II and reinvented the
personal computer in the 1980s with the
Macintosh. Apple is committed to bringing the
beast personal computing experience to students,
educators, creative professional, and consumers
around the world through its innovative hardware,
software, and Internet offerings

® 2007, Tony Gauvin, UMFK8
2004 Mission
Apple Computer is committed to protecting the environment, health and safety of our employees, customers and the global communities where we operate. We recognize that by integrating sound environmental, health and safety management practices into all aspects of our business, we can offer technologically innovative products and services while conserving and enhancing resources for future generations. Apple strives for continuous improvement in our environmental, health and safety management systems and in the environmental quality of our products, processes and services.
® 2007, Tony Gauvin, UMFK9
2004 Strategies
• Market Penetration
– Branding
– Niche player
• New Product Development
– Speech recognition
– Virtual reality

® 2007, Tony Gauvin, UMFK10
2004 objectives
• Double market Share from 5% to 10%
• Remain as the most profitable computer
company in the industry

® 2007, Tony Gauvin, UMFK11
2004 Issues
• How can apple best capitalize on the needs of the business world for a safer, virus-free, worm-free system?
• Should Apple enter the consumer electronics business like Dell and Gateway did?
• Should Apple remain a lone wolf in Operating Systems or adopt a cross-platform format compatible with Windows and Intel
• How much emphasis should Apple place on developing the next generation of voice recognition computers?

® 2007, Tony Gauvin, UMFK12
A new vision
To become the global
leader in computer and
digital music products.
® 2007, Tony Gauvin, UMFK13
A New Mission
• The Apple commitment to excellence is its mission to provide computers and service (2) for people (1) that meet the highest standards of value and reliability. Apple is one of the leaders in the computer industry and produces some of the best-selling computers and digital music products in the world (3). Apple provides the highest level of quality and value for our customers (7). Those are timeless fundamentals. We also apply innovative technology to our core business (4) to make our products irresistible to customers, beneficial to society, and profitable to our company (5). We strive to provide additional opportunities for growth and enrichment of company personnel while maintaining a work environment for all employees (9) that encourages personal commitment and participation in support of achieving excellence. We are committed to being a good corporate citizen, and being openly honest with all of our stakeholders (6). We support activities that enable people to improve their lives and reinforce their commitment to society (8).

® 2007, Tony Gauvin, UMFK14
Apple’s New Mission
The new mission answers the following questions 1. Customers: Who are the firm’s customers?
2. Products or services: What are the firm’s major products?
3. Markets: Geographically, where does the firm compete?
4. Technology: Is the firm technologically current?
5. Concern for survival, growth, and profitability: Is the firm committed to growth and financial soundness?
6. Philosophy: What are the basic beliefs, values, aspirations, and ethical priorities of the firm?
7. Self-concept: What is the firm’s distinctive competence or major competitive advantage?
8. Concern for public image: Is the firm responsive to social, community, and environmental concerns?
9. Concern for employees: Are employees a valuable asset of the firm?
® 2007, Tony Gauvin, UMFK15
External Audit (Opportunities)
1. Increase in worms and viruses on PCs.
2. Large population (Gen X & Y) which are extremely individualistic and name brand conscious.
3. Government crackdown on pirating music off the Internet.
4. Much of the world is still without computers.
5. People enjoy small electronic gadgets.

® 2007, Tony Gauvin, UMFK16
External Audit (Threats)
1. Companies not seeing Apple as compatible with their software.
2. Dell and HP are major competitors.
3. Increasing competition with music downloads.
4. Competition produces similar products at often half the price.
5. The population at large unwilling to use Macintosh.

® 2007, Tony Gauvin, UMFK17
Apple CPM
Apple HP Dell
Critical Success
Factors
Weight Rating Weighted
Score
Rating Weighted
Score
Rating Weighted
Score
Market Share
Price
Financial Position
Product Quality
Consumer Loyalty
Advertising
Management
Global Expansion
Innovation
Web Development
0.10
0.10
0.15
0.15
0.15
0.04
0.06
0.06
0.14
0.05
2
2
3
4
4
4
4
2
4
3
0.20
0.20
0.45
0.60
0.60
0.16
0.24
0.12
0.56
0.15
3
3
4
3
2
2
3
2
2
2
0.30
0.30
0.60
0.45
0.30
0.08
0.18
0.12
0.28
0.10
4
4
3
3
3
3
3
3
2
3
0.40
0.40
0.45
0.45
0.45
0.12
0.18
0.18
0.28
0.15
Total 1.00 3.28 2.71 3.06

® 2007, Tony Gauvin, UMFK18
Apple EFE
Key External Factors Weight Rating Weighted
Score
Opportunities
Increase in worms and virus on PCs. 0.15 4 0.60
Large population (Gen X & Y) which are extremely
individualistic and name brand conscious.
0.15 4 0.60
Government crackdown on pirating music off the Internet. 0.05 4 0.20
Much of the world is still without computers. 0.10 2 0.20
People enjoy small electronic gadgets. 0.10 4 0.40
Threats
Companies not seeing Apple as compatible with their
software.
0.10 2 0.20
Dell and HP are major competitors. 0.10 3 0.30
Increasing competition with music downloads. 0.05 4 0.20
Competition produces similar products at often half the
price.
0.10 3 0.30
The population at large unwilling to use Macintosh. 0.10 2 0.20
TOTAL 1.00 3.20

® 2007, Tony Gauvin, UMFK19
Consolidated Balance Sheet
® 2007, Tony Gauvin, UMFK20
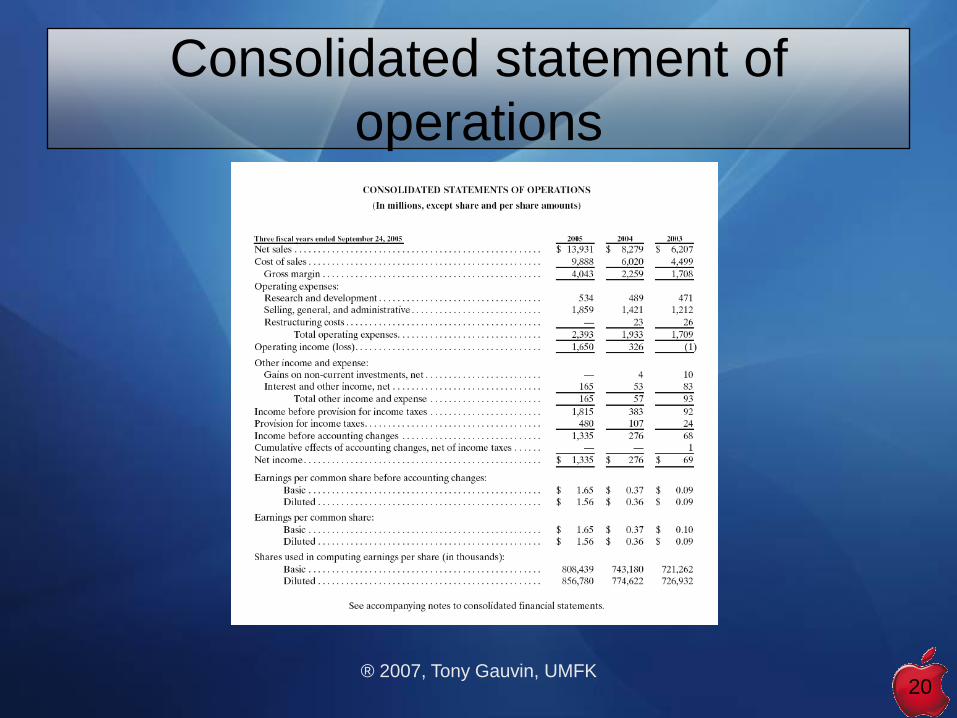
Consolidated statement of
operations
® 2007, Tony Gauvin, UMFK21
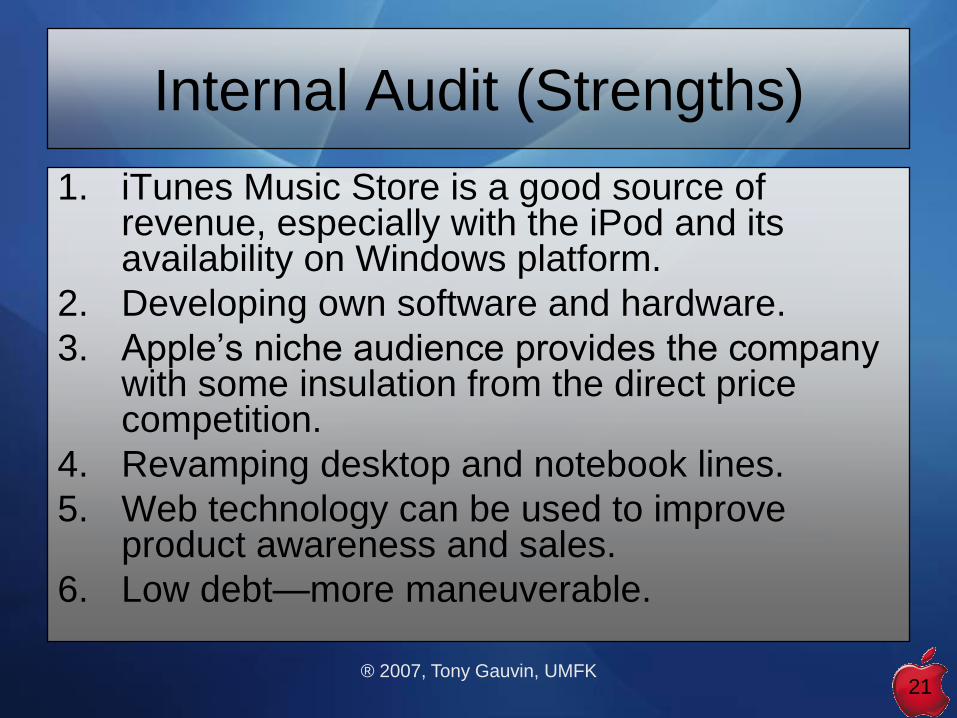
Internal Audit (Strengths)
1. iTunes Music Store is a good source of revenue, especially with the iPod and its availability on Windows platform.
2. Developing own software and hardware.
3. Apple’s niche audience provides the company with some insulation from the direct price competition.
4. Revamping desktop and notebook lines.
5. Web technology can be used to improve product awareness and sales.
6. Low debt—more maneuverable.

® 2007, Tony Gauvin, UMFK22
Internal Audit (weaknesses)
1. Weak relationship with Intel and
Microsoft.
2. Weak presence globally.
3. Dependency on new product launches.
4. Weak presence in markets other than
education and publishing.
5. Slow turnaround on high demand
products.
® 2007, Tony Gauvin, UMFK23
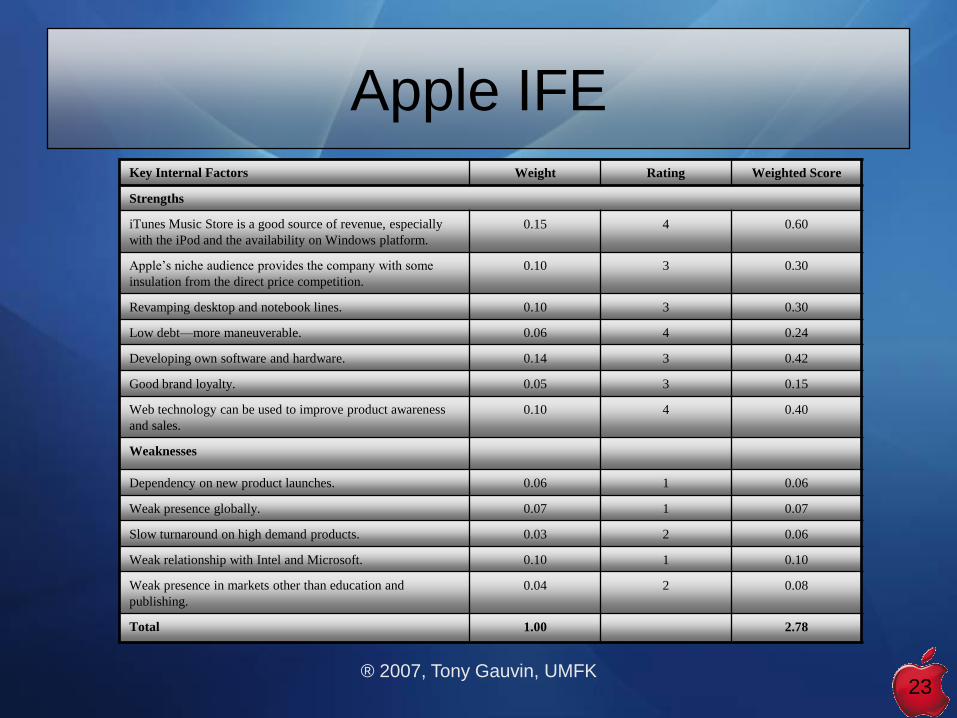
Apple IFE Key Internal Factors Weight Rating Weighted Score
Strengths
iTunes Music Store is a good source of revenue, especially
with the iPod and the availability on Windows platform.
0.15 4 0.60
Apple’s niche audience provides the company with some
insulation from the direct price competition.
0.10 3 0.30
Revamping desktop and notebook lines. 0.10 3 0.30
Low debt—more maneuverable. 0.06 4 0.24
Developing own software and hardware. 0.14 3 0.42
Good brand loyalty. 0.05 3 0.15
Web technology can be used to improve product awareness
and sales.
0.10 4 0.40
Weaknesses
Dependency on new product launches. 0.06 1 0.06
Weak presence globally. 0.07 1 0.07
Slow turnaround on high demand products. 0.03 2 0.06
Weak relationship with Intel and Microsoft. 0.10 1 0.10
Weak presence in markets other than education and
publishing.
0.04 2 0.08
Total 1.00 2.78
® 2007, Tony Gauvin, UMFK24
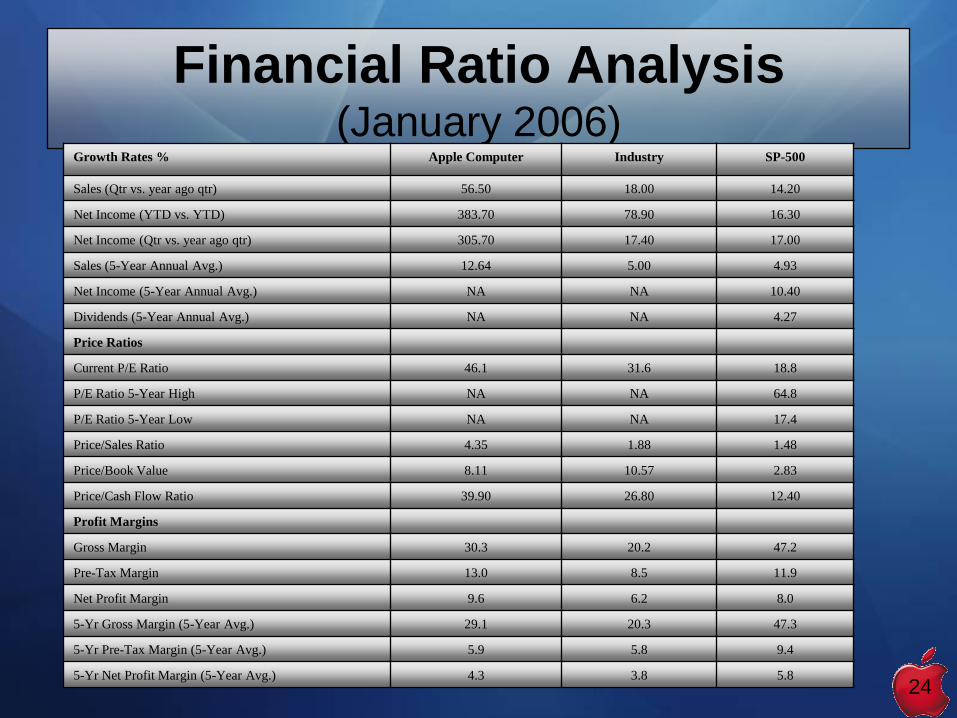
Financial Ratio Analysis (January 2006)
Growth Rates % Apple Computer Industry SP-500
Sales (Qtr vs. year ago qtr) 56.50 18.00 14.20
Net Income (YTD vs. YTD) 383.70 78.90 16.30
Net Income (Qtr vs. year ago qtr) 305.70 17.40 17.00
Sales (5-Year Annual Avg.) 12.64 5.00 4.93
Net Income (5-Year Annual Avg.) NA NA 10.40
Dividends (5-Year Annual Avg.) NA NA 4.27
Price Ratios
Current P/E Ratio 46.1 31.6 18.8
P/E Ratio 5-Year High NA NA 64.8
P/E Ratio 5-Year Low NA NA 17.4
Price/Sales Ratio 4.35 1.88 1.48
Price/Book Value 8.11 10.57 2.83
Price/Cash Flow Ratio 39.90 26.80 12.40
Profit Margins
Gross Margin 30.3 20.2 47.2
Pre-Tax Margin 13.0 8.5 11.9
Net Profit Margin 9.6 6.2 8.0
5-Yr Gross Margin (5-Year Avg.) 29.1 20.3 47.3
5-Yr Pre-Tax Margin (5-Year Avg.) 5.9 5.8 9.4
5-Yr Net Profit Margin (5-Year Avg.) 4.3 3.8 5.8

® 2007, Tony Gauvin, UMFK25
Financial Ratio Analysis (January 2006)
Financial Condition
Debt/Equity Ratio 0.00 0.06 1.06
Current Ratio 3.0 1.5 1.4
Quick Ratio 2.6 1.2 0.9
Interest Coverage NA NA 3.5
Leverage Ratio 1.5 2.9 5.7
Book Value/Share 8.86 3.50 13.26
Investment Returns %
Return on Equity 17.9 34.6 15.3
Return on Assets 11.6 12.0 2.7
Return on Capital 17.9 32.6 7.4
Return on Equity (5-Year Avg.) 6.9 17.0 11.9
Return on Assets (5-Year Avg.) 4.4 7.1 2.0
Return on Capital (5-Year Avg.) 6.7 15.7 5.6
Management Efficiency
Income/Employee 90,000 63,000 29,000
Revenue/Employee 941,000 1 Mil 367,000
Receivable Turnover 16.7 12.2 7.7
Inventory Turnover 73.0 66.8 7.8
Asset Turnover 1.4 2.1 0.4

® 2007, Tony Gauvin, UMFK26
Financial Trends Date Avg. P/E Price/Sales Price/Book Net Profit Margin (%)
2005 23.5 3.21 6 9.6
2004 40.6 1.83 2.99 3.3
2003 90.1 1.22 1.8 1.1
2002 111 0.91 1.27 1.1
2001 NA 1.02 1.39 -0.7
Date Book Value/ Share Debt/Equity ROE (%) ROA (%) Interest Coverage
2005 $8.94 0 17.9 11.6 NA
2004 $6.48 0 5.4 3.4 NA
2003 $5.76 0 1.6 NA NA
2002 $5.70 0.08 1.6 NA NA
2001 $5.59 0.08 NA -0.6 N

® 2007, Tony Gauvin, UMFK27
Apple Stock Performance
http://moneycentral.msn.com/investor/charts/charting.asp?symbol=AAPL

® 2007, Tony Gauvin, UMFK28
Apple Net Worth
(January 2006 in millions)
1. Stockholders’ Equity + Goodwill = 7,466 + 69 $ 7,535
2. Net Income x 5 = $1,355 x 5= $ 6,775
3. Share price = $72.00/EPS(1.56) = 46.15 x Net Income $1,335 = $ 61,610
4. Number of Shares Outstanding x Share Price = 842 x $72.00 = $ 60,624
Method Average $34,136
® 2007, Tony Gauvin, UMFK29
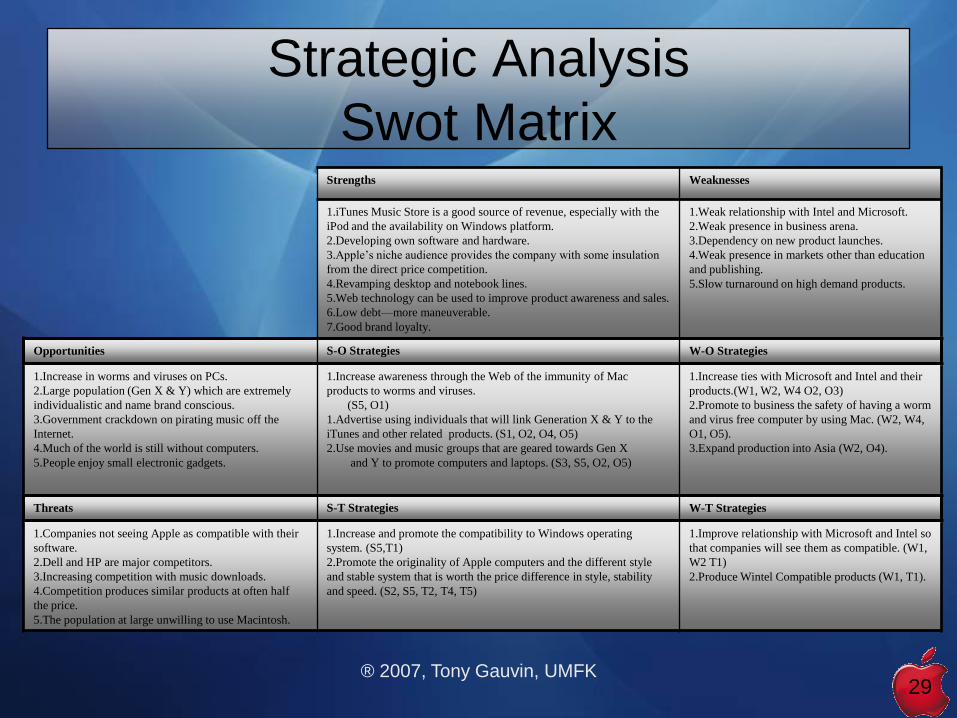
Strategic Analysis
Swot MatrixStrengths Weaknesses
1.iTunes Music Store is a good source of revenue, especially with the
iPod and the availability on Windows platform.
2.Developing own software and hardware.
3.Apple’s niche audience provides the company with some insulation
from the direct price competition.
4.Revamping desktop and notebook lines.
5.Web technology can be used to improve product awareness and sales.
6.Low debt—more maneuverable.
7.Good brand loyalty.
1.Weak relationship with Intel and Microsoft.
2.Weak presence in business arena.
3.Dependency on new product launches.
4.Weak presence in markets other than education
and publishing.
5.Slow turnaround on high demand products.
Opportunities S-O Strategies W-O Strategies
1.Increase in worms and viruses on PCs.
2.Large population (Gen X & Y) which are extremely
individualistic and name brand conscious.
3.Government crackdown on pirating music off the
Internet.
4.Much of the world is still without computers.
5.People enjoy small electronic gadgets.
1.Increase awareness through the Web of the immunity of Mac
products to worms and viruses.
(S5, O1)
1.Advertise using individuals that will link Generation X & Y to the
iTunes and other related products. (S1, O2, O4, O5)
2.Use movies and music groups that are geared towards Gen X
and Y to promote computers and laptops. (S3, S5, O2, O5)
1.Increase ties with Microsoft and Intel and their
products.(W1, W2, W4 O2, O3)
2.Promote to business the safety of having a worm
and virus free computer by using Mac. (W2, W4,
O1, O5).
3.Expand production into Asia (W2, O4).
Threats S-T Strategies W-T Strategies
1.Companies not seeing Apple as compatible with their
software.
2.Dell and HP are major competitors.
3.Increasing competition with music downloads.
4.Competition produces similar products at often half
the price.
5.The population at large unwilling to use Macintosh.
1.Increase and promote the compatibility to Windows operating
system. (S5,T1)
2.Promote the originality of Apple computers and the different style
and stable system that is worth the price difference in style, stability
and speed. (S2, S5, T2, T4, T5)
1.Improve relationship with Microsoft and Intel so
that companies will see them as compatible. (W1,
W2 T1)
2.Produce Wintel Compatible products (W1, T1).

® 2007, Tony Gauvin, UMFK30
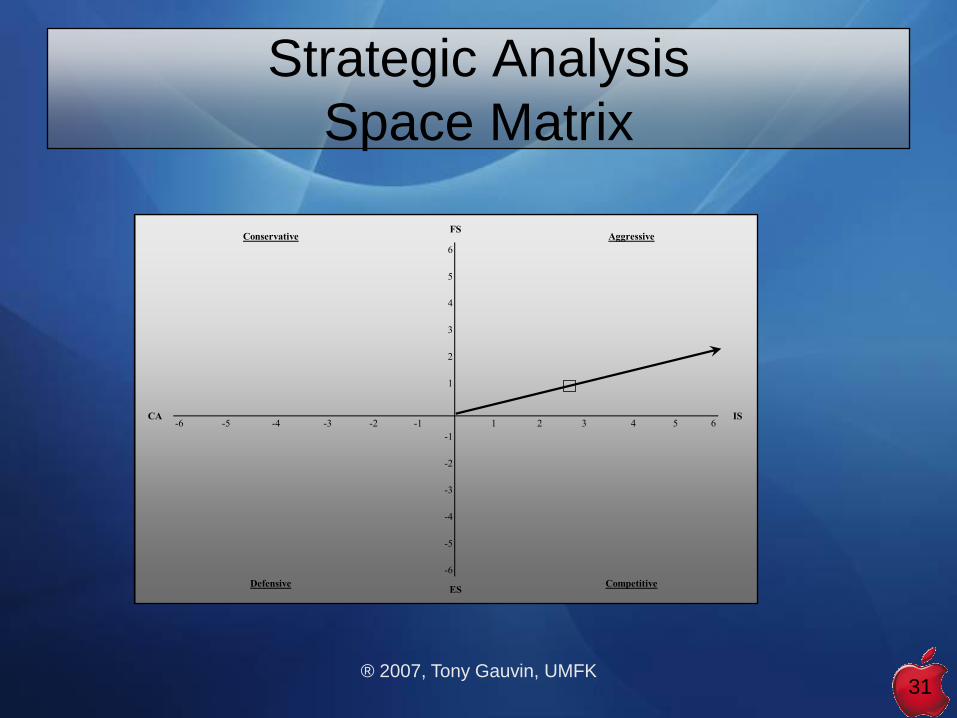
Strategic Analysis
Space Matrix
Financial Strength rating is 1 (worst) to 6 (best) Ratings
1 3.0
2 3.0
3 4.0
4 5.0
5 5.0
Industry Strength rating is 1 (worst) to 6 (best) FS Total 20.0
1 4.0
2 4.0
3 5.0
4 2.0
5 3.0
Environmental Stability rating is -1 (best) to -6 (worst) IS Total 18.0
1 -2.0
2 -5.0
3 -2.0
4 -6.0
5 -2.0
Competitive advantage rating is -1 (best) to -6 (worst) ES Total -17.0
1 -5.0
2 -1.0
3 -1.0
4 -1.0
5 -2.0
CS total -10.0
Leverage
Working Capital
Liquidity
Return on Investment
3 Year NEW income
Growth Potential
Profit Potential
Financial Stability
Ease of Entry into Market
Labor Cost
Rate of Inflation
Technological Changes
Price elasticity of Demand
Competitive Pressure
Barriers to Entry into Market
Market Share
Product Quality
Customer Laylaity
Technological Know-How
Control over Suppliers and Ditribuors
® 2007, Tony Gauvin, UMFK31
Strategic Analysis
Space Matrix
6
5
4
3
2
1
-6 -5 -4 -3 -2 -1 1 2 3 4 5 6
-1
-2
-3
-4
-5
-6
IS
ES
CA
FSConservative Aggressive
Defensive Competitive

® 2007, Tony Gauvin, UMFK32
Strategic Analysis
Grand Strategy Matrix
Rapid Market Growth
Quadrant II Quadrant I
Strong
Competitive
Position
Slow Market Growth
Weak
Competitive
Position
Quadrant III Quadrant IV
® 2007, Tony Gauvin, UMFK33
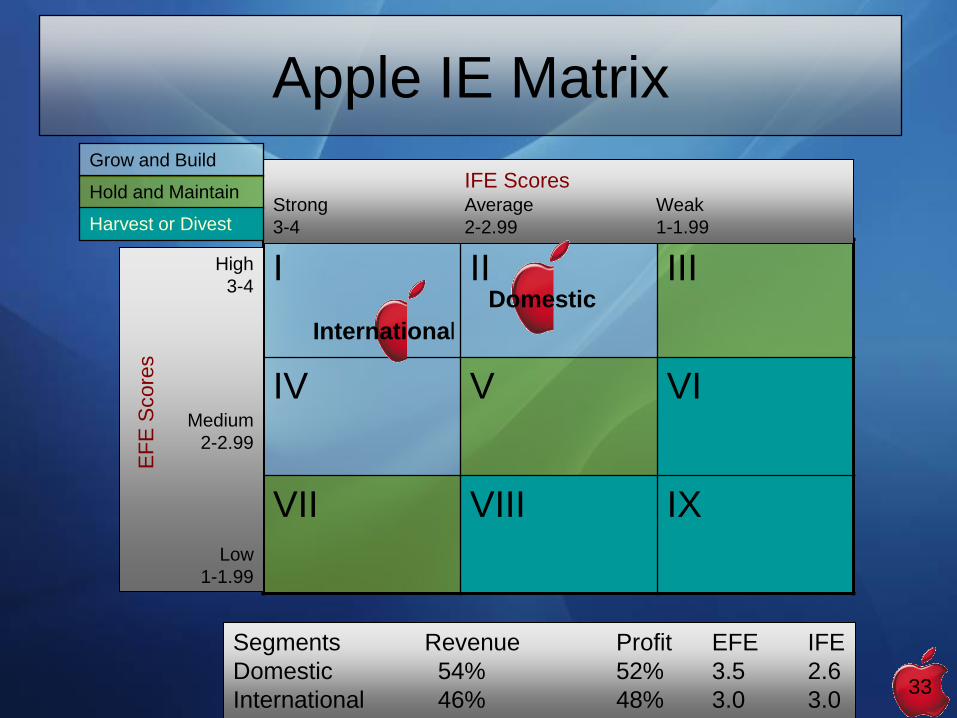
Apple IE Matrix
I II III
IV V VI
VII VIII IX
IFE ScoresStrong Average Weak
3-4 2-2.99 1-1.99
High
3-4
Medium
2-2.99
Low
1-1.99
EF
E S
core
sGrow and Build
Hold and Maintain
Harvest or Divest
Segments Revenue Profit EFE IFE
Domestic 54% 52% 3.5 2.6
International 46% 48% 3.0 3.0
International
Domestic

® 2007, Tony Gauvin, UMFK34
Dogs
IV
Cash Cows
III
Question Marks
I
Stars
II
High
1.0
Medium
.50
Low
0.0
High
+20
Low
-20
Medium
0
Segments Revenue Profit Growth Rate Relative Market Share
Domestic 54% 52% 17 0.3
International 46% 48% 5 0.2
Domestic
International
Apple BCG Matrix

® 2007, Tony Gauvin, UMFK35
Matrix Analysis
Alternative Strategies BCG IE SPACE GRAND COUNT
Forward Integration X X 2
Backward Integration X X 2
Horizontal Integration X X 2
Market Penetration X X X 3
Market Development X X X 3
Product Development X X X X 4
Concentric Diversification X X 2
Conglomerate Diversification X X 2
Horizontal Diversification X X 2
Joint Venture X 1
Retrenchment
Divestiture X 1
Liquidation

® 2007, Tony Gauvin, UMFK36
Apple QSPM
Strategic Alternatives
Key Internal Factors Weight Produce Wintel
compatible products
Expand production into
Asia
Strengths AS TAS AS TAS
iTunes Music Store is a good source of revenue, especially with the iPod
and the availability on Windows platform.
0.15 4.00 0.60 3.00 0.45
Apple’s niche audience provides the company with some insulation from
the direct price competition.
0.10 --- --- --- ---
Revamping desktop and notebook lines. 0.10 --- --- --- ---
Low debt—more maneuverable. 0.06 1.00 0.06 4.00 0.24
Developing own software and hardware. 0.14 --- --- --- ---
Good brand loyalty. 0.05 4.00 0.20 3.00 0.15
Web technology can be used to improve product awareness and sales. 0.10 4.00 0.40 3.00 0.30
Weaknesses
Dependency on new product launches. 0.06 --- --- --- ---
Weak presence in business arena. 0.07 1.00 0.07 3.00 0.21
Slow turnaround on high demand products. 0.03 --- --- --- ---
Weak relationship with Intel and Microsoft. 0.10 4.00 0.40 1.00 0.10
Weak presence in markets other than education and publishing. 0.04 2.00 0.14 4.00 0.28
SUBTOTAL 1.00 1.87 1.73

® 2007, Tony Gauvin, UMFK37
Apple QSPM
Key External Factors Weight Produce Wintel
compatible products
Expand production into
Asia
Opportunities TAS AS TAS
Increase in worms and virus on PCs. 0.15 1.00 0.15 3.00 0.45
Large population (Gen X & Y) which are extremely individualistic and name
brand conscious.
0.15 1.00 0.15 4.00 0.60
Government crackdown on pirating music off the Internet. 0.05 1.00 0.05 4.00 0.20
Much of the world is still without computers. 0.10 1.00 0.10 4.00 0.40
People enjoy small electronic gadgets. 0.10 --- --- --- ---
Threats
Companies not seeing Apple as compatible with their software. 0.10 4.00 0.40 2.00 0.20
Dell and HP are major competitors. 0.10 1.00 0.10 3.00 0.30
Increasing competition with music downloads. 0.05 --- --- --- ---
Competition produces similar products at often half the price. 0.10 --- --- --- ---
The population at large unwilling to use Macintosh. 0.10
SUBTOTAL 1.00 0.95 2.15
SUM TOTAL ATTRACTIVENESS SCORE 2.83 3.88
® 2007, Tony Gauvin, UMFK38
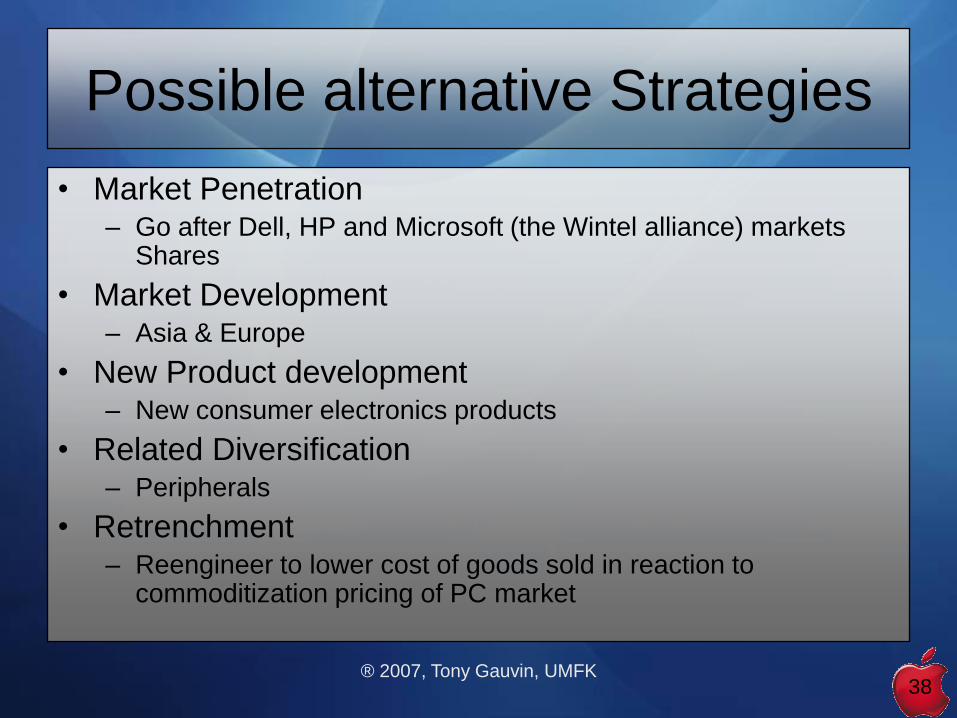
Possible alternative Strategies
• Market Penetration– Go after Dell, HP and Microsoft (the Wintel alliance) markets
Shares
• Market Development– Asia & Europe
• New Product development– New consumer electronics products
• Related Diversification– Peripherals
• Retrenchment– Reengineer to lower cost of goods sold in reaction to
commoditization pricing of PC market

® 2007, Tony Gauvin, UMFK39
Recommendations
• Strategy 1– Open twenty computer retail stores (not just peripherals and
accessories). Apple currently operates stores throughout the United States with only peripherals and accessories for their computers. Adding the hardware should generate more hands-on awareness and use already established locations.
– This will increase product accessibility for those who wish to view items other than just accessories and increase awareness of the originality of Apple’s products.
– Two percent increase in sales representatives for the computer hardware.
– Estimated cost of $ 5 million per store = $100 Million Total.

® 2007, Tony Gauvin, UMFK40
Recommendations
• Strategy 2– Expand into the Asian market over a five-year period by building
a manufacturing facility and headquarters in Hong Kong and expanding sales throughout Asia. Estimated cost $5 billion.
• Strategy 3– Add more features to current products including new iPod,
Shuffle, and Macintosh enhancements and power.
– $50 million is the estimated cost for Research and Development.
• While it is usually prudent to embark on just one strategy at a time, Apple cash reserves (~$8 billion) and managerial talents (Steve Jobs) makes embarking on 3 strategies at one time is not only possible but recommended.
® 2007, Tony Gauvin, UMFK41
EPS/EBIT
• $ Amount Needed: $5,100 M
– Strategy 1 & 2
• Stock Price: $75
• Tax Rate: 26%
• Interest Rate: 5% (2006)
• # Shares Outstanding: 842M

® 2007, Tony Gauvin, UMFK42
EPS/EBIT
Recession Normal Boom Recession Normal Boom
EBIT $500,000,000 $1,500,000,000 $3,000,000,000 $500,000,000 $1,500,000,000 $3,000,000,000
Interest 0 0 0 257,500,000 257,500,000 257,500,000
EBT 500,000,000 1,500,000,000 3,000,000,000 242,500,000 1,242,500,000 2,742,500,000
Taxes 130,000,000 390,000,000 780,000,000 63,050,000 323,050,000 713,050,000
EAT 370,000,000 1,110,000,000 2,220,000,000 179,450,000 919,450,000 2,029,450,000
# Shares 910,666,667 910,666,667 910,666,667 842,000,000 842,000,000 842,000,000
EPS 0.41 1.22 2.44 0.21 1.09 2.41
Common Stock Financing Debt Financing
Recession Normal Boom Recession Normal Boom
EBIT $500,000,000 $1,500,000,000 $3,000,000,000 $500,000,000 $1,500,000,000 $3,000,000,000
Interest 77,250,000 77,250,000 77,250,000 180,250,000 180,250,000 180,250,000
EBT 422,750,000 1,422,750,000 2,922,750,000 319,750,000 1,319,750,000 2,819,750,000
Taxes 109,915,000 369,915,000 759,915,000 83,135,000 343,135,000 733,135,000
EAT 312,835,000 1,052,835,000 2,162,835,000 236,615,000 976,615,000 2,086,615,000
# Shares 890,066,667 890,066,667 890,066,667 862,600,000 862,600,000 862,600,000
EPS 0.35 1.18 2.43 0.27 1.13 2.42
70 Percent Debt - 30 Percent Stock70 Percent Stock - 30 Percent Debt
® 2007, Tony Gauvin, UMFK43
Implementation Issues
• Moving production overseas– Unsettling for current workforce
– MIS Integration problems
– Change in culture
– May damage brand (Made in USA)
– Environmental outlook
• New marketing strategies– Paradox of marketing to deficiencies of Wintel platform while
becoming cross platform capable
• Forward integration issues– Do we have the talent to become direct sellers
– Cross selling competitors peripherals >> Brand Dilution?
® 2007, Tony Gauvin, UMFK44
Proposed annual objectives (goal)
and polices• Double sales revenue in 3 years
– 1st year 50%, 2 year 25, 3 year 25%
– Write division polices stating exact gains and marketing approaches to achieve gains
• Reduce unit cost of goods sold by 10% annually for next 3 years– Leverage low cost labor overseas
• Introduce one new consumer product each year– Provide adequate funding to R&D
– Provide funding for market research
– Insure strong communication ties between marketing and R&D
• Either provide functional enhancements to existing products each year or obsolesce product
– Assign R&D project teams to each existing product
– Have market research produce product maturity curves for existing products
• Create Chief scientist position on Corporate Board to reflect the importance of R&D to Apple Computer

® 2007, Tony Gauvin, UMFK45
Proposed procedures for
evaluation
• Qtr & Yearly financial reports
• Track Industry & market Reponses to new
product development
• Balanced Scorecard
• Yearly strategic meeting of division
management and corporate management

® 2007, Tony Gauvin, UMFK46
Epilogue
• 2006– iPods add Video
– Content from Disney, ABC, ESPN, SOAPnet
– Stock soars by 120%
– iPod morphs to• Shuffle
• Nano
– Goes to Intel Architecture
– Sales increase by 45%
– Gross margin increase by 8%
• 2007 – iPhone
– Sales predicted to increase by 35%
– Gross profit margin predicted to increase by 8%

® 2007, Tony Gauvin, UMFK47
Current Stock Performance
http://moneycentral.msn.com/investor/charts/charting.asp?symbol=AAPL

® 2007, Tony Gauvin, UMFK48
Resources
• Case Notes – Forest David; Francis Marion University
• Form 10-K SEC Filing, Sept. 25, 2005
• Datamonitor– SWOT Apple 2004 & 2005
– PCs in the United States 2005
– Consumer Electronics in the United States 2005
– Market Watch
• Apple: Unix for the people, Unix for the masses 2005
• Value line Investment survey– Apple 2007
– Computer Peripherals 2007

® 2007, Tony Gauvin, UMFK49
Questions
http://seriouslygood.kdweeks.com/images/apple-question.gif