appendixes: using high school data to predict college
TRANSCRIPT

Appendix A. About the study
Appendix B. Methods
Appendix C. Supporting analyses
Appendix D. Other analyses
See https://go.usa.gov/xAH3n for the full report.
Appendix A. About the study Prior research, particularly for the United States, has shown that earning a community college credential increases an individual’s likelihood of gaining stable employment, earning a living wage, and working in a higher-paying job than in a job that requires only a high school diploma (Minaya & Scott-Clayton, 2017). Research on early college success and college completion in the Republic of Palau has been limited, however. There is some evidence that Palau High School students might not be adequately prepared for success when they enter college, as the graduation rate from Palau Community College within three years is low (National Center for Education Statistics, 2020). The current study is intended to increase Palau Community College administrators’ and educators’ understanding of the factors associated with early college success and college completion by describing the high school academic preparation variables and other student characteristics of students in Palau who achieved early college success and completed college.
Data from the 2015 Census of Population, Housing, and Agriculture for Palau reveal that 78 percent of adults ages 25 and older graduated from high school or earned a high school equivalency credential, and 29 percent earned a college degree of some type (Republic of Palau Bureau of Budget and Planning, 2015). Improving college completion rates is considered a priority for further success in Palau; as Palau’s Workforce Innovation and Opportunity Act plan states, “every Palauan needs at least a high school diploma or equivalent to succeed, and, in reality, will need skills and educational attainment that go beyond high school graduation” (U.S. Department of Education, 2015).
This appendix summarizes the research base used in developing this study. Prior research, most of it in the United States, might be only partially applicable to Palau because its education system and student population differ substantially from those of the United States. Despite that limitation, the current study identified college success outcomes and academic preparation and student characteristic variables of interest based on the research literature.
Community college outcomes Achievement in college courses, as measured by grade point average, is regularly used as a tool to assess students’ college success in the United States (Adelman, 1999; Cabrera et al., 2003; Chen & Carroll, 2005; DesJardins et al., 2002; Herzog, 2005; Moore & Shulock, 2009). Of particular interest to this study is Herzog’s (2005) finding that students' grade point average in their first year of college predicted their persistence to a second year of college
REL 2021–059 A-1
APPENDIXES February 2021
Regional Educational Laboratory Pacific
At McREL International
Using High School Data to Predict College Success in Palau

enrollment and to degree completion in the United States. The current study used earning a grade point average of 2.0 or higher as a binary outcome (yes/no) representing early college success, as Palau Community College requires students to maintain a grade point average of 2.0 or higher to earn a credential or degree (Palau Community College, n.d. a, b, c, d).
Research in the United States has found that students are most likely to drop out of college in their first or second year (Bradburn, 2002; Horn, 1998; Stephan et al., 2015). Likewise, students who persist past their first year are significantly more likely to complete a college degree (Horn, 1998). For example, Bradburn (2002) found that among students who enrolled in public two-year institutions in the United States, 44 percent left within three years without a credential: 24 percent in the first year, 13 percent in the second year, and 7 percent in the third year. Additionally, Crosta (2014) found a strong positive relationship between continuous enrollment and credential completion. The current study examined the extent to which these trends are also found in Palau, using completion of an associate degree or a certificate within three years of first enrollment in Palau Community College as one of the success outcomes of interest. This metric was selected because more than half of students who complete a degree at a two-year institution in the United States take longer than two years on average to finish their degree (Horn, 2010). The three-year graduation rate thus seemed to be an appropriate metric to assess college completion rates among Palau High School graduates.
High school academic preparation Prior studies in the United States identify several high school academic preparation variables as predictive of early college success or college completion. For example, earning credit in higher-level math courses in high school has been shown to be associated with college success outcomes, including college completion (Adelman, 2006; Jonas et al., 2012). Algebra is termed a “gateway” course, with successful completion earlier in a student’s academic career better preparing him or her for later success in school (Matthews & Farmer, 2008; Walston & McCarroll, 2010). Additionally, completing Algebra I in an early grade allows students more time to enroll in higher-level math courses. However, simply requiring more higher-level math courses and enrolling more students in Algebra I earlier in their academic careers are not enough to yield positive results. Research in the Northern Mariana Islands suggests that proper student supports are also important and that requiring an additional year of math, if accompanied by proper student supports, could increase the number of high school students prepared for college coursework when they enter college (Herman et al., 2017).
High school grade point average has also been identified as a reliable predictor of college success outcomes in the United States, including first-year college grades (Geiser & Santelices, 2007; Noble & Sawyer, 2002), cumulative college grades, and college completion (Geiser & Santelices, 2007). A study of more than 60,000 community college students found that high school graduates with a higher grade point average were less likely to be identified as unprepared for credit-bearing coursework upon enrollment in a community college (Center for Community College Student Engagement, 2016).
Studies on the ability of state standardized test scores to predict college readiness have often found these tests to be a rigorous and valid yardstick for measuring student achievement and ability that translate into college success outcomes (Atkinson & Geiser, 2009; Porter & Polikoff, 2012; Wiley et al., 2010). Students in Palau take the locally designed Palau Achievement Test, which is administered during the spring semester of grades 4, 6, 8, 10, and 12 in English, Palauan studies, science, math, and social studies. The test results, reported as the percentage of questions that students answered correctly, are used to assess instructional effectiveness and whether students are meeting learning targets.
Other types of high school coursework have also been found to predict college outcomes. Participation in dual-enrollment courses (courses for which students can earn both high school and college credit) has also been found to be positively related to college outcomes such as enrollment, persistence, and grade point average (Hein et al.,
REL 2021–059 A-2

2013; Karp et al., 2007), including specifically for students entering two-year colleges (Fink et al., 2017). A variety of studies have found evidence that participation in career and technical education is positively related to college enrollment and to earning a postsecondary degree (Cellini, 2006; DeLuca et al., 2006; Fletcher & Zirkle, 2009; Karp & Hughes, 2008; Reese, 2008).
Being able to effectively use and understand the language of instruction is an important aspect of college readiness (García et al., 2008). In Palau a majority of public school students start their education in kindergarten as monolingual speakers of Palauan. Throughout the K–12 education system, students are instructed in both Palauan and English, but at Palau Community College instruction is only in English. Students who have not achieved an adequate level of English fluency might have worse academic outcomes in courses taught in English than students without such linguistic barriers (García et al., 2008). In addition to results on English language proficiency assessments, student performance in high school English courses can be an indicator of English language fluency.
Other student characteristics as control variables Along with high school academic preparation, this study considered other student characteristics as possible predictors of students’ early college success or college completion. While these student characteristics are mostly fixed, understanding the factors that predict postsecondary success—and those that do not—can motivate educators and administrators to take steps to better meet the needs of students. U.S. studies have found gender to be predictive of students’ college success (Aud et al., 2010, 2011; Ross et al., 2012). For example, Ross et al. (2012) found that, for nearly every year over the past four decades, a lower percentage of male students than of female students enrolled in college and eventually graduated. Race/ethnicity 1 may also be associated with students’ likelihood of succeeding in college (Musu-Gillette et al., 2017). A study of educational attainment data disaggregated by Asian American and Pacific Islander populations found lower rates of attainment of a bachelor’s degree among Southeast Asian American and Pacific Island Nation populations in the United States than among the total U.S. population (Museus, 2013). Variation in student outcomes within an institution has also been found by college cohort, because of a variety of factors including variation in faculty members, academic policies and curricula, and student generational differences. Education research studies frequently control for college cohort to account for variation attributed to these factors (Hodara & Cox, 2016; Stoker et al., 2018).
References Adelman, C. (1999). Answers in the toolbox: Academic intensity, attendance patterns, and bachelor’s degree attainment. U.S.
Department of Education. https://www2.ed.gov/pubs/Toolbox/toolbox.html.
Adelman, C. (2006). The toolbox revisited: Paths to degree completion from high school through college. Office of Vocational and Adult Education, U.S. Department of Education. http://www2.ed.gov/rschstat/research/pubs/toolboxrevisit/ toolbox.pdf.
Atkinson, R. C., & Geiser, S. (2009). Reflections on a century of college admissions tests. Educational Researcher, 38(9), 665– 676.
Aud, S., Fox, M. A., & KewalRamani, A. (2010). Status and trends in the education of racial and ethnic groups (NCES No. 2010-015). U.S. Department of Education, Institute of Education Sciences, National Center for Education Statistics. https://nces.ed.gov/pubsearch/pubsinfo.asp?pubid=2019038.
Aud, S., Hussar, W., Kena, G., Bianco, K., Frohlich, L., Kemp, J., et al. (2011). The condition of education 2011 (NCES No. 2011-033). U U.S. Department of Education, Institute of Education Sciences, National Center for Education Statistics. https://nces.ed.gov/pubsearch/pubsinfo.asp?pubid=2011033.
1 Student race/ethnicity was not examined in this study because of too little variation in data received (see appendix B for more details).
REL 2021–059 A-3

Bradburn, E. M. (2002). Short-term enrollment in postsecondary education: Student background and institutional differences in reasons for early departure, 1996–98 (NCES No. 2003–153). U.S. Department of Education, Institute of Education Sciences, National Center for Education Statistics. http://eric.ed.gov/?id=ED470227.
Cabrera, A. F., La Nasa, S. M., & Burkum, K. R. (2003, November). Pathways to a four-year degree: Determinants of degree completion among socioeconomically disadvantaged students. Paper presented at the Annual Meeting of the Association for Institutional Research.
Center for Community College Student Engagement. (2016). Expectations meet reality: The underprepared student and community colleges. The University of Texas at Austin, College of Education, Department of Educational Administration, Program in Higher Education Leadership.
Cellini, S. R. (2006). Smoothing the transition to college? The effect of Tech-Prep programs on educational attainment. Economics of Education Review, 25(4), 394–411.
Chen, X., & Carroll, C. D. (2005). First generation students in postsecondary education: A look at their college transcripts. U.S. Department of Education.
Crosta, P. (2014). Intensity and attachment: How the chaotic enrollment patterns of community college students relate to educational outcomes. Community College Review, 42(2), 118–142.
DeLuca, S., Plank, S., & Estacion, A. (2006). Does career and technical education affect college enrollment? National Research Center for Career and Technical Education, University of Minnesota.
DesJardins, S. L., McCall, B. P., Ahlburg, D. A., & Moye, M. J. (2002). Adding a timing light to the toolbox. Research in Higher Education, 43(1), 83–114.
Fink, J., Jenkins, D., & Yanagiura, T. (2017). What happens to students who take community college “Dual Enrollment” courses in high school? The Community College Research Center. https://ccrc.tc.columbia.edu/media/k2/attachments/what-happens-community-college-dual-enrollment-students.pdf.
Fletcher, E. C., & Zirkle, C. (2009). The relationship of high school curriculum tracks to degree attainment and occupational earnings. Career and Technical Education Research, 34(2), 81–102.
García, O., Kleifgen, J. A., & Falchi, L. (2008). From English Language Learners to emergent bilinguals. Equity Matters (Research Review No. 1). Columbia University. https://eric.ed.gov/?id=ED524002.
Geiser, S., & Santelices, M. V. (2007). Validity of high-school grades in predicting student success beyond the freshman year: High-school record vs. standardized tests as indicators of four-year college outcomes. University of California, Berkeley, Center for Studies in Higher Education. http://eric.ed.gov/?id=ED502858.
Hein, V., Smerdon, B., & Sambolt, M. (2013). Predictors of postsecondary success. College and Career Readiness and Success Center, American Institutes for Research.
Herman, P., Carreon, D., Scanlan, S., & Dandapani, N. (2017). Using high school data to understand college readiness in the Northern Mariana Islands (REL 2017–268). U.S. Department of Education, Institute of Education Sciences, National Center for Education Evaluation and Regional Assistance, Regional Educational Laboratory Pacific. http://ies.ed.gov/ncee/edlabs.
Herzog, S. (2005). Measuring determinants of student return vs. dropout/stopout vs. transfer: A first-to-second year analysis of new freshmen. Research in Higher Education, 46(8), 883–928.
Hodara, M., & Cox, M. (2016). Developmental education and college readiness at the University of Alaska (REL 2016–123). U.S. Department of Education, Institute of Education Sciences, National Center for Education Evaluation and Regional Assistance, Regional Educational Laboratory Northwest. http://ies.ed.gov/ncee/edlabs.
Horn, L. J. (1998). Stopouts or stayouts? Undergraduates who leave college in their first year (NCES No. 1999–087). U.S. Department of Education, Institute of Education Sciences, National Center for Education Statistics. https://nces.ed.gov/pubs99/1999087.pdf.
REL 2021–059 A-4
Horn, L. J. (2010). Tracking students to 200 percent of normal time: Effect on institutional graduation rates. U.S. Department of Education, Institute of Education Sciences, National Center for Education Statistics. http://nces.ed.gov/pubs2011/ 2011221.pdf.
Jonas, D., Dougherty, C., Herrera, A. W., LaTurner, J., Garland, M., & Ware, A. (2012). High school predictors of college readiness: Determinants of high school graduates’ enrollment and successful completion of first-year mathematics and English college courses in Virginia. Virginia Department of Education. http://www.doe.virginia.gov/instruction/ college_career_readiness/research/determinants_of_enrollment_and_completion_of_english_and_mathemathcs.pdf.
Karp, M. M., Calcagno, J. C., Hughes, K. L., Jeong, D. W., & Bailey, T. R. (2007). The postsecondary achievement of participants in dual enrollment: An analysis of student outcomes in two states. Columbia University Community College Research Center. http://eric.ed.gov/?id=ED498661.
Karp, M., & Hughes, K. (2008). Dual enrollment can benefit a wide range of students. Techniques, 83(7), 14–17.
Matthews, M. S., & Farmer, J. L. (2008). Factors affecting the Algebra I achievement of academically talented learners. Journal of Advanced Academics, 19(3), 472–501.
Minaya, V., & Scott-Clayton, J. (2017). Labor market trajectories for community college graduates: New evidence spanning the great recession (CAPSEE Working Paper). Center for the Analysis of Postsecondary Education and Employment. https://ccrc.tc.columbia.edu/media/k2/attachments/labor-markettrajectories-community-college-graduates-R1.pdf.
Moore, C., & Shulock, N. (2009). Student progress toward degree completion: Lessons from the research literature. Institute for Higher Education Leadership & Policy, California State University. http://lacccwc.com/CWEInternship/Documents/ LOWDL_Resources/R_Student_Progress_Toward_Degree_Completion1.pdf.
Museus, S. D. (2013). Asian Americans and Pacific Islanders: A national portrait of growth, diversity, and inequality. In S. D. Museus, D. C. Maramba, & R. T. Teranishi (Eds.), The misrepresented minority: New insights on Asian Americans and Pacific Islanders, and their implications for higher education (pp. 11–42). Stylus.
Musu-Gillette, L., de Brey, C., McFarland, J., Hussar, W., Sonnenberg, W., & Wilkinson-Flicker, S. (2017). Status and trends in the education of racial and ethnic groups 2017 (NCES 2017-051). U.S. Department of Education, National Center for Education Statistics. https://nces.ed.gov/pubsearch/pubsinfo.asp?pubid=2017051.
National Center for Education Statistics. (2020). Integrated Postsecondary Data System: Palau Community College. Institute of Education Sciences, National Center for Education Statistics. https://nces.ed.gov/ipeds/datacenter/institutionprofile. aspx?unitId=243647&goToReportId=6.
Noble, J., & Sawyer, R. (2002). Predicting different levels of academic success in college using high school GPA and ACT composite score. ACT Research Report Series. http://eric.ed.gov/?id=ED469746.
Palau Community College. (n.d. a). Associate of Applied Science Degree. https://pcc.palau.edu/academics/aas/.
Palau Community College. (n.d. b). Associate of Science Degree. https://pcc.palau.edu/academics/as/.
Palau Community College. (n.d. c). Associate of Technical Studies Degree. https://pcc.palau.edu/academics/ats/.
Palau Community College. (n.d. d). Associate of Arts Degree. https://pcc.palau.edu/academics/aa/.
Porter, A., & Polikoff, M. (2012). Measuring academic readiness for college. Educational Policy, 26(3), 394–417.
Reese, S. (2008). Doubling the opportunity for success. Techniques, 83(7), 18–21.
Republic of Palau Bureau of Budget and Planning. (2015). 2015 Census of Population, Housing, and Agriculture. http://palaugov.pw/wp-content/uploads/2017/02/2015-Census-of-Population-Housing-Agriculture-.pdf.
Ross, T., Kena, G., Rathburn, A., KewalRamani, A., Zhang, J., Kristapovich, P., et al. (2012). Higher education: Gaps in access and persistence study (NCES No. 2012-046). U.S. Department of Education, Institute of Education Sciences, National Center for Education Statistics. https://nces.ed.gov/pubs2012/2012046.pdf.
REL 2021–059 A-5

Stephan, J. L., Davis, E., Lindsay, J., & Miller, S. (2015). Who will succeed and who will struggle? Predicting early college success with Indiana’s Student Information System (REL 2015–078). U.S. Department of Education, Institute of Education Sciences, National Center for Education Evaluation and Regional Assistance, Regional Educational Laboratory Midwest. http://ies.ed.gov/ncee/edlabs.
Stoker, G., Mellor, L., & Sullivan, K. (2018). Trends in Algebra II completion and failure rates for students entering Texas public high schools (REL 2018–289). U.S. Department of Education, Institute of Education Sciences, National Center for Education Evaluation and Regional Assistance, Regional Educational Laboratory Southwest. http://ies.ed.gov/ncee/edlabs.
U.S. Department of Education. (2015). WIOA state plan for the Republic of Palau. https://www2.ed.gov/about/offices/ list/osers/rsa/wioa/state-plans/pl.pdf.
Walston, J., & McCarroll, J. C. (2010). Eighth-grade algebra: Findings from the eighth-grade round of the Early Childhood Longitudinal Study, Kindergarten class of 1998-99 (ECLSK): Statistics in Brief. (NCES No. 2010-016). U.S. Department of Education, Institute of Education Sciences, National Center for Education Statistics.
Wiley, A., Wyatt, J., & Camara, W. (2010). The development of a multidimensional college readiness index. (College Board Research Report No. 2010–3). Cascade Educational Consultants. http://www.cascadeeducationalconsultants.com/ resources/Blog/College-Readiness-Index.pdf.
REL 2021–059 A-6

Appendix B. Methods This appendix describes the study data and data sources and the steps used to link the data and ensure their accuracy.
Data sources Data for the study were provided by the Palau Ministry of Education and Palau Community College. The Palau Ministry of Education provided student-level data for all Palau High School students who graduated between spring 2013 and spring 2017; however, the analysis was restricted to the 387 students in the first three college cohorts of graduates (spring 2013, spring 2014, and spring 2015) because students in the 2016 and 2017 college cohorts had not been in college long enough to record their status on all three community college outcomes.
Palau Ministry of Education. The Palau Ministry of Education securely transmitted the raw Palau High School datasets electronically to the study team in two tab-delimited text files:
• Student enrollment, graduation, grade point average, and assessment results, which included Palau High School student identification information; Palau High School graduation date; demographic data on gender, race/ethnicity, and nationality;2 Palau High School grade point average; and Palau Achievement Test English and math scores.
• Student course transcripts, which included Palau High School student identification information, school year and grade in which a student enrolled in each course, course name, and grade each student earned in the course.
Palau Community College. Palau Community College provided student-level data for all Palau High School graduates who enrolled in Palau Community College between fall 2013 and fall 2018 and who enrolled in at least one credit-bearing course in their first semester. Raw data from Palau Community College were securely transmitted electronically to the study team as a single Microsoft Excel file with six worksheets, the following four of which included information pertaining to the current study:
• Student enrollment and demographic characteristics, which included students’ Palau Community College identification number, name, Palau High School graduation date, Palau Community College enrollment cohort, term of first enrollment in Palau Community College, Palau Community College graduation date, major, degree earned, demographic data (gender, race/ethnicity, and nationality), date of birth,3 grade point average in the first year, and retention to a second year.
• Credits attempted and earned per semester, which described the total number of credits earned in each semester in which a student was enrolled in Palau Community College.
• First-semester course placement, which described the first math and English course in which students were placed upon enrollment at Palau Community College.
• Student course transcripts, which described the course, grade earned, and number of credits in each course a student took at Palau Community College.
2 Race/ethnicity and nationality were not used in the analysis because there was very little variation. 3 Age was not used in the analysis because there was very little variation.
REL 2021–059 B-1

Data linking and merging Linking students’ high school data records to their college data records required several steps. The Palau Ministry of Education and Palau Community College provided unique student identification numbers in their raw data files. These identification numbers allowed for all high school datasets to be linked and all college datasets to be linked. However, because the identification numbers were unique to the two separate institutions, this did not allow for direct merging between the Palau Ministry of Education data and Palau Community College data.
The Palau Ministry of Education and Palau Community College provided student identifying information, including first, middle, and last names and birthdates, that enabled linking. Manual correction was sometimes needed to ensure proper linking. Student data in some datasets included additional suffixes or middle initials instead of full names. When this occurred, names were compared manually for similar birthdates and high school graduation dates, which were then used to link across the data files. While this process was successful in linking all Palau Community College students with a Palau High School graduation date, this matching approach could have introduced some error.
After the Palau Ministry of Education data and Palau Community College data were linked, the linked data were restructured so that each student’s high school and community college data were included in one row (rather than in several rows, as in some of the datasets received by the study team).
In total, the dataset included 387 students who graduated from Palau High School from spring 2013 through spring 2015, of which 234 students (61 percent) enrolled in one of the three Palau Community College cohorts studied (fall 2013 through fall 2015). The remaining 153 students were designated as nonenrollees. This group included all Palau High School graduates for whom there were no records of enrollment in the Palau Community College datasets and students who enrolled in Palau Community College later than the fall semester after their spring graduation from Palau High School.4 Most of the analyses used only the data for the 234 Palau High School graduates who enrolled in Palau Community College in the fall semester following their spring graduation from Palau High School and thus for whom data were available on the three college success outcomes of interest. However, the full dataset was used to explore whether there were observable differences in academic preparation and student characteristic variables between Palau Community College enrollees and nonenrollees (see figure B1 later in this appendix and table C1 in appendix C).
Data processing and cleaning This section describes the process used to generate the final analytic data file used in the analysis.
Reviewing high school data. The study team received high school datasets with data on courses and demographic characteristics for students who enrolled in Palau High School as far back as 2007. This included records for 387 students at Palau High School who graduated in the spring of 2013, spring of 2014, and spring of 2015, as these students could conceivably have enrolled in Palau Community College in the fall college cohorts examined.
The course information included enrollment and performance records for each Palau High School course, with each row containing information on a single course in which a student was enrolled while at Palau High School. These records were available for all 387 students for whom data on student characteristics were also available and were included in the next phase of data cleaning.
Addressing missing data. After merging the Palau Ministry of Education and Palau Community College datasets and restricting the resulting dataset to the three college cohorts of interest, the study team calculated the
4 Six students were reclassified as nonenrollees because their enrollment in Palau Community College occurred a year or more after their graduation from Palau High School; 238 students who were included in the enrollment files from Palau Community College but did not have a listed Palau High School graduation date in the files provided by Palau High School were excluded from the analysis.
REL 2021–059 B-2
percentage of students with missing records for each of the dependent and independent variables in the analysis. Two variables had missing data: grade point average in the first year of college and high school math grades. For college grade point average, the study team calculated values using other data in the dataset. For high school math grades, the study team imputed values for the 4.7 percent of the sample with missing data, as described below.
• Grade point average in the first year of college: Of the 234 Palau High School graduates from spring 2013 through spring 2015 who enrolled in Palau Community College in the fall after graduation, 71 (30 percent) had missing data on grade point average in their first year of college. To avoid unnecessarily removing students and shrinking an already small sample, the study team calculated the grade point average in the first year of college for these students using the course grades and credit information provided by Palau Community College. Some 59 of those students (83 percent) were missing data on grade point average because they dropped out during or after their first semester, and Palau Community College provided cumulative grade point averages only for students who remained enrolled until the end of their first year. All 59 of these students had enrolled in courses for at least three credits in their first semester and were enrolled past the date where they could drop the class without penalty. Fourteen of the 59 students did not earn any credit, and their cumulative grade point average was recorded as 0.0.
The remaining 45 students earned at least one credit in their first semester. To retain these students in the analysis of grade point average and maintain a consistent sample across the outcomes of interest, the study team calculated their grade point averages in the first semester of college using the course grades and credit information in the dataset received from Palau Community College. This broadened the operational definition of grade point average in the first year of college to represent students’ cumulative grade point average for all courses attempted within their first two semesters, regardless of whether they dropped out during the school year.5 An additional 12 students were missing a cumulative grade point average even though they were enrolled for the entire first year or longer and had accrued an average of 25 credits over their tenure at Palau Community College; their grade point averages were calculated using course-level information in the database.
• High school math course grades: Eleven of the 234 students (4.7 percent) were missing grades for Algebra I because they had completed that course in middle school; consequently, their first math course at Palau High School was Algebra II (7 students) or Geometry (4 students). All 11 students earned more than 70 percent of the possible points (a C or higher) in their more advanced math courses, so they were classified as having met the threshold of achieving more than 70 percent of possible points in Algebra I. Students who were missing Trigonometry grades were assumed to have opted not to take the advanced math course and were classified as students who did not achieve more than 70 percent and therefore did not earn any credits.
Community college outcome variables Grade point average of 2.0 or higher in the first year of college. The first outcome measure is a binary indicator equal to 1 for students who achieved a cumulative grade point average of 2.0 or higher in their first two semesters at Palau Community College and 0 for those who did not. The cutpoint of 2.0 was selected because that is the minimum grade point average required to graduate with an associate degree or certificate from Palau Community College. Cumulative grade point averages were calculated by averaging students’ course grades (measured on a
5 The correlation between college students’ fall semester grade point average and cumulative first-year grade point average is high (alpha = 0.84), which suggests that including students who did not have a spring semester grade point average would not significantly bias findings on the relationship between the high school academic preparation variables and students’ grade point average in their first year at Palau Community College.
REL 2021–059 B-3

4-point scale) in all elective and nonelective courses taken in the first two semesters at Palau Community College. The study team used student-level course transcript records provided by Palau Community College to calculate students’ cumulative grade point averages.
Persistence to a second year of college. The second outcome is a binary indicator equal to 1 for students who were still enrolled in Palau Community College in the fall semester of the academic year immediately following the academic year in which they first enrolled (for example, a student who first enrolled in Palau Community College in the fall of 2014 and was still enrolled in the fall of 2015). Students who did not remain enrolled in the fall semester after their first year were assigned a 0 value for this outcome. Course enrollment data provided by Palau Community College was used to determine students’ status on this outcome measure.
Completion of an associate degree or certificate within three years. The third outcome measure is a binary indicator equal to 1 for students who completed an associate degree or certificate within three years (36 months) of first enrollment. Data provided by Palau Community College included information on students’ date of first enrollment and date of graduation from a degree or certification program at Palau Community College. Students who did not remain enrolled in the fall semester after their first year along with students who did not complete a degree or certificate within three years were assigned a 0 value for this outcome.
High school academic preparation variables This section describes the high school academic preparation variables that are used in the analysis to predict the three community college success outcomes. The Palau Ministry of Education provided the student-level data required to construct these variables.
High school grade point average. High school grade point average for Palau High School students is reported on a conventional 4-point scale. Grade point averages were reported directly by the Palau Ministry of Education and are based on an unweighted average of all course grades, elective and nonelective, received in grades 9–12.
Palau Achievement Test. The Palau Ministry of Education provided student-level English language arts and math scores on the grade 12 Palau Achievement Test. Scores were reported as the percentage of questions answered correctly (0–100). The locally designed Palau Achievement Test is administered during the spring semester of grades 4, 6, 8, 10, and 12 in English, Palauan studies, science, math, and social studies. The results are used in assessing instructional effectiveness and identifying students who are meeting learning targets and those who are not.6
English course grades. Five variables identified the English courses in which a student enrolled in Palau High School and achieved a grade of C or higher. As of 2015, the high school graduation year for the study’s most recent cohort, Palau High School’s English pathway consisted of English I and English Reading and Writing in grade 9, English II in grade 10, English III in grade 11, and English IV in grade 12.
Math course grades. Four variables identified the math courses in which a student enrolled in Palau High School and achieved a passing grade of C or higher. As of 2015, the high school graduation year for the study’s most recent cohort, the school’s math pathway consisted of Applied Math in grade 9, Algebra I and Algebra II in grade 10, and Geometry in grade 11. Palau High School does not require math after grade 11 but does offer Trigonometry as an elective in grade 12. About 56 percent of Palau High School graduates earned credit in Trigonometry, which is lower than for the other math courses in part because it is an elective course. Students who did not enroll in Trigonometry were coded as not earning credit. Fewer than 10 percent of students at Palau High School stop their math education after Applied Math or Algebra I; therefore, the study team combined these two categories. There
6 The study team was unable to locate information on the predictive validity of the Palau Achievement Test.
REL 2021–059 B-4

was little variation in highest math course completion between Palau High School graduates who enrolled in Palau Community College and those who did not (figure B1).
Figure B1. Little variation in highest math course completed in 2013 through 2015 for Palau High School graduates who enrolled in Palau Community College and those who did not
Source: Authors’ analyses of data from the Palau Ministry of Education and Palau Community College.
Palau High School career academy enrollment. A career academy variable was used to indicate the career academy in which a Palau High School student was enrolled. Career academies consist of a set of academic and vocational courses that are closely aligned to the main industries in Palau. All students in Palau High School must enroll in one of seven career academies, which focus on agriculture, health pathways, business information, automotive technology, construction technology, tourism and hospitality, and liberal arts (college preparatory). Construction and liberal arts were the most popular academies; each was selected by 23 percent of students in the 2013–15 cohorts.
Student characteristics Gender. The student’s gender is a binary indicator coded as male or female based on the data provided by Palau High School. Slightly more Palau High School graduates who enrolled in Palau Community College were female (126, or 54 percent) than male (108, or 46 percent).
Nationality and race/ethnicity. The study had access to nationality and race/ethnicity data for Palau High School graduates. However, because 4 percent or fewer students were listed with a race/ethnicity or nationality other than Palauan, these variables were not used in the study’s analyses.
College cohort. The college cohort used in this study represents the semester in which graduates from Palau High School enrolled in Palau Community College. The college cohorts were coded as fall 2013, fall 2014, or fall 2015 for Palau High School graduates in spring 2013, spring 2014, and spring 2015. Of the 234 Palau High School graduates who enrolled in Palau Community College, 96 (41 percent) were in the fall 2013 cohort, 66 (28 percent) in the fall 2014 cohort, and 72 (31 percent) in the fall 2015 cohort.
Methodology The analysis was designed to identify a set of indicators that educators at Palau High School could use to assess their students’ college readiness and intervene to increase the likelihood that all students would be prepared to succeed academically at Palau Community College and complete an associate degree or certificate within three years. The analytic strategy for the study included descriptive analyses and logistic regression analyses of the
REL 2021–059 B-5
0
20
40
60
80
100
Applied Math or Algebra I Algebra II Geometry Trigonometry
All Palau High School graduates Palau Community College enrollees Palau Community College nonenrollees
7.2
26.210.2
56.2
6.4
27.1
10.0
56.3
8.525.0
10.5
55.9

relationship between the academic preparation and student characteristic variables and the three college success outcomes.
The first step of the analysis was to compare high school academic preparation variables and the other student characteristics between Palau Community College enrollees and nonenrollees among all Palau High School graduates from spring 2013 through spring 2015. For continuous variables (for example, English language arts and math scores on the grade 12 Palau Achievement Test), the study team tested the statistical significance of the difference in means of enrollees and nonenrollees using t-tests. For categorical variables (for example, gender), statistical significance was assessed using p-values from chi-squared tests. The only statistically significant difference between Palau High School graduates who enrolled in Palau Community College and those who did not was that enrollees had higher rates of earning a grade of C or higher in English IV at Palau High School than nonenrollees. The results of this analysis are shown in table C1 in appendix C.
The second step was to examine the prevalence of each of the three outcome variables among Palau High School graduates who enrolled in Palau Community College.
The final step was to conduct logistic regression analyses to identify the high school academic preparation and student characteristic variables that were statistically significant predictors of each community college outcome. Separate logit models were run for each of the three outcomes. The generic form of the logit models is as follows:
where the outcome logit(𝑃𝑟[𝑌! = 1| 𝑍! , 𝑋!]) is the log odds of a binary outcome measure Yi of early college success for the student achieving the college success measure. For example, in the model predicting earning a grade point average in the first year of college, Y = 1 for students with a grade point average of 2.0 or higher and Y = 0 for students with a grade point average below 2.0. The binary outcome is transformed into the log of the odds ratio using the logit link function, where p is the probability that the outcome is equal to 1 for a given set of predictor variables [pi = Pr(Yi = 1|Zi,Xi)], X is the vector of the other student characteristic (gender), Z is the vector of high school academic preparation variables that correspond with coefficients 𝛽!, C is the cohort fixed effects that capture constant differences in the outcomes across the three cohorts of Palau Community College enrollees, and 𝛼 is a constant (intercept) that represents the grand mean. Categorical predictor variables in the model were coded using deviation coding (University of California Los Angeles Statistical Consulting Group, 2011) to compare each level of the predictor variable to the grand mean, which is a proxy for the general population average. With deviation coding, binary predictor variables were coded as 1 and –1. For categorical variables with three or more levels, a dummy variable was created and coded for the number of levels minus 1, as in the example in table B1. The regression beta for dummy variable 1 would indicate the results of the level 1 of the example variable compared with the grand mean, while the results for dummy variable 2 would be for level 2 compared with the grand mean.
Table B1. Example deviation coding for categorical variable with three levels
Example variable Dummy variable 1 Dummy variable 2 Level 1 1 0
Level 2 0 1
Level 3 –1 –1
Source: Authors’ creation.
REL 2021–059 B-6
logit(Pr[𝑌! = 1| 𝑍! , 𝑋!]) = log 4𝑝!
1 − 𝑝!7 = 𝛼 + 𝛽"𝐗 + 𝛽#𝐙 + 𝐂
Continuous variables were centered around their mean value to increase interpretability of the model’s intercept. Logistic regression models were calculated using the R statistical language (R Core Team, 2019) version 3.5.3.
Of interest are the magnitudes and statistical significance of the coefficients for the variables in vector Z (and, to a lesser extent, X). Coefficients are reported as odds ratios in tables C3–C5 in appendix C, along with their 95 percent confidence intervals and statistical significance (p-values). Tests for specification error and goodness of fit were conducted for all models, and their results are presented in the notes for tables C3–C5. All three logistic regression models were also tested to ensure that they met the model’s assumptions, and all predictors had variance inflation factors of less than 4, indicating low multicollinearity of the predictor variables.
Tables C6–C8 in appendix C report the predicted probabilities for the high school academic preparation variables and the student characteristic (gender and college cohort) control variables. For continuous variables these values indicate the predicted probability of achieving the outcome at different points along the range of the variable, while holding other continuous predictor variables at their mean values and while averaging across all levels of categorical variables. For categorical variables such as gender, the predicted probability shows the predicted probability for each level of the predictor, while holding continuous predictor variables at their mean values and while averaging across all levels of the other categorical variables. The predicted probabilities were calculated using the R package emmeans (Length, 2020).
References Length, R. (2020). Emmeans: Estimated Marginal Means, aka Least-Squares Means (R package version 1.4.5.009001).
https://CRAN.R-project.org/package=emmeans.
R Core Team. (2019). R: A language and environment for statistical computing. R Foundation for Statistical Computing. https://www.R-project.org/.
University of California Los Angeles (UCLA) Statistical Consulting Group. (2011). R library contrast coding systems for categorical variables. https://stats.idre.ucla.edu/r/library/r-library-contrast-coding-systems-for-categorical-variables/ #DEVIATION.
REL 2021–059 B-7

Appendix C. Supporting analyses This appendix provides supporting analyses for this study. Tables C1 and C2 report descriptive statistics for the sample. Table C1 lists means for continuous variables and percentages for categorical variables for all Palau High School graduates in the original dataset as well as for Palau High School graduates who enrolled in Palau Community College (the main sample for the study). The only statistically significant difference in the distributions for the predictor variable between Palau High School graduates who enrolled in Palau Community College and those who did not was that Palau Community College enrollees had higher rates of earning a grade of C or higher in English IV at Palau High School. In addition, 48 percent of students in the Liberal Arts Career Academy at Palau High School did not enroll in Palau Community College. Because this is a college preparatory academy, it is possible that some of those students enrolled in a college abroad. Data were not available on college enrollment outside of Palau for Palau High School graduates. Table C2 provides additional descriptive statistics for the continuous variables used in this study.
Tables C3–C5 report the results for the logistic regression models for each of the three college success outcome variables in the study. Tables C6–C8 report the predicted probabilities for the high school academic preparation and student characteristic variables from the logistic regression models. Details on how the models were calculated are in appendix B.
Slightly more than half (54 percent) of Palau High School graduates who enrolled in Palau Community College were women, and slightly less than half (46 percent) were men. About 55 percent of Palau High School graduates who enrolled in Palau Community College in 2013 through 2015 completed Trigonometry, the highest math course offered at Palau High School. Across the three cohorts of Palau High School graduates who enrolled in Palau Community College, the average high school grade point average was 3.06 and the average grade 12 Palau Achievement Test score was 42 in English language arts and 29 in math (on a scale of 0–100). The most popular career academies for Palau High School graduates who enrolled in Palau Community College were Construction Technology and Liberal Arts, at 23 percent each.
REL 2021–059 C-1

2015
Table C1. High school academic preparation variables and other student characteristics of Palau Community College enrollees and nonenrollees among all Palau High School graduates from spring 2013 through spring
Palau Community College
Variable
All Palau High School
graduates (percent)
Enrollees (percent)
Nonenrollees (percent)
Difference between
enrollees and nonenrollees (percentage
points) p valuea
All students 100.0 60.5 39.5
High school academic preparation
Grade 12 Palau Achievement Test (mean score)
English language arts 42.2 41.6 43.5 — .245
Math 29.6 29.4 29.9 — .553
English language arts course grade of C or higher (mean percentage of points earned)
English I 85.3 86.3 83.7 2.6 .564
English Reading and Writing 83.2 84.6 81.0 3.6 .436
English II 78.4 79.5 76.8 2.7 .621
English III 91.0 92.7 88.2 4.5 .184
English IV 86.0 91.5 77.6 13.9 <.001*
Math course grade of C or higher (mean percentage of points earned)
Algebra I 84.0 84.6 83.0 1.6 .779
Algebra II 79.8 79.9 79.7 0.2 .999
Geometry 80.6 80.8 80.4 0.4 .999
Trigonometry 55.0 55.1 54.9 0.2 .999
High school grade point average (mean)
High school grade point average 3.04 3.06 3.00 — .366
Career academy (percent of total enrollment)
Natural Resources–Agriculture 4.9 4.3 5.9 1.6 .634
Health & Human Services–Health 4.4 4.3 4.6 0.3 .999 Pathway
Business Information 12.4 12.4 12.4 0.0 .999
Industrial Engineering–Automotive 14.2 15.4 12.4 3.0 .504 Technology
Health & Human Services–Tourism & 15.8 18.4 11.8 6.6 .109 Hospitality
Industrial Engineering–Construction 22.0 22.6 20.9 1.7 .782 Technology
Liberal Arts 26.4 22.6 32.0 9.4 .054
REL 2021–059 C-2
-

-
Palau Community College
Variable
All Palau High School
graduates (percent)
Enrollees (percent)
Nonenrollees (percent)
Difference between
enrollees and nonenrollees (percentage
points) p valuea
Student characteristic
Gender
Female 55.0 53.8 56.9 3.1 .436
Male 45.0 46.2 43.1 3.1 .436
Palau High School graduation cohort
Spring 2013 38.0 41.0 33.3 7.7 .156
Spring 2014 31.5 28.2 36.6 8.4 .104
Spring 2015 30.5 30.8 30.1 0.7 .973
Total number of students 387 234 153 na na
*Significant at p < .05. — is not applicable for continuous variables; na is not applicable. a. Indicates whether the difference in academic performance and student characteristic variables between Palau Community College enrollees and nonenrollees is statistically significant. Statistical significance was measured by t-tests for continuous variables and chi-squared tests for categorical variables.Note: Percentages may not sum to 100 because of rounding.Source: Authors’ analyses of data from the Palau Ministry of Education and Palau Community College.
Table C2. Descriptive statistics for continuous variables for Palau High School graduates in spring 2013 through spring 2014 who enrolled in Palau Community College in the fall after graduation
Continuous variable Mean Median Standard deviation Minimum Maximum
English language arts score on the grade 12 Palau Achievement Test
41.6 39.1 15.17 14.1 90.2
Math score on the grade 12 Palau Achievement Test 29.4 27.9 7.47 8.8 55.9
High school grade point average 3.06 3.1 0.56 1.6 4.0 Note: n = 234. Source: Authors’ analyses of data from the Palau Ministry of Education and Palau Community College.
REL 2021–059 C-3
-
REL 2021–059 C-3

Table C3. Results of logistic regression model predicting earning a grade point average of 2.0 or higher in the first year of college for Palau High School graduates in spring 2013 through spring 2014 who enrolled in Palau Community College in the fall after graduation
Variable Odds ratio
95 percent confidence
interval p value
High school academic preparation
Grade 12 Palau Achievement Test (mean centered)
English language arts 1.01 0.98–1.03 .509
Math 1.05 1.00–1.11 .037*
English language arts course grade of C or higher
English I 1.02 0.62–1.65 .947
English Reading and Writing 0.92 0.59–1.44 .713
English II 1.30 0.86–1.97 .214
English III 0.78 0.43–1.46 .423
English IV 1.50 0.85–2.79 .176
Math course grade of C or higher
Algebra I 1.08 0.66–1.77 .765
Algebra II 0.83 0.51–1.32 .432
Geometry 1.17 0.76–1.83 .475
Trigonometry 1.22 0.81–1.82 .332
High school grade point average (mean centered)
High school grade point average 3.34 1.33–8.83 .012*
Career academy
Natural Resources–Agriculture 1.20 0.31–4.86 .794
Health & Human Services–Health Pathway 2.66 0.53–34.75 .314
Business Information 0.76 0.31–1.88 .540
Industrial Engineering–Automotive Technology 1.16 0.50–2.66 .729
Industrial Engineering–Construction Technology 0.84 0.40–1.72 .630
Health & Human Services–Tourism & Hospitality 0.67 0.31–1.40 .287
Liberal Arts 0.64 0.30–1.32 .233
Student characteristic
Gender
Female 0.85
Male 1.18
College cohort
Fall 2013 0.72
Fall 2014 1.70
Fall 2015 0.81
Constant (grand mean) 1.62 *Significant at p < .05. Note: n = 234. Results are based on logistic regression analysis. Tjur’s R2 = .230. Source: Authors’ analyses of data from the Palau Ministry of Education and Palau Community College.
0.58–1.22
0.82–1.73
0.46–1.14
1.04–2.83
0.51–1.31
0.60–4.33
.372
.372
.166
.038*
.398
.336*
REL 2021–059 C-4
-
-
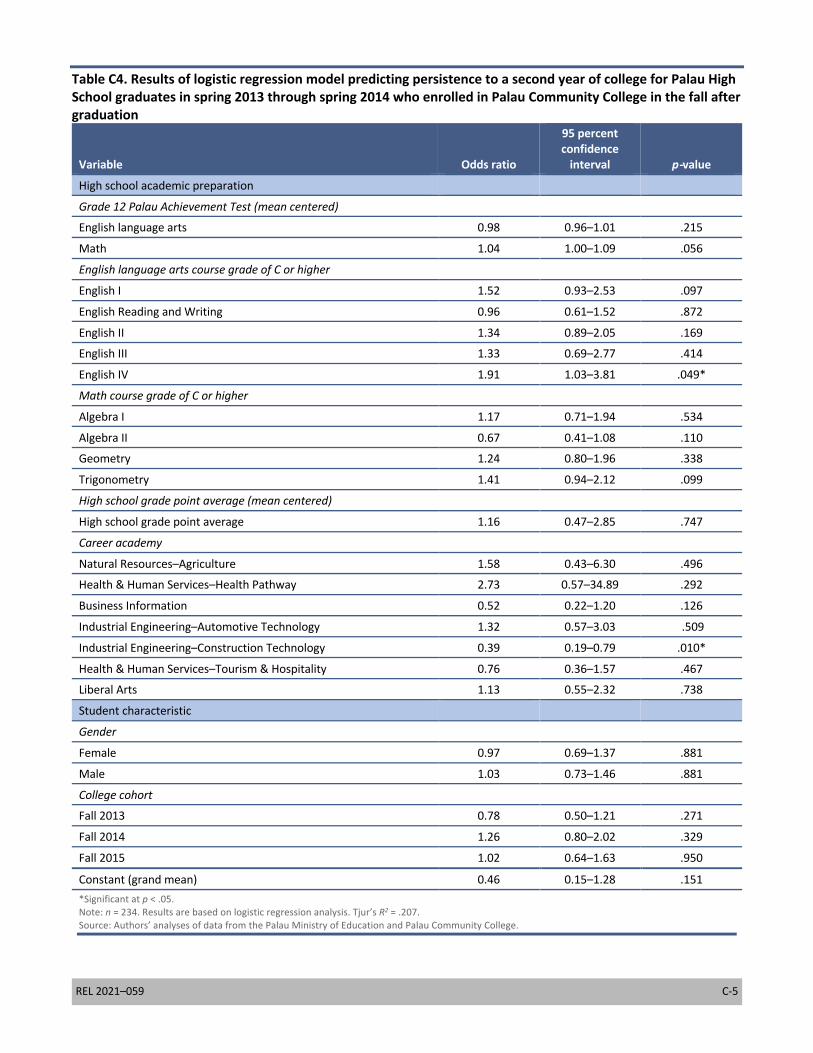
Table C4. Results of logistic regression model predicting persistence to a second year of college for Palau High School graduates in spring 2013 through spring 2014 who enrolled in Palau Community College in the fall after graduation
Variable Odds ratio
95 percent confidence
interval p value
High school academic preparation
Grade 12 Palau Achievement Test (mean centered)
English language arts 0.98 0.96–1.01 .215
Math 1.04 1.00–1.09 .056
English language arts course grade of C or higher
English I 1.52 0.93–2.53 .097
English Reading and Writing 0.96 0.61–1.52 .872
English II 1.34 0.89–2.05 .169
English III 1.33 0.69–2.77 .414
English IV 1.91 1.03–3.81 .049*
Math course grade of C or higher
Algebra I 1.17 0.71–1.94 .534
Algebra II 0.67 0.41–1.08 .110
Geometry 1.24 0.80–1.96 .338
Trigonometry 1.41 0.94–2.12 .099
High school grade point average (mean centered)
High school grade point average 1.16 0.47–2.85 .747
Career academy
Natural Resources–Agriculture 1.58 0.43–6.30 .496
Health & Human Services–Health Pathway 2.73 0.57–34.89 .292
Business Information 0.52 0.22–1.20 .126
Industrial Engineering–Automotive Technology 1.32 0.57–3.03 .509
Industrial Engineering–Construction Technology 0.39 0.19–0.79 .010*
Health & Human Services–Tourism & Hospitality 0.76 0.36–1.57 .467
Liberal Arts 1.13 0.55–2.32 .738
Student characteristic
Gender
Female 0.97
Male 1.03
College cohort
Fall 2013 0.78
Fall 2014 1.26
Fall 2015 1.02
Constant (grand mean) 0.46 *Significant at p < .05. Note: n = 234. Results are based on logistic regression analysis. Tjur’s R2 = .207. Source: Authors’ analyses of data from the Palau Ministry of Education and Palau Community College.
0.69–1.37
0.73–1.46
0.50–1.21
0.80–2.02
0.64–1.63
0.15–1.28
.881
.881
.271
.329
.950
.151
REL 2021–059 C-5
-

-
Table C5. Results of logistic regression model predicting completion of an associate degree or certificate within three years for Palau High School graduates in spring 2013 through spring 2014 who enrolled in Palau Community College in the fall after graduation
Variable Odds ratio
95 percent confidence
interval p value
High school academic preparation
Grade 12 Palau Achievement Test (mean centered)
English language arts 0.98 0.95–1.01 .205
Math 1.04 0.98–1.09 .167
English language arts course grade of C or higher
English I 3.45 1.31–16.14 .037*
English Reading and Writing 0.61 0.32–1.19 .130
English II grade 0.91 0.46–1.86 .781
English III grade 0.44 0.17–1.34 .113
English IV grade 1.31 0.57–3.71 .551
Math course grade of C or higher
Algebra I 0.80 0.39–1.74 .555
Algebra II 0.99 0.47–2.24 .982
Geometry 2.01 0.89–5.79 .132
Trigonometry 1.01 0.58–1.78 .972
High school grade point average (mean centered)
High school grade point average 5.27 1.47–21.41 .015*
Career academy
Natural Resources–Agriculture 3.72 0.79–16.50 .081
Health & Human Services–Health Pathway 1.31 0.30–4.97 .699
Business Information 1.28 0.51–3.07 .588
Industrial Engineering–Automotive Technology 0.98 0.36–2.56 .971
Industrial Engineering–Construction Technology 0.22 0.06–0.61 .008*
Health & Human Services–Tourism & Hospitality 1.01 0.43–2.27 .979
Liberal Arts 0.73 0.31–1.63 .458
Student characteristic
Gender
Female 0.73
Male 1.38
College cohort
Fall 2013 1.00
Fall 2014 1.27
Fall 2015 0.79
Constant (grand mean) 0.14 *Significant at p < .05. Note: n = 234. Results are based on logistic regression analysis. Tjur’s R2 = .185. Source: Authors’ analyses of data from the Palau Ministry of Education and Palau Community College.
0.46–1.13
0.89–2.16
0.56–1.76
0.71–2.25
0.43–1.40
0.02–0.58
.157
.157
.993
.406
.423
.015*
REL 2021–059 C-6
-

Table C6. Predicted probabilities of achieving each college success outcome by student characteristics for Palau High School graduates in spring 2013–spring 2014 who enrolled in Palau Community College in the fall after graduation
Student characteristic
Grade point average of 2.0 or higher in the
first year of college Persistence to
second year of college
Completion of an associate degree or
certificate within three years
Gender
Male .657 .323 .161
Female .577 .311 .092
College cohort
Fall 2013 .539 .266 .122
Fall 2014 .733 .3691 .150
Fall 2015 .569 .320 .099 Note: n = 234. See appendix B for a description of how the predicted probabilities were calculated. Source: Authors’ analyses of data from the Palau Ministry of Education and Palau Community College.
Table C7. Predicted probabilities of achieving each college success outcome by high school academic preparation variable for Palau High School graduates in spring 2013–spring 2014 who enrolled in Palau Community College in the fall after graduation
Variable
Grade point average of 2.0 or higher in the
first year of college Persistence to
second year of college
Completion of an associate degree or
certificate within three years
English language arts score on the grade 12 Palau Achievement Test
0
5
10
15
20
25
30
35
40
45
50
55
60
65
70
75
80
85
90
95
.531
.542
.552
.563
.573
.584
.594
.604
.615
.625
.635
.644
.654
.664
.673
.682
.692
.701
.709
.718
.467
.448
.430
.411
.393
.375
.357
.339
.323
.306
.290
.275
.260
.245
.231
.218
.205
.193
.182
.170
.244
.226
.209
.193
.177
.163
.150
.137
.126
.115
.105
.096
.087
.080
.072
.066
.060
.054
.049
.045
REL 2021–059 C-7

Variable
Grade point average of 2.0 or higher in the
first year of college Persistence to
second year of college
Completion of an associate degree or
certificate within three years
100 .727 .160 .041
Math score on the grade 12 Palau Achievement Test
0 .264 .114 .046
5 .316 .1381 .054
10 .374 .166 .064
15 .436 .198 .076
20 .499 .235 .090
25 .563 .277 .106
30 .625 .323 .124
35 .683 .372 .145
40 .735 .424 .169
45 .782 .478 .196
50 .823 .533 .226
55 .857 .587 .260
60 .886 .639 .296
65 .909 .687 .335
70 .928 .732 .376
75 .943 .773 .420
80 .956 .809 .464
85 .965 .841 .510
90 .973 .868 .555
95 .979 .891 .599
100 .984 .910 .641
English language arts course grade
English I C or higher .622 .414 .324
English I lower than C .614 .234 .039
English Reading and Writing C or higher .598 .309 .078
English Reading and Writing lower than C .637 .325 .186
English II C or higher .677 .384 .112
English II lower than C .554 .257 .133
English III C or higher .558 .381 .058
English III lower than C .675 .259 .238
English IV C or higher .708 .470 .154
English IV lower than C .518 .195 .096
REL 2021–059 C-8

Variable
Grade point average of 2.0 or higher in the
first year of college Persistence to
second year of college
Completion of an associate degree or
certificate within three years
Math course grade
Algebra I C or higher .635 .352 .100
Algebra I lower than C .600 .284 .148
Algebra II C or higher .572 .239 .121
Algebra II lower than C .661 .408 .123
Geometry C or higher .655 .366 .218
Geometry lower than C .580 .272 .064
Trigonometry C or higher .663 .395 .123
Trigonometry lower than C .570 .248 .121
English language arts course grade
English I C or higher .622 .414 .324
English I lower than C .614 .234 .039
English Reading and Writing C or higher .598 .309 .078
English Reading and Writing lower than C .637 .325 .186
English II C or higher .677 .384 .112
English II lower than C .554 .257 .133
English III C or higher .558 .381 .058
English III lower than C .675 .259 .238
English IV C or higher .708 .470 .154
English IV lower than C .518 .195 .096
High school grade point average
1.3 .162 .264 .007
1.7 .238 .275 .014
2.0 .310 .284 .023
2.3 .392 .293 .038
2.7 .511 .306 .071
3.0 .600 .315 .111
3.3 .683 .325 .171
3.7 .777 .338 .286
4.0 .834 .348 .398 Note: n = 234. See appendix B for a description of how the predicted probabilities were calculated. Source: Authors’ analyses of data from the Palau Ministry of Education and Palau Community College.
REL 2021–059 C-9

Table C8. Predicted probabilities of achieving each college success outcome by Palau High School Career Academy for Palau High School graduates in spring 2013–spring 2014 who enrolled in Palau Community College in the fall after graduation
Variable
Grade point average of 2.0 or higher in
the first year of college
Persistence to second year of
college
Completion of an associate degree or
certificate within three years
Career academy
Natural Resources–Agriculture .659 .423 .341
Health & Human Services–Health Pathway .811 .559 .154
Business Information .550 .194 .151
Industrial Engineering–Automotive Technology .652 .380 .120
Industrial Engineering–Construction Technology .575 .154 .030
Health & Human Services–Tourism & Hospitality .520 .262 .123
Liberal Arts .509 .344 .092 Note: n = 234. See appendix B for a description of how the predicted probabilities were calculated. Source: Authors’ analyses of data from the Palau Ministry of Education and Palau Community College.
REL 2021–059 C-10

-
Appendix D. Other analyses This appendix provides information about differences in high school academic preparation and gender across the Palau Community College cohorts in this study. This analysis was conducted because college cohort was identified as a significant predictor of earning a grade point average of 2.0 or higher in the first year at Palau Community College (see table C3 in appendix C). Table D1 lists differences in high school academic preparation and student characteristic (gender) variables across cohorts. Table D2 provides percentage for each college cohort for significant categorical variables shown in table D1. Table D3 and figure D1 give summary statistics for continuous variables by college cohort.
The college cohorts vary by the percentage of students who passed Algebra II, with significantly fewer students passing it in the 2014 cohort. In the 2013 cohort no students enrolled in the Health & Human Services–Health Pathway Career Academy. The 2014 cohort had significantly fewer students enrolled in the Business Information Career Academy than the other two cohorts. The 2015 college cohort had significantly lower grade 12 Palau Achievement Test scores for English language arts than the other two cohorts.
Table D1. High school academic preparation and student characteristics variables for Palau High School graduates in spring 2013–spring 2014 who enrolled in Palau Community College in the fall after graduation
Variable Statistica, b, c Degrees of freedom p valued
Academic preparation
Grade 12 Palau Achievement Test score
English language arts
Math
English language arts course grade of C or higher
English I
English Reading and Writing
English II
English III
English IV
Math course grade of C or higher
Algebra I
Algebra II
Geometry
Trigonometry
High school grade point average
High school grade point average
Career academy
Natural Resources–Agriculture
Health & Human Services–Health Pathway
Business Information
Industrial Engineering–Automotive Technology
Health & Human Services–Tourism & Hospitality
Industrial Engineering–Construction Technology
Liberal Arts
15.96c
0.207c
1.619a
0.141a
0.471 b
0.956a
0.861a
6.029a
0.839a
1.658a
0.731c
b
b
7.042a
15.4a
0.655a
4.876a
0.790a
2
2
2
2
2
-
2
2
2
2
2
2
-
-
2
2
2
2
2
<.001*
.813
.445
.932
.790
.566
.620
.6501
.0491*
.6575
.4364
.482
.365
.0079*
.0296*
.504
.721
.0873
.674
REL 2021–059 D-1
-

-
Variable Statistica, b, c Degrees of freedom p valued
Student characteristic
Gender 0.980a 2 .613
Note: n = 234. a. Chi-squared test using the χ2 was used to calculate statistical significance. b. Fisher Exact Test for Count Data was used to calculate statistical significance. c. Analysis of variance using the F-statistic was used to calculate statistical significance. d. Indicates whether the difference in academic performance and student characteristic variables between Palau High School cohorts for Palau Community College enrollees is statistically significant.Source: Authors’ analyses of data from the Palau Ministry of Education and Palau Community College.
Table D2. Percentage of students in each college cohort for high school academic preparation variables that vary significantly by cohort for Palau High School graduates in spring 2013–spring 2014 who enrolled in Palau Community College in the fall after graduation
Variable 2013 2014 2015
Math course grade of C or higher
Algebra II 83.3 69.7 84.7
Career academy
Health & Human Services–Health Pathway 0.0 a a
Business Information 12.5 a 19.4
Number of observations 96 66 72
Note: n = 234. Percentages may not sum to 100 because of rounding. Variable differences by cohort are given in table D1. a. Cells with 10 students or fewer were suppressed to protect confidentiality. Source: Authors’ analyses of data from the Palau Ministry of Education and Palau Community College.
Table D3. Descriptive statistics for Grade 12 Palau Achievement Test Score for English language arts for Palau High School graduates in spring 2013–spring 2014 who enrolled in Palau Community College in the fall after graduation
Palau High School cohort Mean Median Standard deviation Minimum Maximum
2013 47.1 45.0 16.3 20.3 90.2
2014 41.4 41.6 13.9 14.1 79.7
2015 34.6 31.3 11.4 18.3 73.4
Note: n = 234. Source: Authors’ analyses of data from the Palau Ministry of Education and Palau Community College.
REL 2021–059 D-2
-

Figure D1. Boxplots of grade 12 Palau Achievement Test Scores for English language arts for Palau High School graduates in spring 2013–spring 2014 who enrolled in Palau Community College in the fall after graduation
Note: n = 234. The lower horizontal end of the box marks the 25th percentile, the middle marks the median, and the top line marks the 75th percentile; thus the box indicates the middle 50 percent of the data’s values (the interquartile range). The top lines extending from the box indicate the 75th percentile plus 1.5 times the interquartile range, and the bottom lines indicate the 25th percentile minus 1.5 times the interquartile range. Values outside these ranges areshown with dots.Source: Authors’ analyses of data from the Palau Ministry of Education and Palau Community College.
REL 2021–059 D-3